

Morphological description and population structure of an ophiuroid species from cobalt-rich crust seamounts in the Northwest Pacific: Implications for marine protection under deep-sea mining
-
Abstract: Many seamounts are covered with cobalt-rich ferromanganese crusts, and are increasingly attracting interest for the potential extraction of valuable mineral resources from deep seabed environments. However, the impacts of potential mining activities on the vulnerable seamount ecosystem remain unclear. To enhance the understanding of connectivity in benthic invertebrate populations in the Northwest Pacific, several seamounts were surveyed and biological samples collected. In the present study, the ophiuroid species Ophioplinthaca defensor is reported for the first time from four deep seamounts in the Northwest Pacific, and described, providing more detailed morphological diagnosis characters. To assess the population structure of the species between and within seamounts, two mitochondrial markers (COI and 16S) were sequenced. In total, 20 haplotypes from 32 COI sequences and 8 haplotypes from 37 16S sequences were recovered. The star-shaped TCS networks and non-significant pairwise population differences reveal the absence of distinct population structures between and within seamounts. In addition, the O. defensor population seemed to have undergone a demographic expansion in history. This is the first study on the genetic population structure of a benthic invertebrate from seamounts in the Northwest Pacific, and this results suggest a potentially high, long distance dispersal capacity in O. defensor between seamounts, which could inform the development of the Regional Environmental Management Plans for the cobalt-rich crust seamounts in the area.
-
Key words:
- Ophiuroidea /
- connectivity /
- deep-sea /
- cobalt-rich crust seamount /
- Northwest Pacific
-
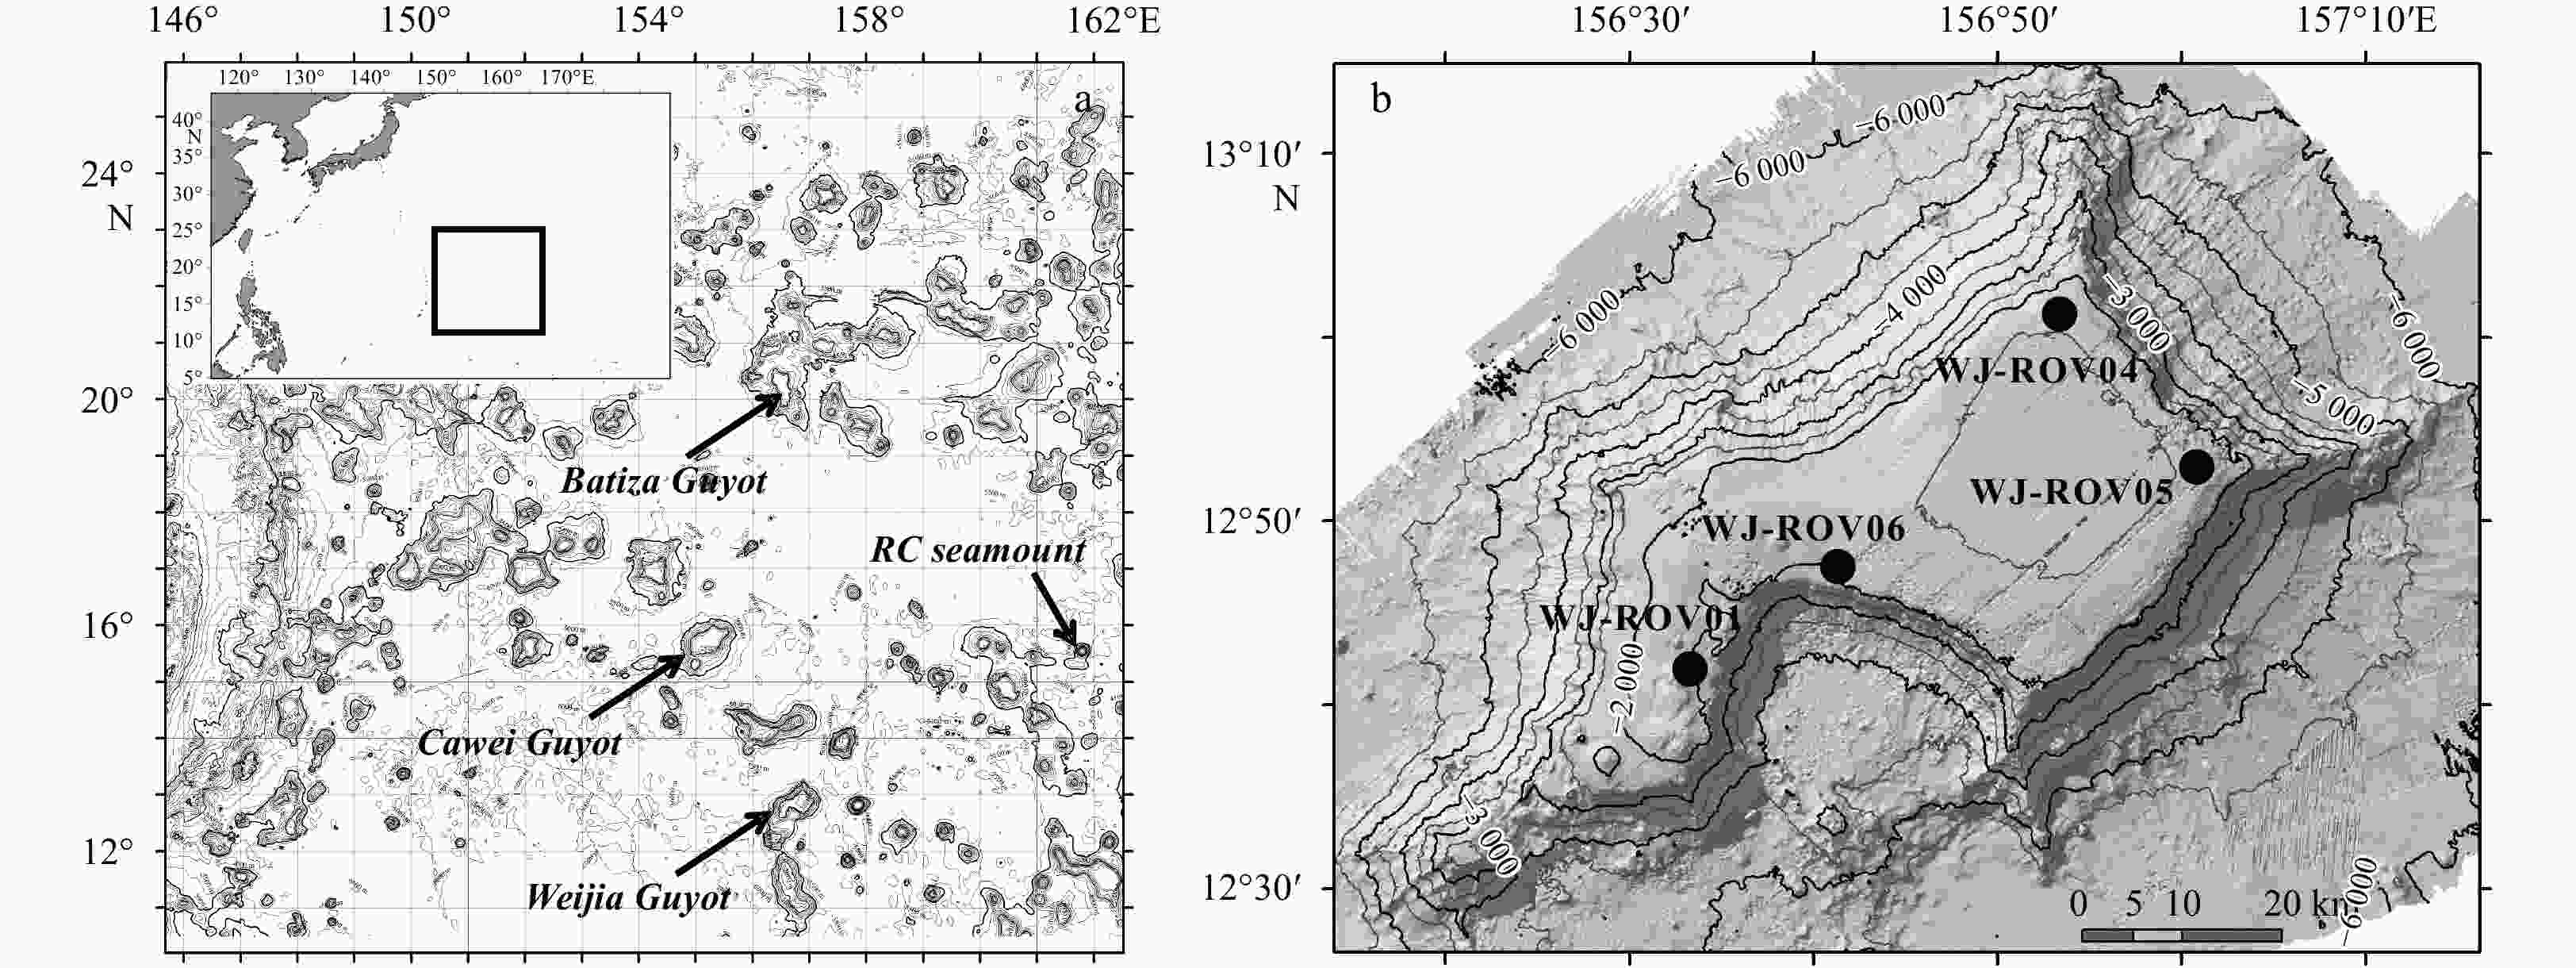
Figure 1. Map of the study seamounts in the Northwest Pacific (a) and sampling sites in the Weijia Guyot (b).

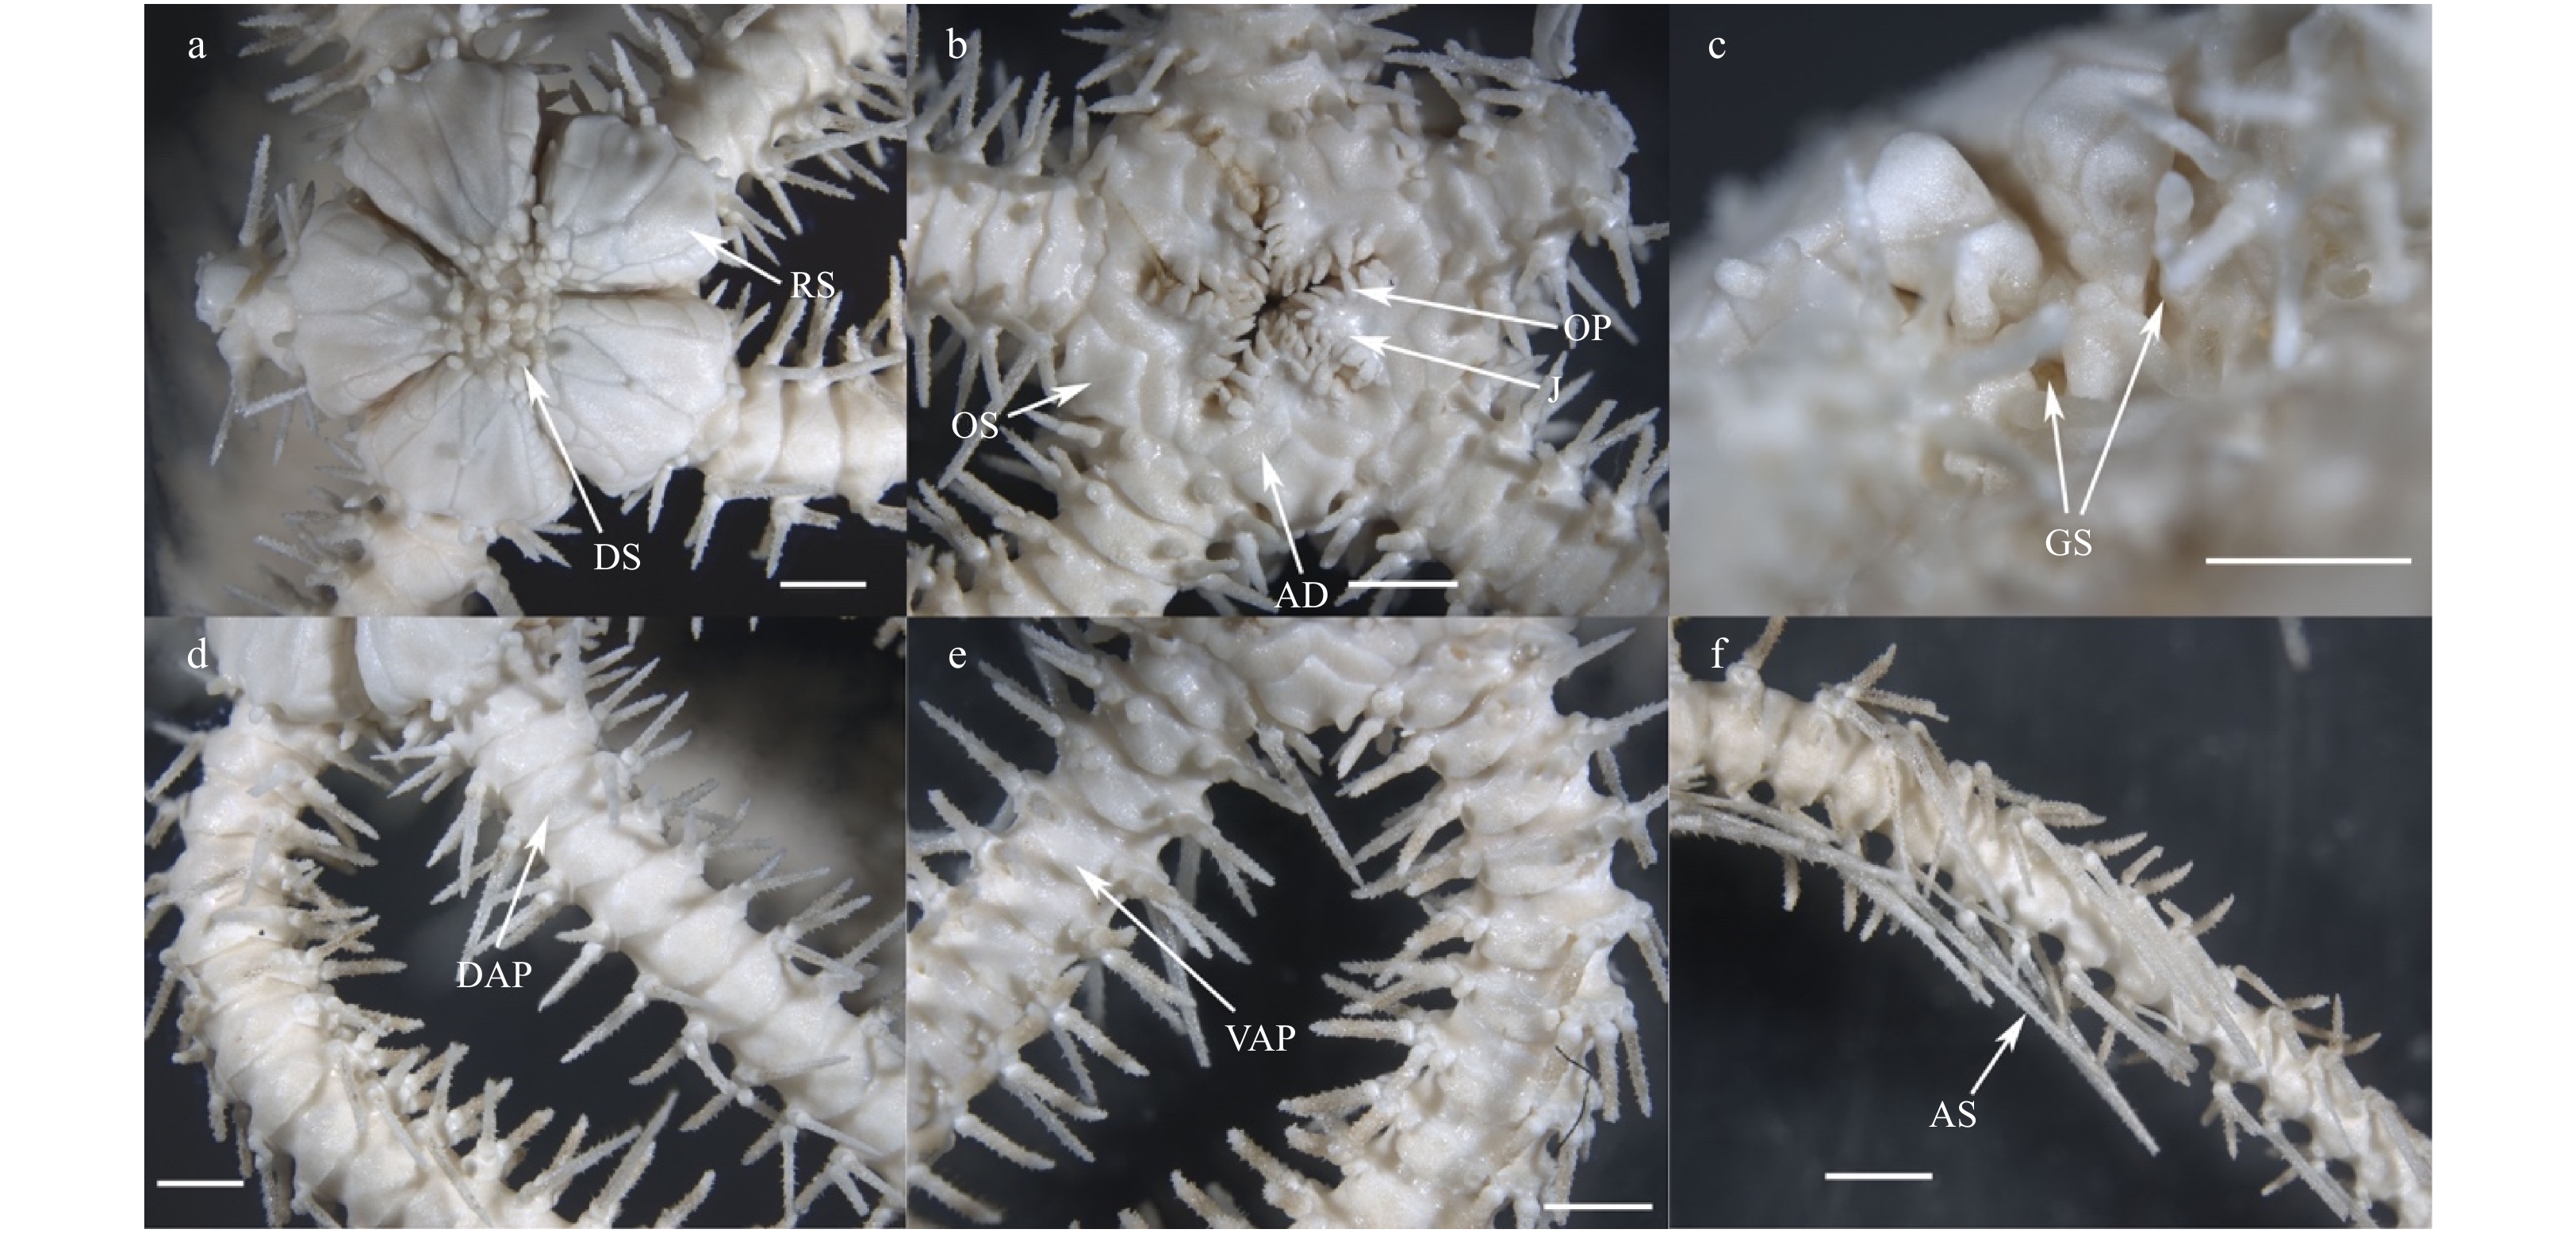
Figure 2. Morphological characters of Ophioplinthaca defensor (RSIO410602). a. Dorsal view; b. ventral view of disc; c. the interradial characters of ventral side; d. dorsal view of arms, proximal part; e. ventral view of arm, proximal part; f. dorsal view of arms, distal part. AD: adoral shield; AS: arm spines; DAP: dorsal arm plate; DS: disc spines; GS: genital slits; J: jaw; OP: oral papillae; OS: oral shield; RS: radial shield; VAP: ventral arm plate. Scale bars: 2 mm.

Figure 3. Scanning electron microscope photographs of arm skeletal characters and disc spines of Ophioplinthaca defensor. a–f. Arm skeletal characters from adult paratype (RSIO410602): proximal view of vertebrae; distal view of vertebrae; lateral view of vertebrae; ventral view of vertebrae; dorsal view of vertebrae; external view of lateral arm plate. g–i. Different types of disc spines, large cylindrical granules from adult paratype RSIO410602; conical or round granules from adult paratype RSIO410617; disc spines cylindrical with flaring thorny apex from juvenile paratype RSIO410502. mo: muscle opening; no: nerve opening. Arrows: d. dorsal side; v. ventral side; dist. distal side; prox. proximal side. Scale bars: 200 μm.
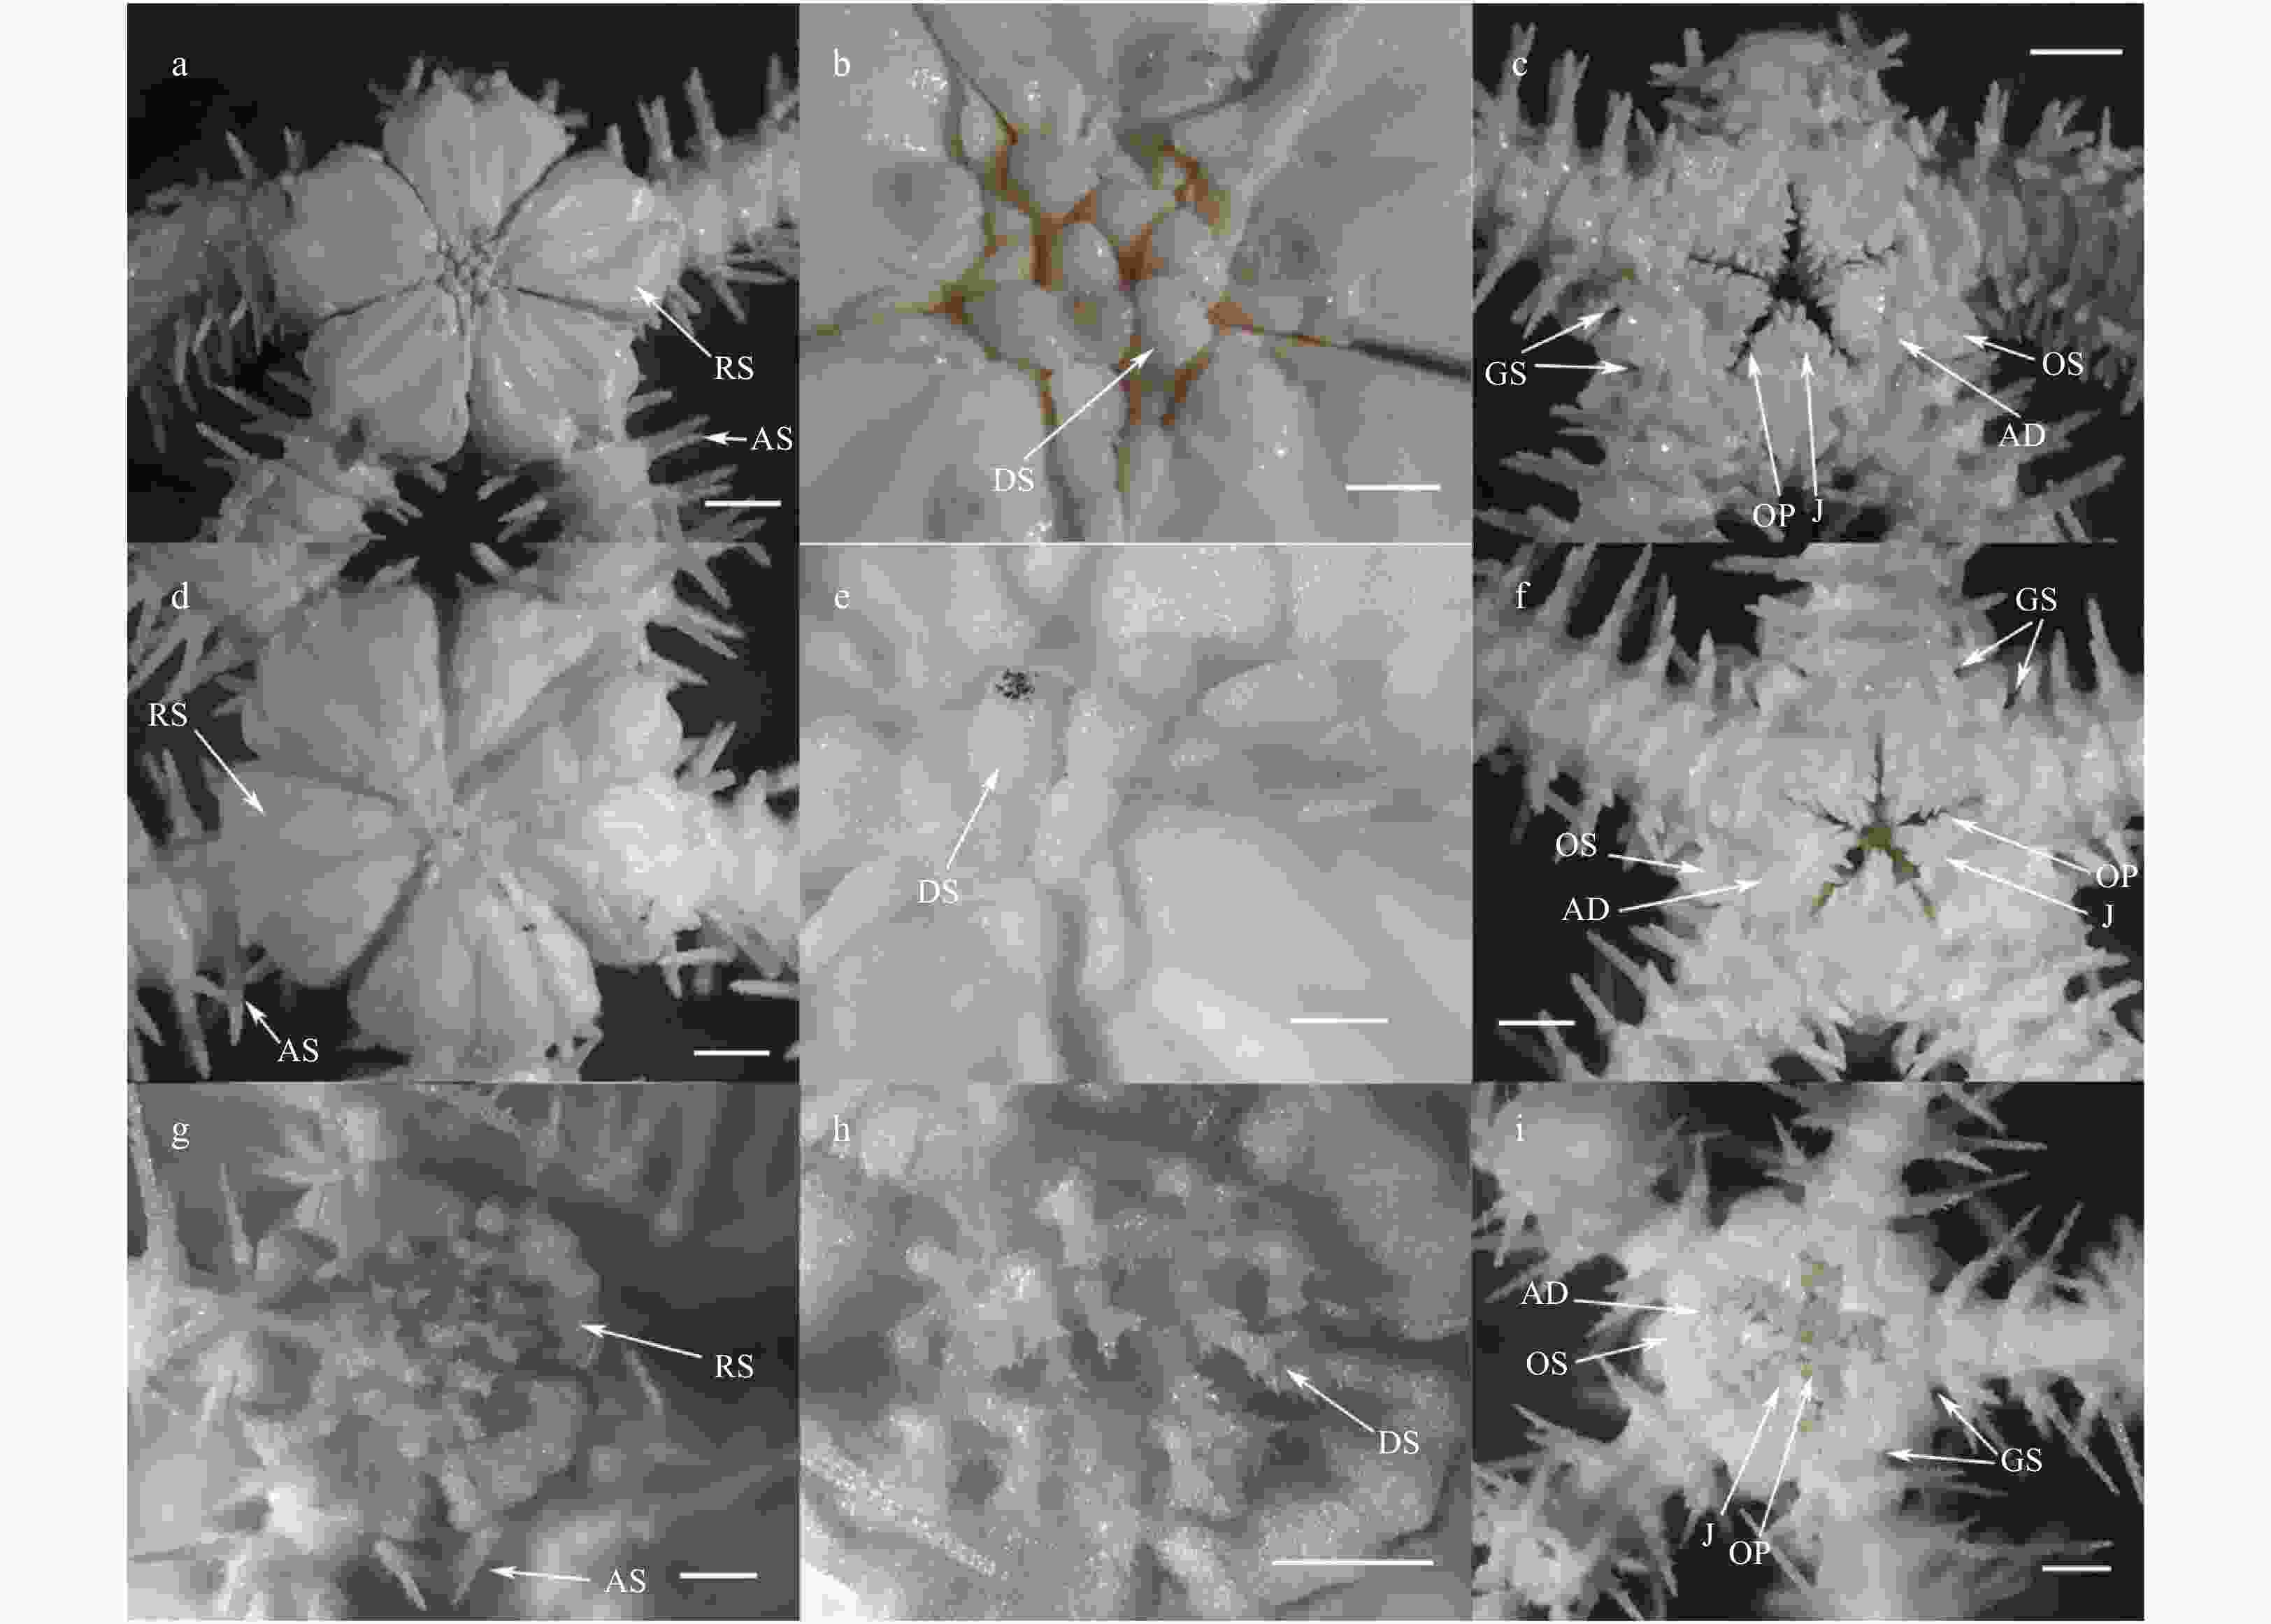
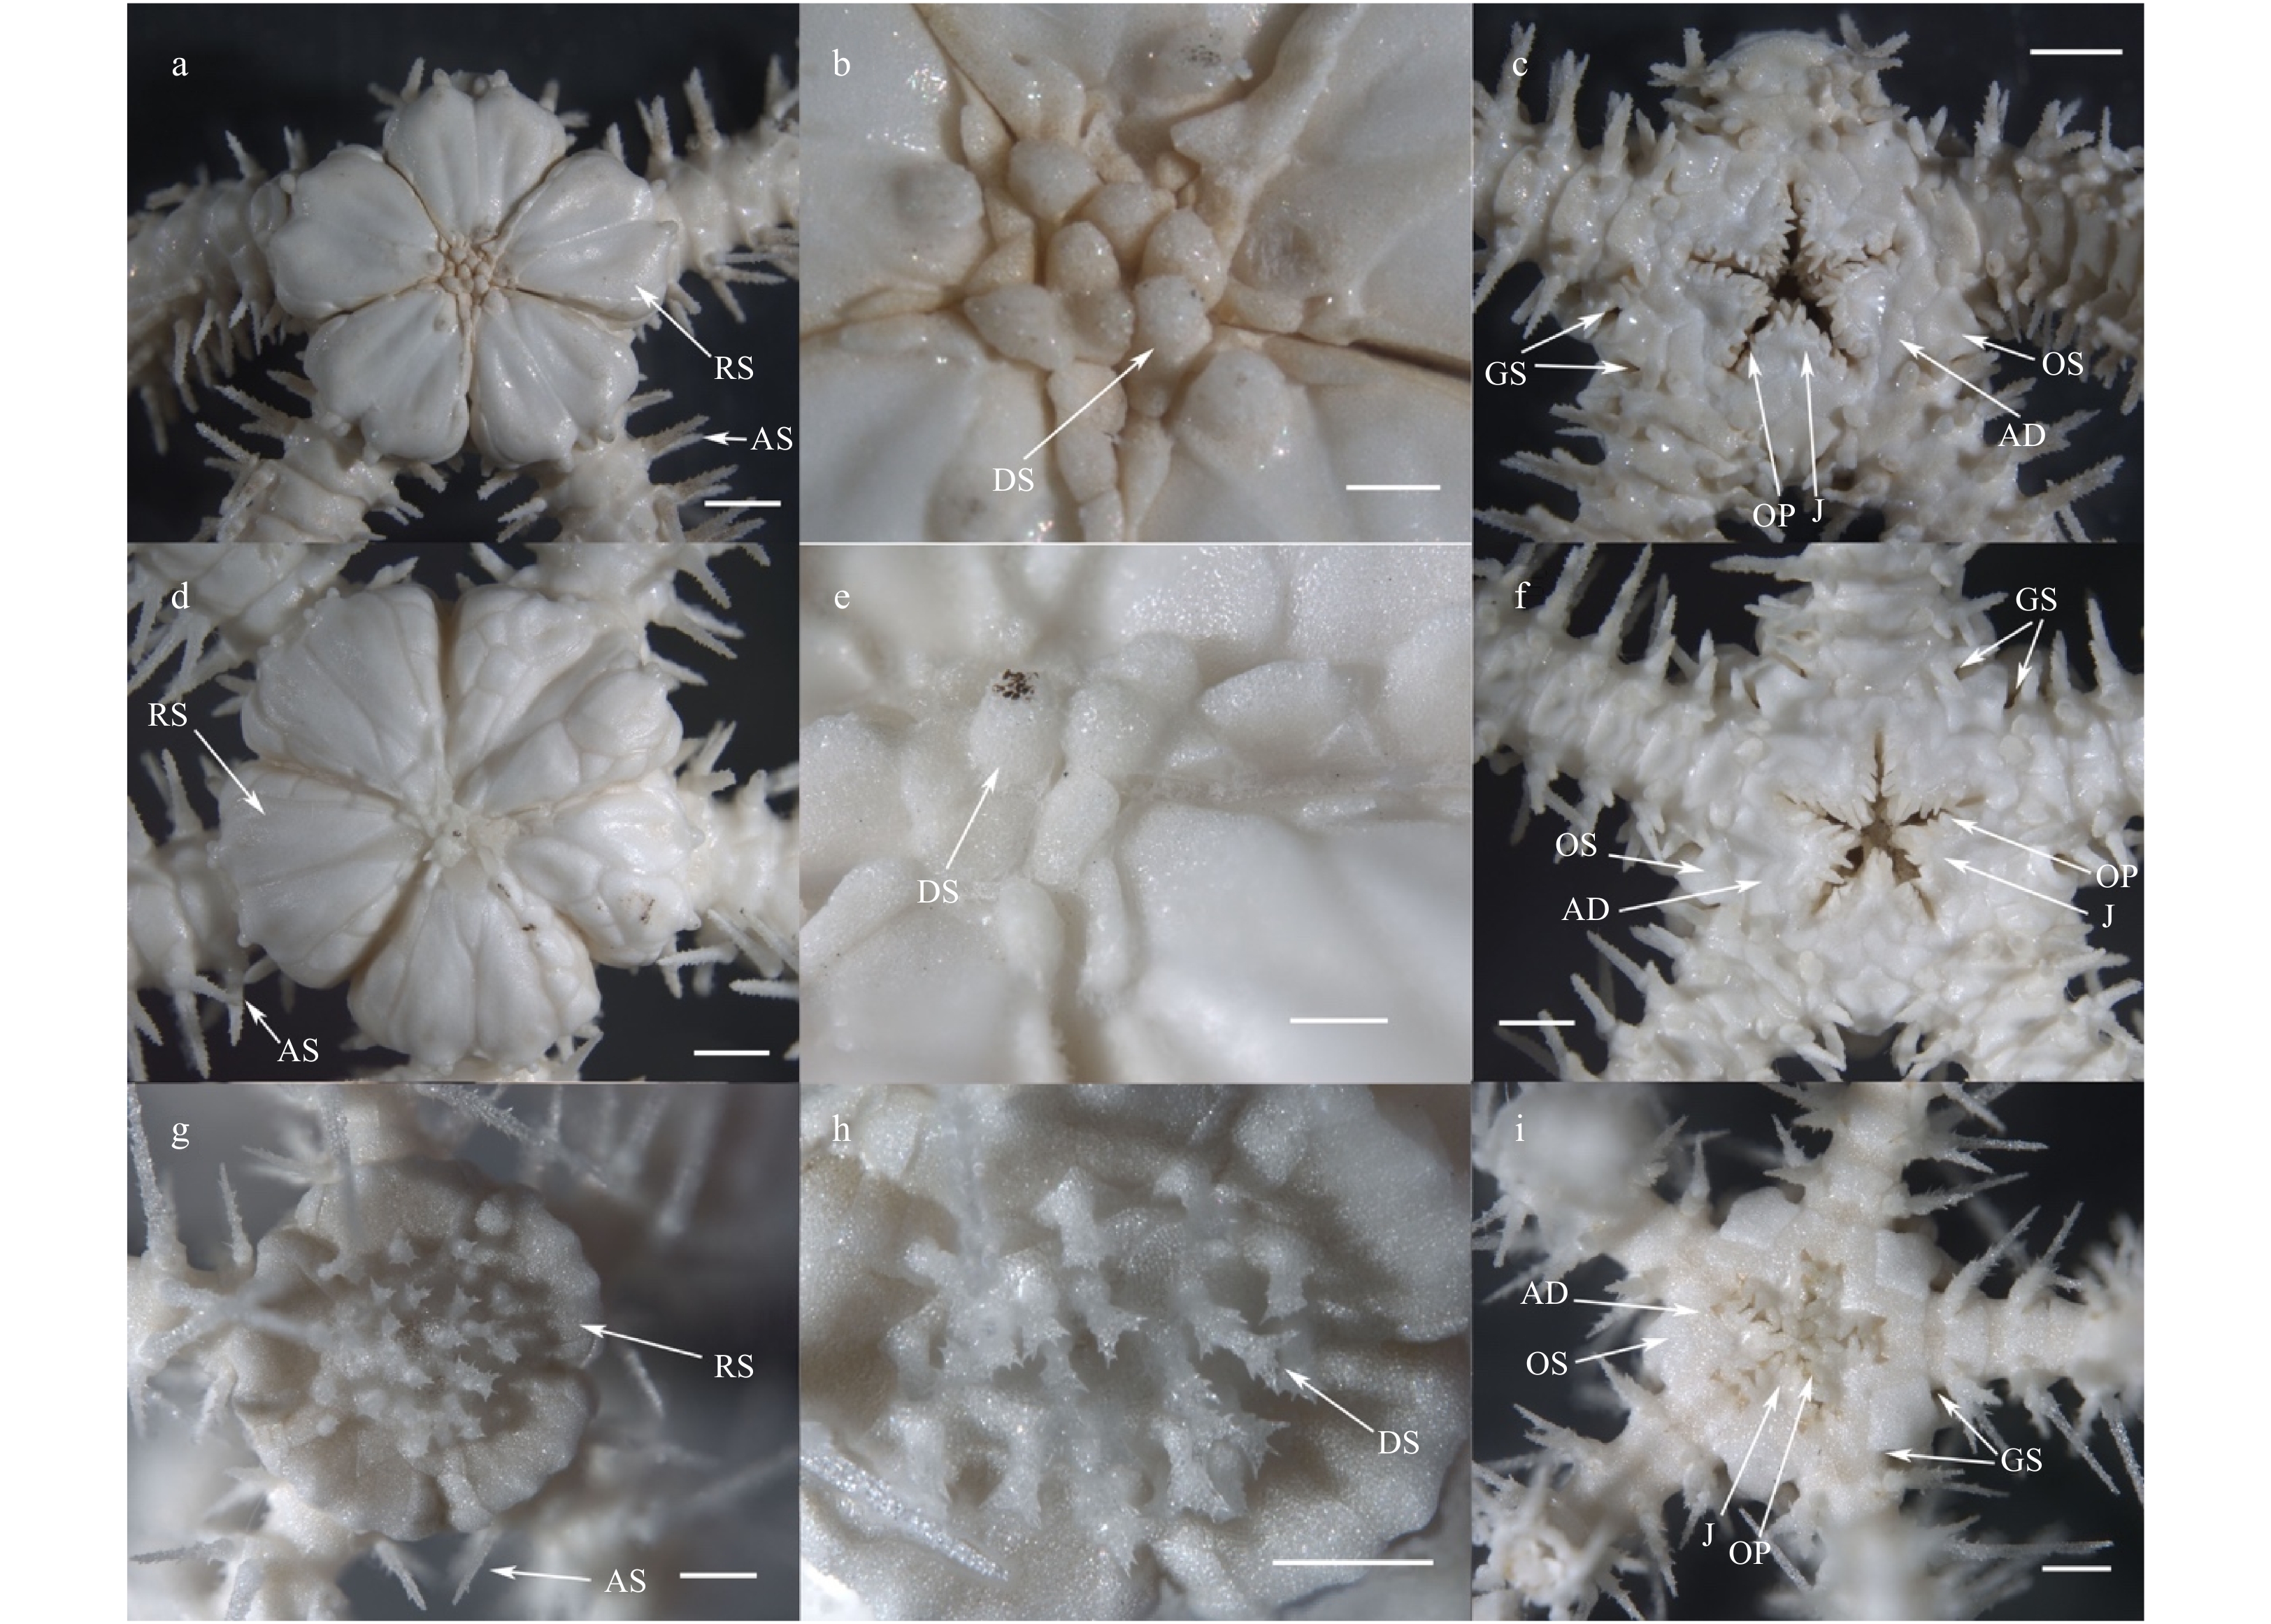
Figure 4. Variation in morphological characters of Ophioplinthaca defensor. a–c. Adult (RSIO410617) from the Weiija Guyot: dorsal view of disc; disc granules; ventral view of disc. d–f. Adult (RSIO358101) from the Caiwei Guyot: dorsal view of disc; disc granules; ventral view of disc. g–i. Juvenile (RSIO410502) from the Weijia Guyot: dorsal view of disc; disc granules; ventral view of disc. Scale bars: 2 mm (a, c, d, f), 500 μm (b, e, g–i).
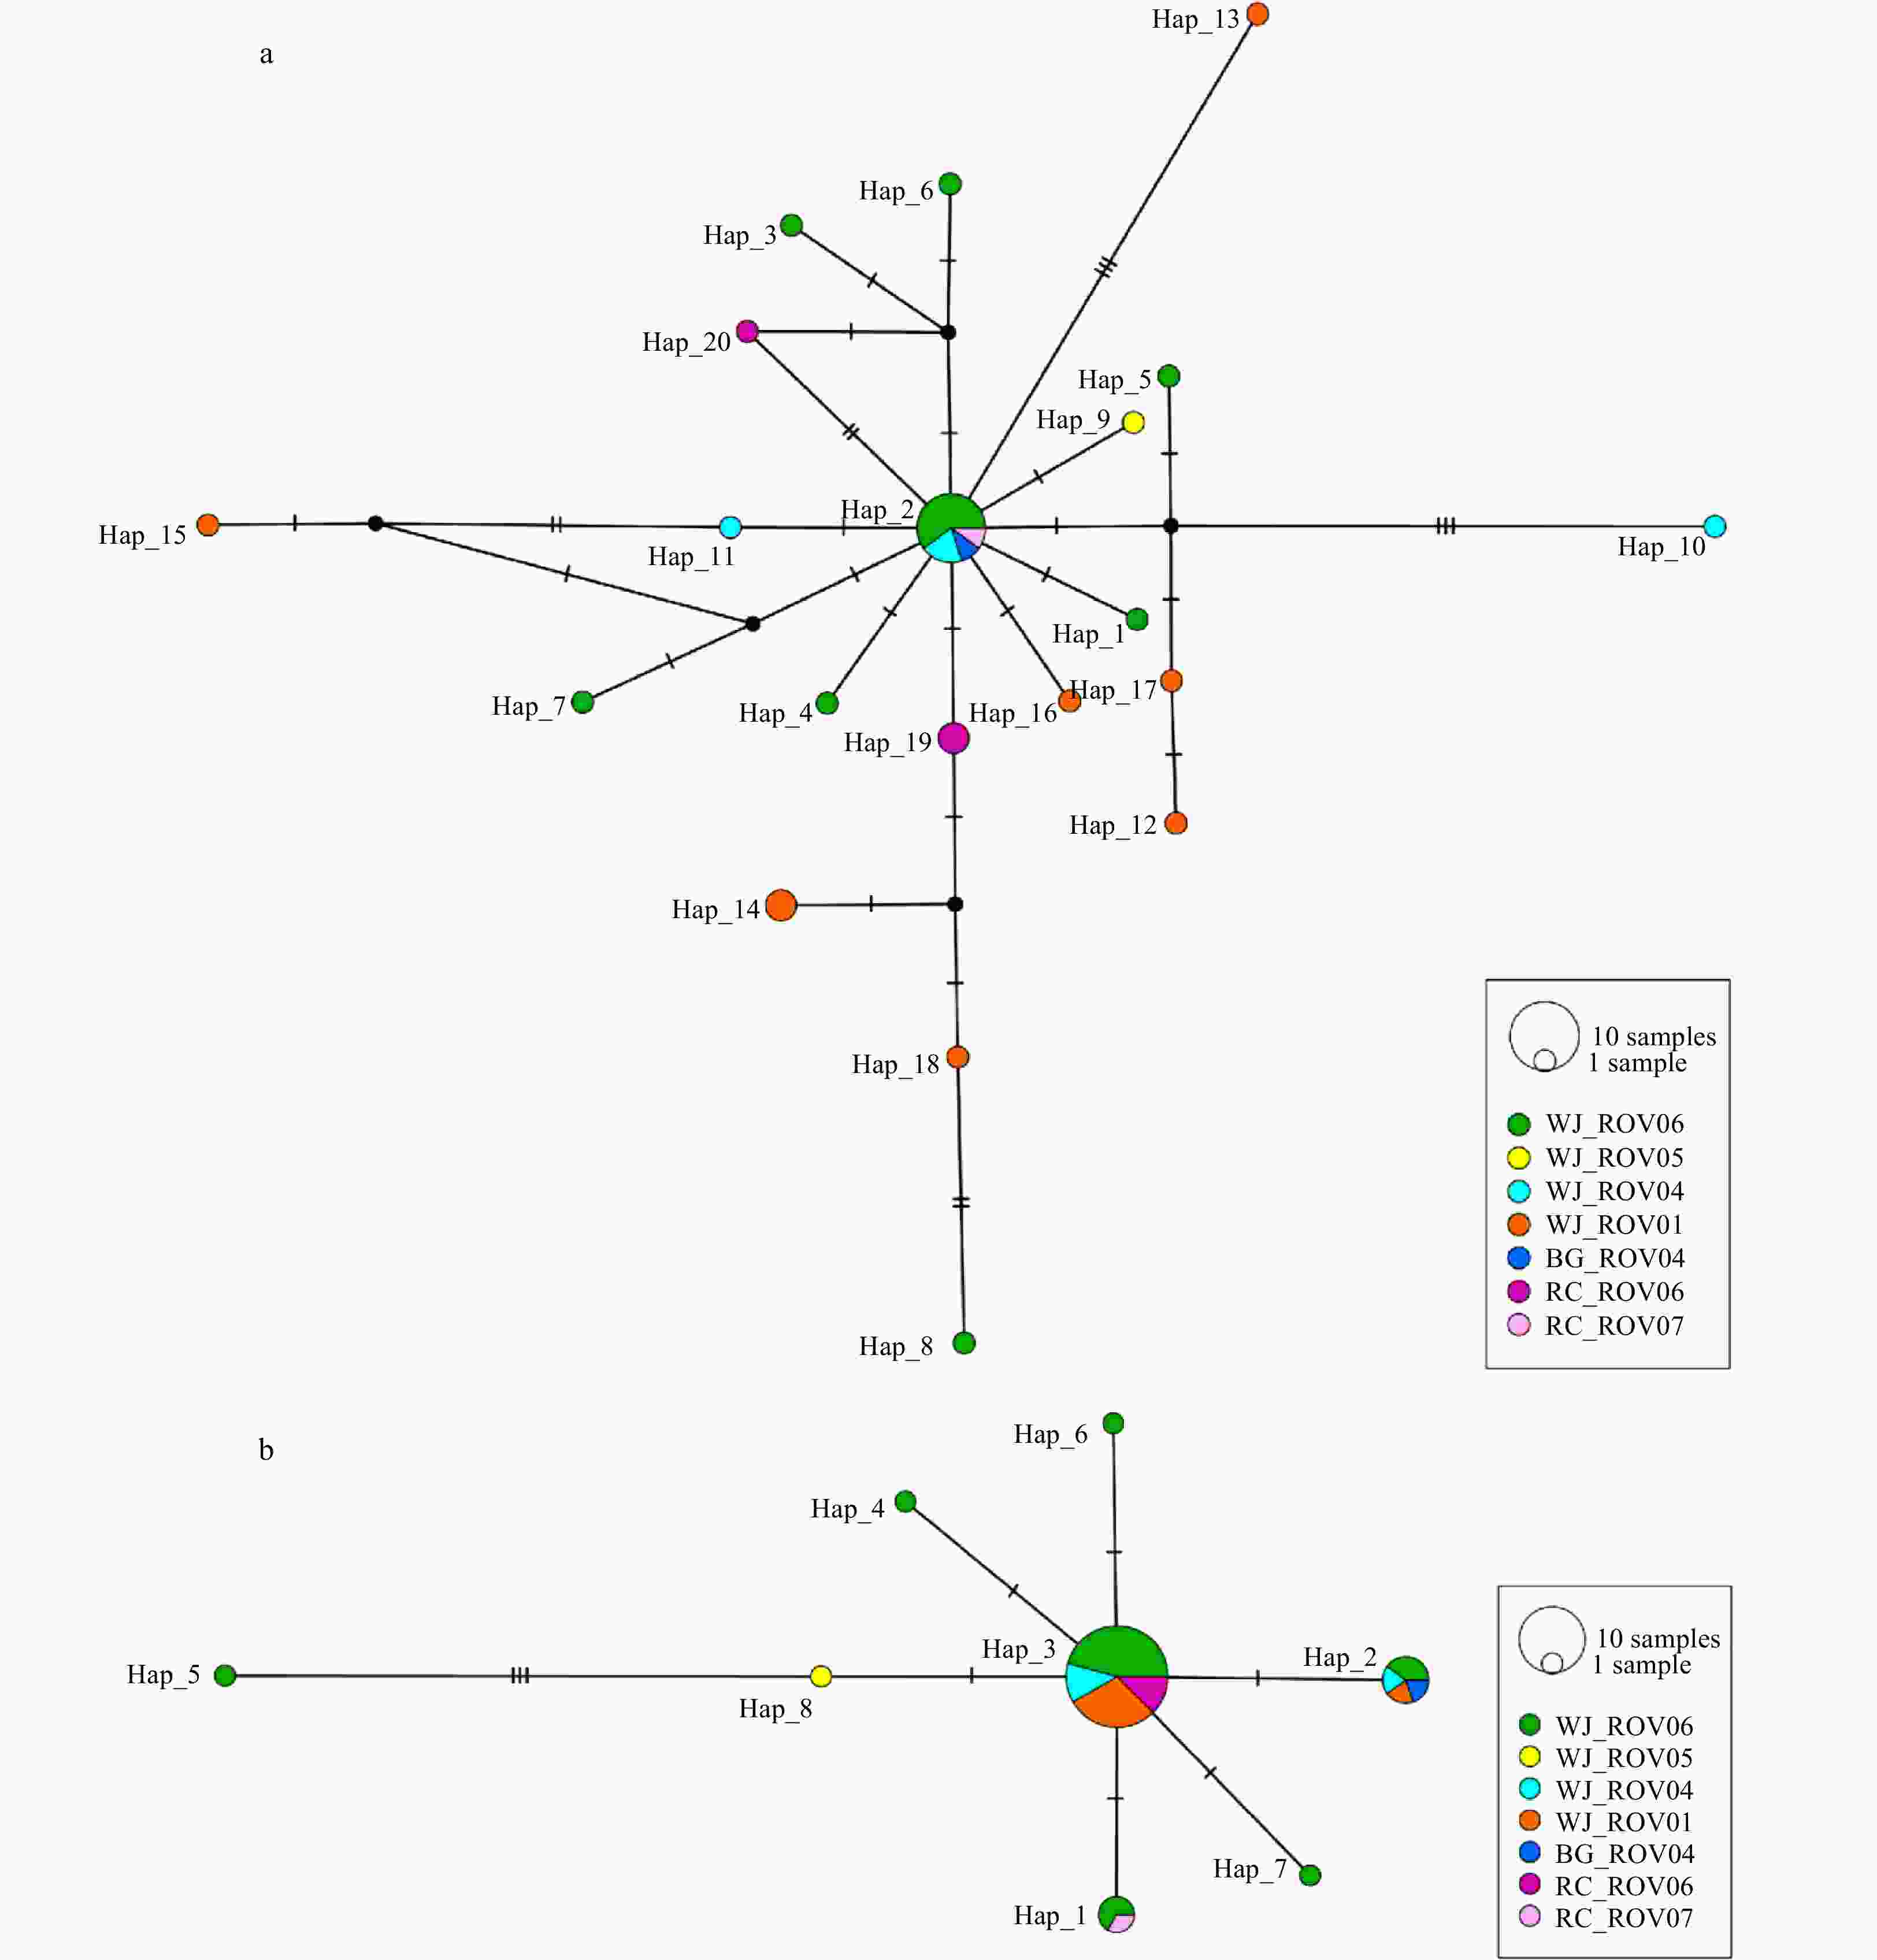
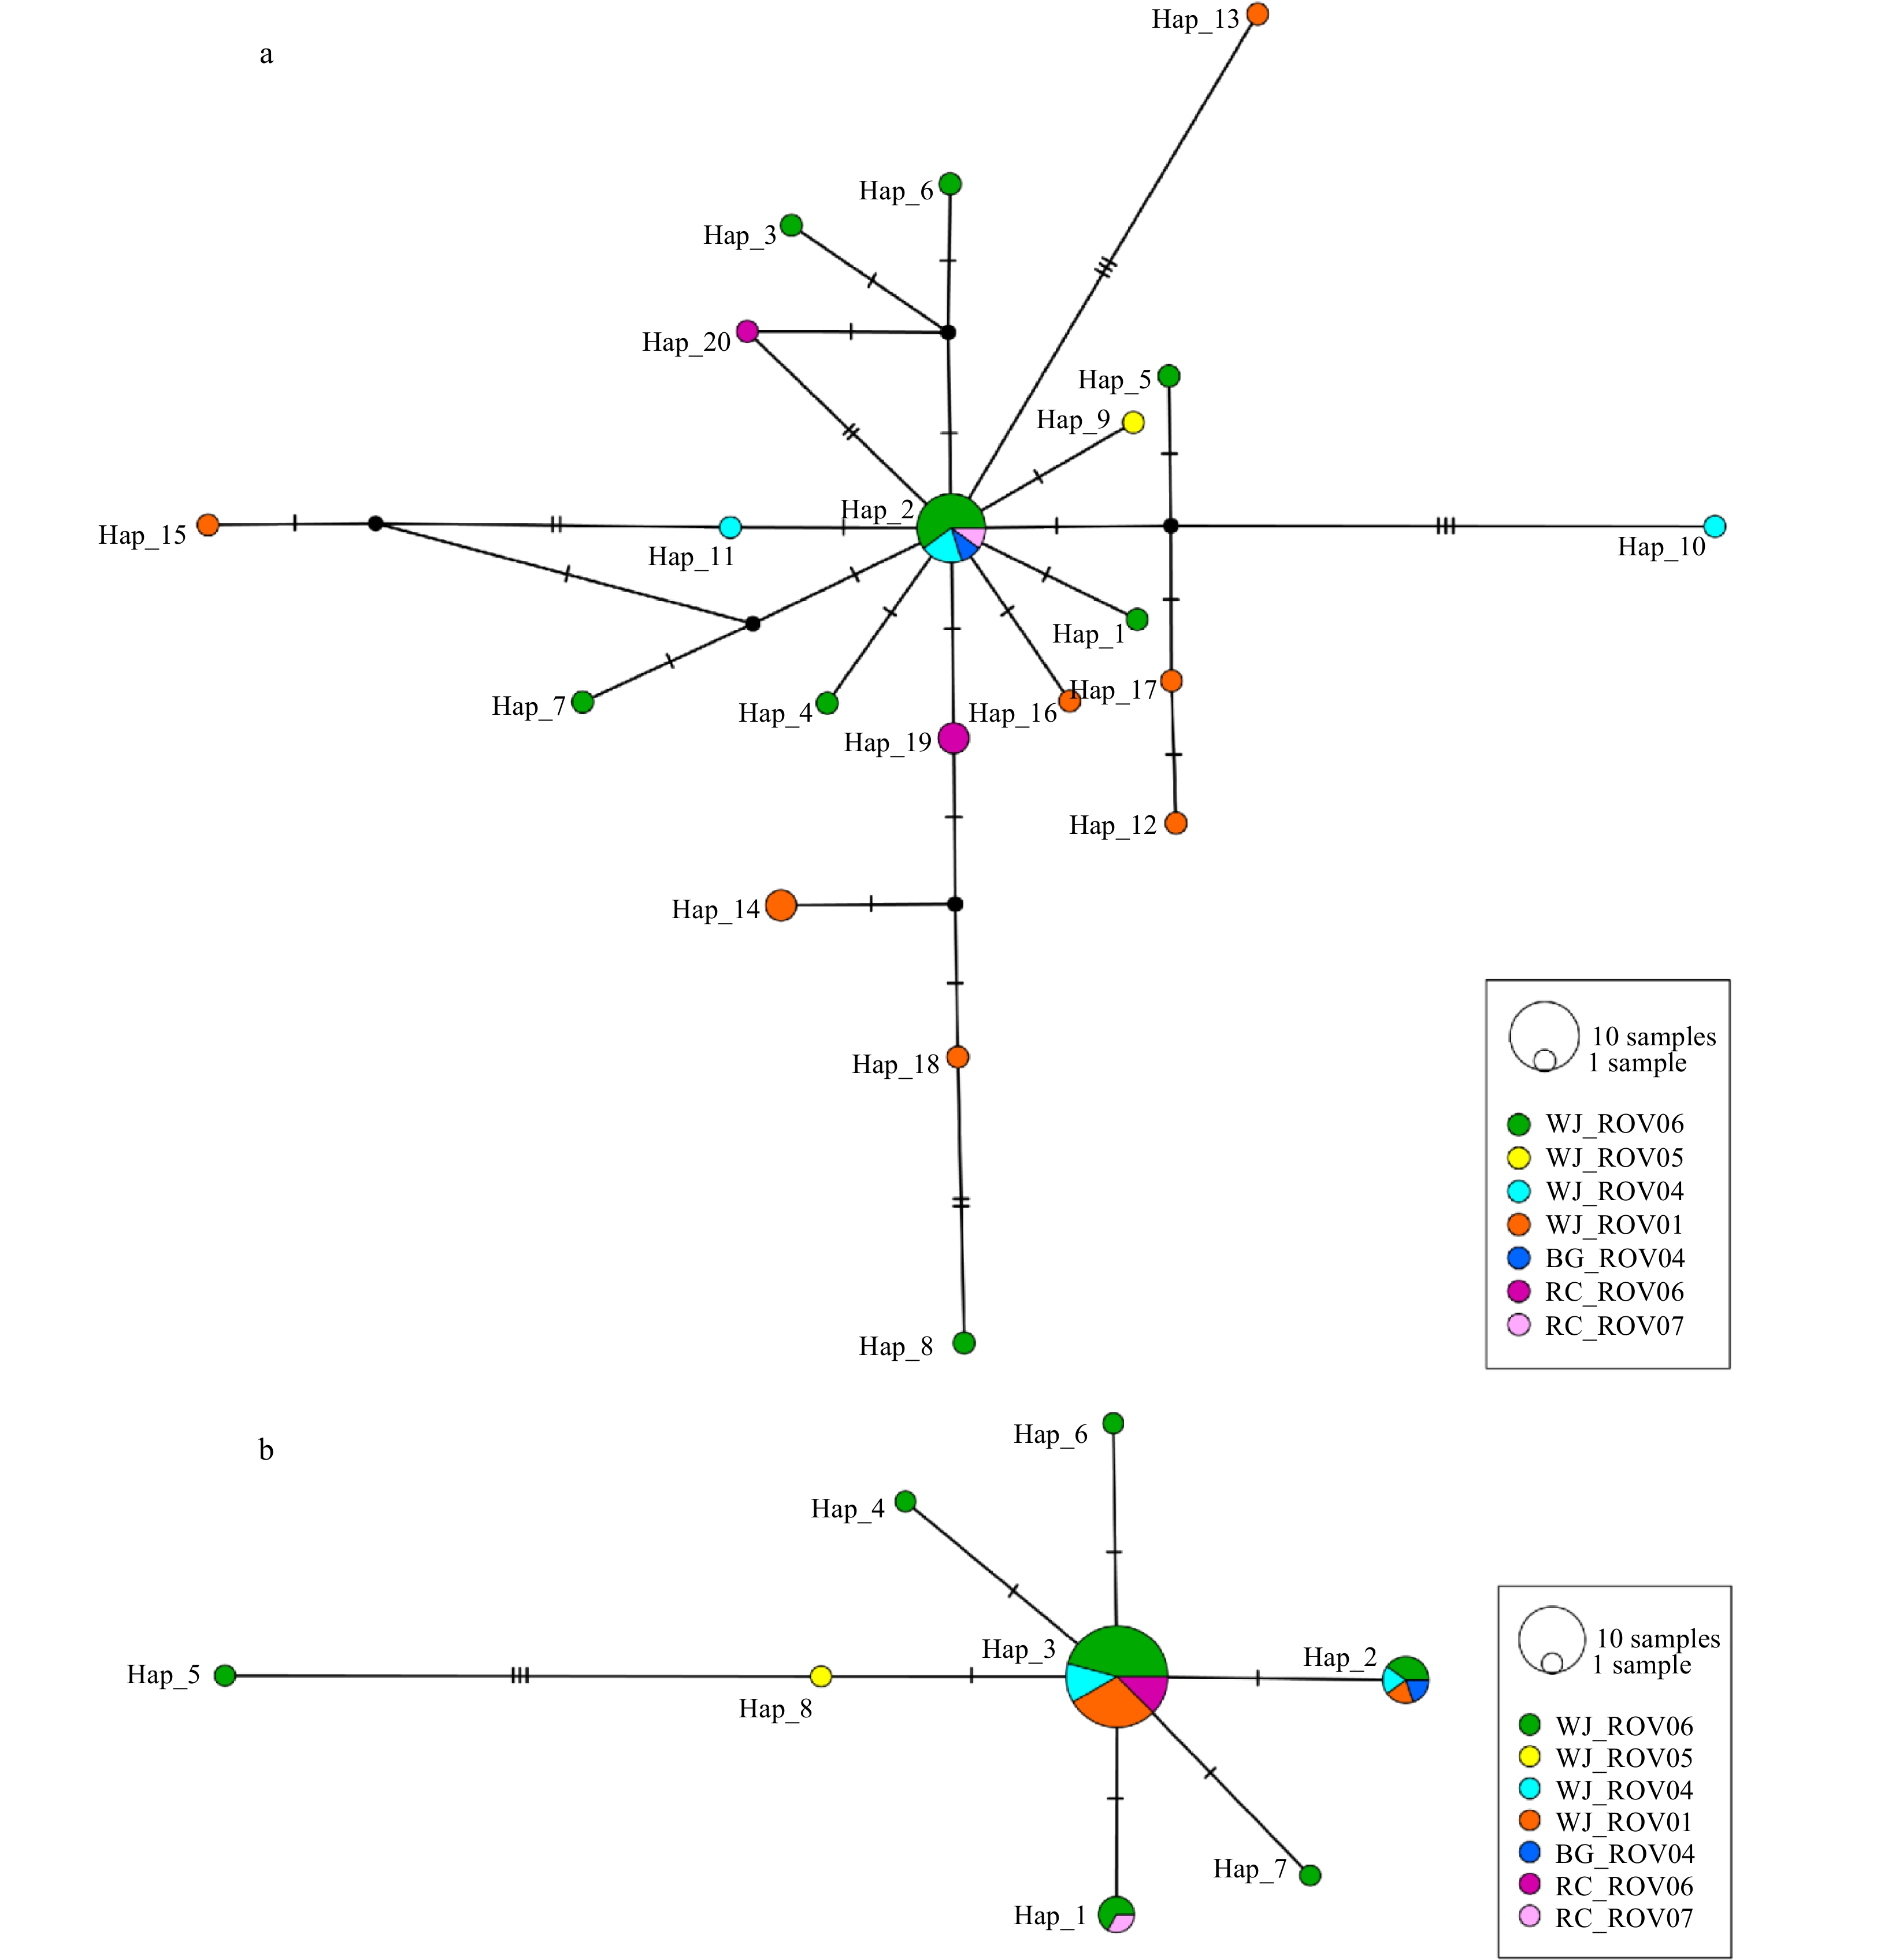
Figure 5. COI (a) and 16S (b) TCS haplotype networks. Each circle represents a haplotype and its diameter is proportional to the frequency of the haplotype. Median vectors (black circles, which represent missing intermediates haplotypes) are added to the network.
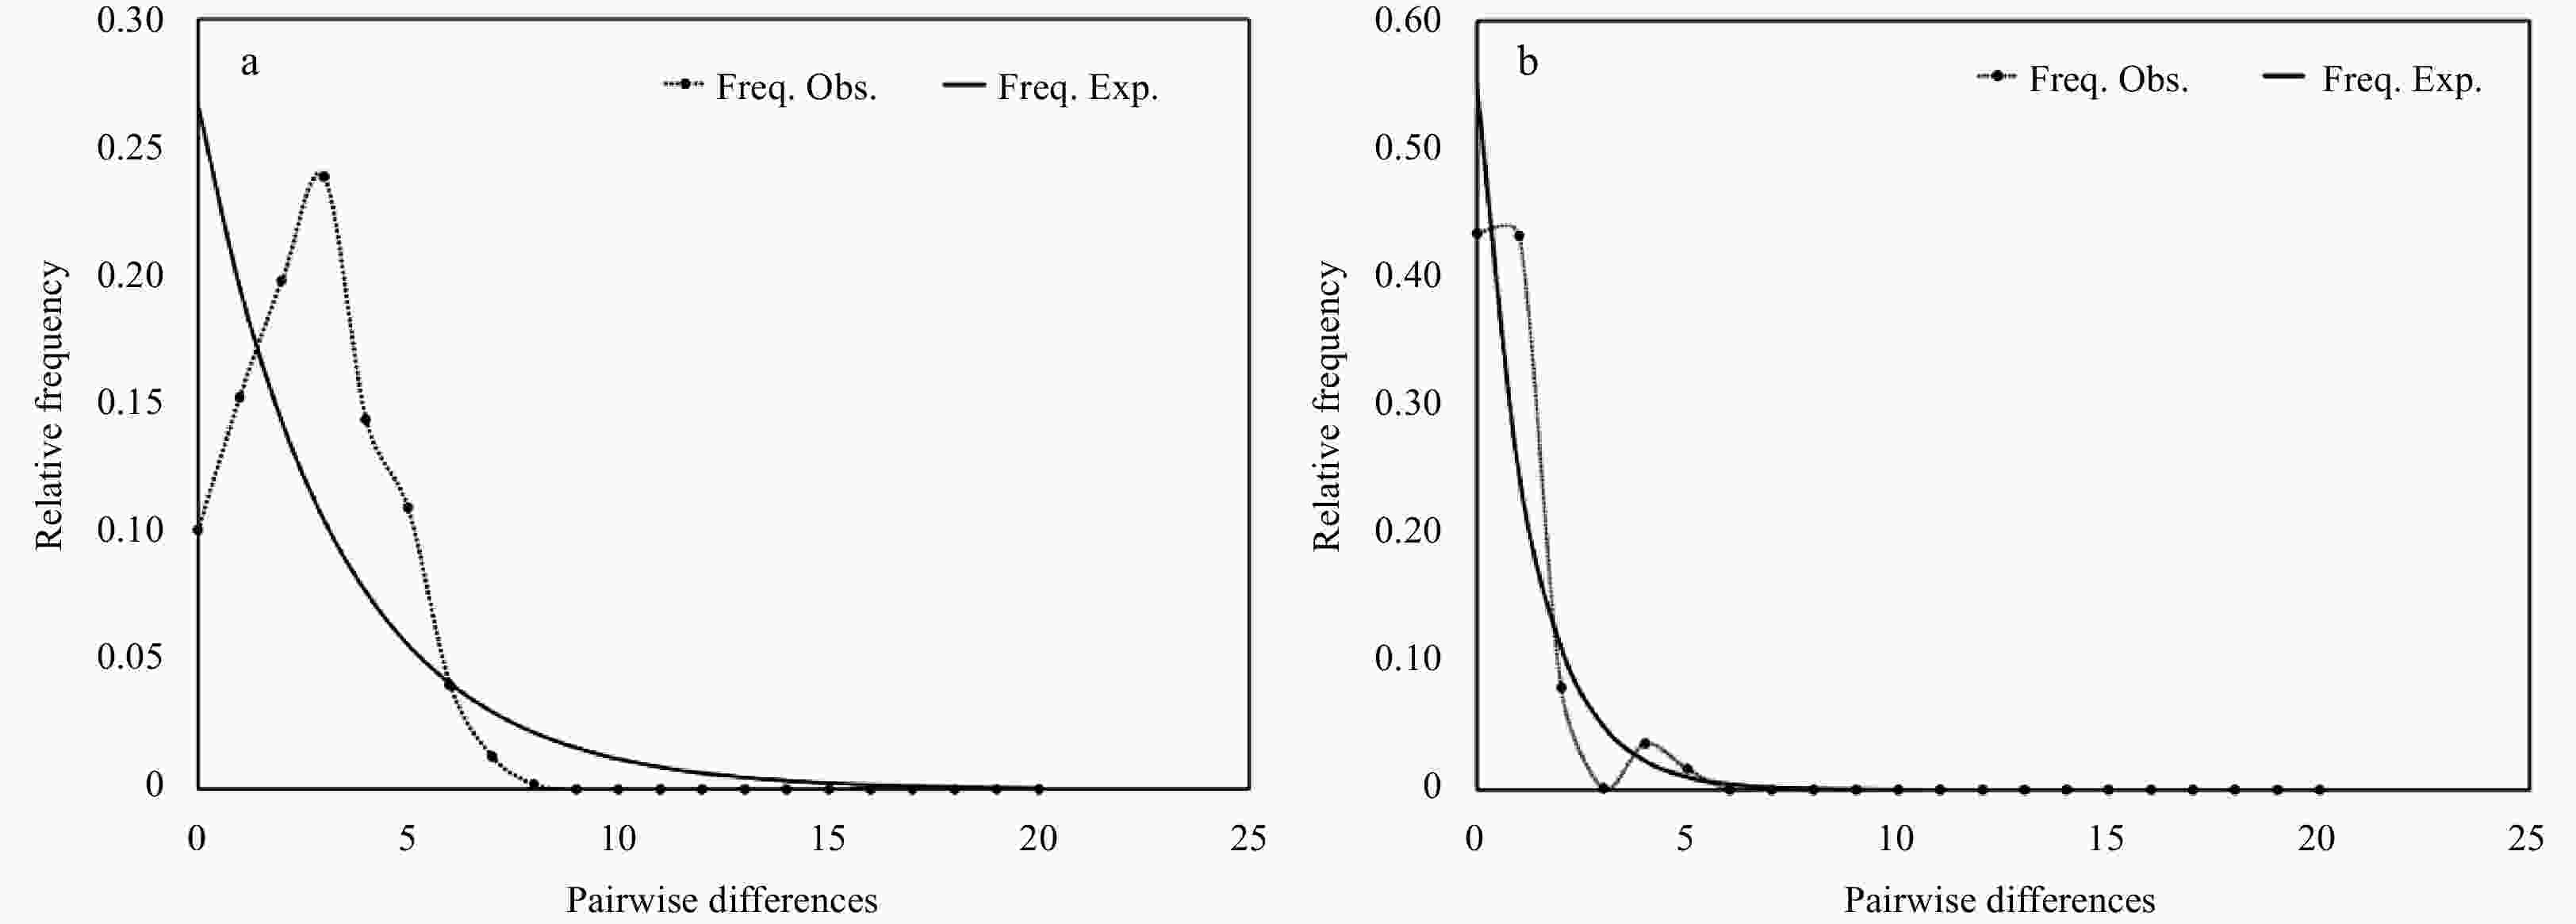
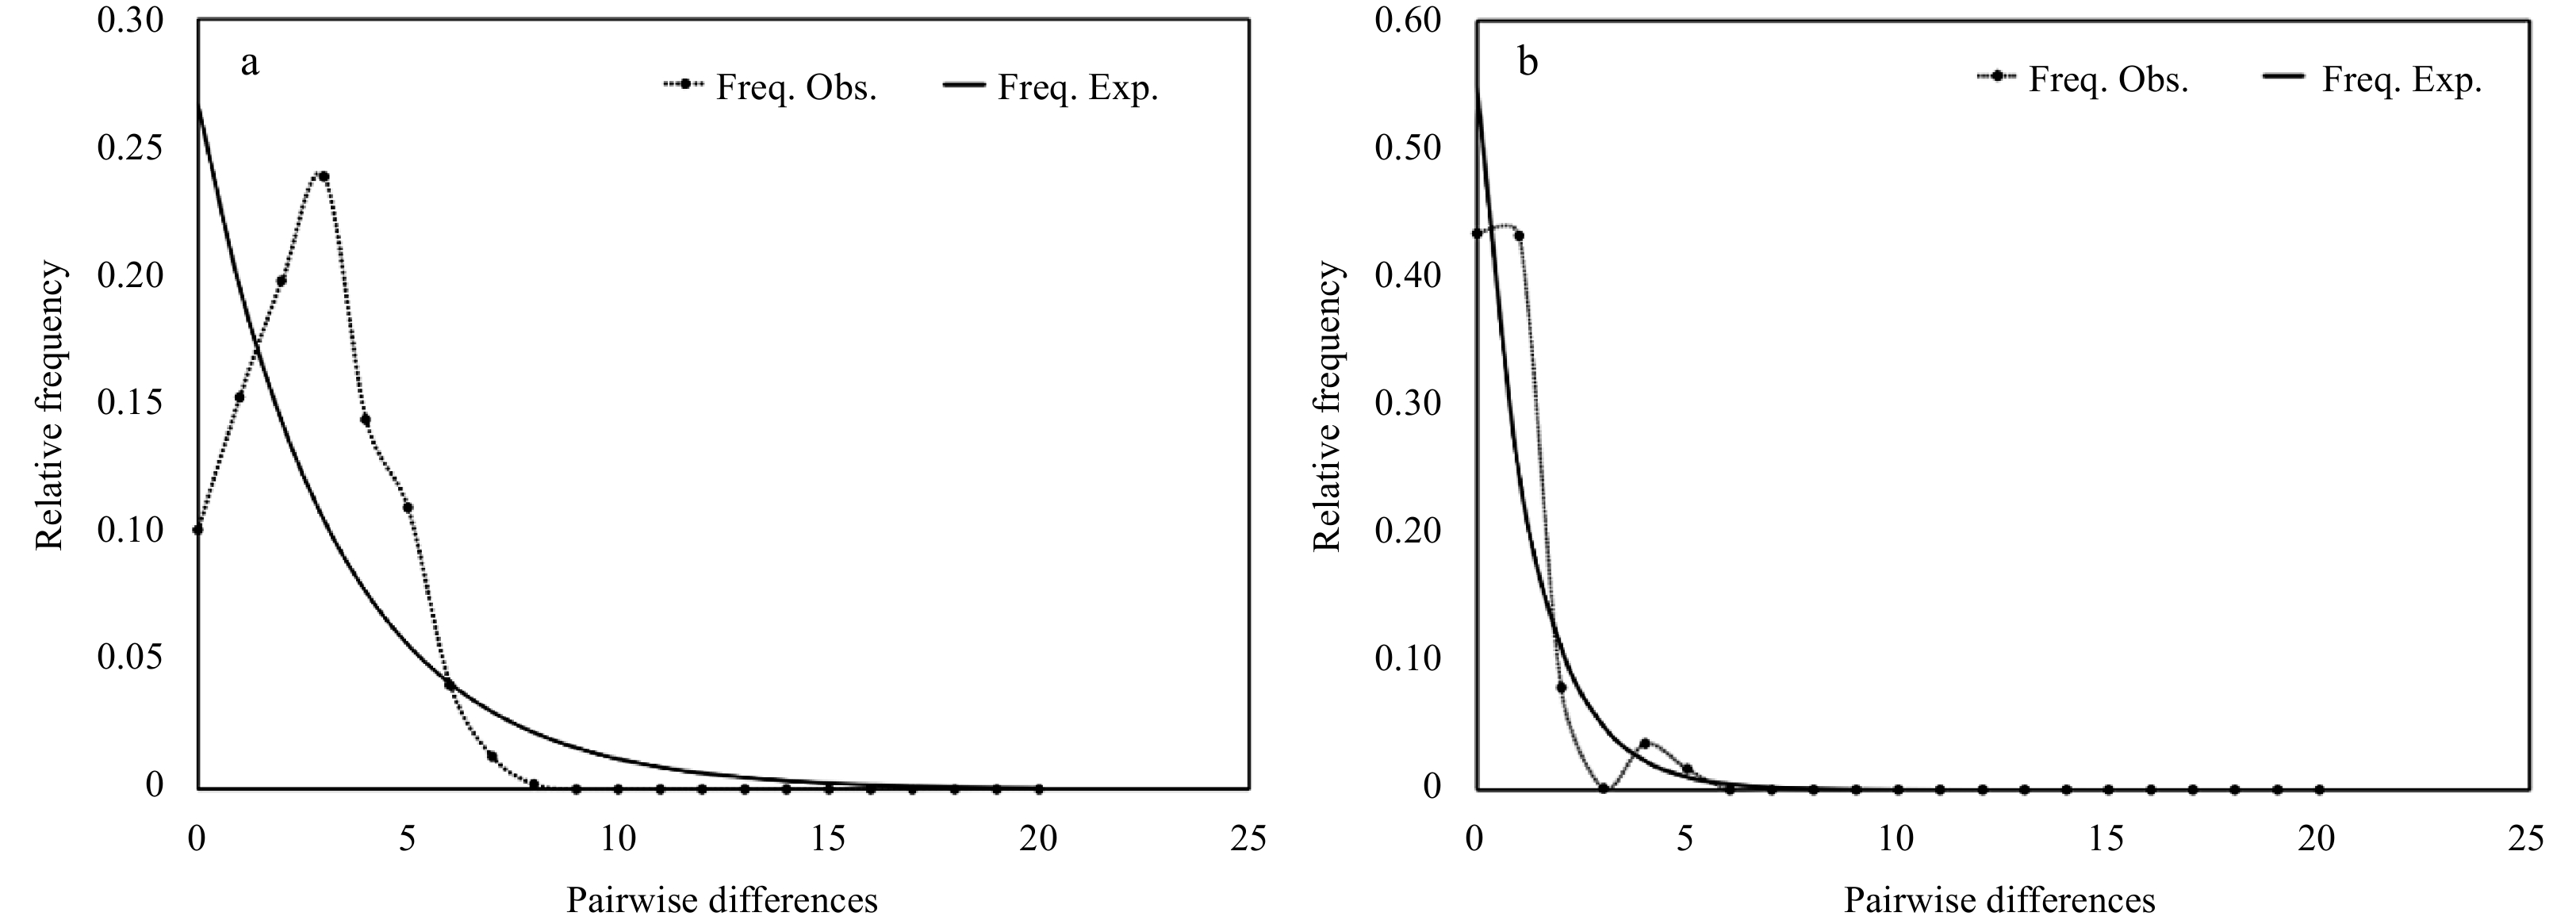
Figure 6. Pairwise mismatch distribution for all COI (a) and 16S (b) sequences of Ophioplinthaca defensor from the Weijia Guyot.
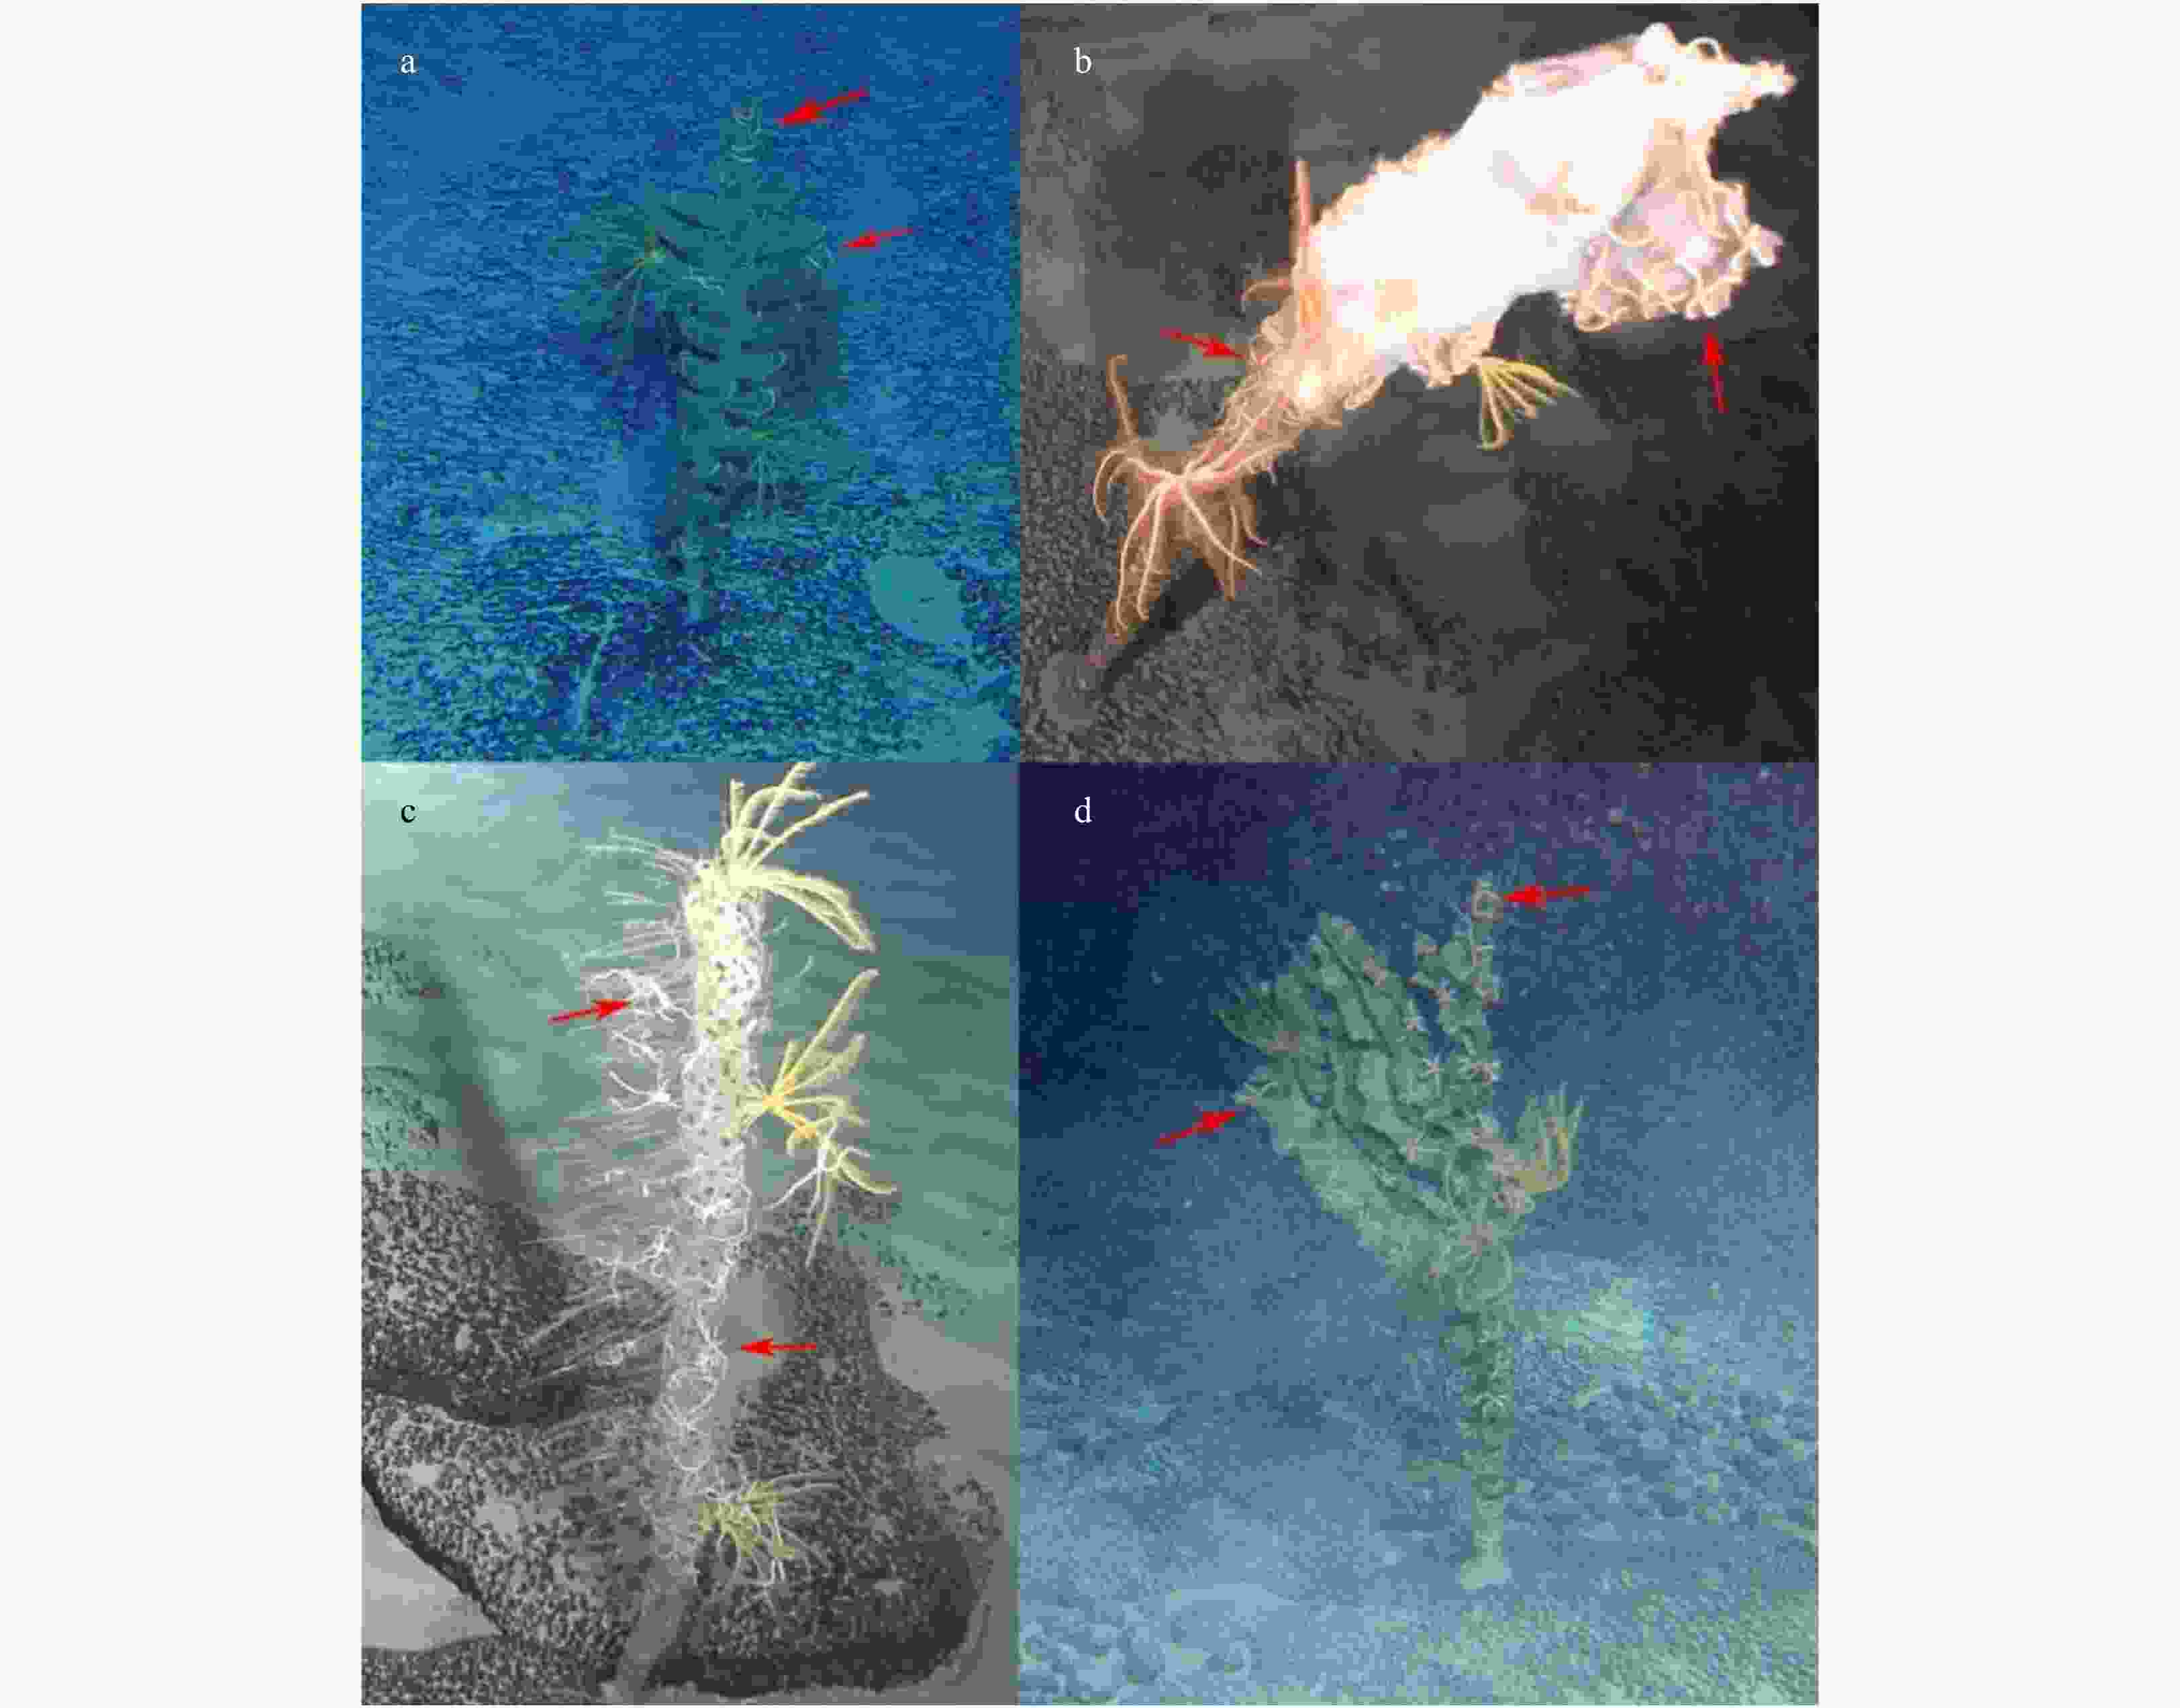
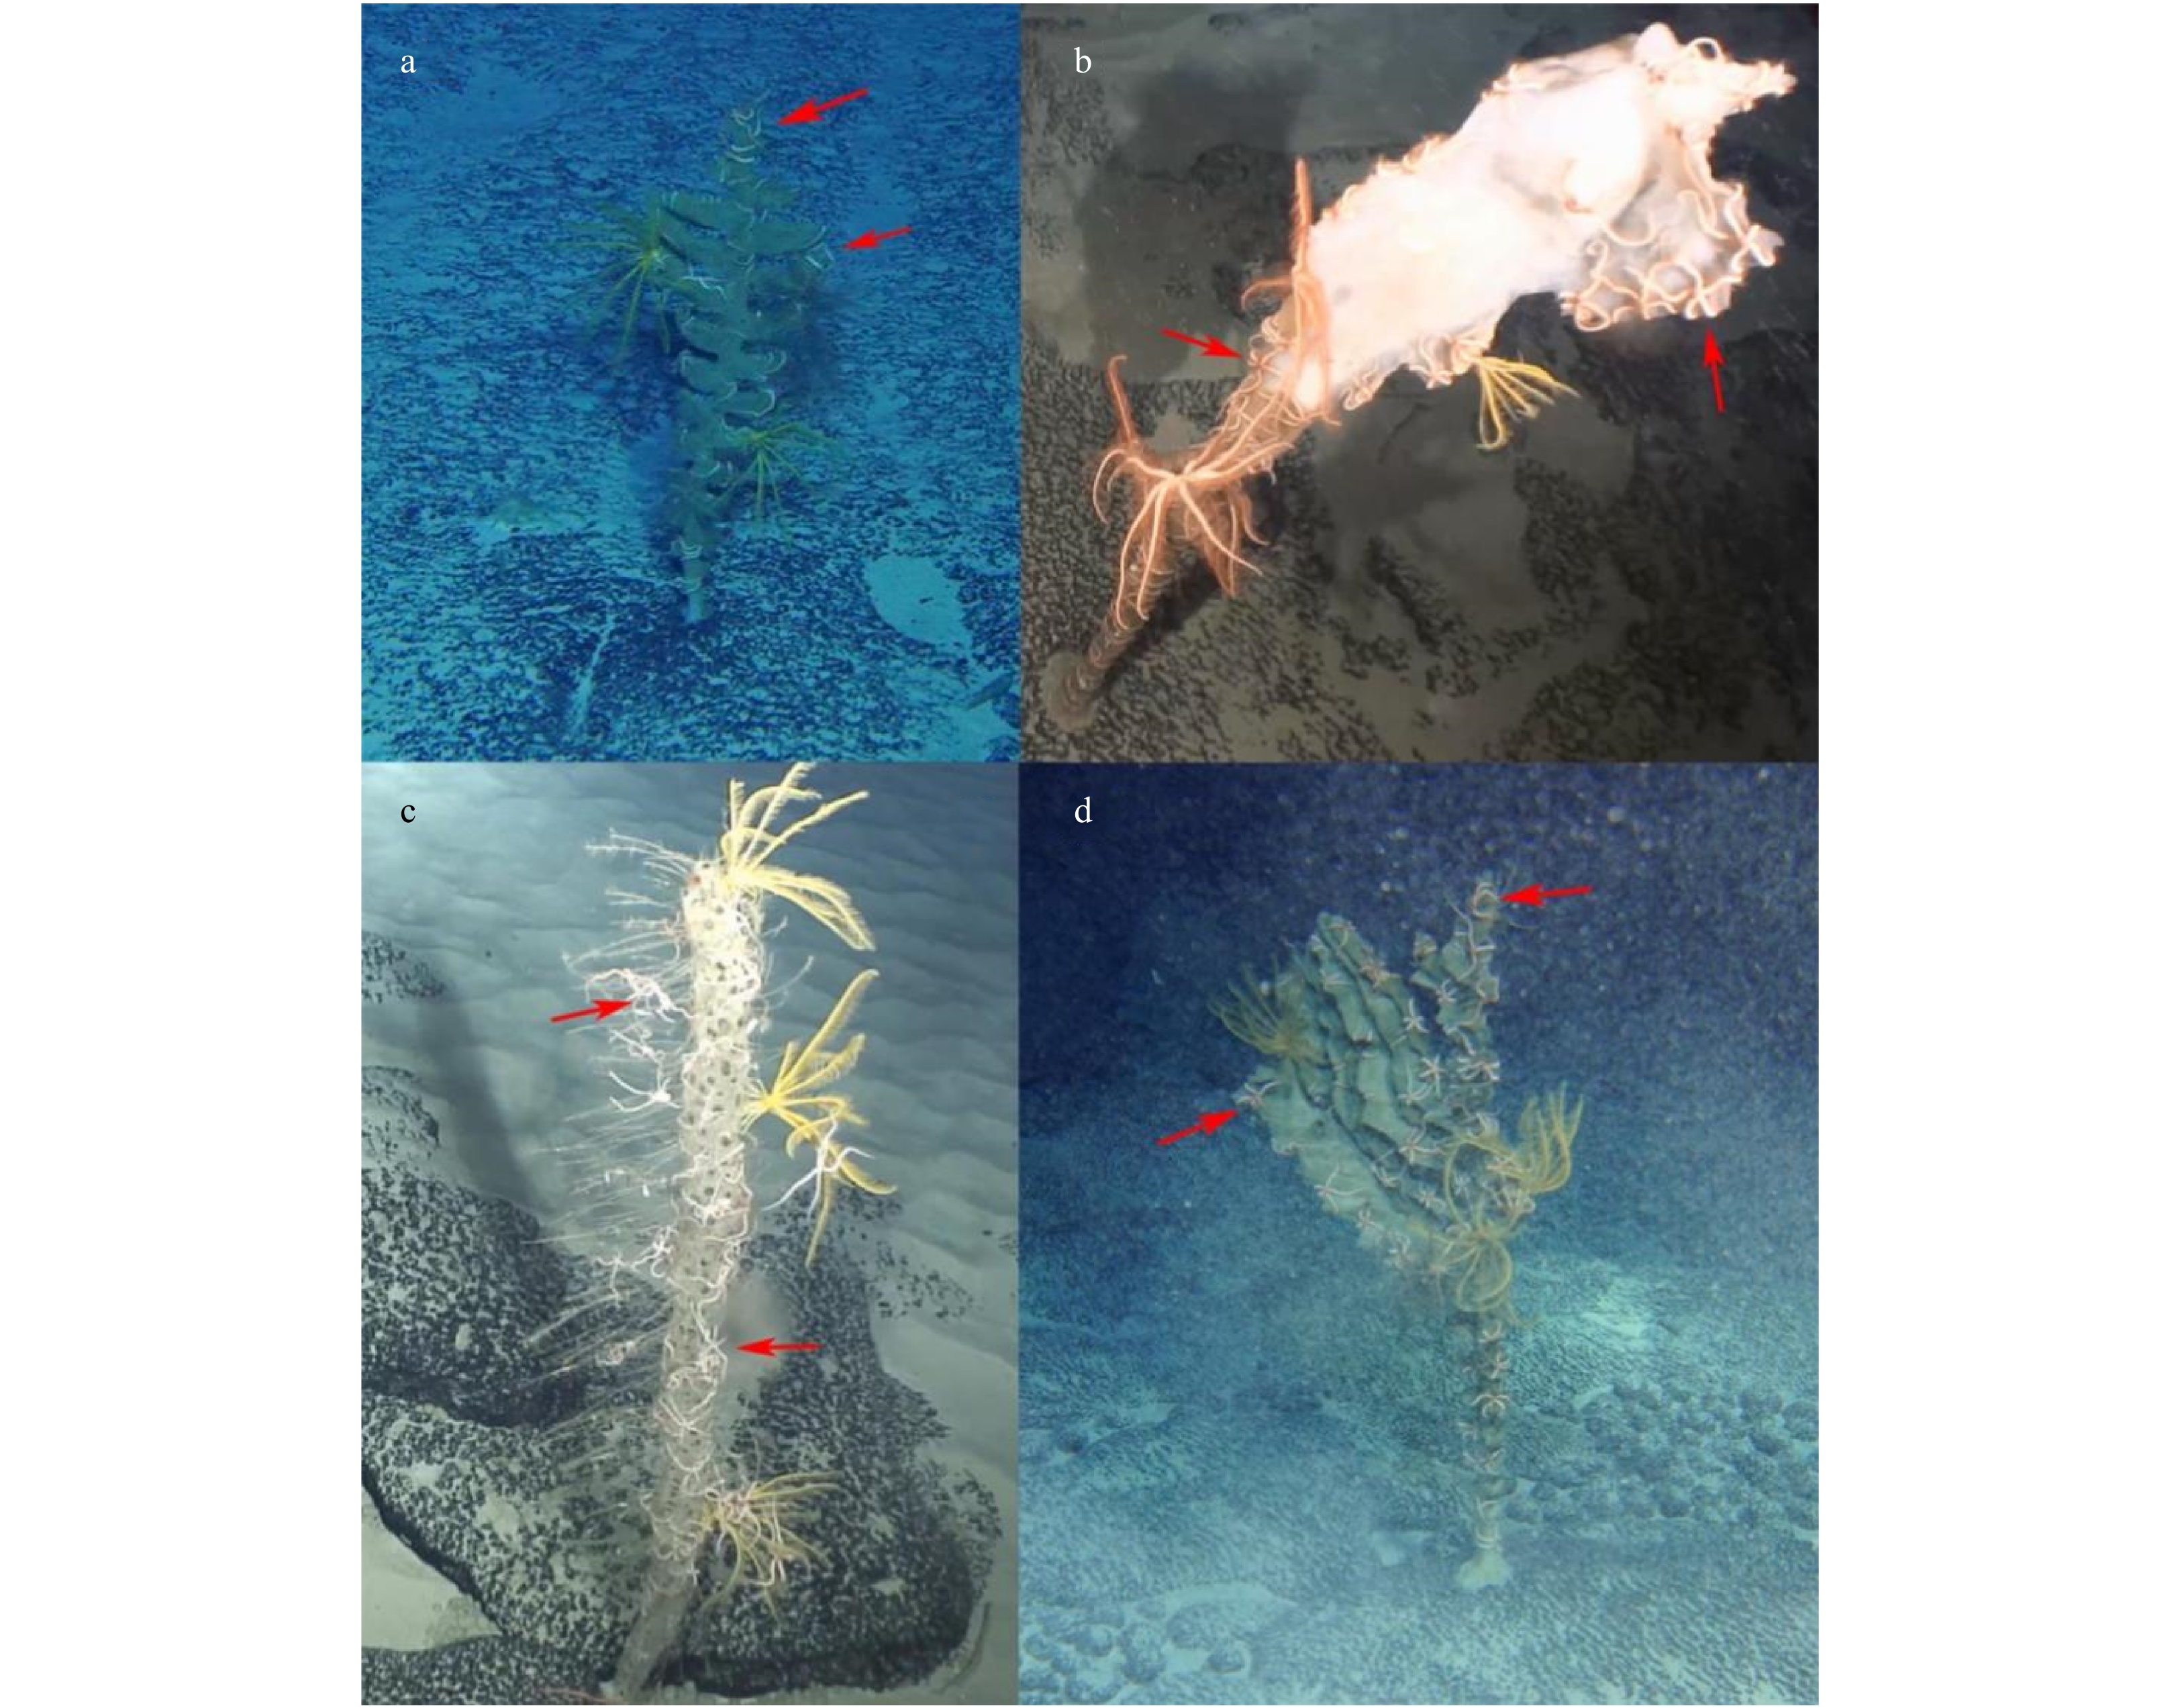
Figure 7. Different sponge species with Ophioplinthaca defensor individuals attached in the Weijia Guyot. a. Farreidae sp. 1; b. Farreidae/Euretidae sp.; c. Corbitellinae sp.; d. Farreidae sp. 2. Red arrows indicate Ophioplinthaca defensor.
Table 1. Ophioplinthaca defensor sampling data in the Northwest Pacific
Cruise Site Seamount Date Latitude Longitude Depth/m Individuals DY35 CW-DV81 Caiwei 2014.7.24 15.683 0°N 154.923 0°E 1 660 1 DY41B WJ-ROV01 Weijia 2017.9.28 12.694 8°N 156.538 1°E 1 670 8 DY41B WJ-ROV04 Weijia 2017.9.18 13.024 2°N 156.884 5°E 1 571 4 DY41B WJ-ROV05 Weijia 2017.9.19 12.884 5°N 157.029 3°E 1 643 1 DY41B WJ-ROV06 Weijia 2017.9.21 12.789 5°N 156.687 7°E 1 935 19 DY56 BG-ROV04 Batiza 2019.9.11 20.015 7°N 156.540 4°E 1 699 1 DY56 RC-ROV06 RC* 2019.9.17 15.529 0°N 161.753 5°E 1 482 3 DY56 RC-ROV07 RC* 2019.9.19 15.495 5°N 161.794 0°E 1 660 1 Note: * represents this seamount is an unnamed seamount; RC was used as a temporary code.  下载: 导出CSV
Table 2. Ophioplinthaca defensor genetic diversity based on COI and 16S
Site COI 16S N Hap Hd π N Hap Hd π WJ-ROV01 8 7 0.964 3 0.006 7 8 2 0.250 0 0.000 5 WJ-ROV04 4 3 0.833 3 0.003 9 4 2 0.500 0 0.001 0 WJ-ROV05 1 1 – – 1 1 – – WJ-ROV06 13 8 0.807 7 0.004 6 19 7 0.666 7 0.002 3 BG-ROV04 1 1 – – 1 1 – – RC-ROV06 3 2 0.666 7 0.003 7 3 1 – – RC-ROV07 1 1 – – 1 1 – – Weijia Guyot 26 18 0.910 8 0.005 6 32 8 0.562 5 0.001 7 Batiza Guyot 1 1 – – 1 1 – – RC seamount 4 3 0.833 3 0.003 1 4 2 0.500 0 0.001 0 Note: N, sample size; Hap, number of haplotypes; Hd, haplotype diversity; π, nucleotide diversity; – represents no data.
下载: 导出CSV
Table 3. Pairwise population differences of Ophioplinthaca defensor among sampling sites with more than three individuals collected and between the Weijia Guyot and the RC seamount based on COI and 16S
Gene Population WJ-ROV01 WJ-ROV04 WJ-ROV06 RC-ROV06 WJ-all RC-all COI WJ-ROV01 − 0.064 5 0.083 4 0.117 0 − − WJ-ROV04 0.056 0 − 0 0.129 0 − − WJ-ROV06 0.060 9 0.000 2 − 0.088 0 − − RC-ROV06 0.096 3 0.140 7 0.124 8 − − − WJ-all − − − − − 0.050 9 RC-all − − − − 0.049 3 − 16S WJ-ROV01 − 0 0 0 − − WJ-ROV04 0 − 0 0 − − WJ-ROV06 0.023 6 0.012 3 − 0.020 2 − − RC-ROV06 0.023 1 0.003 0 0.080 0 − − − WJ-all − − − − − 0 RC-all − − − − 0.027 9 − Note: Above the diagonal are the Fst values, below the diagonal are the Gst values. WJ-all indicates the integrated population of the Weijia Guyot including all sequences (26 for COI, 32 for 16S) from the four sampling sites; RC-all indicates the integrated population of the RC seamount including all sequences (4 for both COI and 16S) from the two sampling sites; − represents no data.
下载: 导出CSV
Table 4. Demographic test results for Ophioplinthaca defensor populations from the Weijia Guyot and the RC seamount based on COI and 16S
Site COI 16S D Fu’s Fs r D Fu’s Fs r WJ-ROV01 −2.009 40* −1.182 1 0.075 3 −1.951 7* −3.196 3 0.312 5 WJ-ROV04 −0.796 84 0.811 4 0.305 6 −0.612 4 0.171 9 0.250 0 WJ-ROV06 −0.663 17 −2.104 3 0.094 8 −1.054 8 −0.182 0 0.147 4 WJ-all −2.082 10* −12.592 0 0.020 2 −1.908 0* −4.601 0 1.294 2 RC-all 0.167 70 −0.133 0 0.194 4 −0.612 4 0.172 0 0.250 0 Note: D, Tajima’s D statistic neutrality tests; Fu’s Fs, Fu’s Fs statistic; *, significant values (p<0.05); r, the Harpending raggedness index.
下载: 导出CSV
-
[1] Baco A R, Etter R J, Ribeiro P A, et al. 2016. A synthesis of genetic connectivity in deep-sea fauna and implications for marine reserve design. Molecular Ecology, 25(14): 3276–3298. doi: 10.1111/mec.13689 [2] Balbar A C, Metaxas A. 2019. The current application of ecological connectivity in the design of marine protected areas. Global Ecology and Conservation, 17: e00569. doi: 10.1016/j.gecco.2019.e00569 [3] Boissin E, Stöhr S, Chenuil A. 2011. Did vicariance and adaptation drive cryptic speciation and evolution of brooding in Ophioderma longicauda (Echinodermata: Ophiuroidea), a common Atlanto-Mediterranean ophiuroid?. Molecular Ecology, 20(22): 4734–4755 [4] Boschen R E, Tyler P A, Copley J T. 2013. Distribution, population structure, reproduction and diet of Ophiolimna antarctica (Lyman, 1879) from Kemp Caldera in the Southern Ocean. Deep-Sea Research Part II: Topical Studies in Oceanography, 92: 27–35. doi: 10.1016/j.dsr2.2013.02.005 [5] Castelin M, Lorion J, Brisset J, et al. 2012. Speciation patterns in gastropods with long-lived larvae from deep-sea seamounts. Molecular Ecology, 21(19): 4828–4853. doi: 10.1111/j.1365-294X.2012.05743.x [6] Cho W, Shank T M. 2010. Incongruent patterns of genetic connectivity among four ophiuroid species with differing coral host specificity on North Atlantic seamounts. Marine Ecology, 31(S1): 121–143 [7] Clark M R, Bowden D A, Rowden A A, et al. 2019. Little evidence of benthic community resilience to bottom trawling on seamounts after 15 years. Frontiers in Marine Science, 6: 63. doi: 10.3389/fmars.2019.00063 [8] Clark M R, Rowden R A, Schlacher T, et al. 2010. The ecology of seamounts: structure, function, and human impacts. Annual Review of Marine Science, 2: 253–278. doi: 10.1146/annurev-marine-120308-081109 [9] Edgar R C. 2004. MUSCLE: multiple sequence alignment with high accuracy and high throughput. Nucleic Acids Res, 32(5): 1792–1797, doi: 10.1093/nar/gkh340 [10] Etter R J, Boyle E E, Glazier A, et al. 2011. Phylogeography of a pan-Atlantic abyssal protobranch bivalve: Implications for evolution in the Deep Atlantic. Molecular Ecology, 20(4): 829–843. doi: 10.1111/j.1365-294X.2010.04978.x [11] Excoffier L, Lischer H E L. 2010. Arlequin suite ver 3.5: a new series of programs to perform population genetics analyses under Linux and Windows. Molecular Ecology Resources, 10(3): 564–567. doi: 10.1111/j.1755-0998.2010.02847.x [12] Fu Yunxin. 1997. Statistical tests of neutrality of mutations against population growth, hitchhiking and background selection. Genetics, 147(2): 915–925. doi: 10.1093/genetics/147.2.915 [13] Galaska M P, Sands C J, Santos S R, et al. 2016. Geographic structure in the Southern Ocean circumpolar brittle star Ophionotus victoriae (Ophiuridae) revealed from mtDNA and single- nucleotide polymorphism data. Ecology and Evolution, 7(2): 475–485 [14] Galaska M P, Sands C J, Santos S R, et al. 2017. Crossing the Divide: Admixture Across the Antarctic Polar Front Revealed by the Brittle Star Astrotoma agassizii. The Biological Bulletin, 232(3): 198–211. doi: 10.1086/693460 [15] Harpending H C. 1994. Signature of ancient population growth in a low-resolution mitochondrial DNA mismatch distribution. Human Biology, 66(4): 591–600 [16] Havermans C, Sonet G, D’Acoz C D, et al. 2013. Genetic and morphological divergences in the cosmopolitan deep-sea amphipod Eurythenes gryllus reveal a diverse abyss and a bipolar species. PLoS ONE, 8(9): e74218. doi: 10.1371/journal.pone.0074218 [17] Hein J R, Bohrson W A, Schulz M S, et al. 1992. Variations in the fine-scale composition of a central pacific ferromanganese crust: paleoceanographic implications. Paleoceanography and Paleoclimatology, 7(1): 63–77 [18] Hilário A, Metaxas A, Gaudron S M, et al. 2015. Estimating dispersal distance in the deep sea: challenges and applications to marine reserves. Frontiers in Marine Science, 2: 6. doi: 10.3389/fmars.2015.00006 [19] Hunter R L, Halanych K M. 2008. Evaluating connectivity in the brooding brittle star Astrotoma agassizii across the Drake Passage in the Southern Ocean. Journal of Heredity, 99(2): 137–148. doi: 10.1093/jhered/esm119 [20] Hunter R L, Halanych K M. 2010. Phylogeography of the Antarctic planktotrophic brittle star Ophionotus victoriae reveals genetic structure inconsistent with early life history. Marine Biology, 157(8): 1693–1704. doi: 10.1007/s00227-010-1443-3 [21] ISA. 2018. Towards the development of a regional environmental management plan for cobalt-rich ferromanganese crusts in the Northwest Pacific Ocean. ISA Technical Study No. 23. Kingston, Jamaica: International Seabed Authority [22] ISBA/19/LTC/8. 2013. Recommendations for the guidance of contractors for the assessment of the possible environmental impacts arising from exploration for marine minerals in the area. Jamaica: International Seabed Authority [23] Jennings R M, Etter R J, Lynn F, et al. 2013. Population differentiation and species formation in the deep sea: the potential role of environmental gradients and depth. PloS ONE, 8(10): e77594. doi: 10.1371/journal.pone.0077594 [24] Kaiho K, Hasegawa T. 1994. End-Cenomanian benthic foraminiferal extinctions and oceanic dysoxic events in the northwestern Pacific Ocean. Palaeogeography, Palaeoclimatology, Palaeoecology, 111(1–2): 29–43. doi: 10.1016/0031-0182(94)90346-8 [25] Koehler R. 1930. Ophiures recueillies par le Docteur Th. Mortensen dans les Mers d’Australie et dans I’Archipel Malais. Papers from Dr. Th. Mortensen’s Pacific Expedition 1914-16. LIV. Videnskabelige Meddelelser fra Dansk naturhistorisk Forening, 89: 1–295 [26] Leigh J W, Bryant D. 2015. Popart: full-feature software for haplotype network construction. Methods in Ecology and Evolution, 6(9): 1110–1116. doi: 10.1111/2041-210X.12410 [27] Manel S, Loiseau N, Andrello M, et al. 2019. Long-distance benefits of marine reserves: myth or reality?. Trends in Ecology & Evolution, 34(4): 342–354 [28] Martino S, Parson L M. 2012. A comparison between manganese nodules and cobalt crust economics in a scenario of mutual exclusivity. Marine Policy, 36(3): 790–800. doi: 10.1016/j.marpol.2011.11.008 [29] Miller K J, Gunasekera R M. 2017. A comparison of genetic connectivity in two deep sea corals to examine whether seamounts are isolated islands or stepping stones for dispersal. Scientific Reports, 7: 46103. doi: 10.1038/srep46103 [30] Morgan N B, Cairns S, Reiswig H, et al. 2015. Benthic megafaunal community structure of cobalt-rich manganese crusts on Necker Ridge. Deep-Sea Research Part I: Oceanographic Research Papers, 104: 92–105. doi: 10.1016/j.dsr.2015.07.003 [31] O’Driscoll R L, Clark M R. 2005. Quantifying the relative intensity of fishing on New Zealand seamounts. New Zealand Journal of Marine and Freshwater Research, 39(4): 839–850. doi: 10.1080/00288330.2005.9517356 [32] O’Hara T D. 2007. Seamounts: centres of endemism or species-richness for ophiuroids?. Global Ecology and Biogeography, 16(6): 720–732. doi: 10.1111/j.1466-8238.2007.00329.x [33] O’Hara T D, Consalvey M, Lavrado H P, et al. 2010. Environmental predictors and turnover of biota along a seamount chain. Marine Ecology, 31(S1): 84–94 [34] O’Hara T D, England P R, Gunasekera R M, et al. 2014. Limited phylogeographic structure for five bathyal ophiuroids at continental scales. Deep-Sea Research Part I: Oceanographic Research Papers, 84: 18–28. doi: 10.1016/j.dsr.2013.09.009 [35] O’Hara T D, Smith P J, Mills V S, et al. 2013. Biogeographical and phylogeographical relationships of the bathyal ophiuroid fauna of the Macquarie Ridge, Southern Ocean. Polar Biology, 36(3): 321–333. doi: 10.1007/s00300-012-1261-9 [36] O’Hara T D, Stöhr S. 2006. Deep water Ophiuroidea (Echinodermata) of New Caledonia: Ophiacanthidae and Hemieuryalidae. In: Richer de Forges B, Justine J L, eds. Tropical Deep Sea Benthos (Mémoires du Muséum national d’Histoire naturelle 193). Paris, France: Museum of Natural History of France, 24: 33–141 [37] Palumbi S R. 1996. Nucleic acidS II: the polymerase chain reaction. In: Hilli D M, Moritz C, Mable B K, eds. Molecular Systematics. 2nd ed. Sunderland, MA, USA: Sinauer Associates, 205–247 [38] Palumbi S R. 2003. Population genetics, demographic connectivity, and the design of marine reserves. Ecological Applications, 13(S1): 146–158. doi: 10.1890/1051-0761(2003)013[0146:PGDCAT]2.0.CO;2 [39] Pérez-Portela R, Almada V, Turon X. 2012. Cryptic speciation and genetic structure of widely distributed brittle stars (Ophiuroidea) in Europe. Zoologica Scripta, 42(2): 151–169 [40] Rozas J, Ferrer-Mata A, Sánchez-DelBarrio J C, et al. 2017. DnaSP 6: DNA sequence polymorphism analysis of large data sets. Molecular Biology and Evolution, 34(12): 3299–3302. doi: 10.1093/molbev/msx248 [41] Samadi S, Bottan L, Macpherson E, et al. 2006. Seamount endemism questioned by the geographic distribution and population genetic structure of marine invertebrates. Marine Biology, 149(6): 1463–1475. doi: 10.1007/s00227-006-0306-4 [42] Sands C J, O’Hara T D, Barnes D K A, et al. 2015. Against the flow: evidence of multiple recent invasions of warmer continental shelf waters by a Southern Ocean brittle star. Frontiers in Ecology and Evolution, 3: 63. doi: 10.3389/fevo.2015.00063 [43] Schlacher T A, Baco A R, Rowden A A, et al. 2014. Seamount benthos in a cobalt-rich crust region of the central Pacific: conservation challenges for future seabed mining. Diversity and Distributions, 20(5): 491–502. doi: 10.1111/ddi.12142 [44] Shank T M. 2010. Seamounts: deep-ocean laboratories of faunal connectivity, evolution, and endemism. Oceanography, 23(1): 108–122. doi: 10.5670/oceanog.2010.65 [45] Taboada S, Pérez-Portela R. 2016. Contrasted phylogeographic patterns on mitochondrial DNA of shallow and deep brittle stars across the Atlantic-Mediterranean area. Scientific Reports, 6: 32425. doi: 10.1038/srep32425 [46] Taboada S, Riesgo A, Wiklund H, et al. 2018. Implications of population connectivity studies for the design of marine protected areas in the deep sea: An example of a demosponge from the Clarion-Clipperton Zone. Molecular Ecology, 27(23): 4657–4679. doi: 10.1111/mec.14888 [47] Tajima F. 1989. Statistical method for testing the neutral mutation hypothesis by DNA polymorphism. Genetics, 123(3): 585–595. doi: 10.1093/genetics/123.3.585 [48] Taylor M L, Roterman C N. 2017. Invertebrate population genetics across Earth’s largest habitat: The deep-sea floor. Molecular Ecology, 26(19): 4872–4896. doi: 10.1111/mec.14237 [49] Thatje S, Hillenbrand C D, Mackensen A, et al. 2008. Life hung by a thread: endurance of Antarctic fauna in glacial periods. Ecology, 89(3): 682–692. doi: 10.1890/07-0498.1 [50] Yesson C, Clark M R, Taylor M L, et al. 2011. The global distribution of seamounts based on 30 arc seconds bathymetry data. Deep-Sea Research Part I: Oceanographic Research Papers, 58(4): 442–453. doi: 10.1016/j.dsr.2011.02.004 [51] Zeng Cong, Clark M R, Rowden A A, et al. 2019. The use of spatially explicit genetic variation data from four deep-sea sponges to inform the protection of Vulnerable Marine Ecosystems. Scientific Reports, 9: 5482. doi: 10.1038/241598-019-41877-9 -
 AOS-Vol.40-No.12-Najieying-supplement.pdf

-


 点击查看大图

计量
- 文章访问数: 1190
- HTML全文浏览量: 371
- PDF下载量: 103
- 被引次数: 0

