

Spatiotemporal characteristics of sea ice transport in the Baffin Bay and its association with atmospheric variability
-
Abstract: Sea ice export through the Baffin Bay plays a vital role in modulating the sea ice cover variability in the Labrador Sea. In this study, satellite-derived sea ice products are used to obtain the sea ice area flux (SIAF) through the three passages in the Baffin Bay (referred to as A, B, and C for the north, middle, and south passages, respectively). The spatial variability of the monthly sea ice drift in the Baffin Bay is presented. The interannual variability and trends in SIAF via the three passages are outlined. The connection to several large-scale atmospheric circulation modes is assessed. Over the period of 1988–2015, the average annual (October to the following September) SIAF amounts to 555×103 km2, 642×103 km2, and 551×103 km2 through Passages A, B, and C, respectively. These quantities are less than that observed through the Fram Strait (FS, 707×103 km2) of the corresponding period. The positive trends in annual SIAF, on the order of 53.1×10³ km2/(10 a) and 43.2×10³ km2/(10 a) (significant at the 95% confidence level), are identified at Passages A and B, respectively. The trend of the south passage (C), however, is slightly negative (–13.3×10³ km2/(10 a), not statistically significant). The positive trends in annual SIAF through the Passages A and B are primarily attributable to the significant increases after 2000. The connection between the Baffin Bay sea ice export and the North Atlantic Oscillation is not significant over the studied period. By contrast, the association with the cross-gate sea level pressure difference is robust in the Baffin Bay (R equals 0.69 to 0.71, depending on the passages considered), but relatively weaker than that over FS (R=0.74).
-
Key words:
- sea ice transport /
- Baffin Bay /
- Arctic, sea ice area flux (SIAF)
-
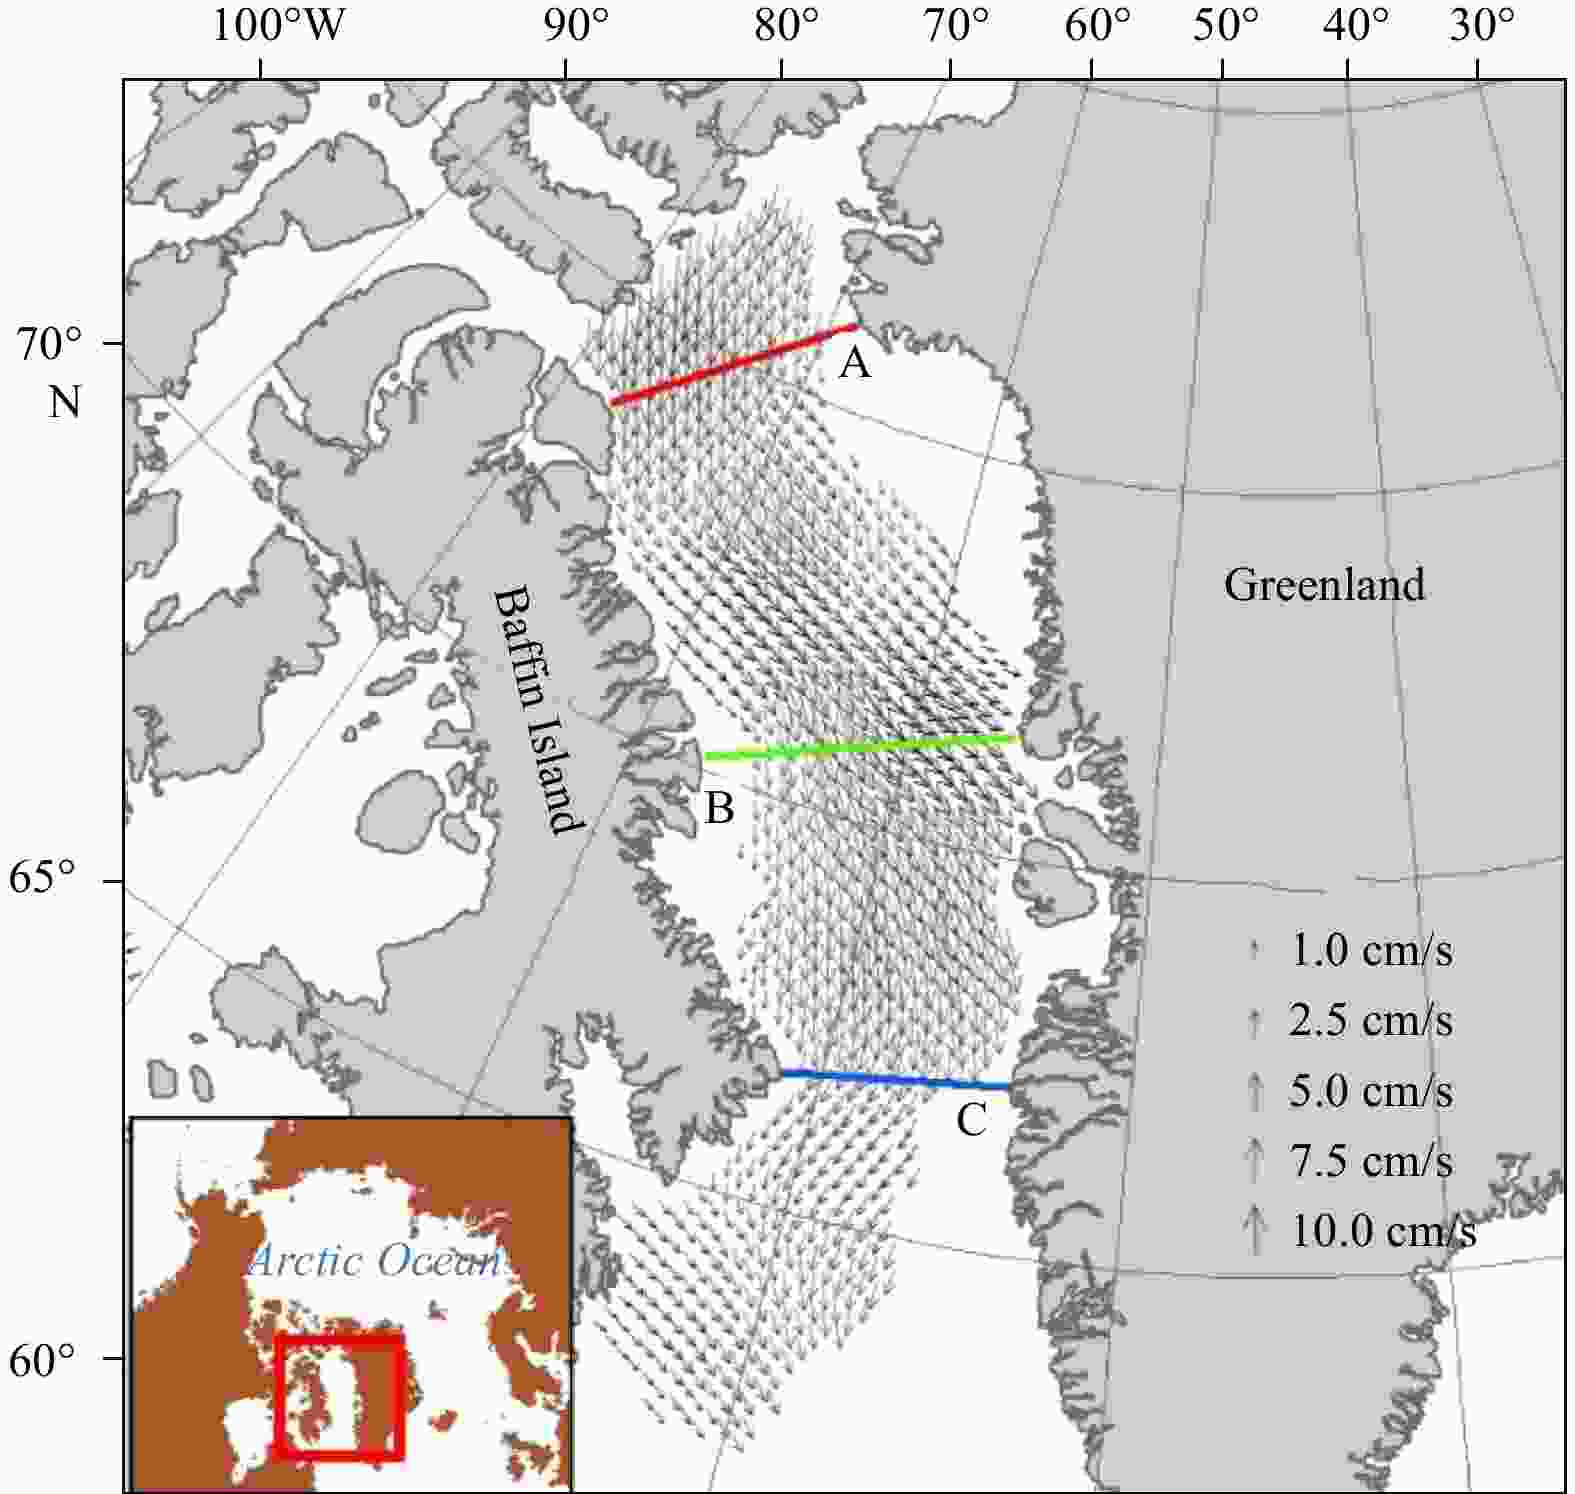
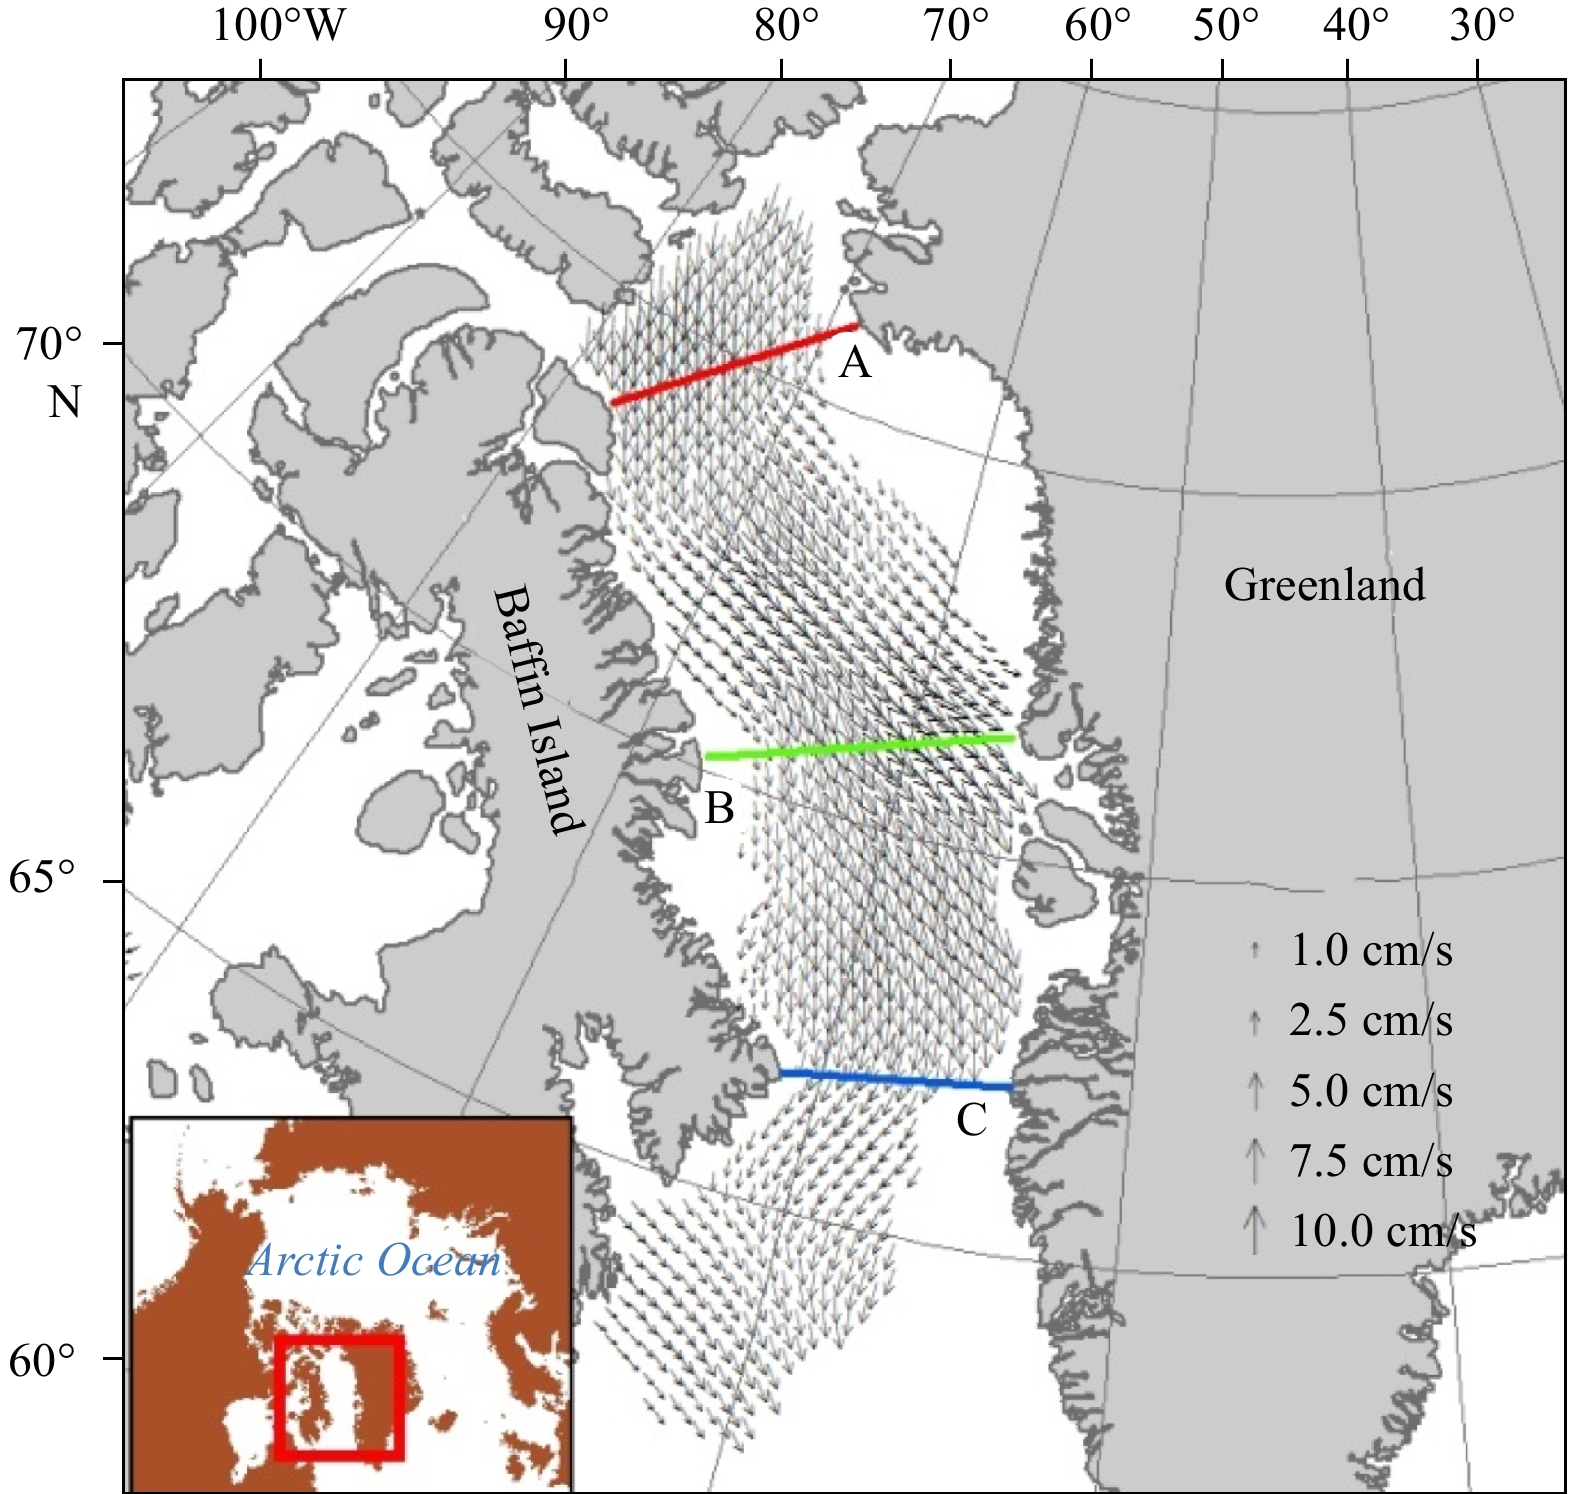
Figure 1. Locations of passages used to obtain the SIAF over the Baffin Bay. Passages A (red line), B (green line), and C (blue line) are positioned in the northern, middle, and southern sides, respectively. The inset map points to the general location of our study area from a broader view. The black arrows denote the SIM vectors. This is an example of the monthly-mean daily sea ice drift fields (March 1, 2015).
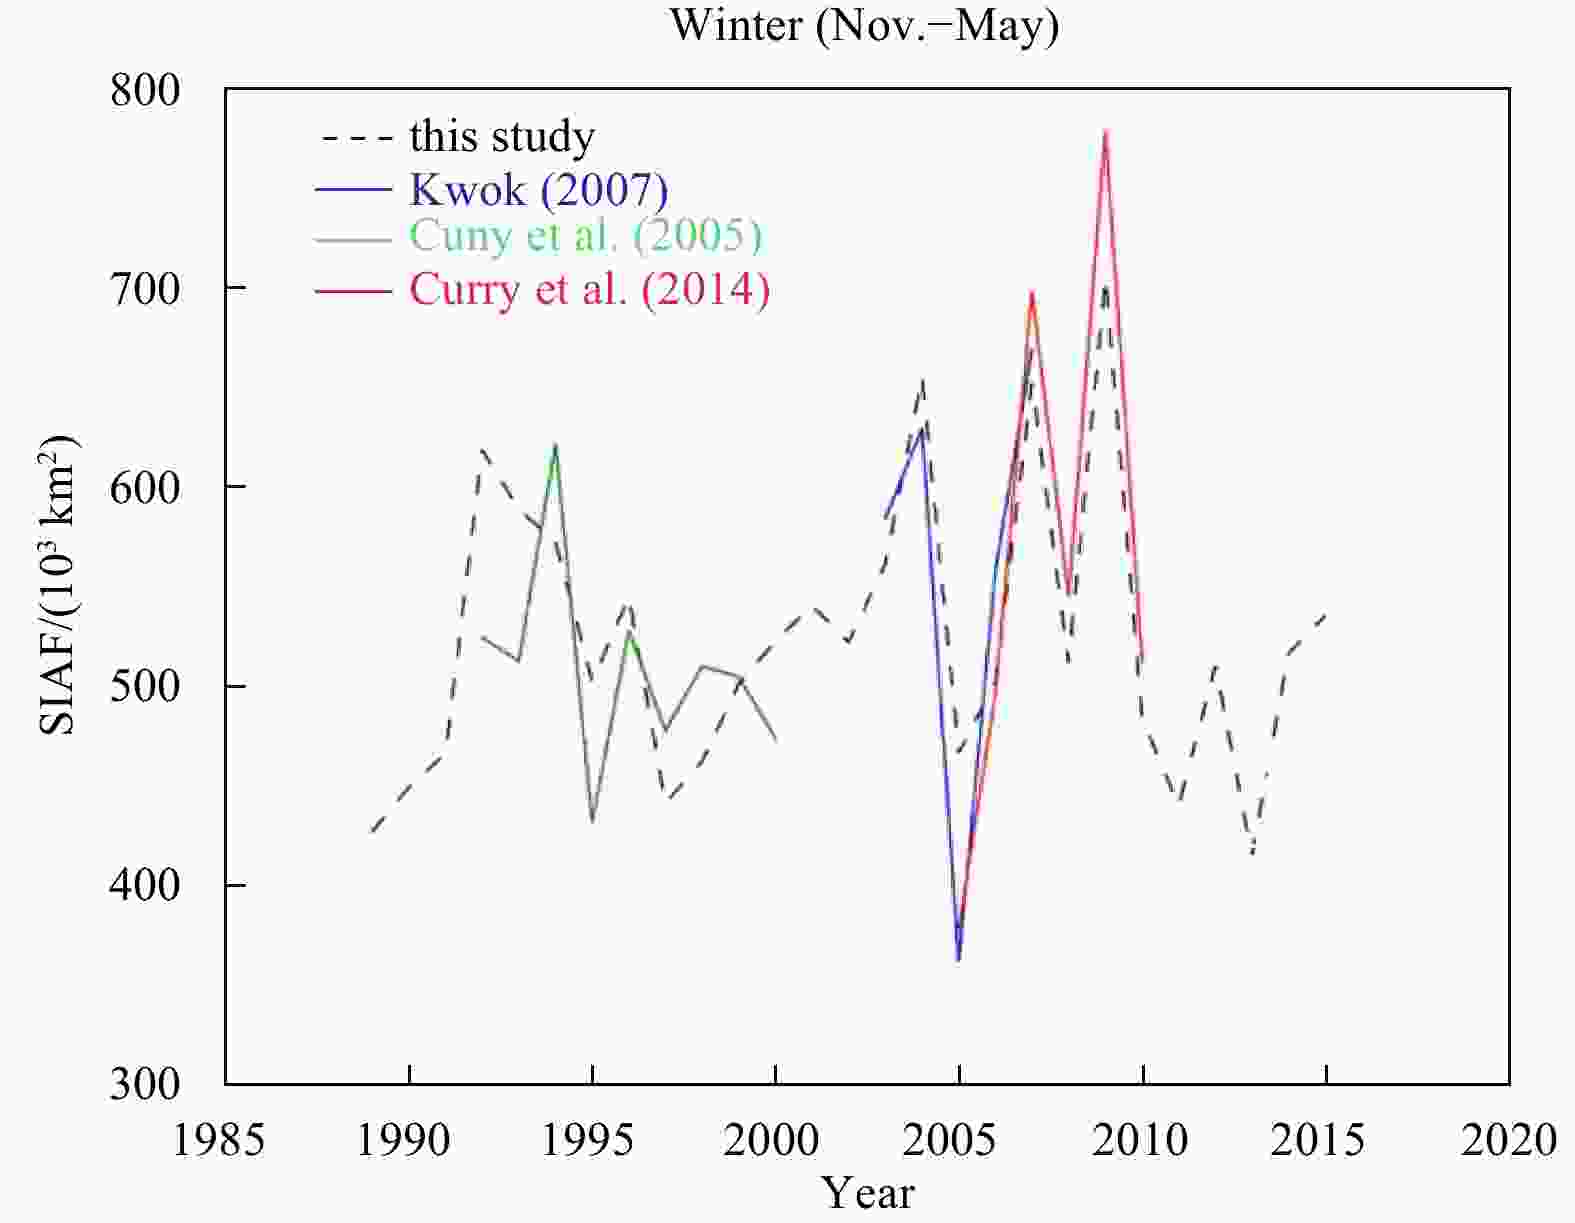
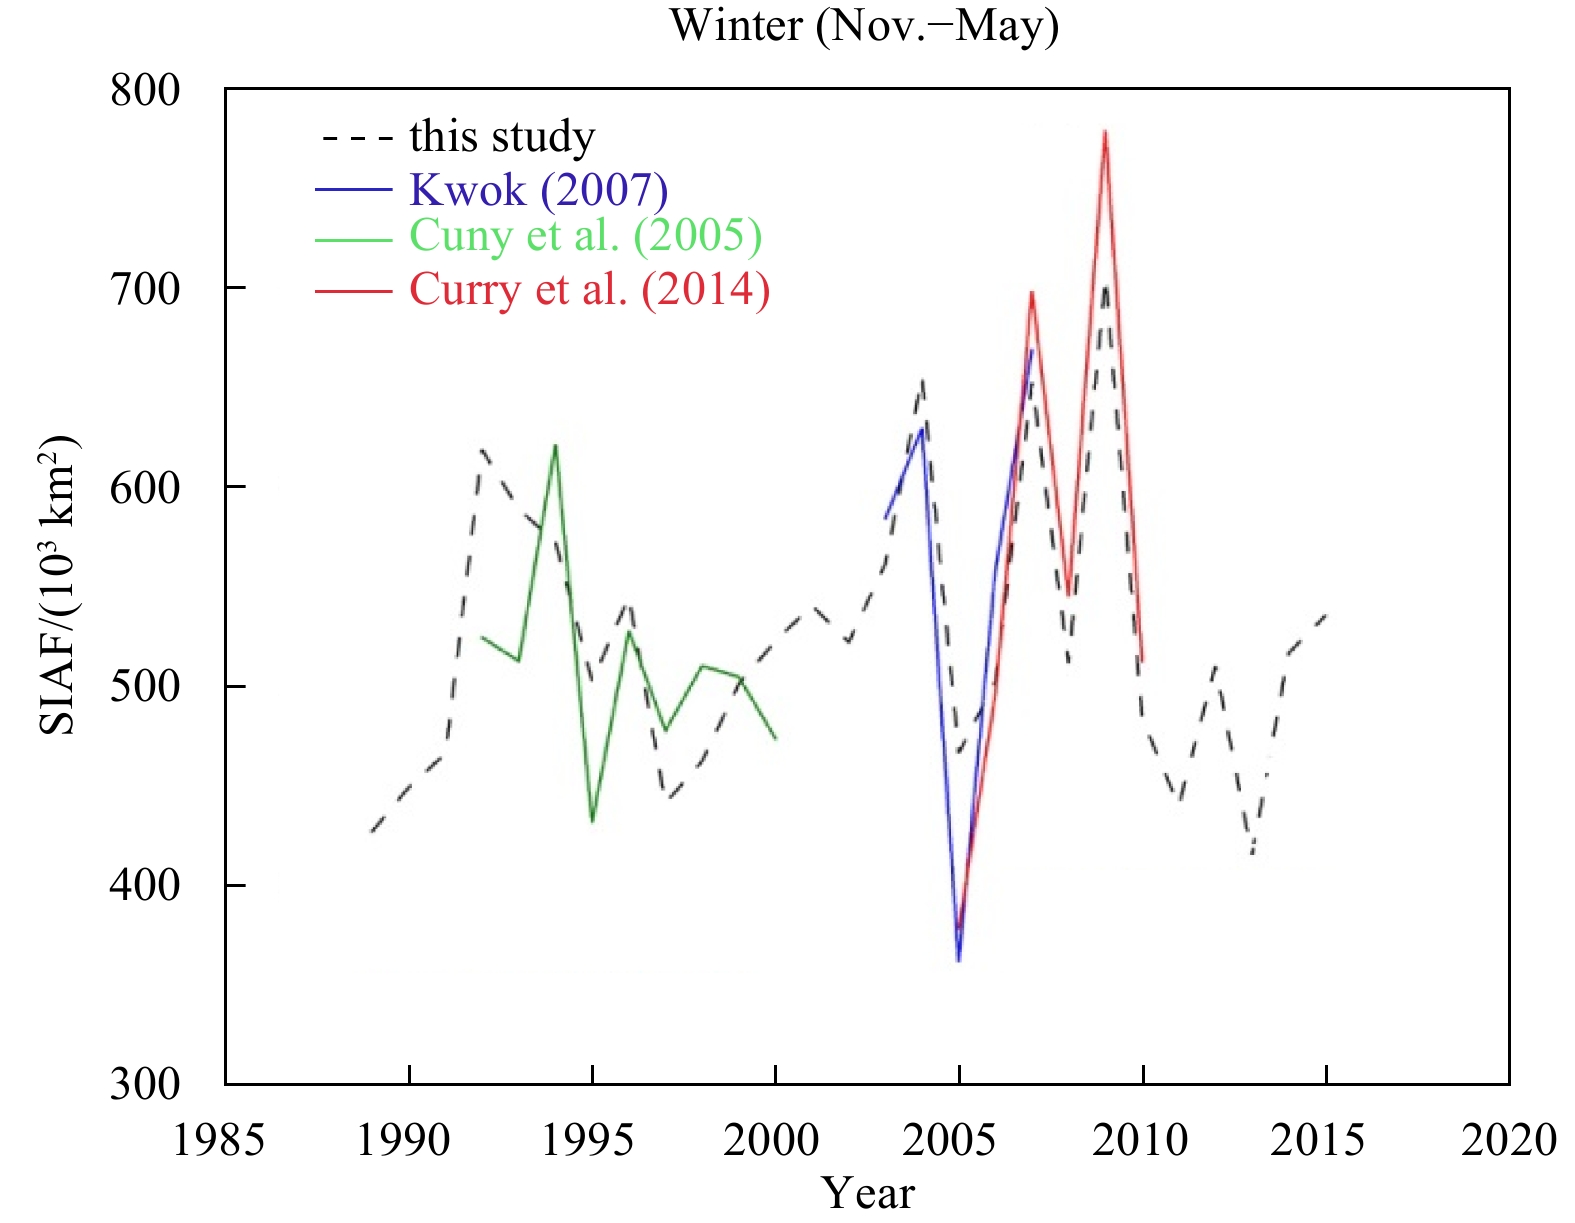
Figure 2. Comparison between NSIDC-based SIAF estimates and those from preceding studies (Cuny et al., 2005; Kwok, 2007; Curry et al., 2014).
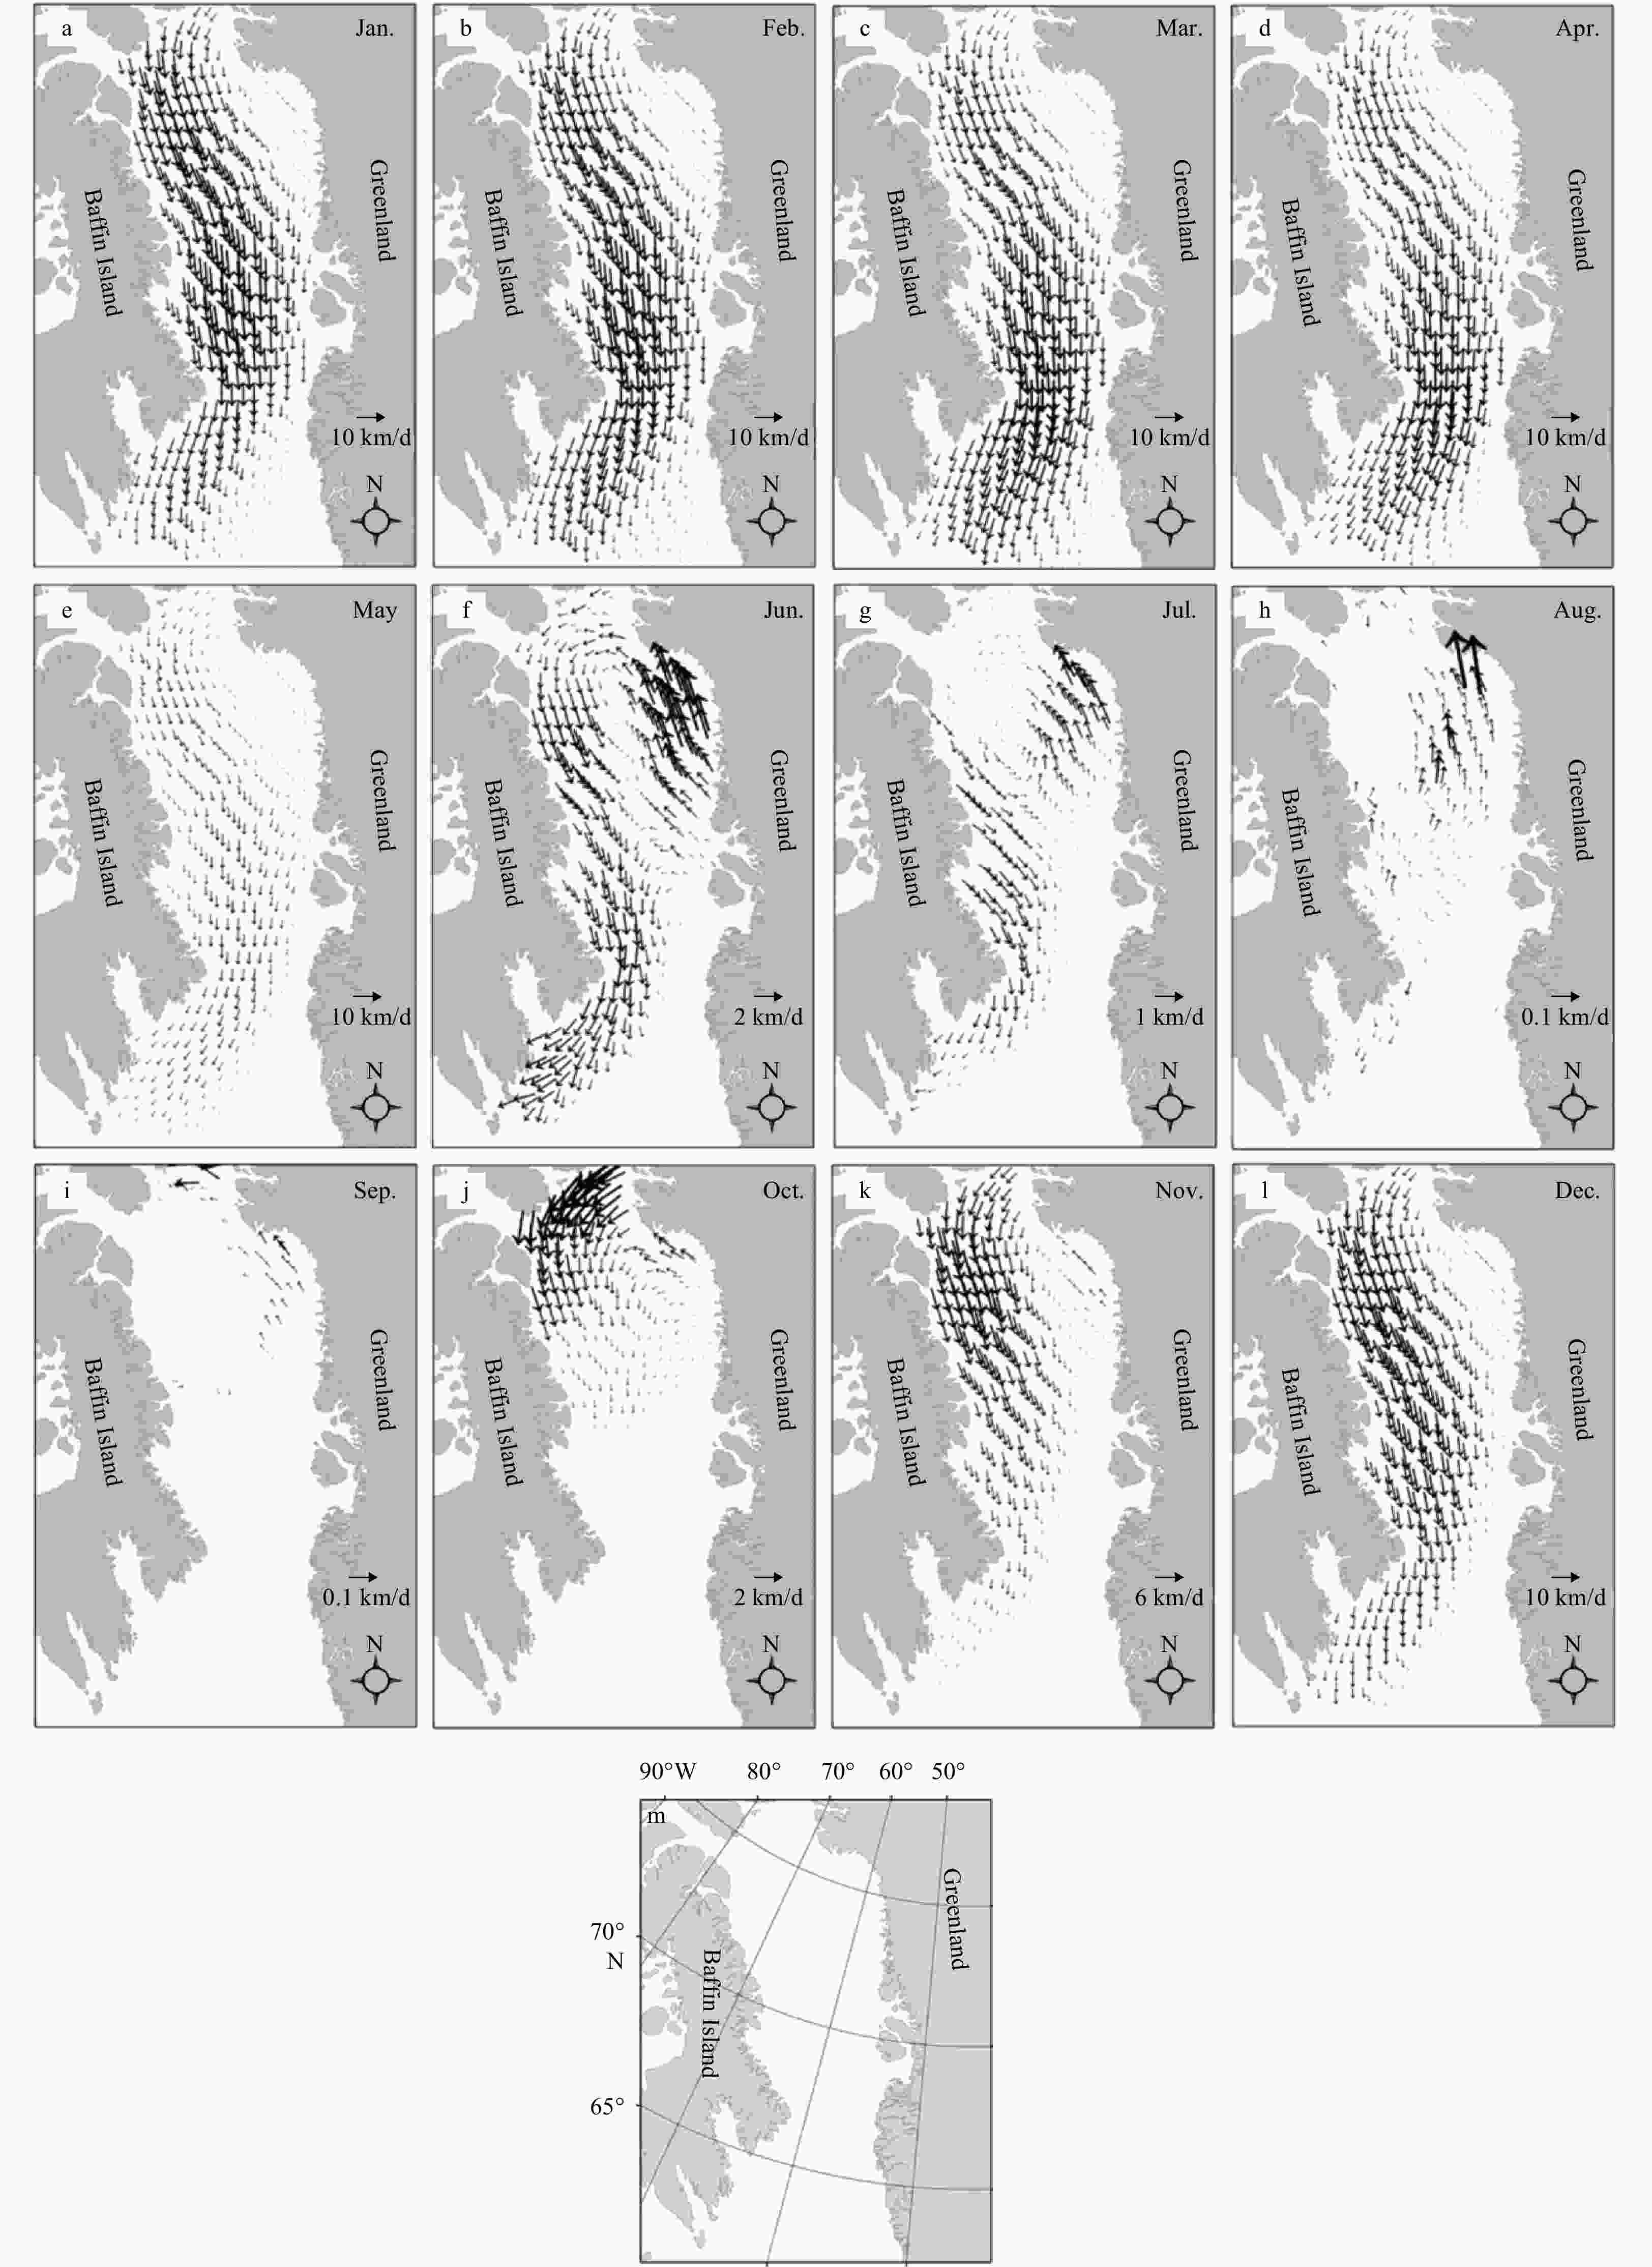
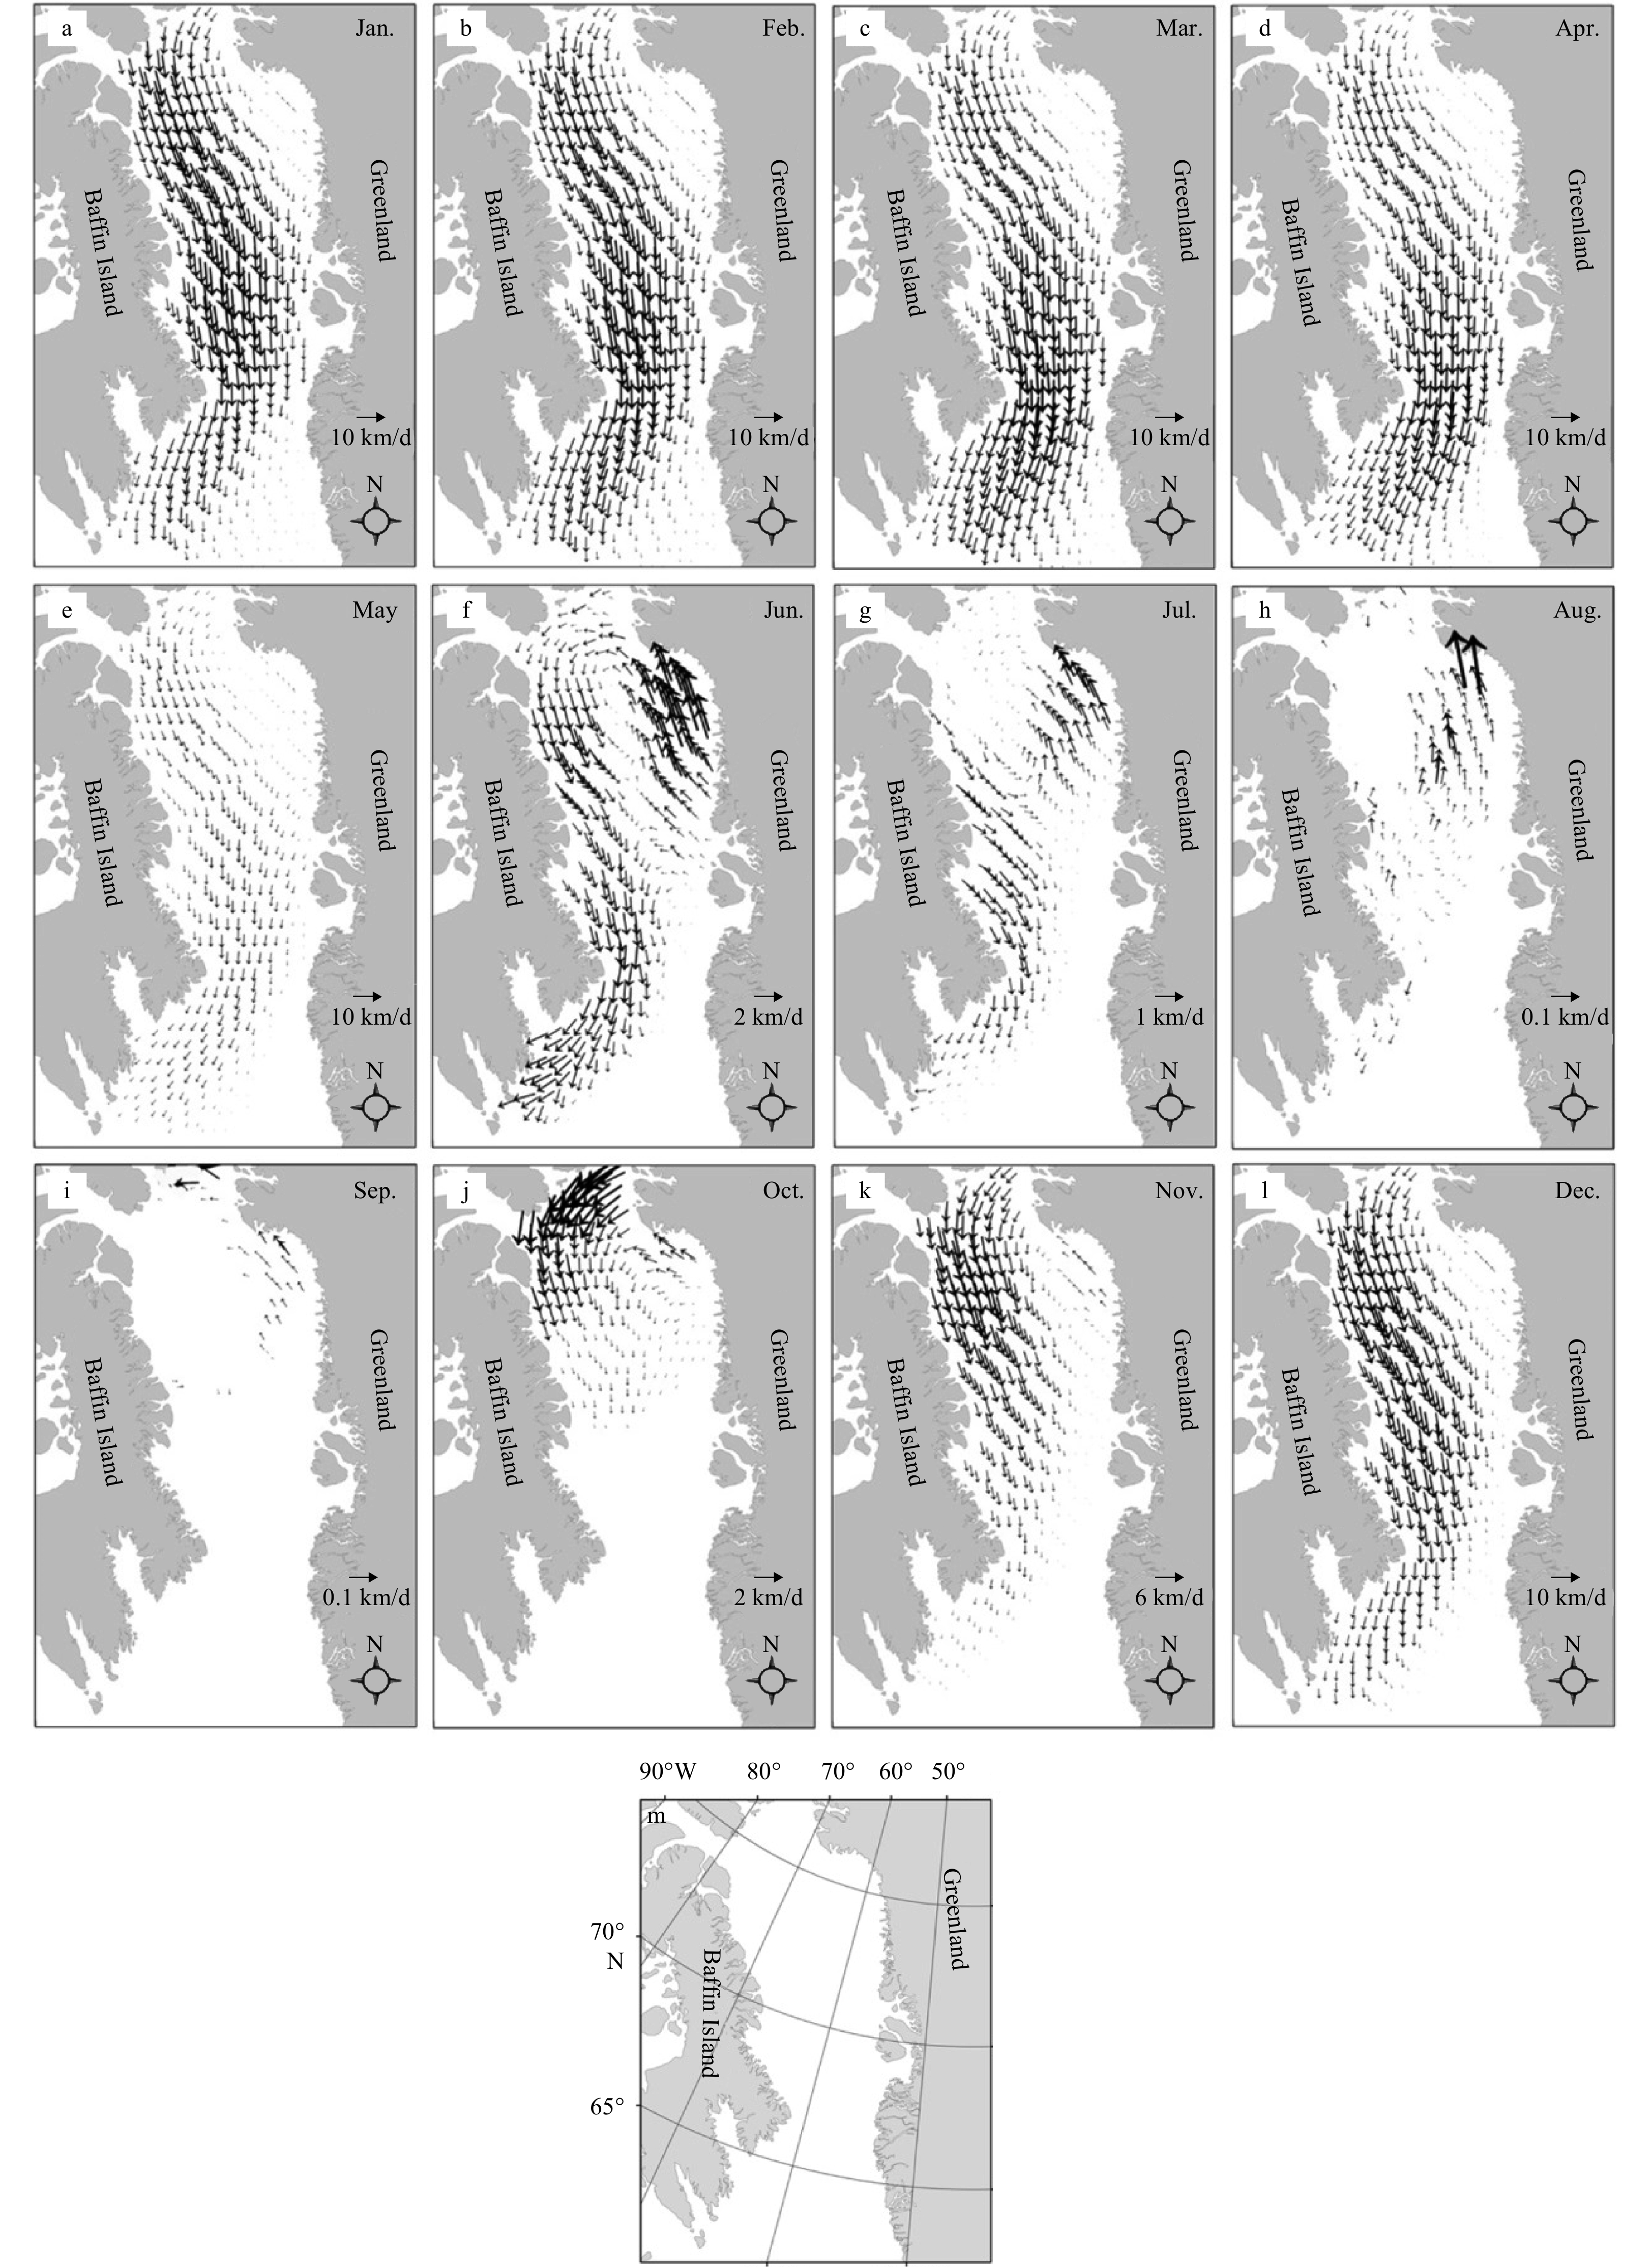
Figure 3. Monthly-mean daily sea ice motion fields over the period of 1988–2015 in the Baffin Bay area (a–l), and the longtitue and latitude ranges of the studied region (m).
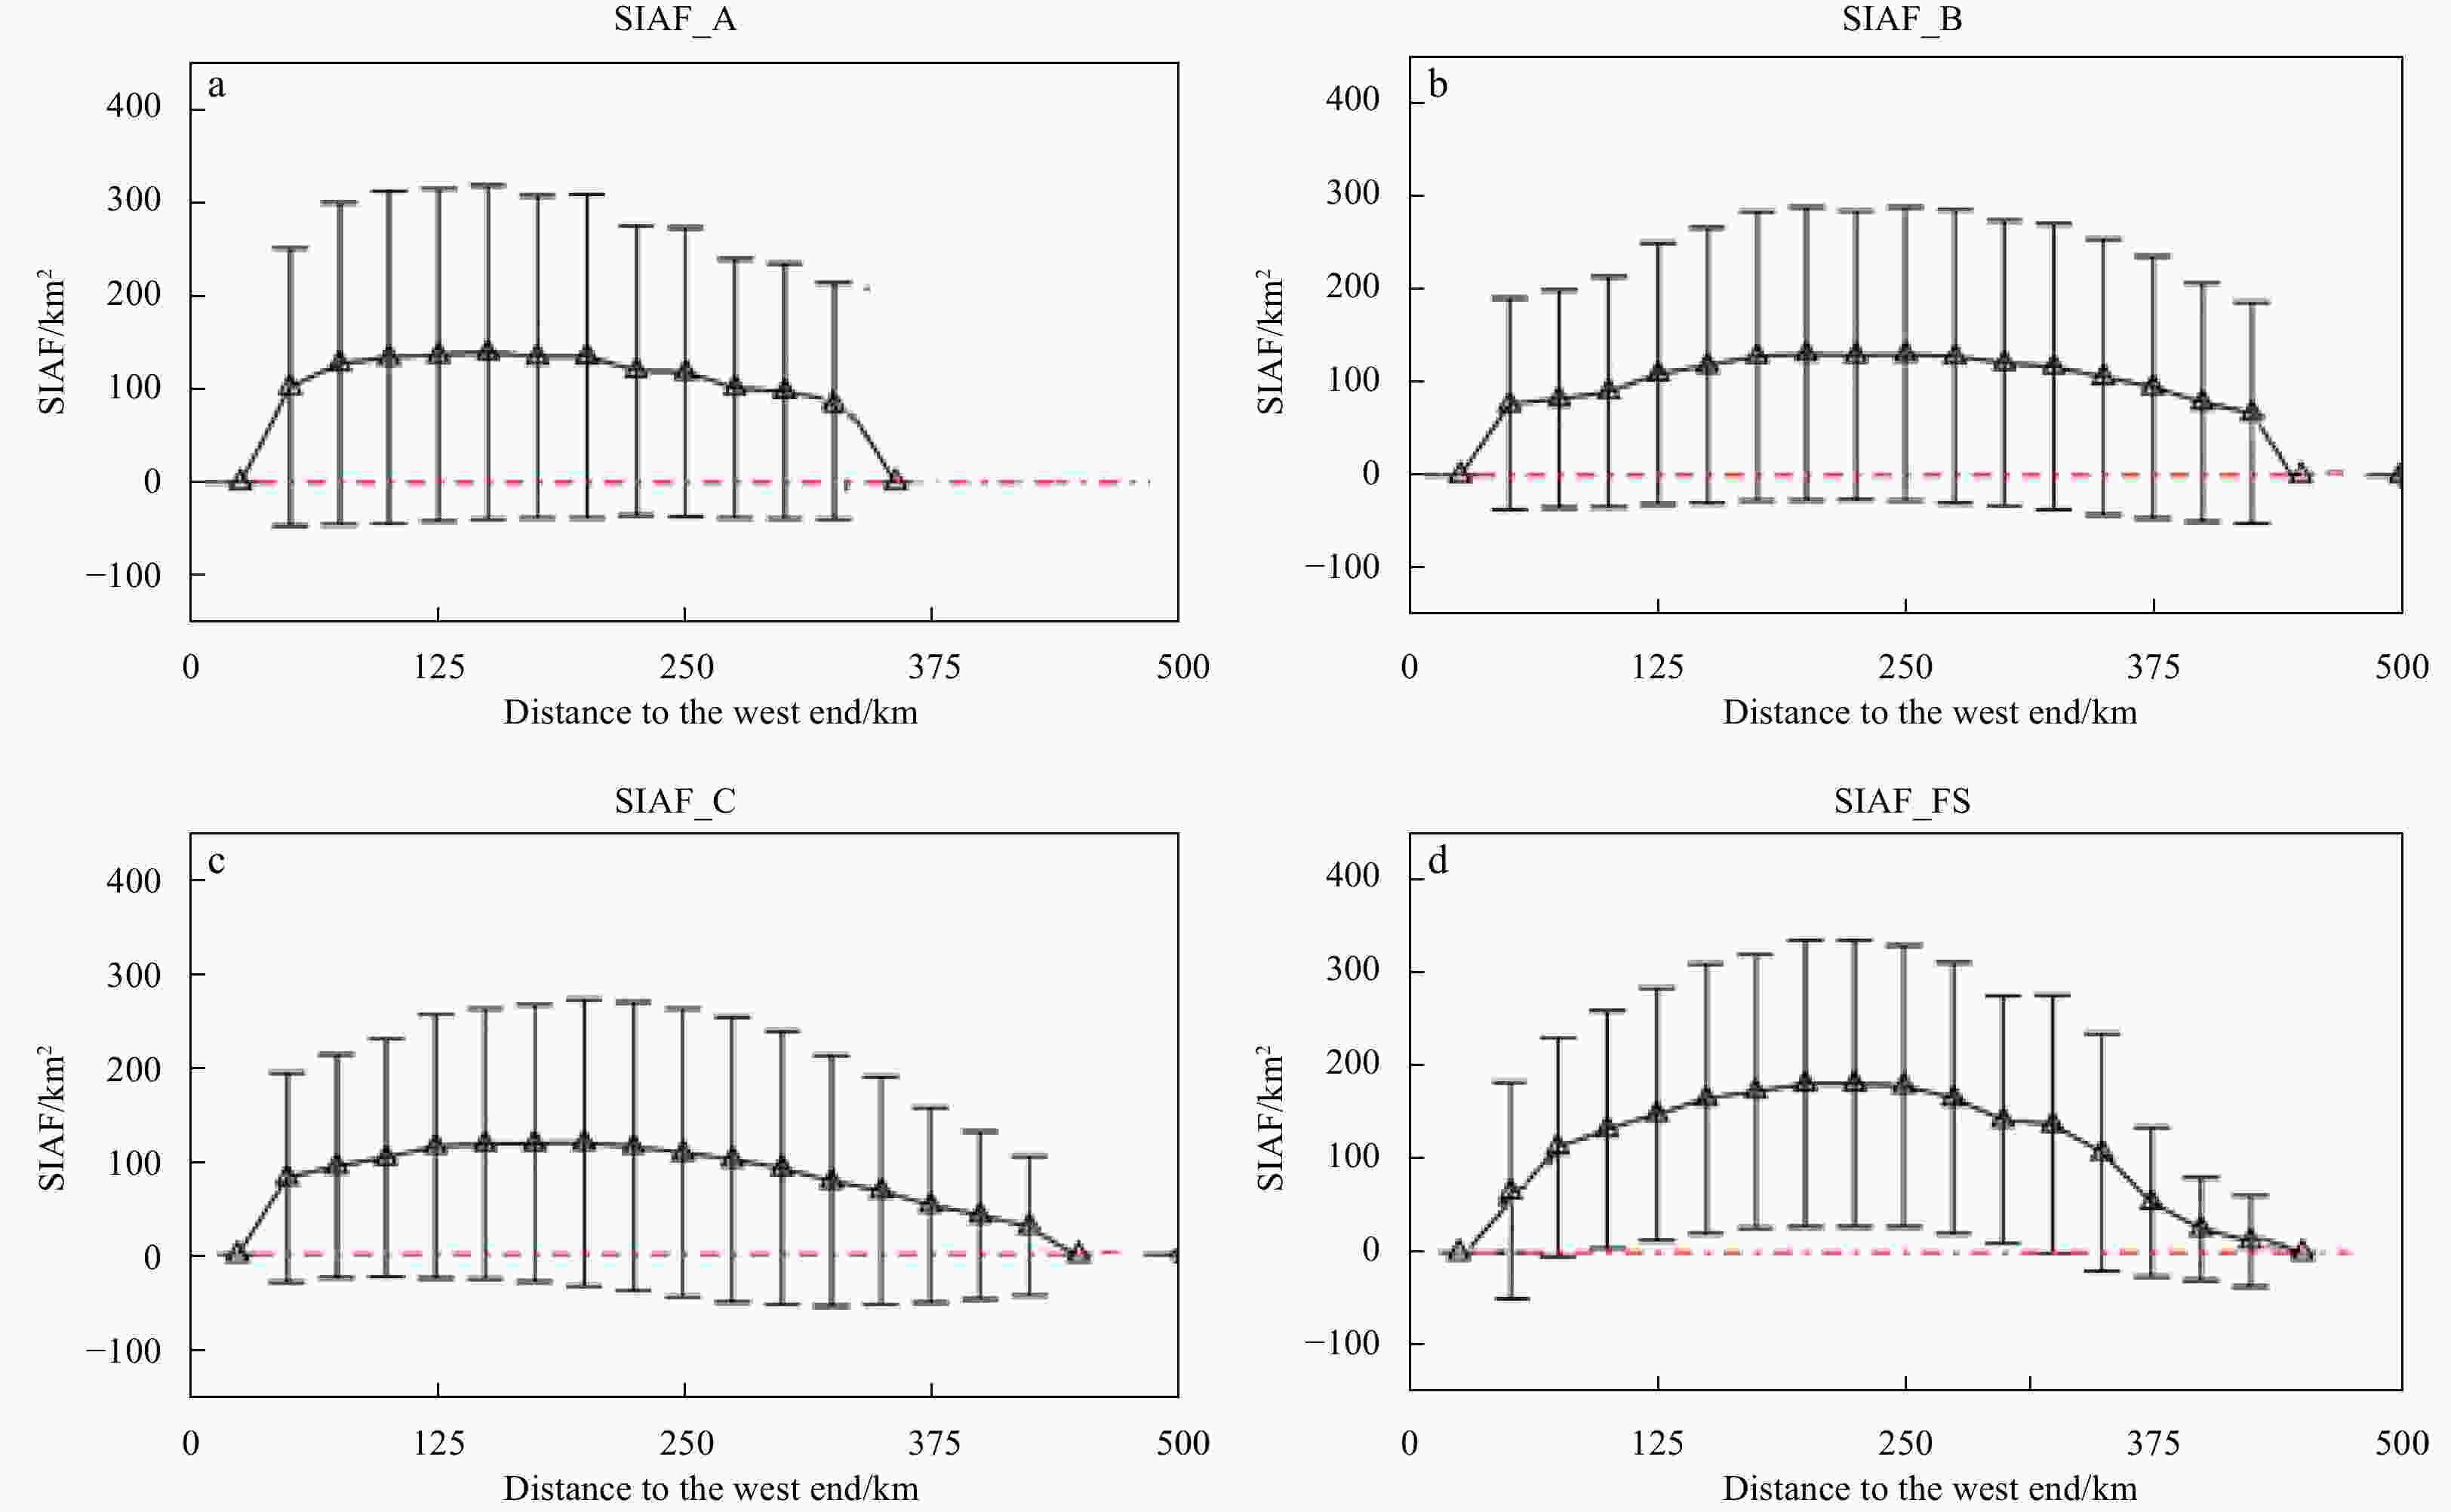
Figure 4. Cross-gate distribution of the mean SIAF for each day over the period of 1988–2015. The standard deviation bars correspond to the variability of the daily SIAF estimates for the studied period. SIAF_A, SIAF_B, SIAF_C, and SIAF_FS denote the SIAF via the different Baffin Bay passages (A, B, and C) and Fram Strait, respectively.

Figure 5. Daily SIAF for different passages averaged over the period of 1988–2015. The SIAF through Passages A, B, and C in the Baffin Bay, and the FS are indicated in Figs 5a–d. The thin black line denotes the average daily SIAF through each passage, and the thick black line corresponds to the 30-day smoothed fields. The red and blue lines denote the 30-day smoothed SIAF fields for the periods before and after 2000, respectively.
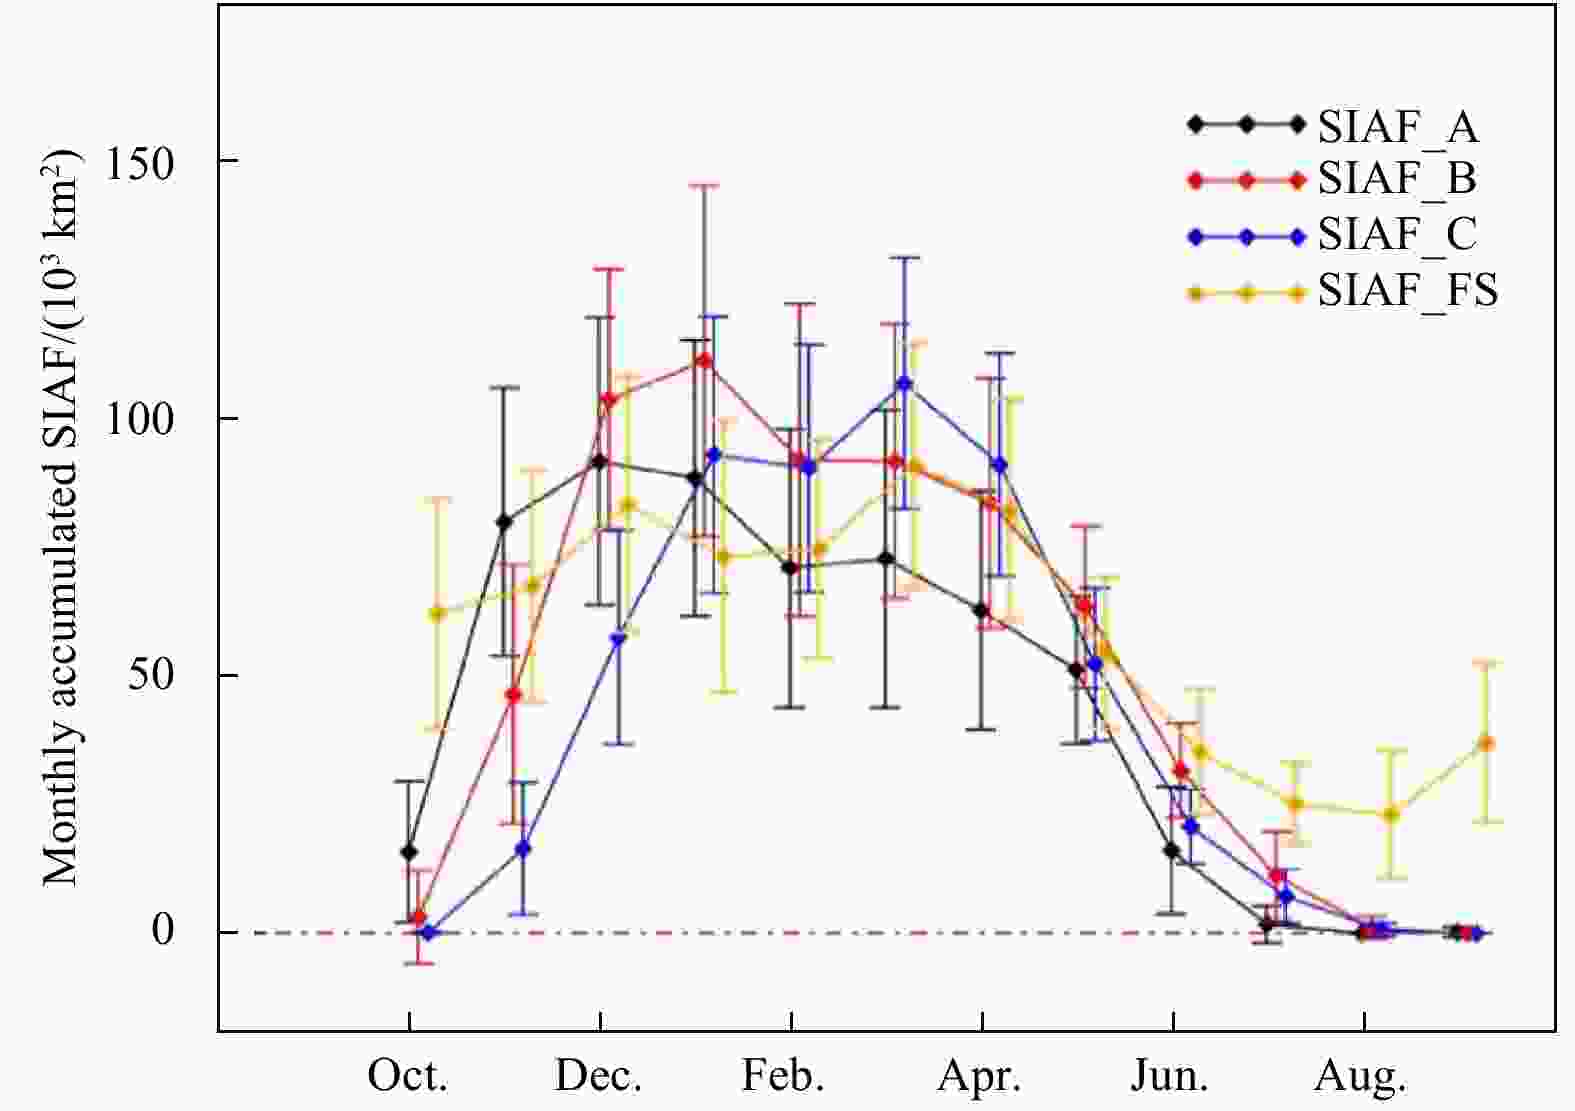
Figure 6. Monthly accumulated SIAF for different passages averaged over the period of 1988–2015. Error bars correspond to the standard deviations of the monthly accumulated SIAF for the studied period.
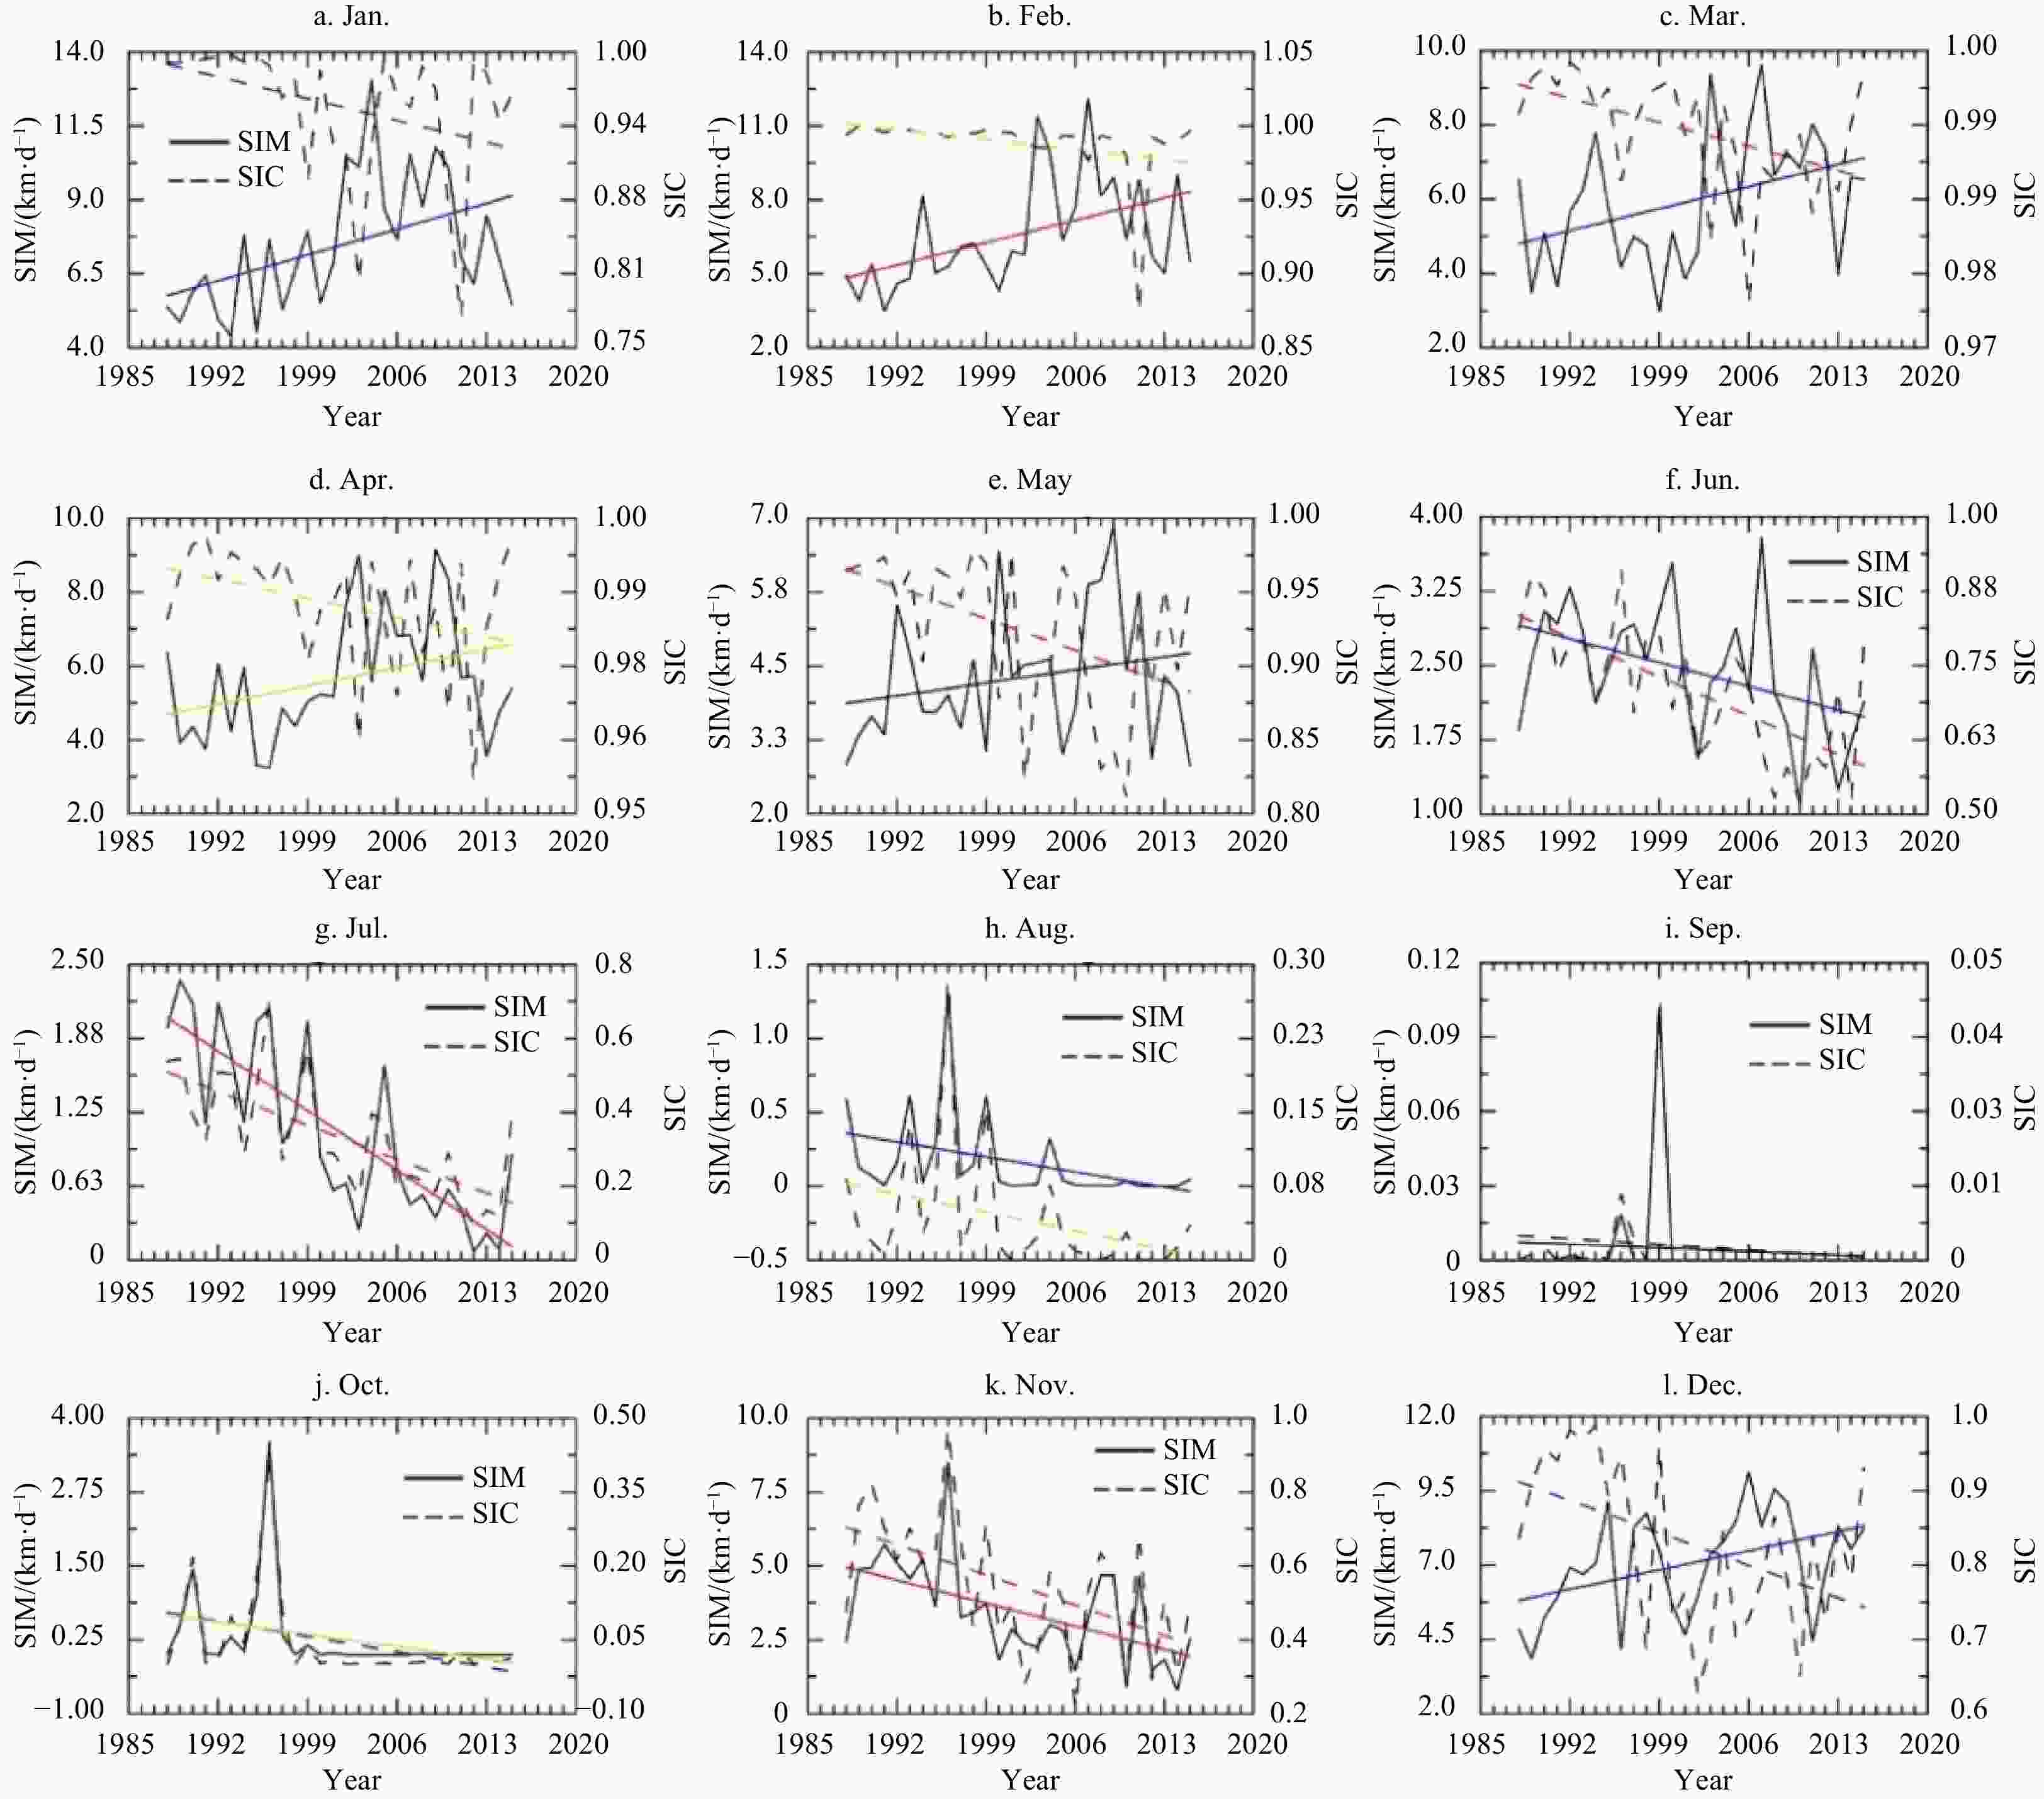
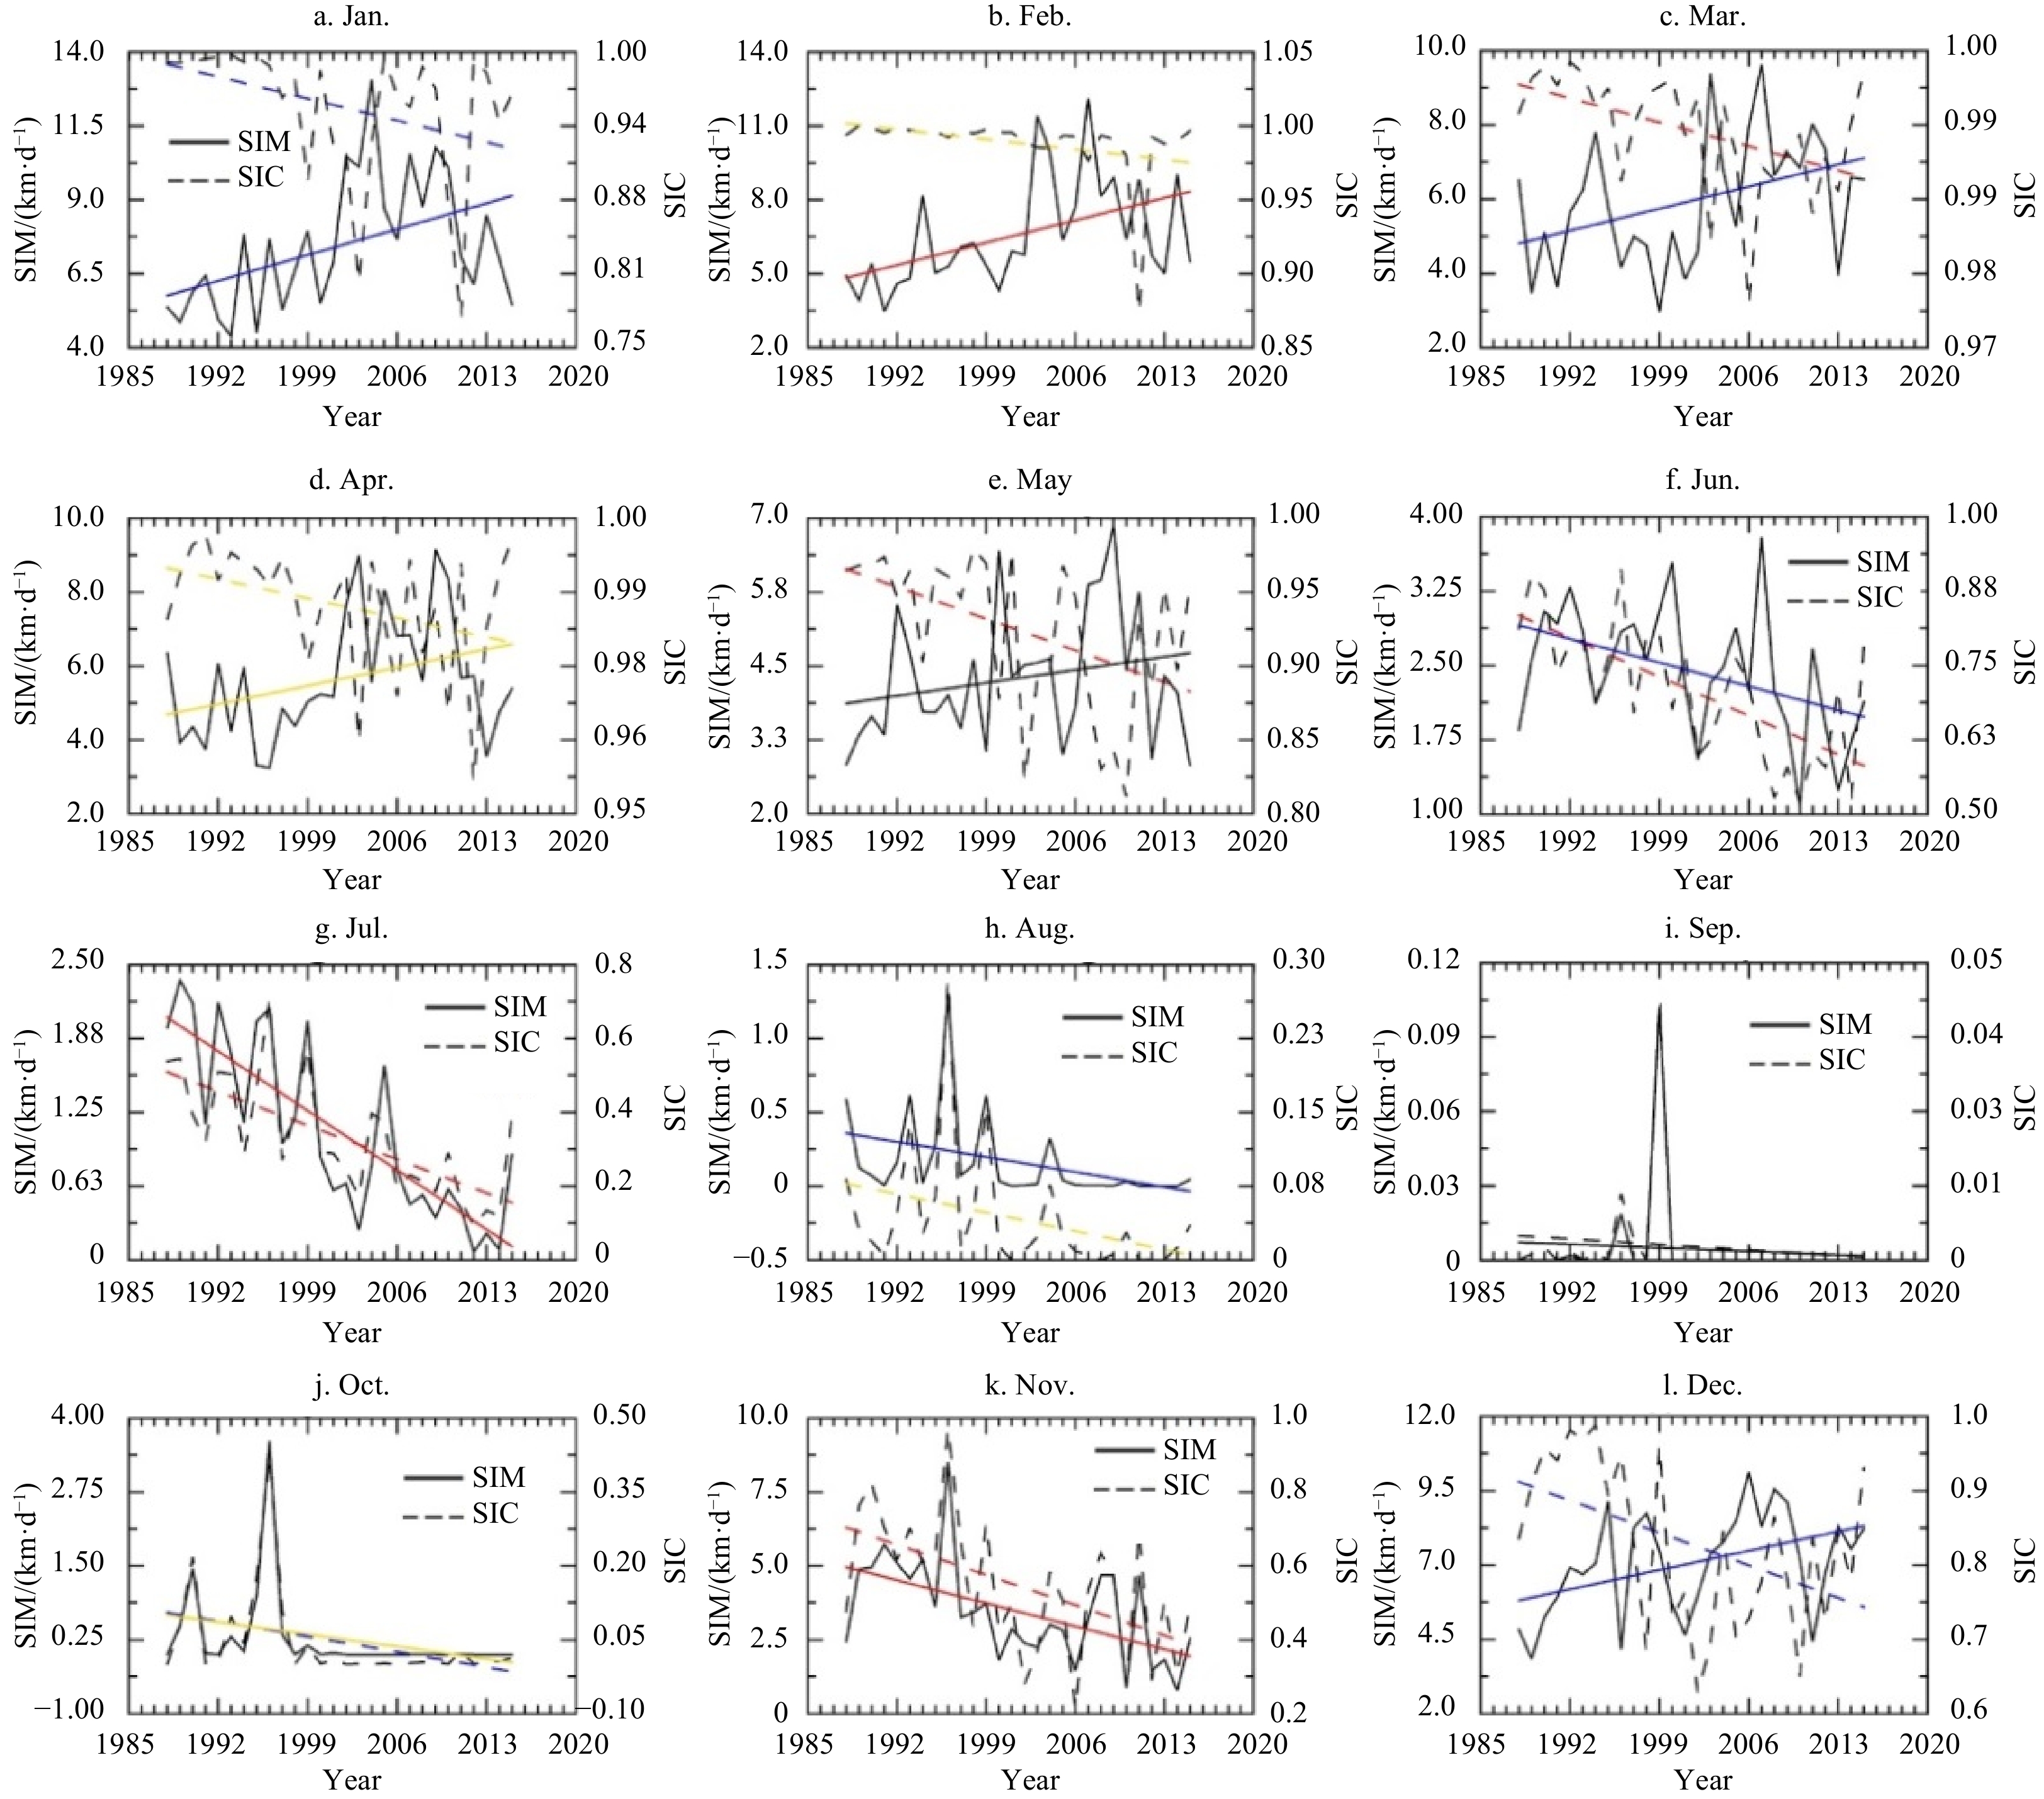
Figure 8. Time series for the monthly mean SIM (bold line) and SIC (dash line) fields at Passage B. The trend line plot is added, with red, blue, and gold color denoting the significance levels at 99%, 95%, and 90%, respectively. The black line represents the trend that is not statistically significant.
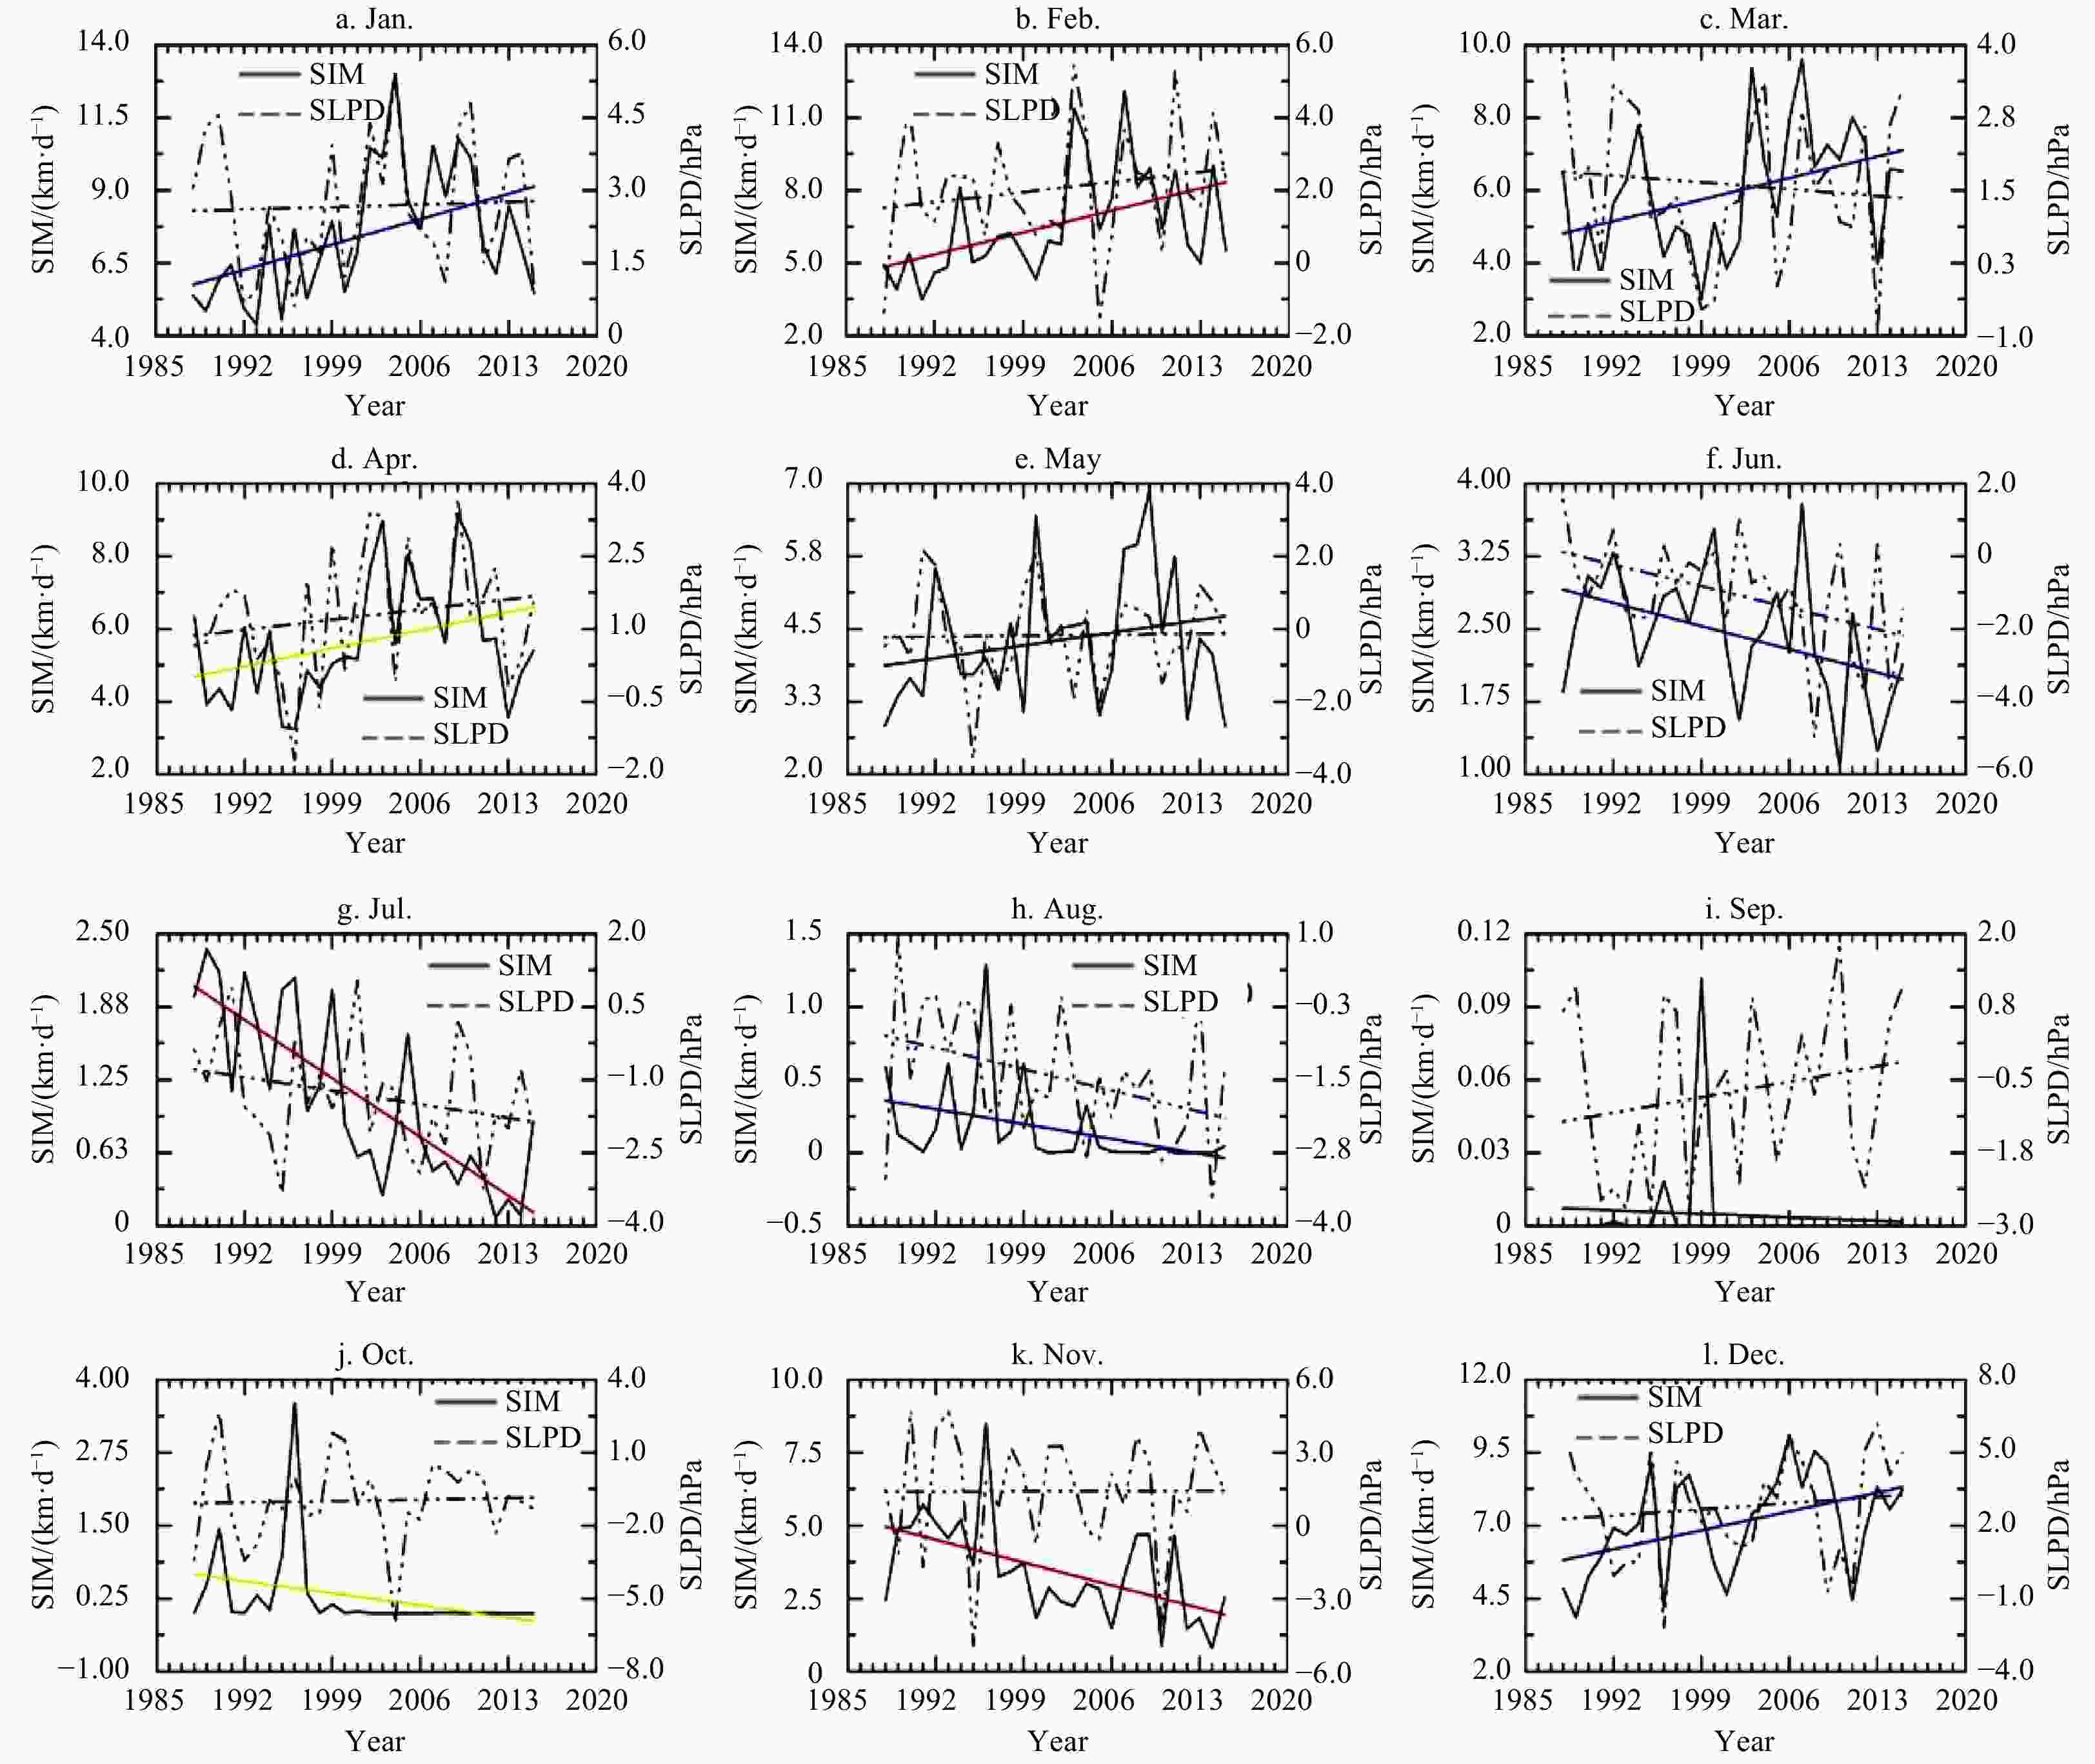
Figure 9. Time series of the monthly mean SIM fields (bold line) together with cross-gate sea level pressure difference (SLPD, dash line) at Passage B. The linearly fitted trend is also shown. The red, blue, and gold color indicates a significance at the 99%, 95%, 90% levels, respectively. The black linear line represents the trend that is not statistically significant.
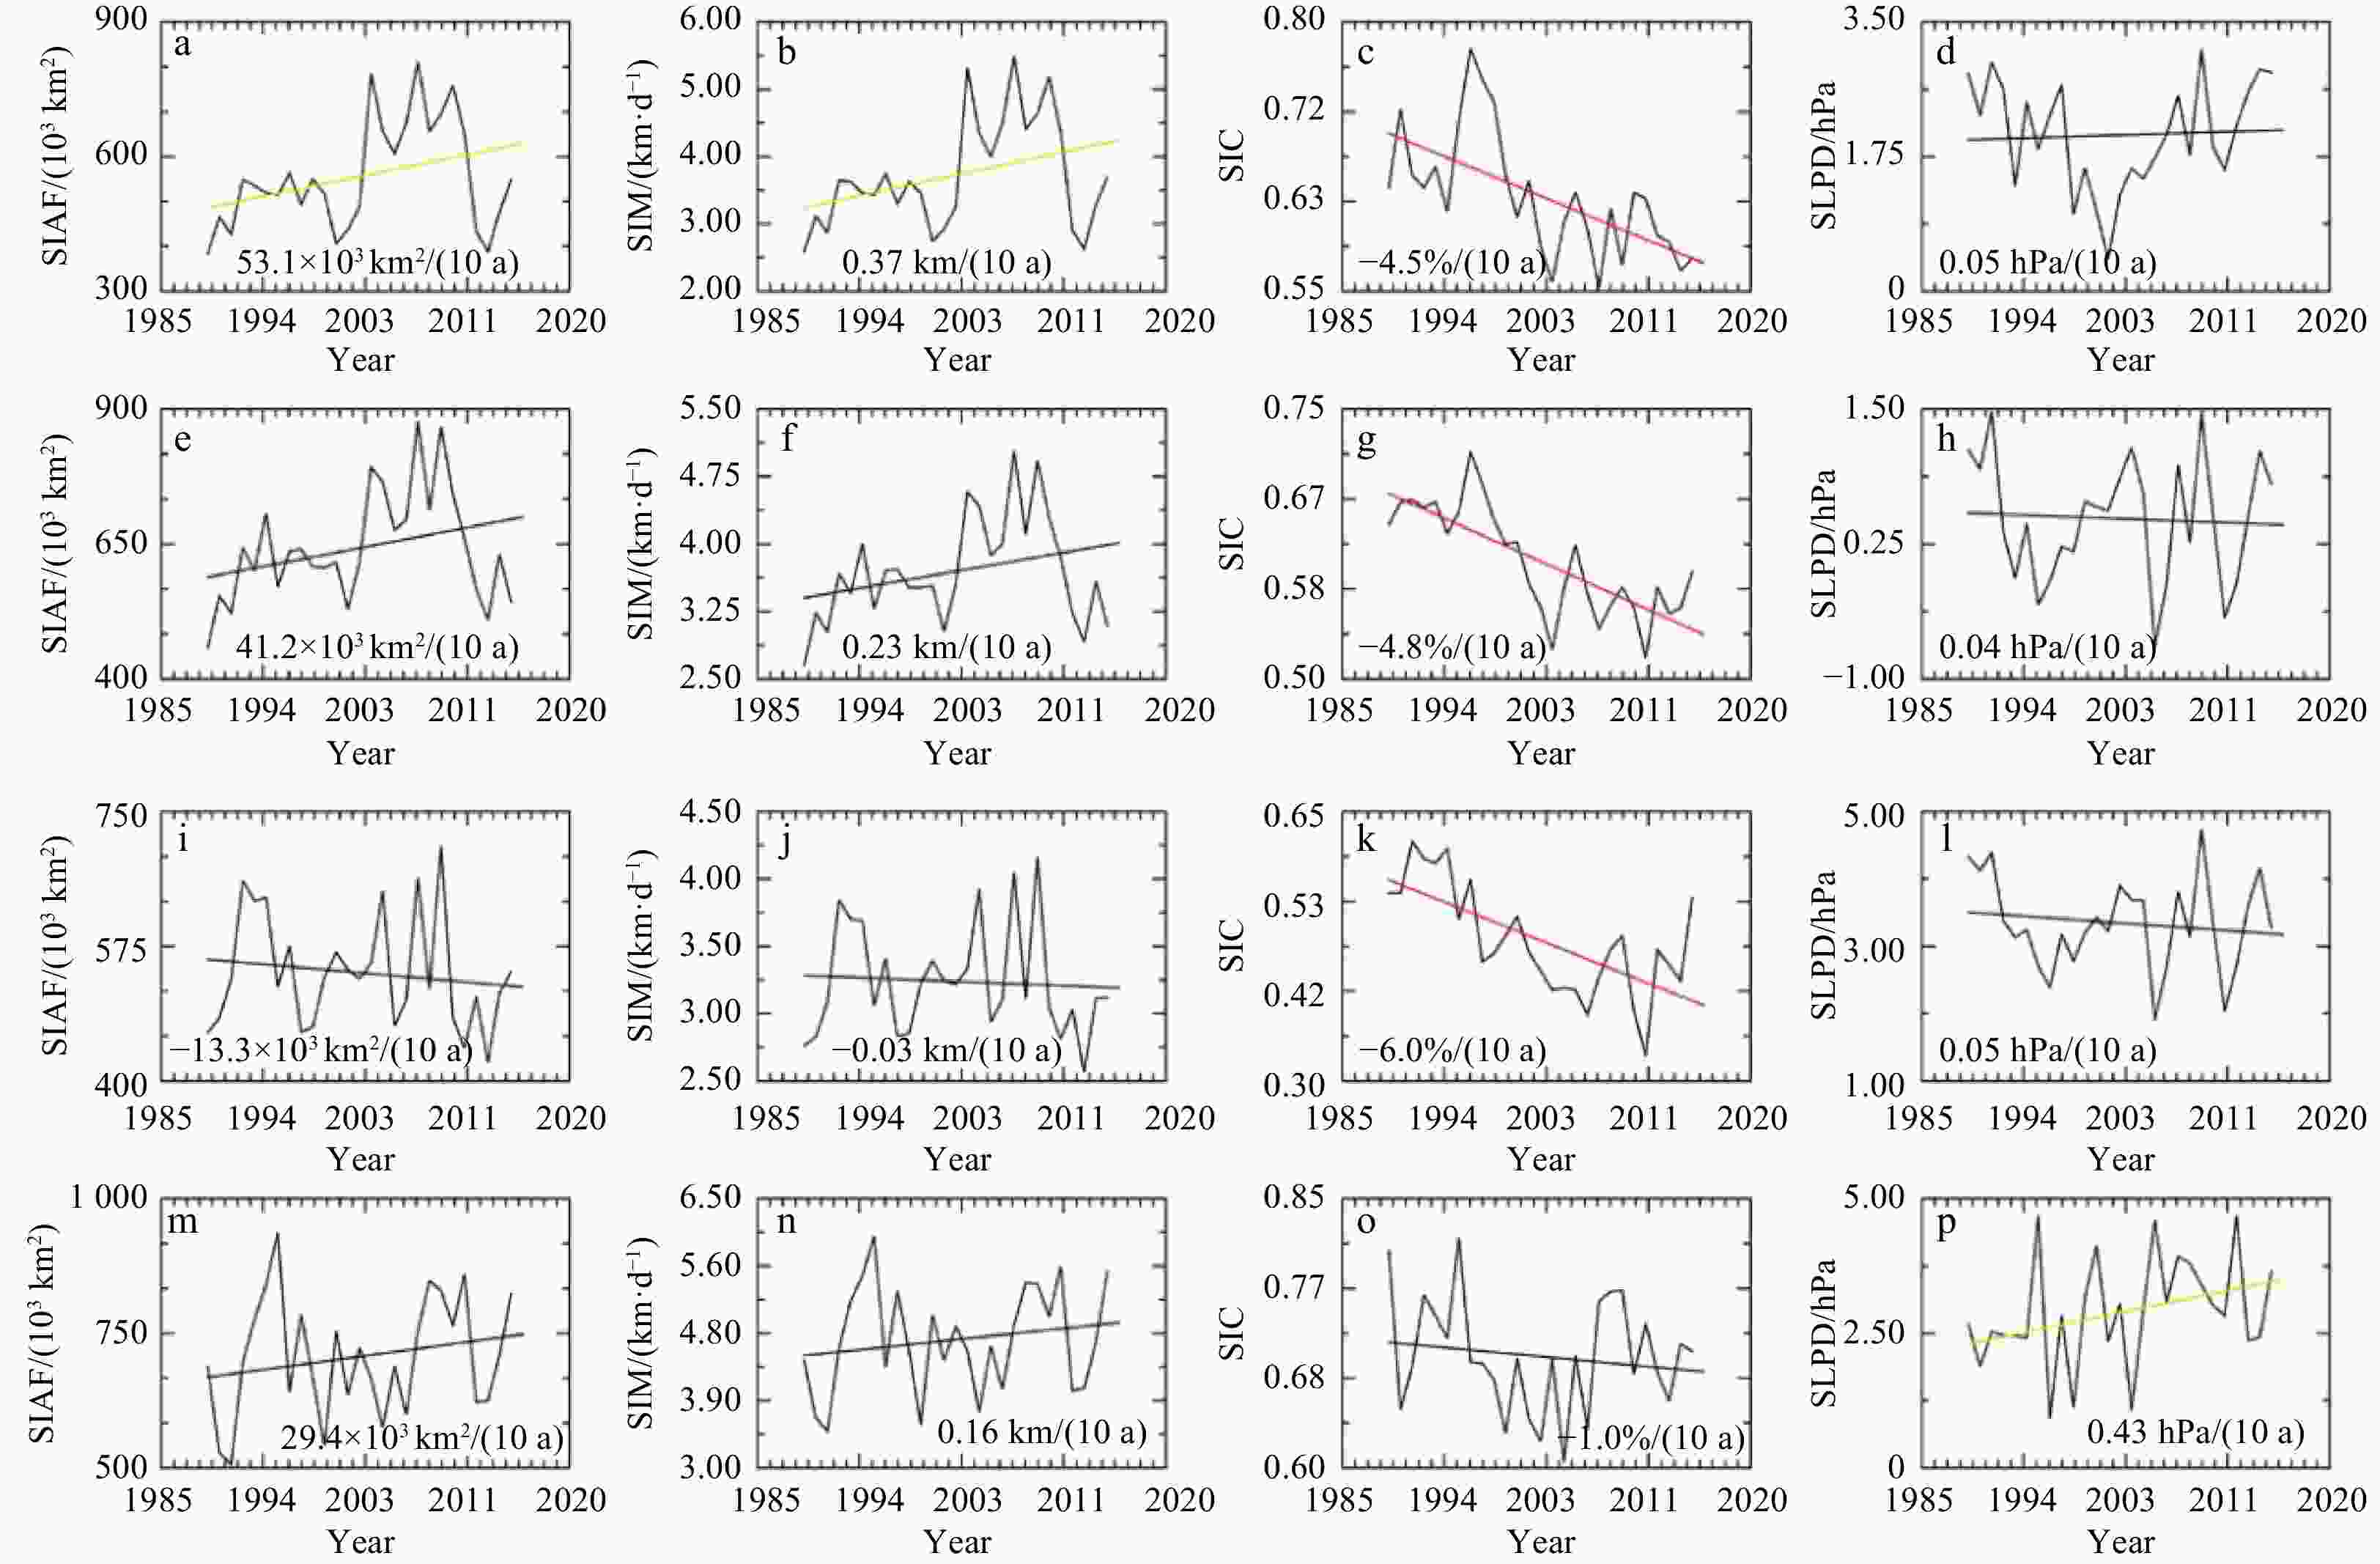
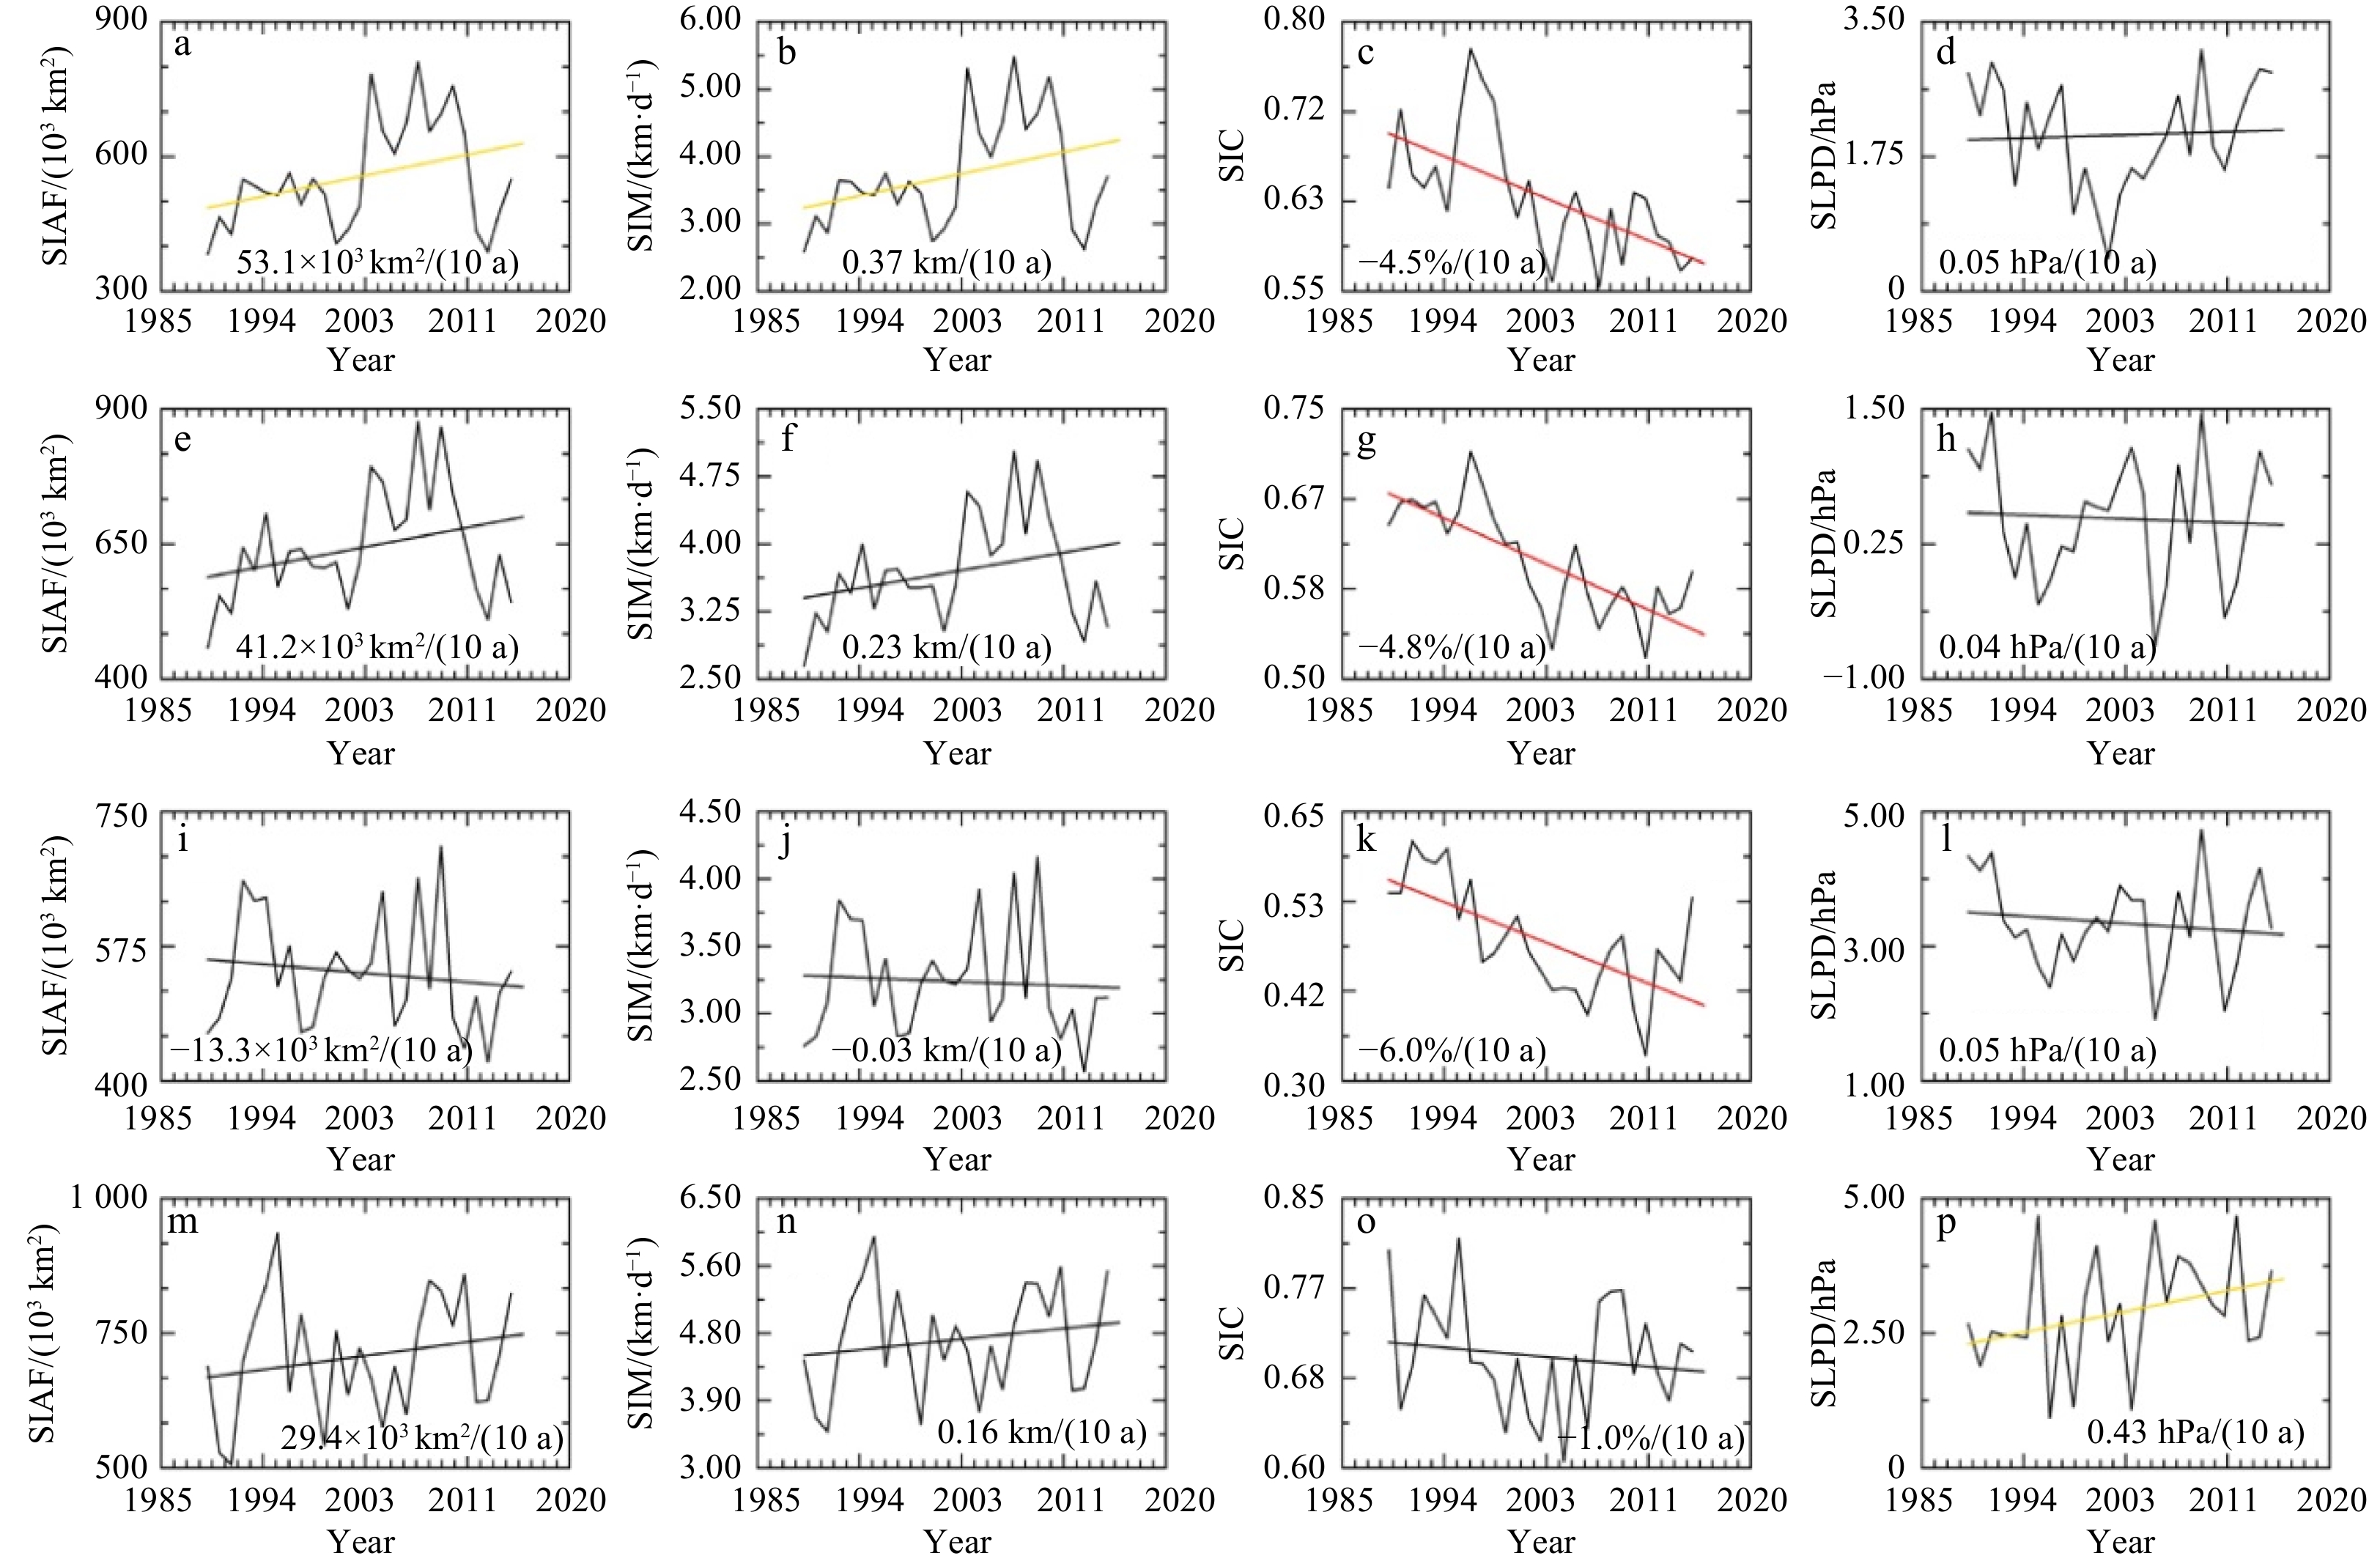
Figure 10. Time series for the annual SIAF (October to following September) through different passages. The x-axis label denotes the year of September. For example, the year “1994” indicates the annual cycle from October to the following September in 1993/1994. The annual mean SIM, SIC, and SLPD fields are also given in the second, third, and fourth columns, respectively. The Linearly fitted trend is marked by the red, blue, and gold lines, corresponding to the significance levels at 99%, 95%, 90%, respectively.

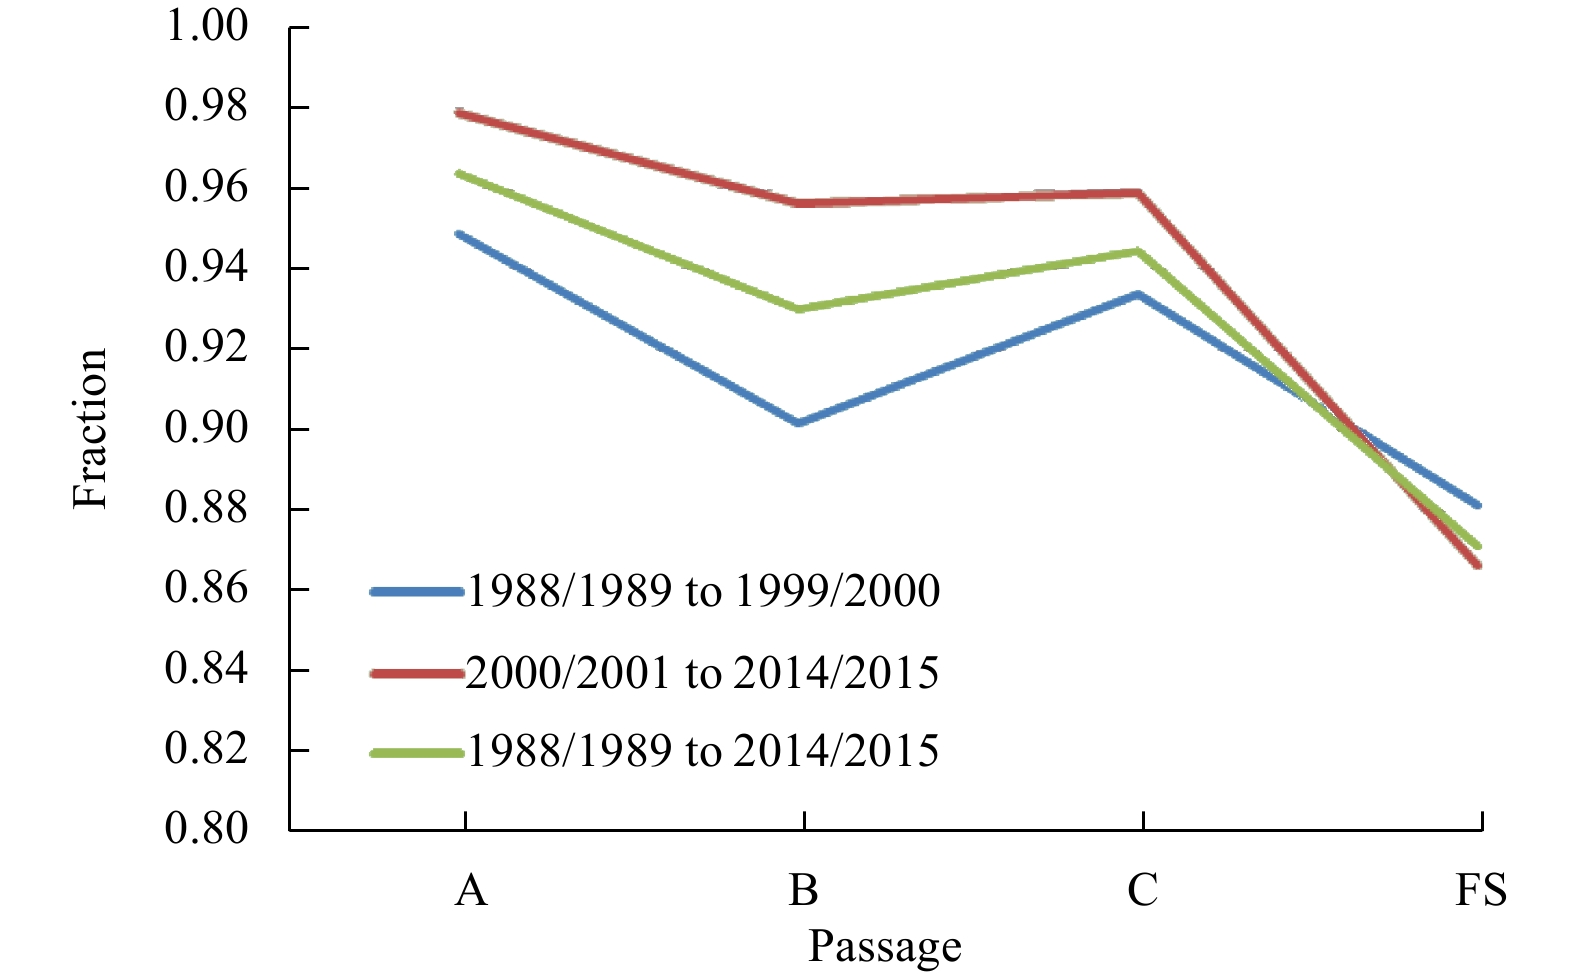
Figure 11. The fraction of winter SIAF relative to the annual SIAF for different periods through varying passages.
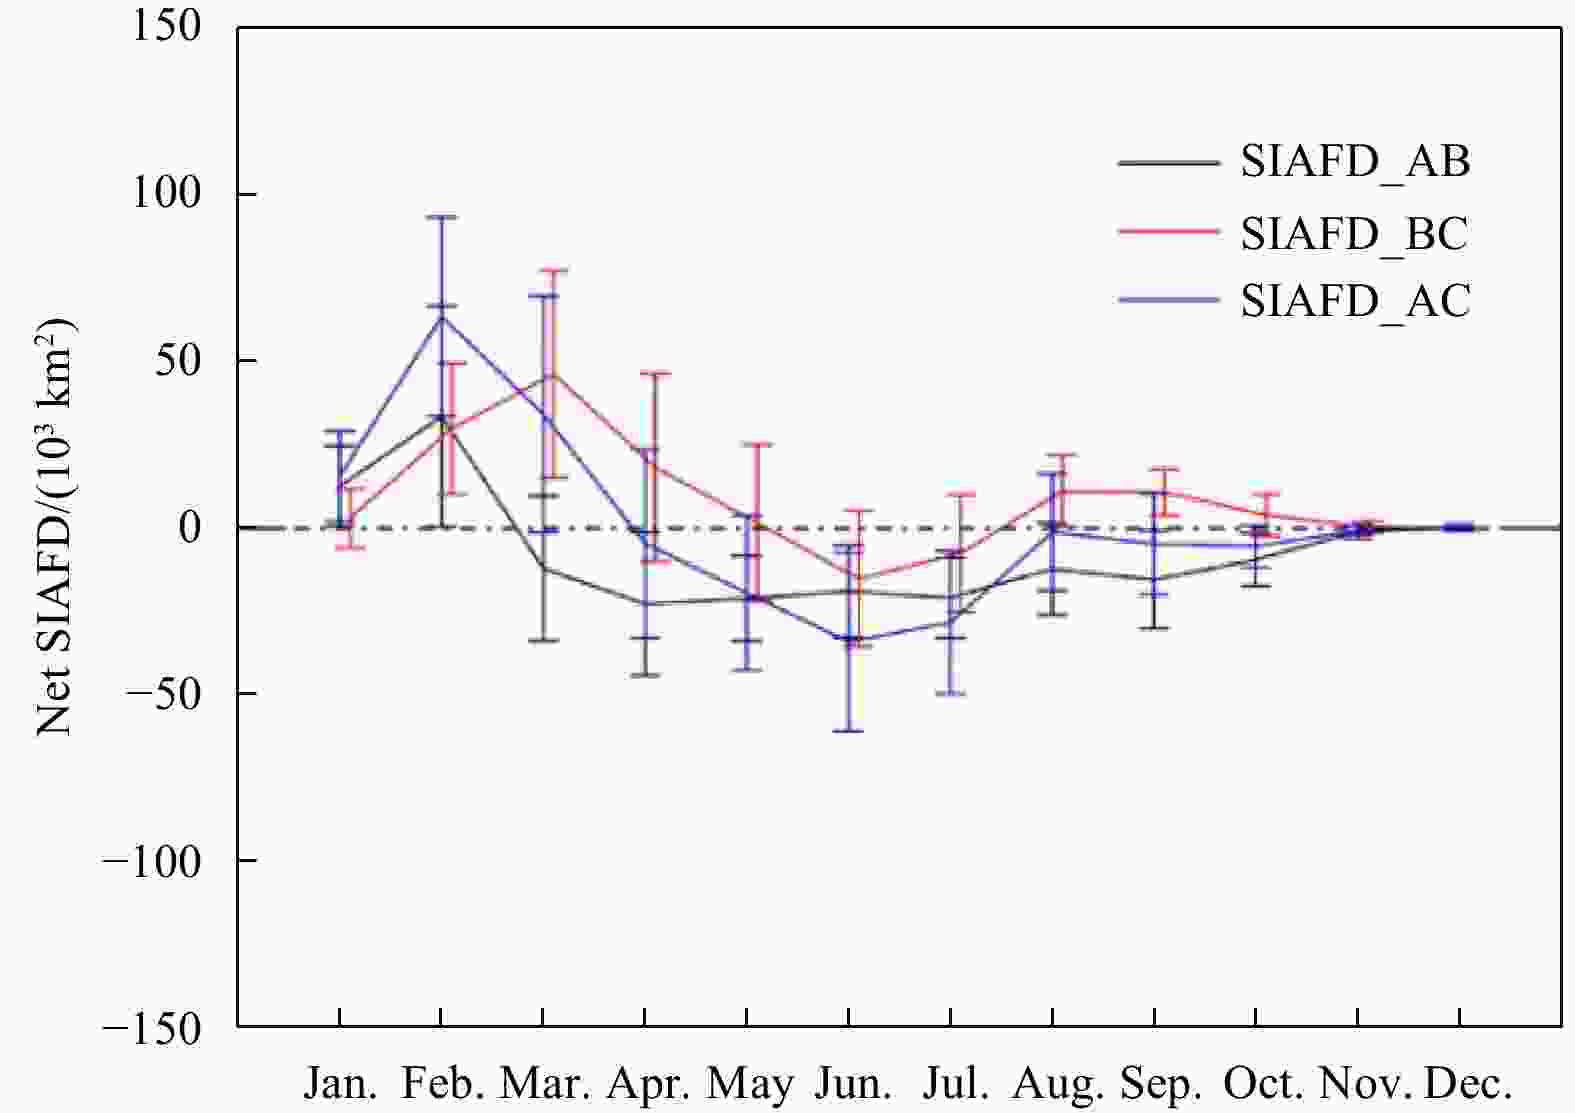
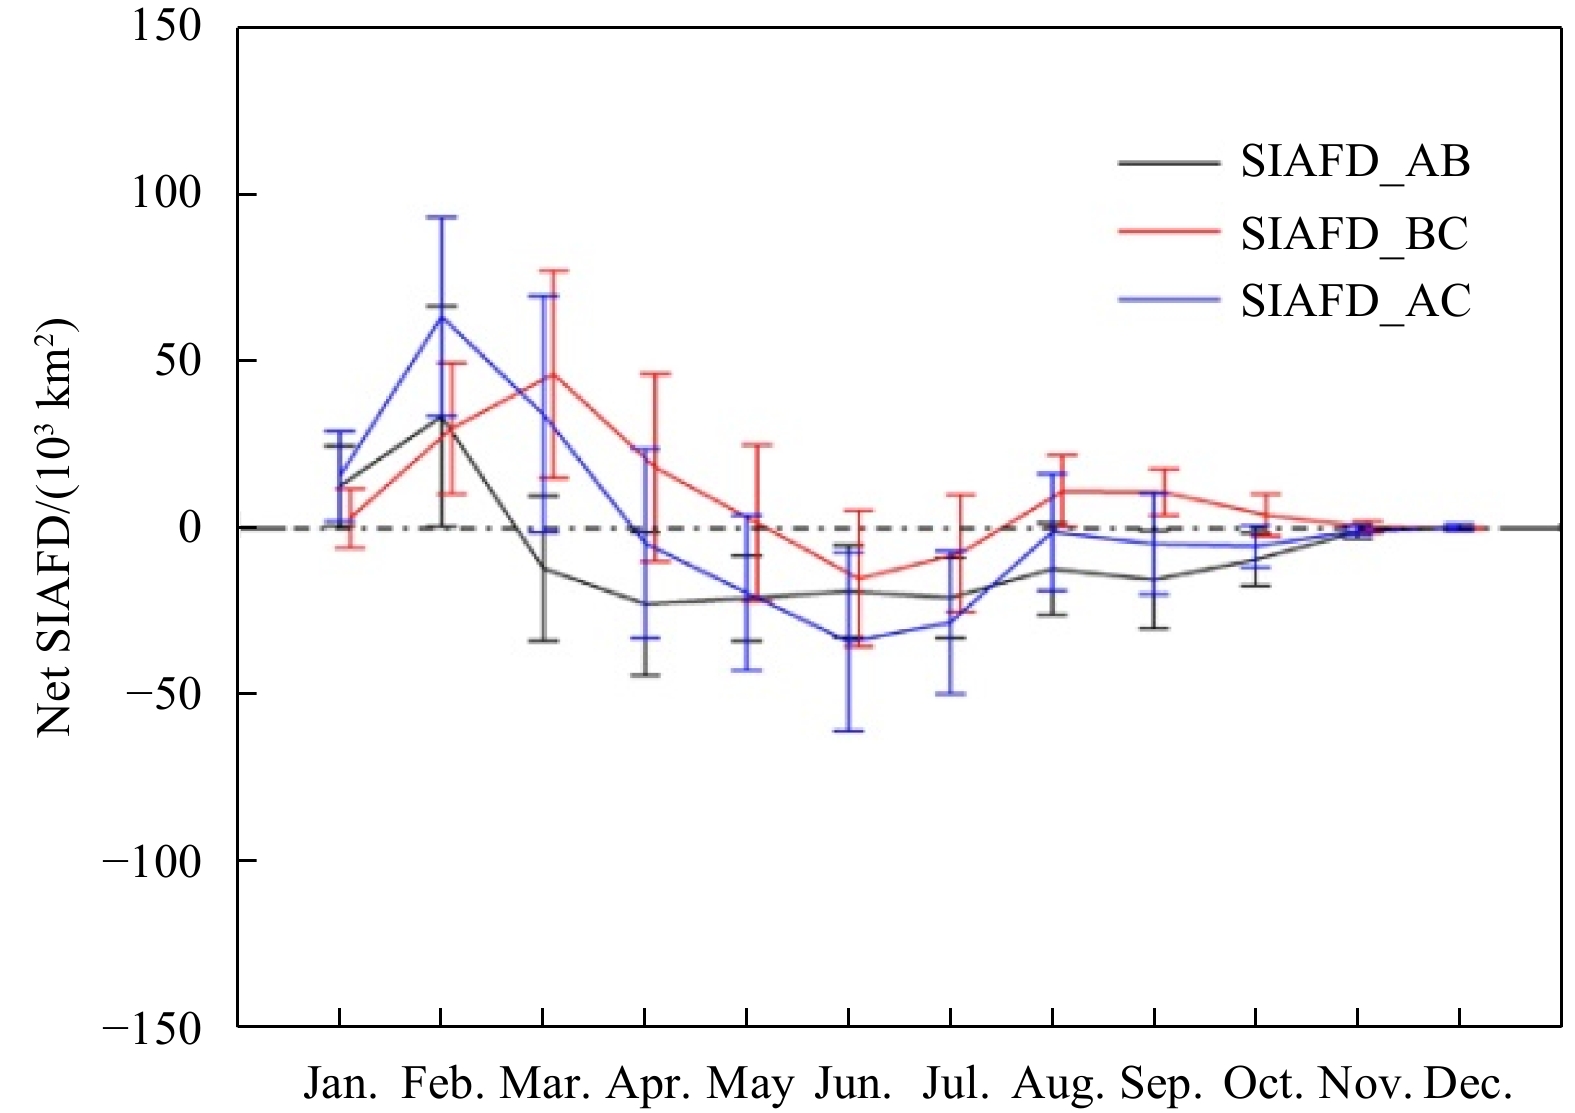
Figure 12. Mean net monthly SIAFD between different passages in the Baffin Bay over the period of 1988/1989 to 2014/2015. The Error bar corresponds to the standard deviation.
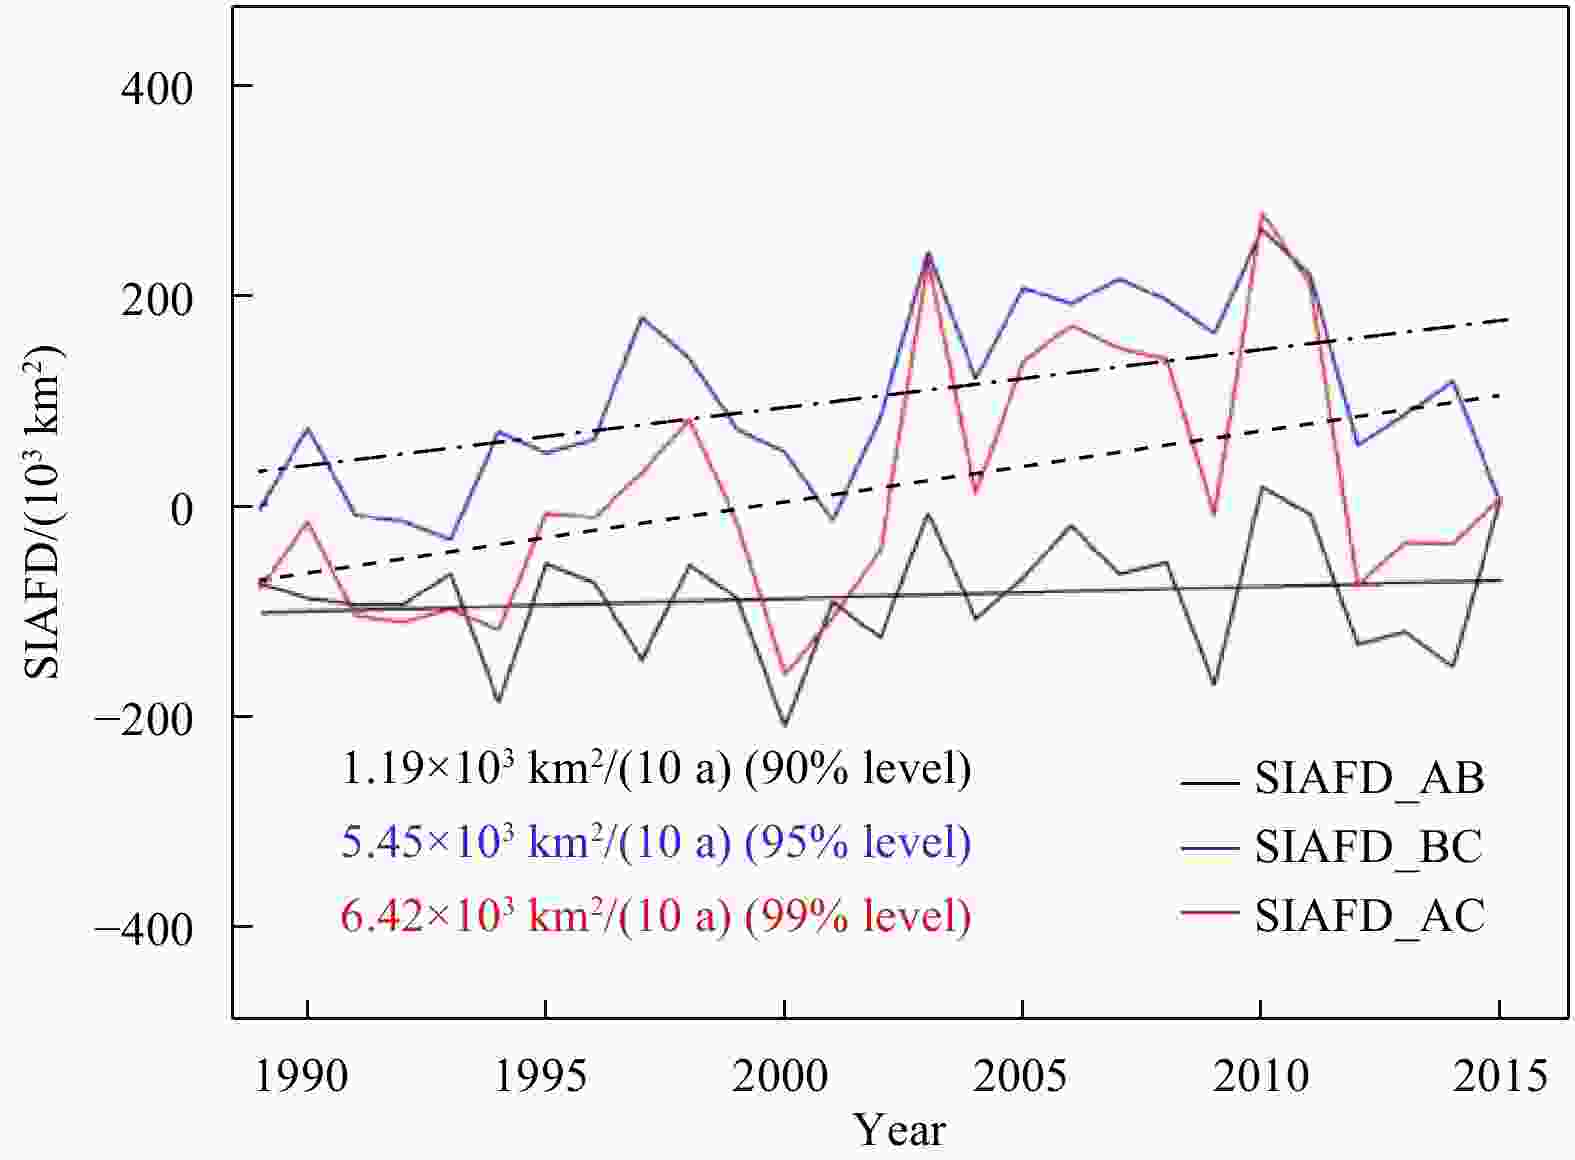
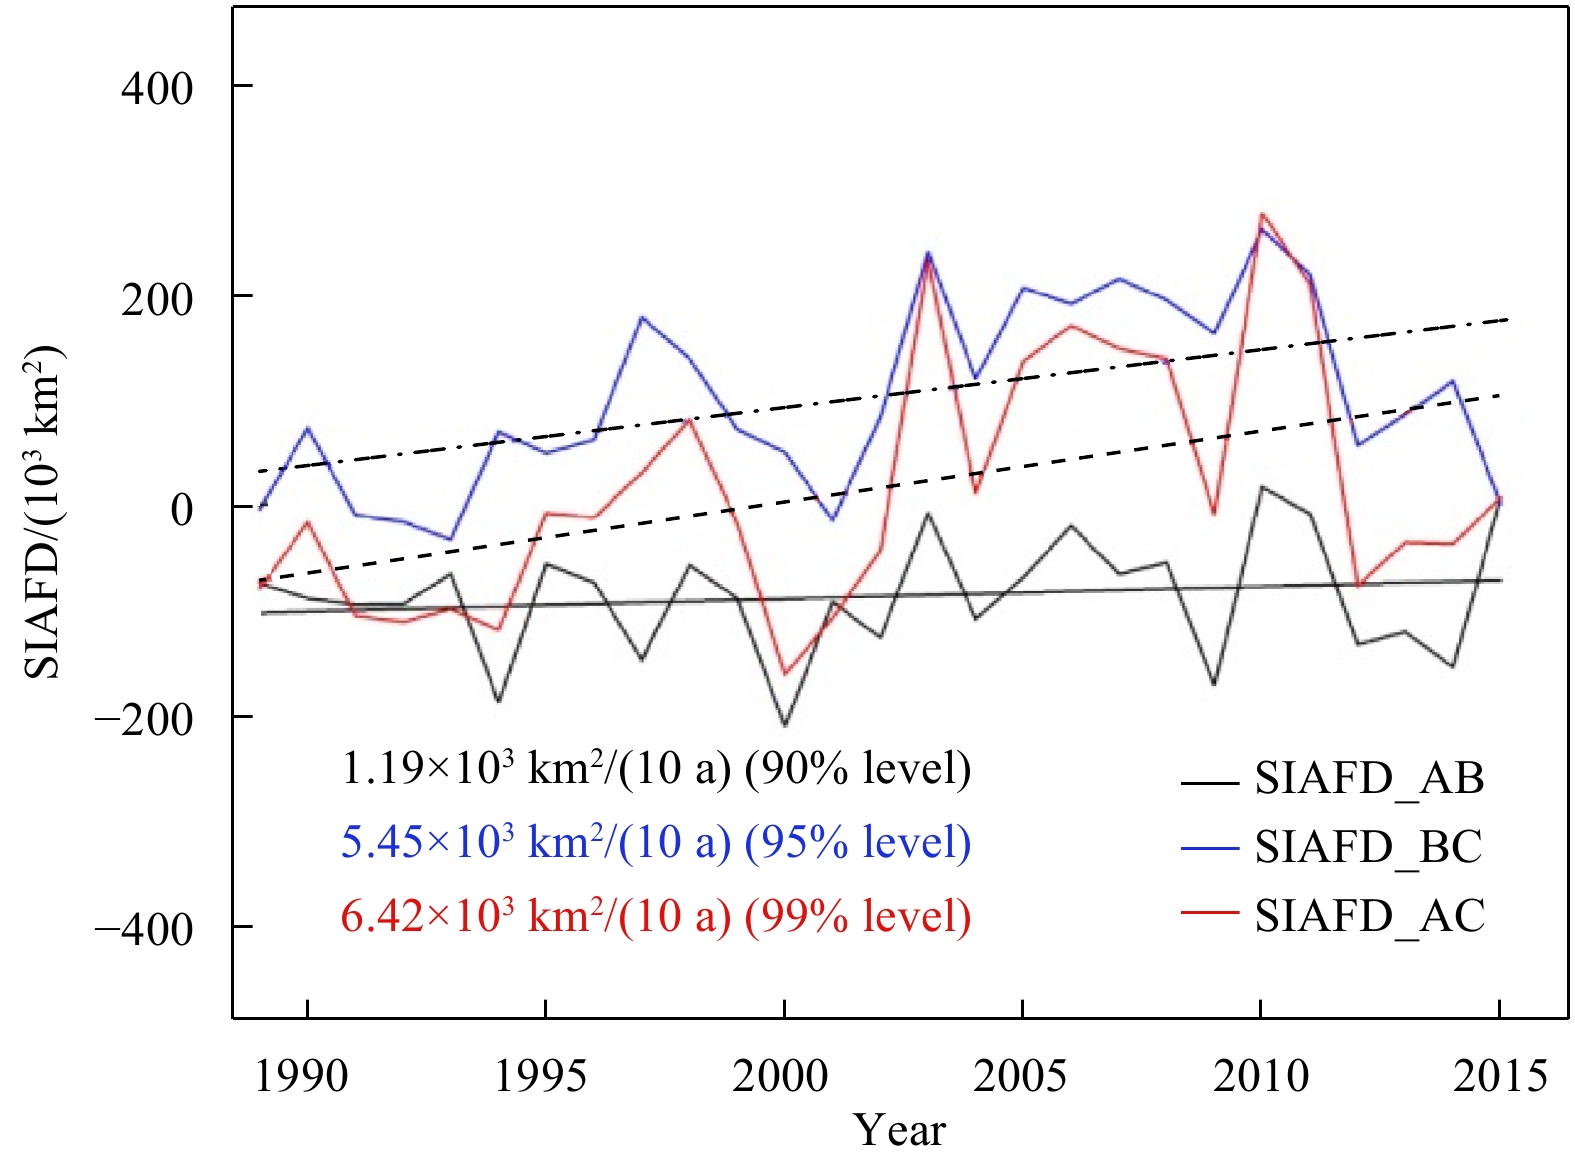
Figure 13. Net annual SIAFD between the different Baffin Bay passages. For example, SIAFD_AB is the difference between SIAF through the Passages A and B. Linear trend is added, with the bold, dash, and dash-dot lines representing the trends that are significant at the 90%, 95%, and 99% levels, respectively.
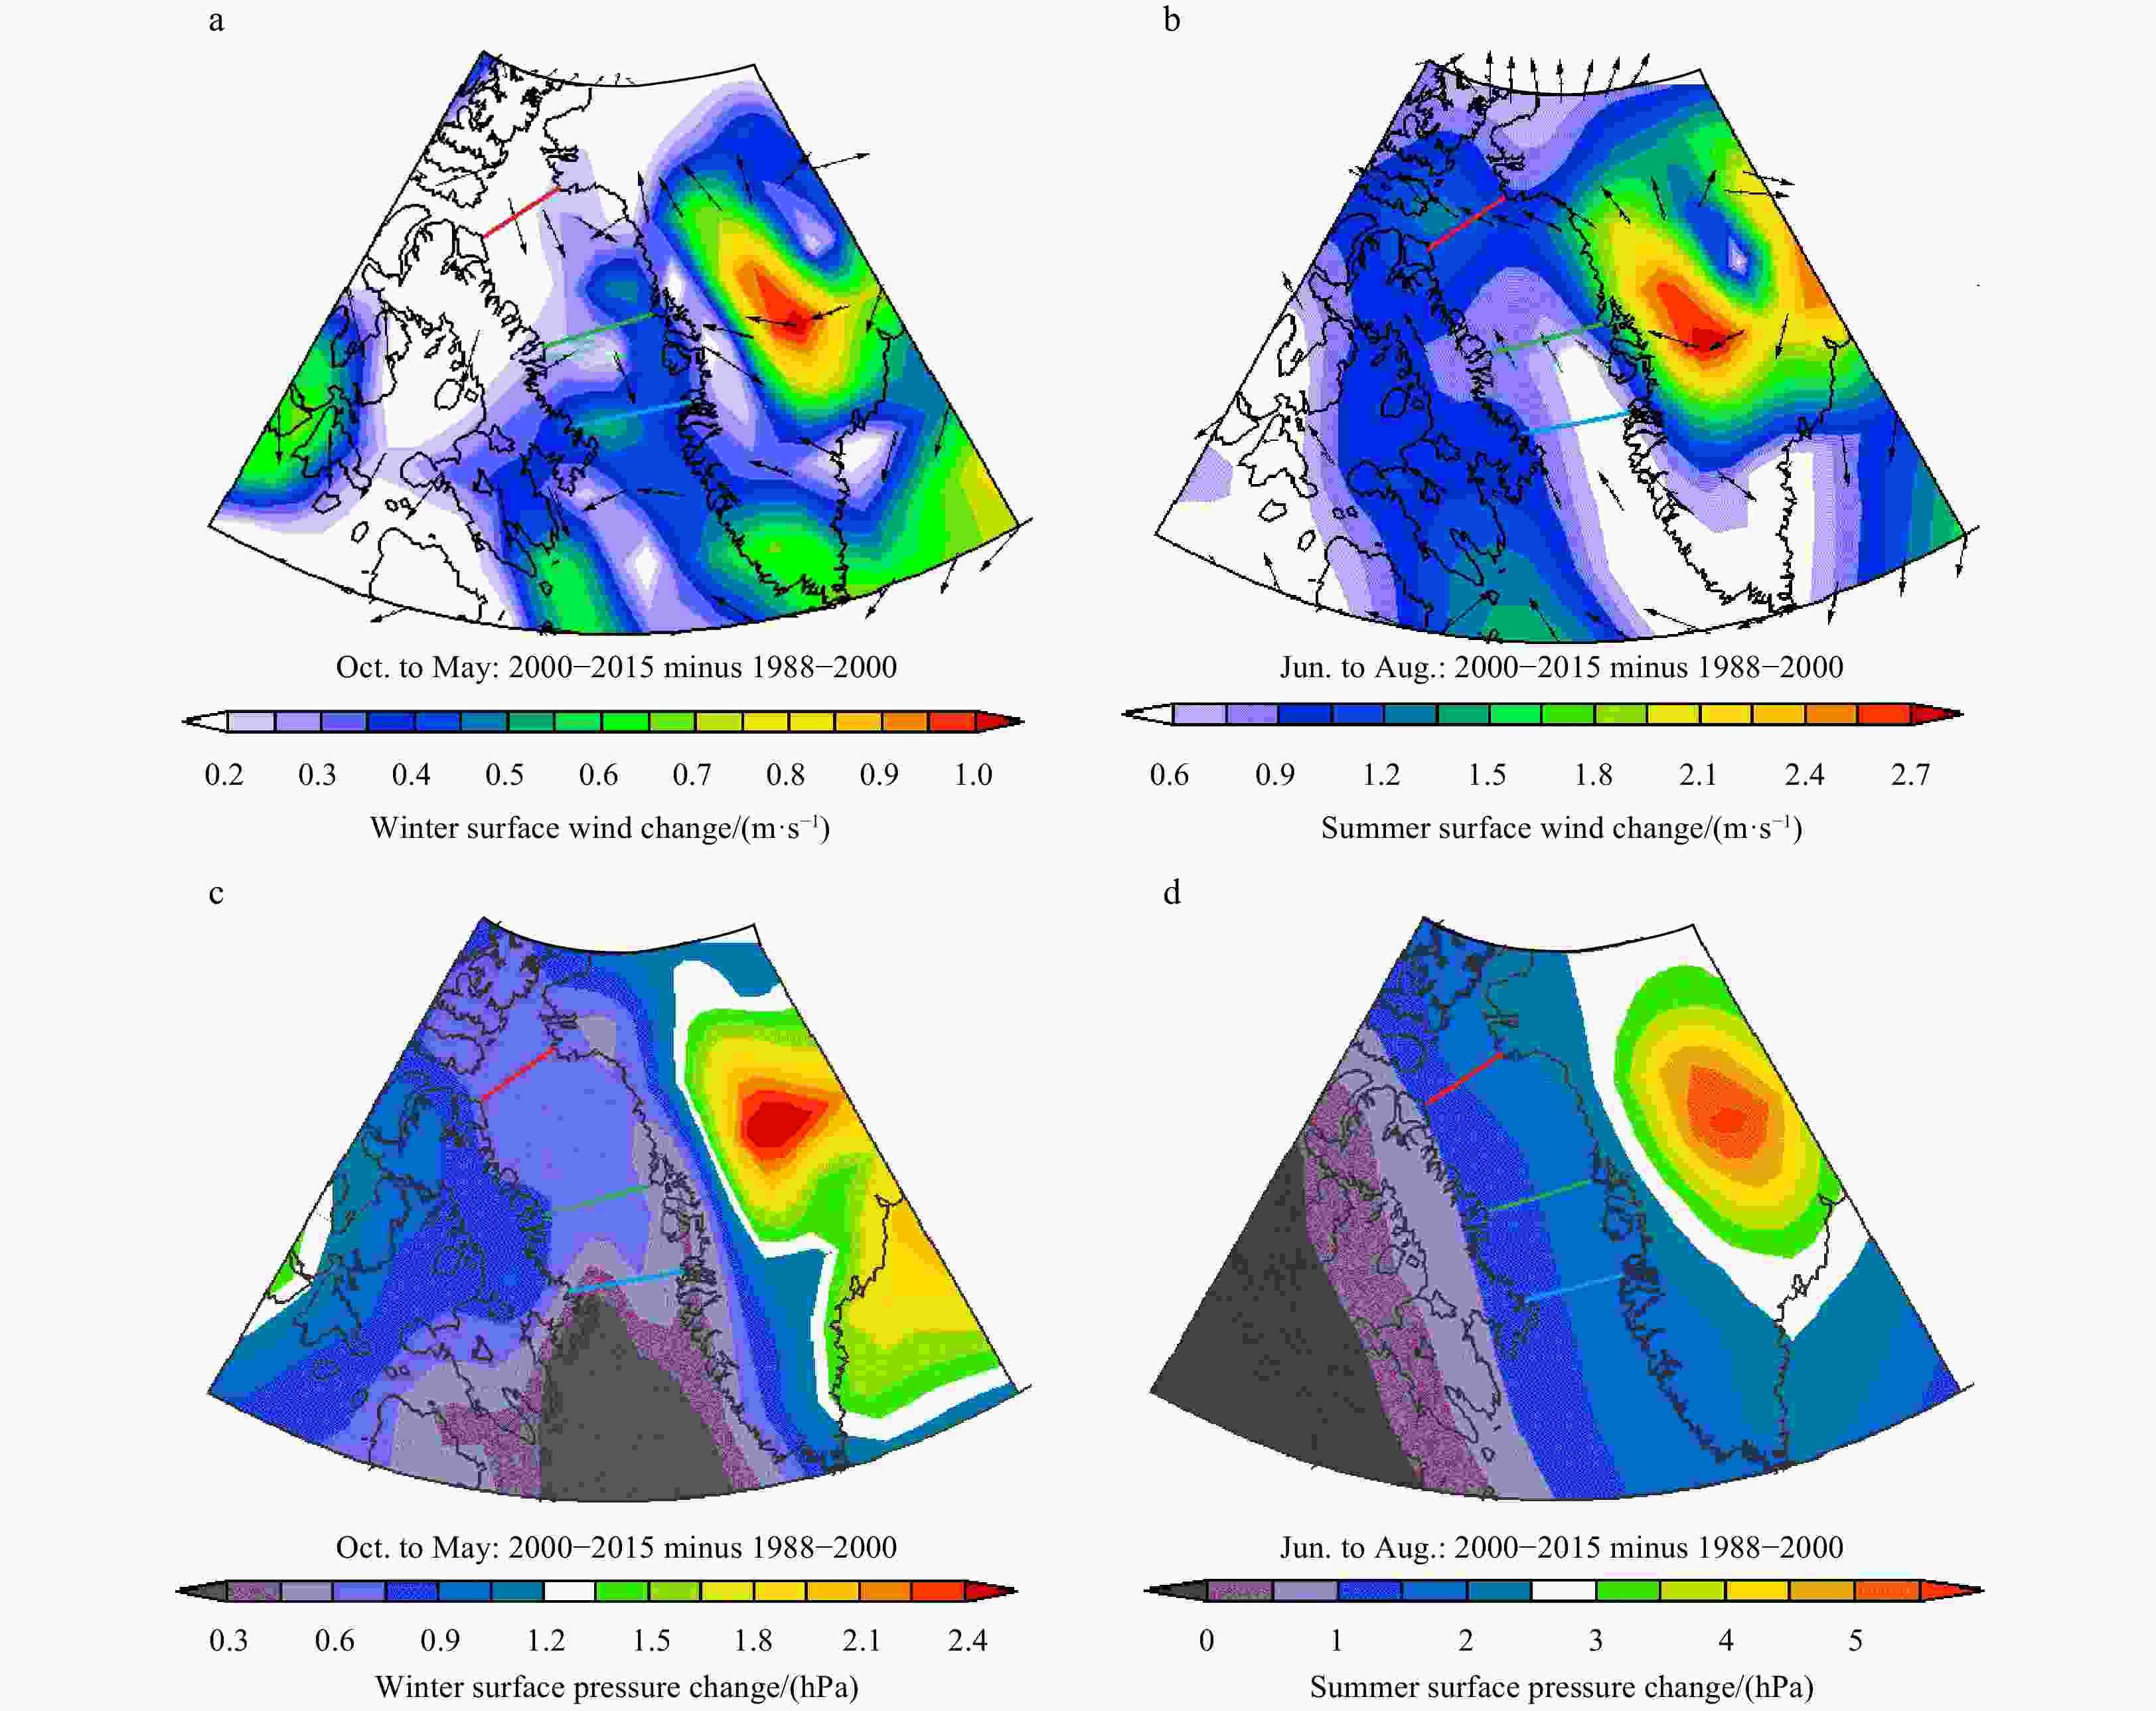
Figure 14. Inter-period changes (P2–P1) of surface wind (SW) for the winter (October–May, a) and summer (June–August, b) between P1 (1988–2000) and P2 (2001–2015), and the corresponding sea level pressure (SLP) changes for the winter (c), and summer (d). The red, green, and blue lines in the Baffin Bay correspond to Passages A, B, and C, respectively.
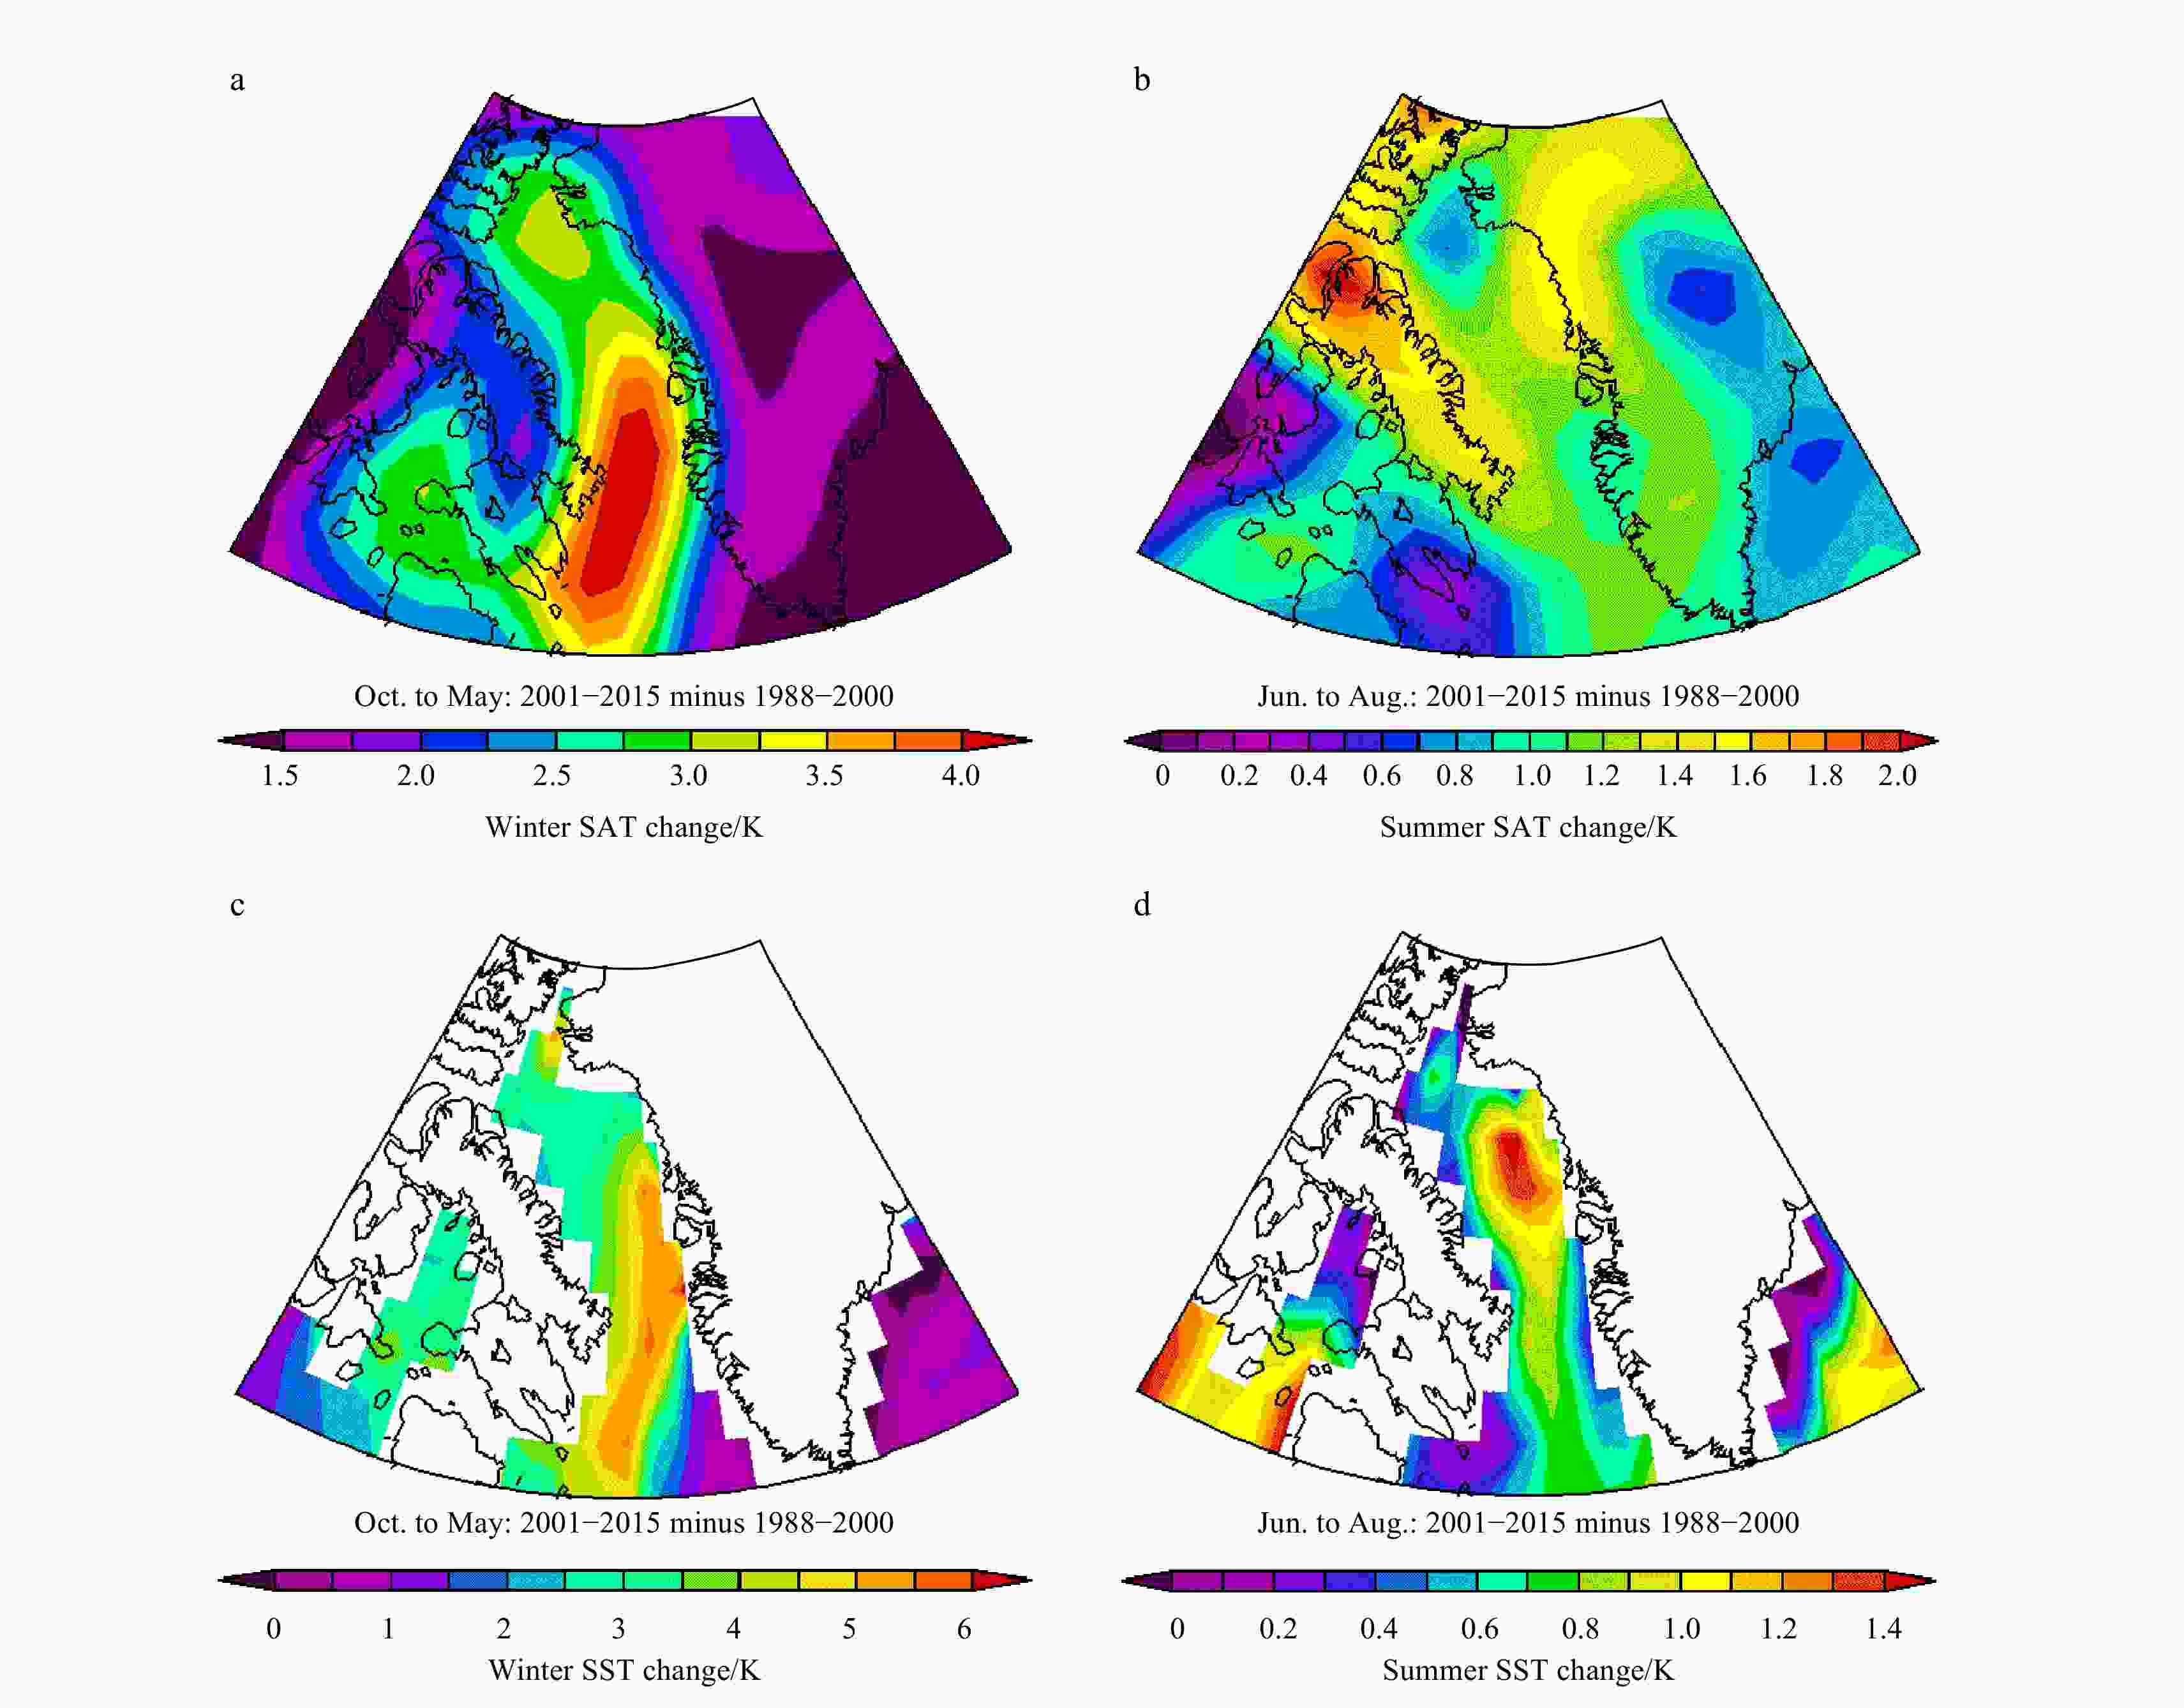
Figure 15. Inter-period changes (P2–P1) of surface air temperature (SAT) between P1 (1988–2000) and P2 (2001–2015) for the winter (October–May, a) and summer (June–August, b), and the sea surface temperature (SST) changes for the winter (c) and summer (d) seasons.

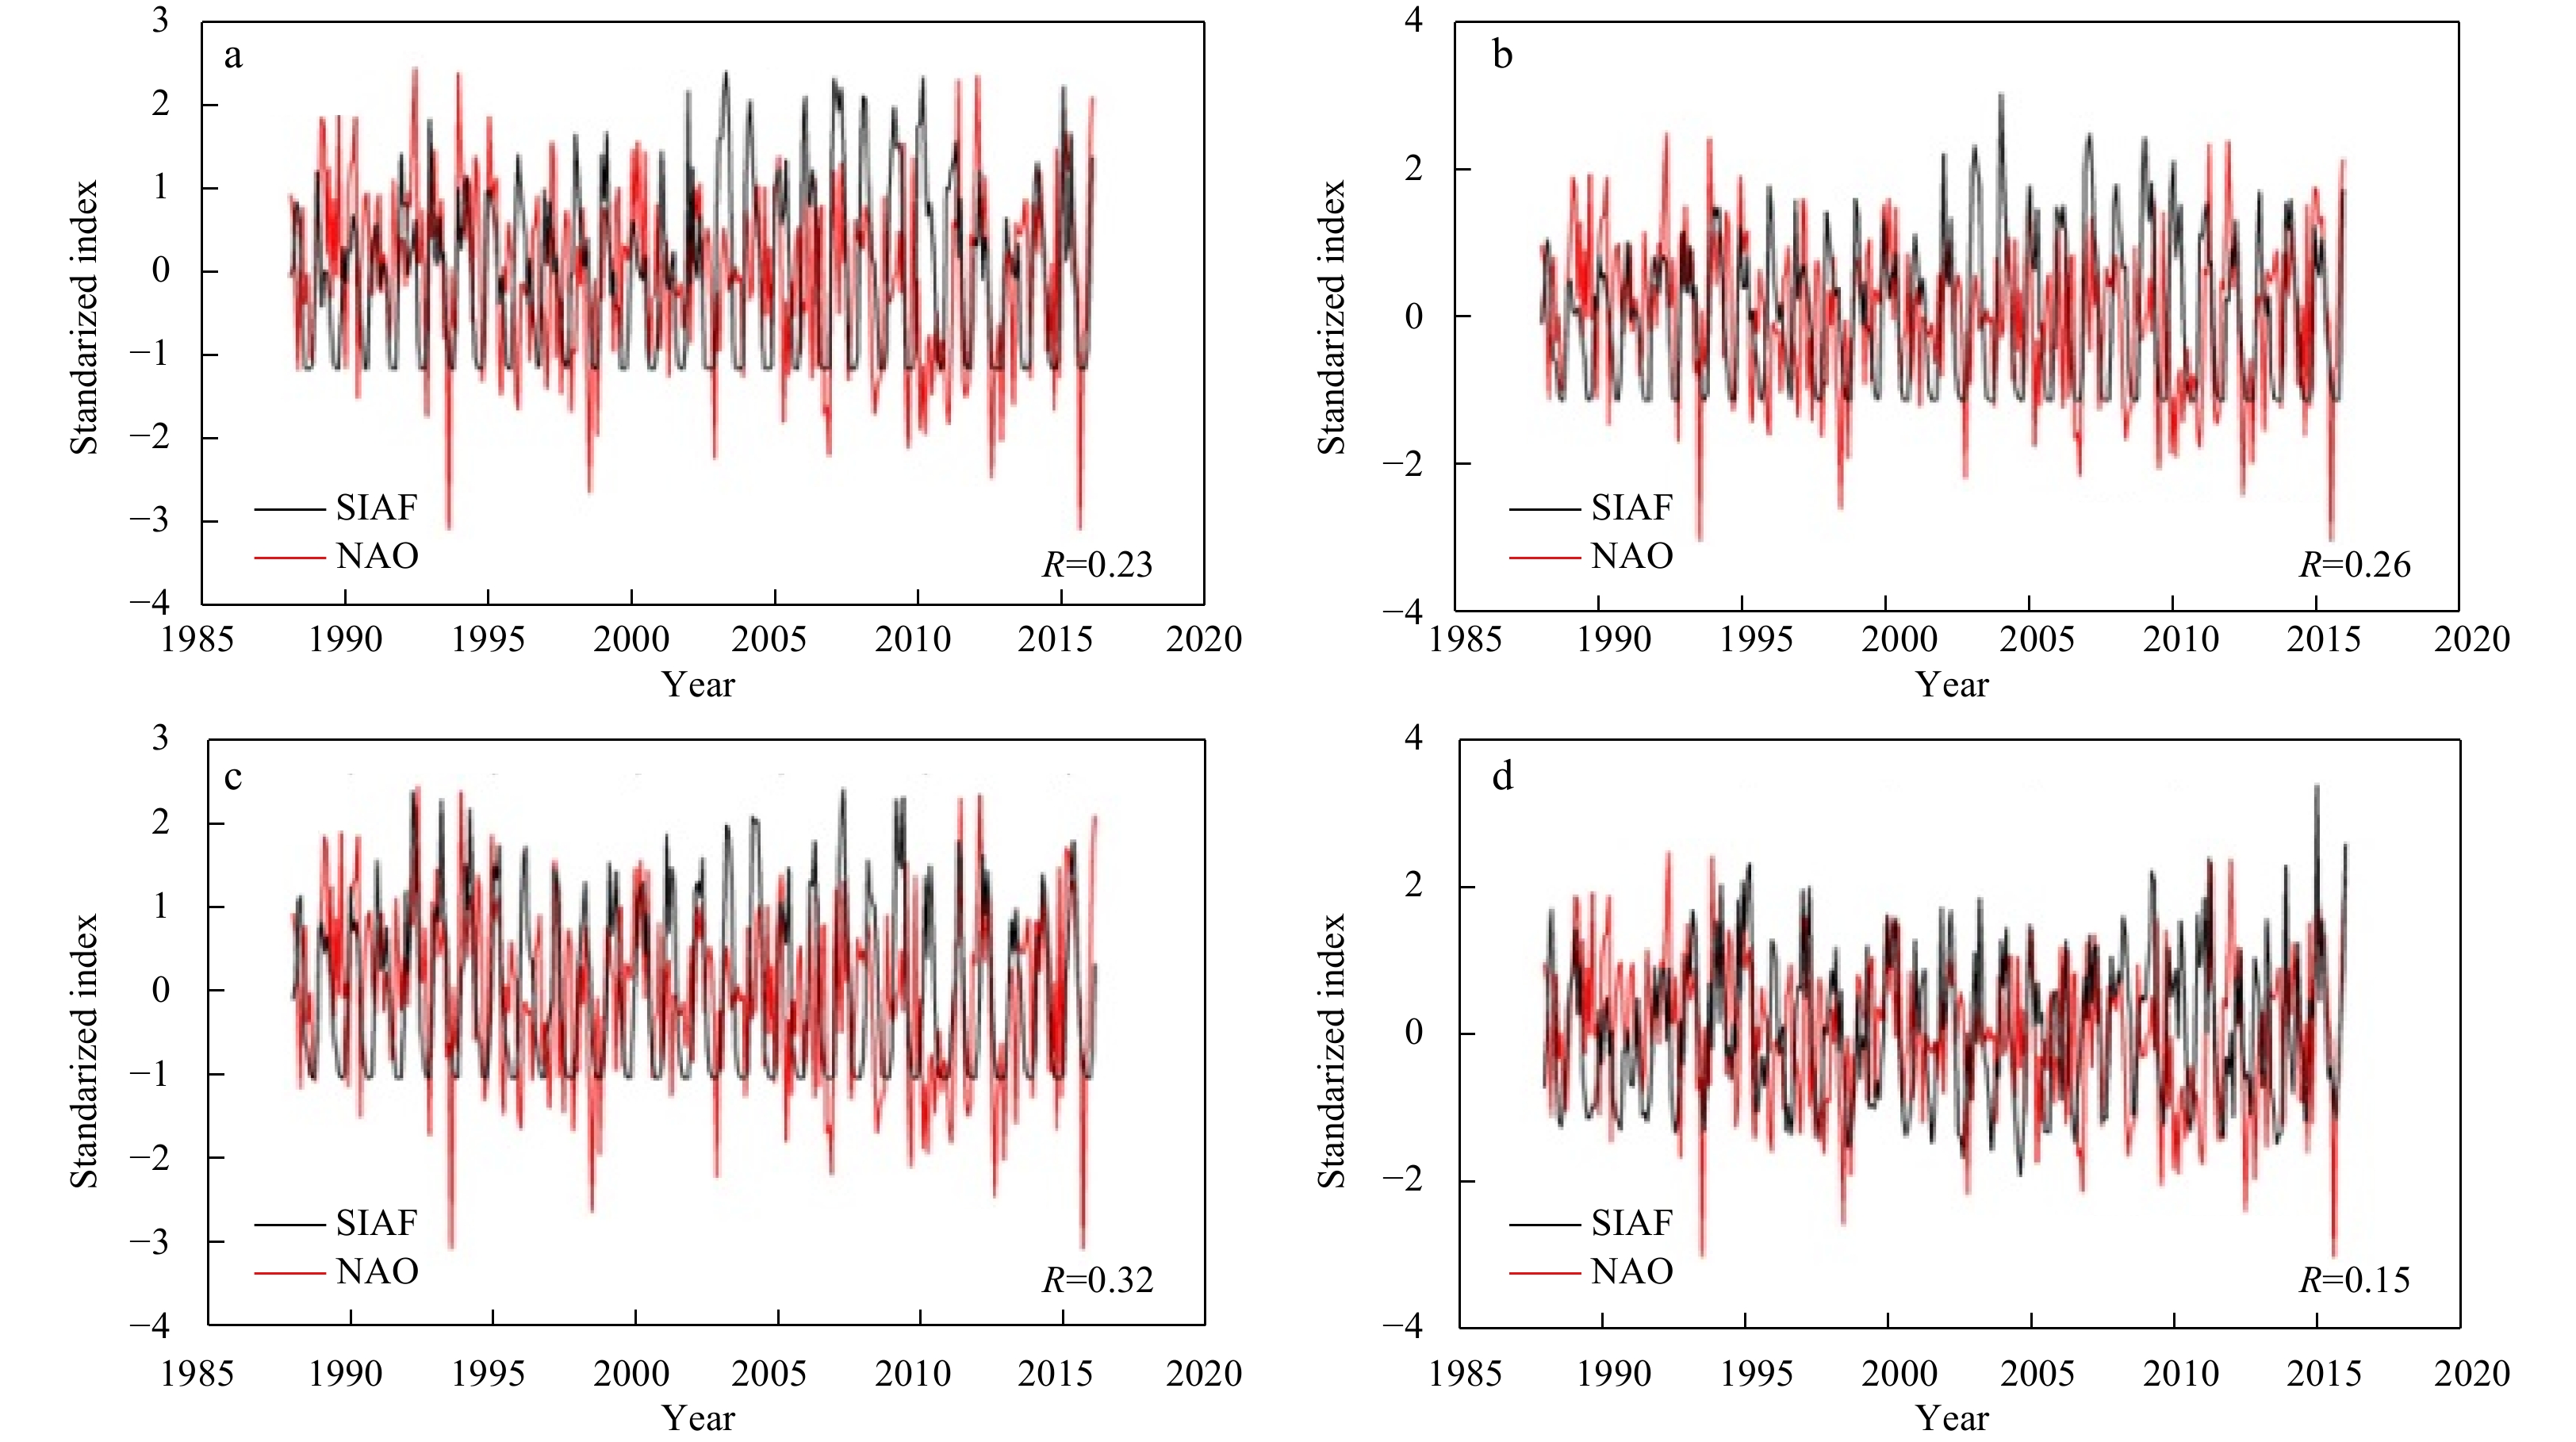
Figure 16. Time series of the monthly SIAF through the Baffin Bay Passages A (a), B (b), and C (c), and FS (d), together with the corresponding monthly mean NAO index. To facilitate our analysis, the two variables have been standardized. In short, the monthly SIAF values (or monthly-mean NAO values) are first subtracted from the corresponding mean monthly value over the period 1988–2015 and then divided by the standard deviation of the values considered.
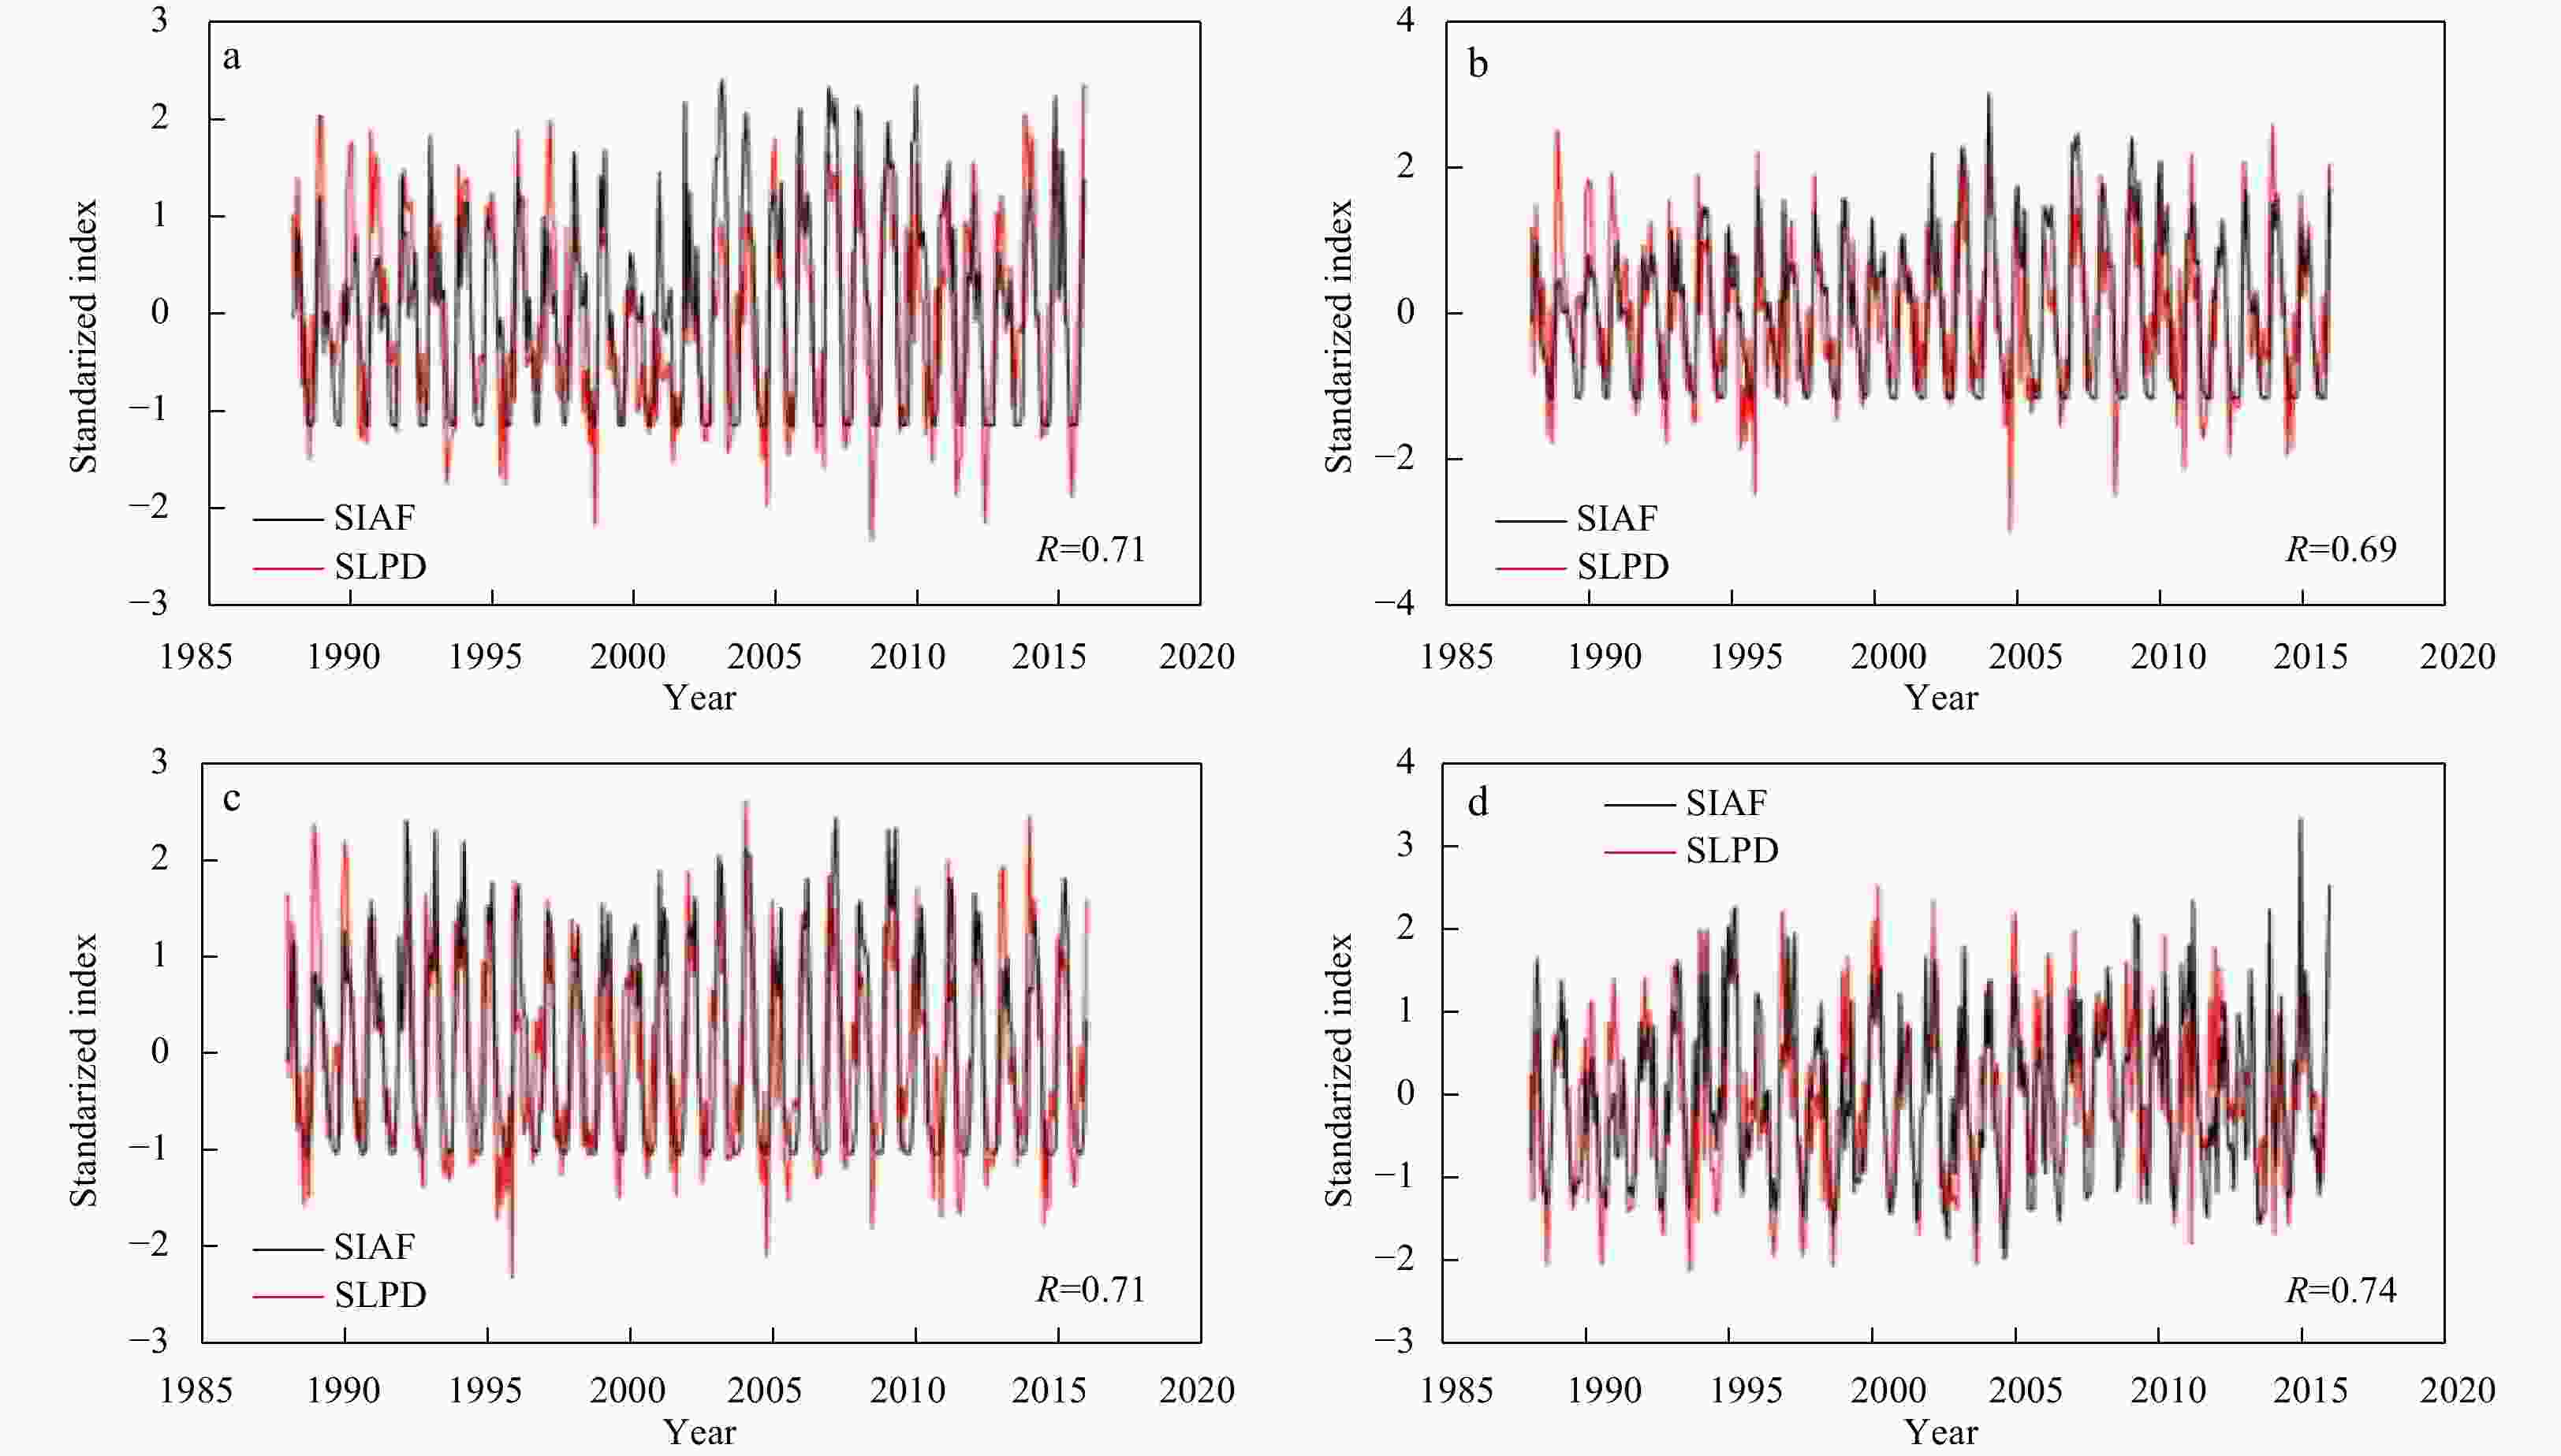
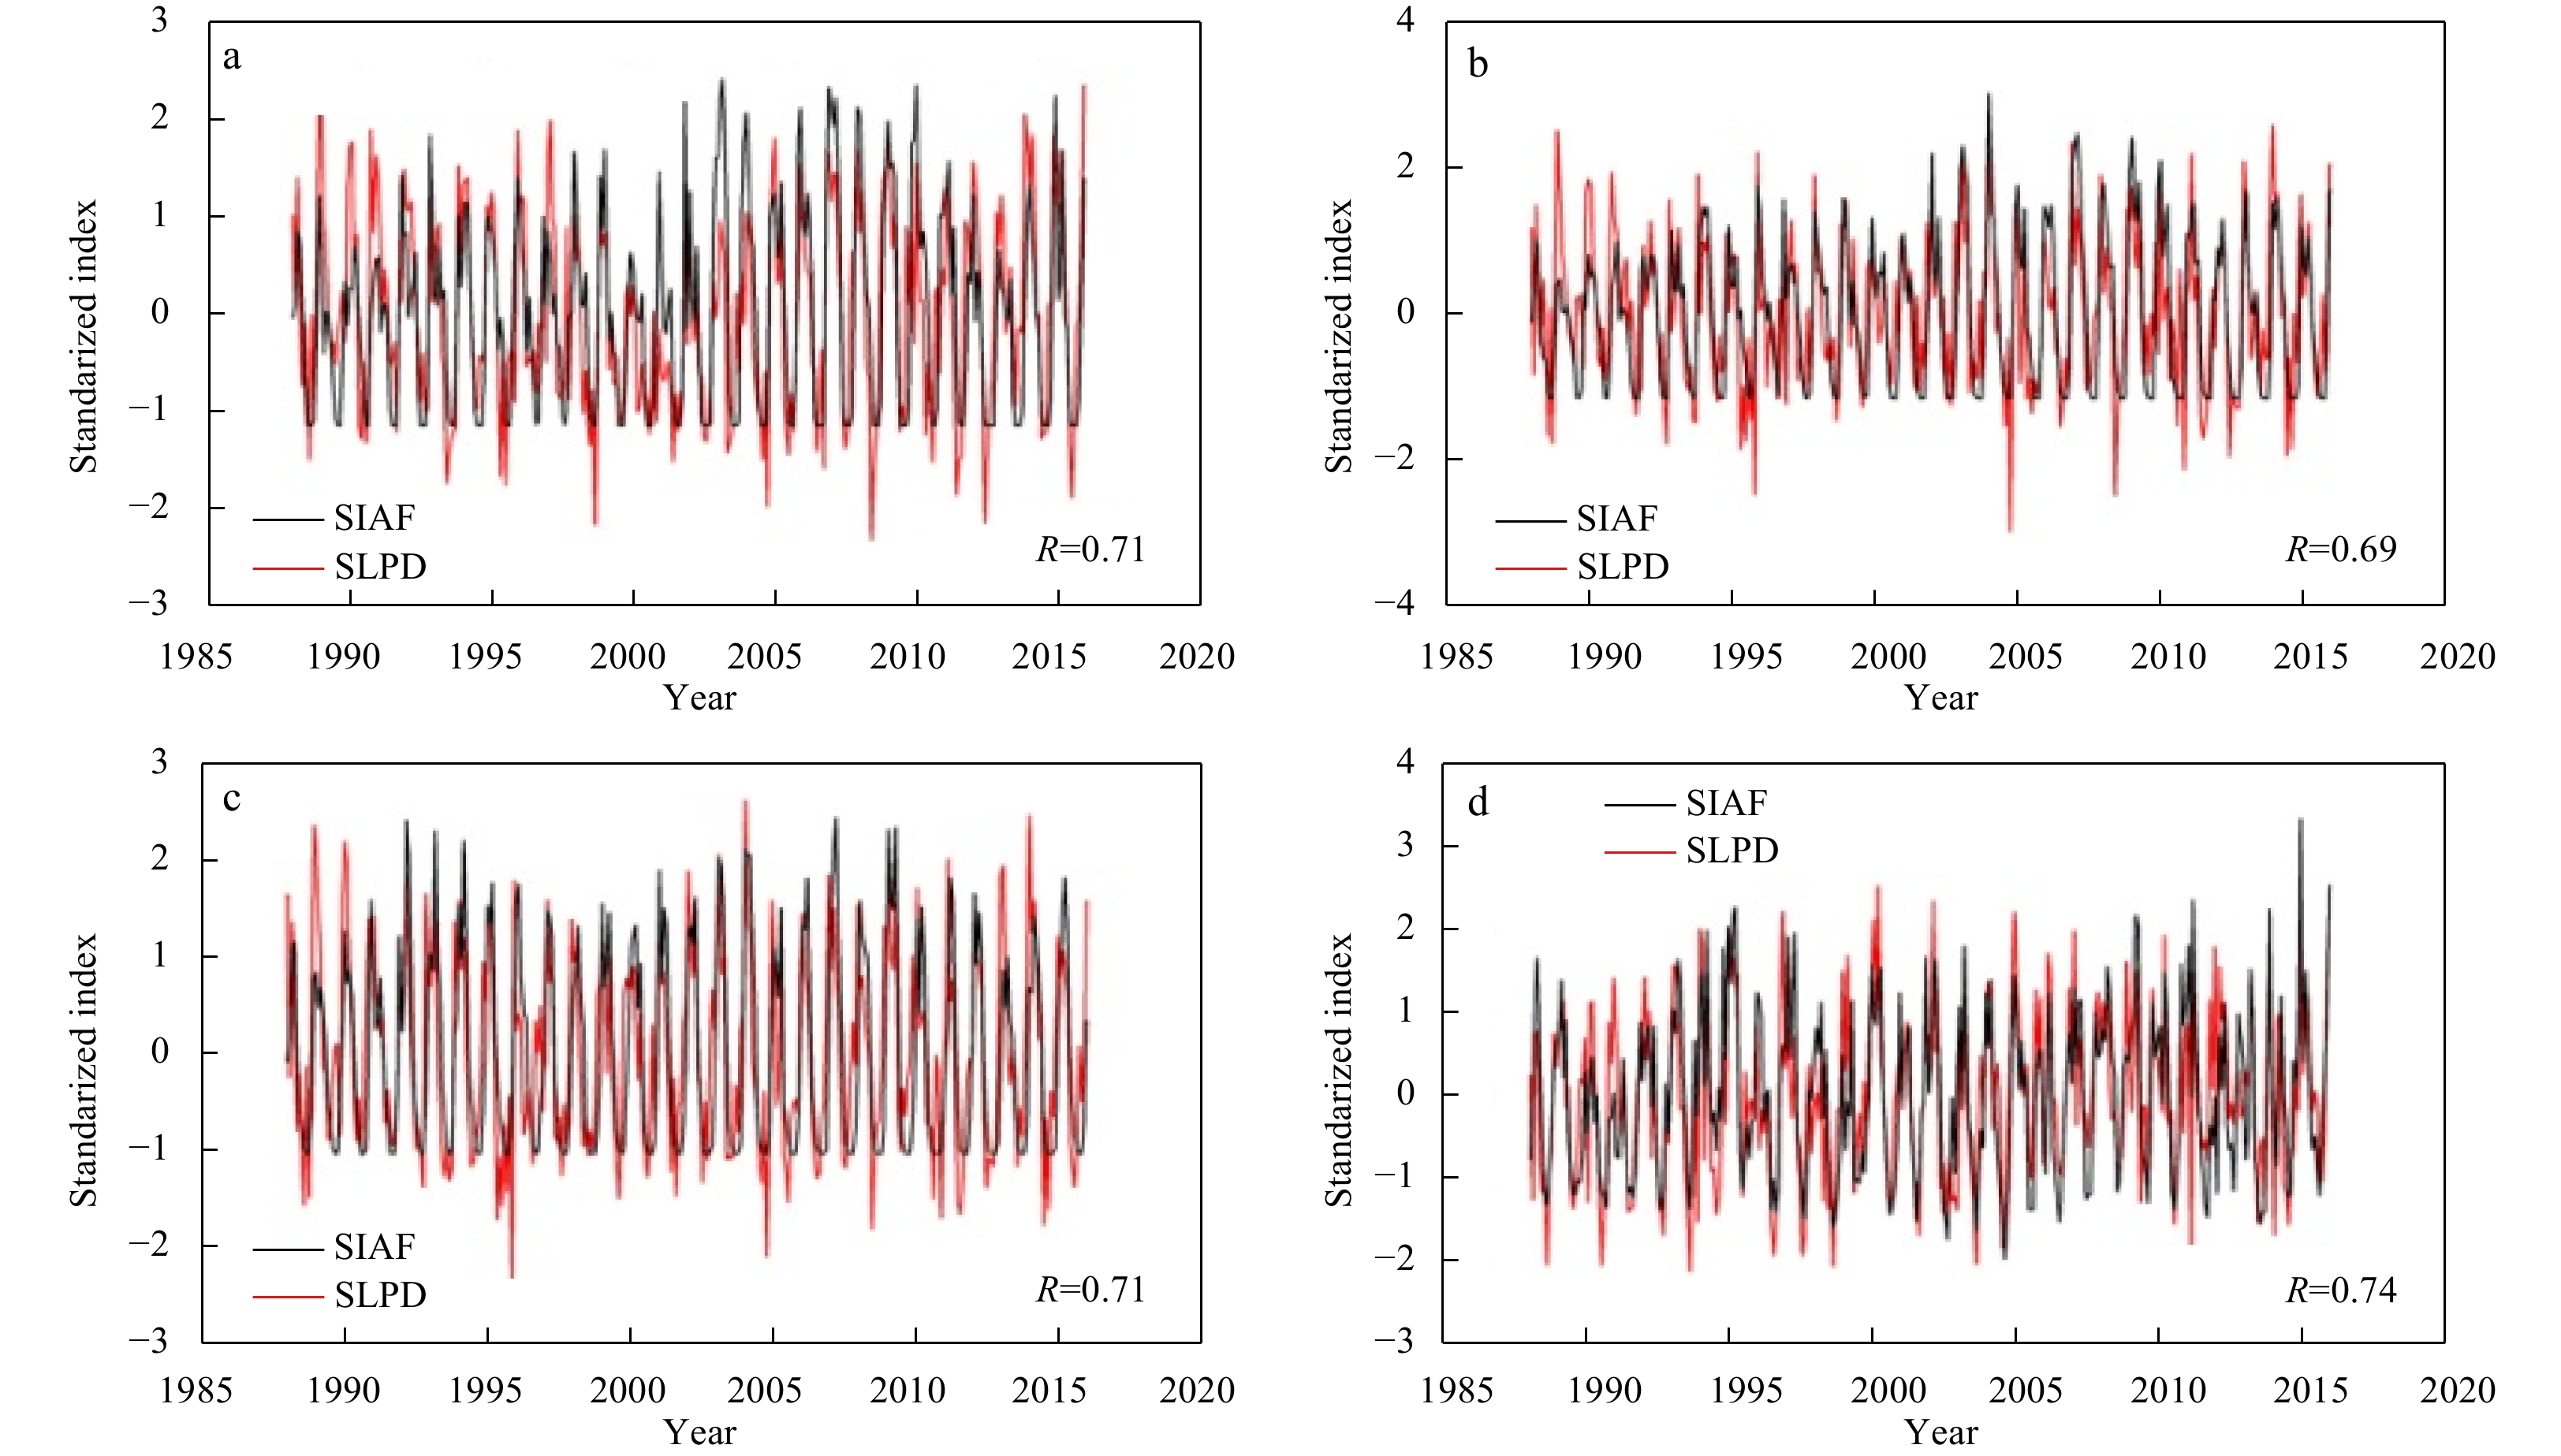
Figure 17. Time series of the monthly SIAF via the different Baffin Bay Passages (including A (a), B (b), and C (c)), and those via FS (d), as well as the monthly mean SLPD fields. The fields are standardized, as depicted in Fig. 16.
Table 1. Uncertainty estimates of daily (σD), monthly (σm) and annually accumulated SIAF (σa) for the three passages over the period of 1988–2015
Passage Width/km Ns σD/(103 km2) σm/(103 km2) σa/(103 km2) A 372 14 2.41 13.19 45.69 B 453 18 3.32 18.21 63.09 C 442 17 3.15 17.27 59.82 Note: Ns is the total numbers of grid covered by a passage.  下载: 导出CSV
Table 2. Trends in monthly and seasonal SIAF fields, and the corresponding trends in terms of SIM, SIC, and SLPG at the three passages of the Baffin Bay and FS over the period of 1988–2015
Passage Jan. Feb. Mar. Apr. May Jun. Jul. Aug. Sep. Oct. Nov. Dec. Winter average (Oct.–May) Summer average (Jun.–Sep.) A SIAF/
(103 km2·(10 a)–1)15.07 14.01 12.56 5.16 2.86 –3.60 –1.41 –0.03 –0.17 –9.15 –0.05 13.80 6.78 –1.30 SIM/(km·(10 a)–1) 0.99 1.23 0.98 0.42 0.36 –0.29 –0.16 0.01 –0.02 –0.72 –0.14 1.08 0.53 –0.12 SIC/(%·(10 a)–1) –0.75 –0.79 –0.56 –0.42 –5.78 –13.42 –6.72 –1.46 –1.29 –13.97 –2.85 –1.12 –3.28 –5.72 SLPD/
(Pa·(10 a)–1)–0.10 0.31 0.00 0.29 0.26 –0.70 –0.62 –0.32 0.51 0.24 0.60 0.19 0.22 –0.28 B SIAF/
(103 km2·(10 a)–1)20.59 17.49 12.90 10.29 3.89 –5.83 –7.91 –0.95 –0.01 –3.48 –16.38 12.81 7.26 –3.68 SIM/(km·(10 a)–1) 1.25 1.30 0.85 0.71 0.31 –0.34 –0.72 –0.15 –0.002 –0.30 –1.12 0.93 0.49 –0.30 SIC/(%·(10 a)–1) –2.63 –0.98 –0.29 –0.47 –3.06 –9.35 –13.07 –2.67 –0.13 –4.43 –11.69 –6.24 –3.72 –6.31 SLPD/
(Pa·(10 a)–1)0.07 0.40 –0.17 0.30 0.04 –0.85 –0.40 –0.52 0.38 0.09 0.01 0.36 0.14 –0.35 C SIAF/
(103 km2·(10 a)–1)6.30 8.42 4.72 4.98 0.10 –2.49 –4.92 –0.73 0.00 –0.15 –10.32 –9.86 0.52 –2.04 SIM/(km·(10 a)–1) 0.48 0.75 0.47 0.43 0.05 –0.10 –0.44 –0.11 0.00 –0.02 –0.80 –0.57 0.10 –0.16 SIC/(%·(10 a)–1) –9.67 –6.94 –4.56 –4.03 –5.74 –7.00 –9.68 –1.52 0.00 –0.43 –9.38 –9.37 –6.27 –4.55 SLPD/
(Pa·(10 a)–1)–0.18 0.22 –0.62 0.62 0.00 –0.76 –0.38 –0.24 0.22 0.22 –0.28 –0.06 –0.01 –0.29 FS SIAF/
(103 km2·(10 a)–1)–2.60 –3.06 5.56 2.64 –3.10 0.42 –0.92 –1.63 7.46 8.18 11.96 6.89 3.31 1.33 SIM/(km·(10 a)–1) –0.42 –0.26 0.43 0.17 –0.26 0.05 –0.04 –0.22 0.44 0.57 0.96 0.63 0.23 0.06 SIC/(%·(10 a)–1) –0.93 –3.10 –1.96 0.13 –1.43 –0.58 –3.26 3.83 2.35 –2.27 –1.94 –3.69 –1.90 0.59 SLPD/
(Pa·(10 a)–1)–0.90 0.15 0.88 0.38 0.11 1.00 0.95 1.22 0.50 0.51 1.03 0.10 0.28 0.92 Note: The confidence levels are marked with varying colors. Red, blue, and gold imply a significance at the 99%, 95%, and 90% levels, respectively.
下载: 导出CSV
Table 5. Trends for the monthly SIAF difference through the different Baffin Bay passages
Jan. Feb. Mar. Apr. May Jun. Jul. Aug. Sep. Oct. Nov. Dec. SIAFD_AB/(103 km2·(10 a)−1) –5.51 –3.47 –0.34 –5.12 –1.03 2.23 6.49 0.92 –0.16 –5.67 16.43 0.99 SIAFD_BC/(103 km2·(10 a)−1) 14.29 9.06 8.18 5.31 3.79 –3.34 –2.98 –0.22 0.01 –3.33 –6.06 22.66 SIAFD_AC/(103 km2·(10 a)−1) 8.78 5.59 7.84 0.19 2.76 –1.12 3.51 0.70 –0.17 –9.00 10.36 23.66 Note: Red, blue, and gold color denotes the trends that are significant at the levels of 99%, 95%, and 90%, respectively.
下载: 导出CSV
Table 3. Mean annual and seasonal accumulated SIAF for different periods
Passage SIAF/(103 km2) 1988–2000 2000–2015 1988–2015 A 489/464/25 616/603/13 555/535/20 B 592/534/58 686/656/30 642/597/45 C 545/509/46 536/514/22 541/511/30 FS 692/610/82 720/624/96 707/616/91 Note: Numbers in the form of “N1/N2/N3” are referred as to the annual, winter, and summer SIAF fields, respectively. The winter and summer SIAF estimates cover for the periods of October–May and June–September, respectively.
下载: 导出CSV
Table 4. Statistical results for the net annual SIAF (1988/1989 to 2014/2015) between the different passages in the Baffin Bay
SIAFD_AB SIAFD_BC SIAFD_AC Mean/(103 km2) –87.3 101.6 14.3 Standard deviation/(103 km2) 57.7 87.8 118.6 Trend/(103 km2·(10 a)–1) 11.9 64.2 54.5 Note: The red and blue color denote the trends that are signifi-cant at the levels of 99% and 95%, respectively.
下载: 导出CSV
-
[1] Bi Haibo, Huang Haijun, Fu Min, et al. 2016a. Estimating sea-ice volume flux out of the Laptev Sea using multiple satellite observations. Polar Research, 35(1): 24875. doi: 10.3402/polar.v35.24875 [2] Bi Haibo, Sun Ke, Zhou Xuan, et al. 2016b. Arctic sea ice area export through the fram strait estimated from satellite-based data: 1988–2012. IEEE Journal of Selected Topics in Applied Earth Observations and Remote Sensing, 9(7): 3144–3157. doi: 10.1109/JSTARS.2016.2584539 [3] Bi Haibo, Zhang Zehua, Wang Yunhe, et al. 2019. Baffin Bay sea ice inflow and outflow: 1978–1979 to 2016–2017. The Cryosphere, 13(3): 1025–1042. doi: 10.5194/tc-13-1025-2019 [4] Cho K, Sasaki N, Shimoda H, et al. 1996. Evaluation and improvement of SSM/I sea ice concentration algorithms for the Sea of Okhotsk. Journal of the Remote Sensing Society of Japan, 16(2): 47–58 [5] Comiso J C, Gersten R A, Stock L V, et al. 2017a. Positive trend in the Antarctic sea ice cover and associated changes in surface temperature. Journal of Climate, 30(6): 2251–2267. doi: 10.1175/JCLI-D-16-0408.1 [6] Comiso J C, Hall D K. 2014. Climate trends in the Arctic as observed from space. Wiley Interdisciplinary Reviews: Climate Change, 5(3): 389–409. doi: 10.1002/wcc.277 [7] Comiso J C, Meier W N, Gersten R. 2017b. Variability and trends in the Arctic Sea ice cover: Results from different techniques. Journal of Geophysical Research, 122(8): 6883–6900 [8] Cuny J, Rhines P B, Kwok R. 2005. Davis Strait volume, freshwater and heat fluxes. Deep Sea Research Part I: Oceanographic Research Papers, 52(3): 519–542. doi: 10.1016/j.dsr.2004.10.006 [9] Curry B, Lee C M, Petrie B, et al. 2014. Multiyear volume, liquid freshwater, and sea ice transports through Davis Strait, 2004–10. Journal of Physical Oceanography, 44(4): 1244–1266. doi: 10.1175/JPO-D-13-0177.1 [10] Drinkwater K. 2009. Comparison of the response of Atlantic cod (Gadus morhua) in the high-latitude regions of the North Atlantic during the warm periods of the 1920s–1960s and the 1990s–2000s. Deep Sea Research Part II: Topical Studies in Oceanography, 56(21–22): 2087–2096 [11] Goosse H, Fichefet T, Campin J M. 1997. The effects of the water flow through the Canadian Archipelago in a global ice-ocean model. Geophysical Research Letters, 24(12): 1507–1510. doi: 10.1029/97GL01352 [12] Graham R M, Cohen L, Petty A A, et al. 2017. Increasing frequency and duration of Arctic winter warming events. Geophysical Research Letters, 44(13): 6974–6983. doi: 10.1002/2017GL073395 [13] Häkkinen S, Cavalieri D J. 2005. Sea ice drift and its relationship to altimetry-derived ocean currents in the Labrador Sea. Geophysical Research Letters, 32(11): L11609. doi: 10.1029/2005GL022682 [14] Hansen A S, Nielsen T G, Levinsen H, et al. 2003. Impact of changing ice cover on pelagic productivity and food web structure in Disko Bay, West Greenland: A dynamic model approach. Deep Sea Research Part I: Oceanographic Research Papers, 50(1): 171–187. doi: 10.1016/S0967-0637(02)00133-4 [15] Hurrell J W. 1995. Decadal trends in the north atlantic oscillation: regional temperatures and precipitation. Science, 269(5224): 676–679. doi: 10.1126/science.269.5224.676 [16] Kalnay E, Kanamitsu M, Kistler R, et al. 1996. The NCEP/NCAR 40-year reanalysis project. Bulletin of the American Meteorological Society, 77(3): 437–472. doi: 10.1175/1520-0477(1996)077<0437:TNYRP>2.0.CO;2 [17] Krumpen T, Gerdes R, Haas C, et al. 2016. Recent summer sea ice thickness surveys in Fram Strait and associated ice volume fluxes. The Cryosphere, 10(2): 523–534. doi: 10.5194/tc-10-523-2016 [18] Krumpen T, Janout M, Hodges K I, et al. 2013. Variability and trends in Laptev Sea ice outflow between 1992–2011. The Cryosphere, 7(1): 349–363. doi: 10.5194/tc-7-349-2013 [19] Kvamstø N G, Skeie P, Stephenson D B. 2004. Impact of Labrador sea-ice extent on the North Atlantic oscillation. International Journal of Climatology, 24(5): 603–612. doi: 10.1002/joc.1015 [20] Kwok R. 2000. Recent changes in Arctic Ocean sea ice motion associated with the North Atlantic Oscillation. Geophysical Research Letters, 27(6): 775–778. doi: 10.1029/1999GL002382 [21] Kwok R. 2007. Baffin Bay ice drift and export: 2002–2007. Geophysical Research Letters, 34(19): L19501. doi: 10.1029/2007GL031204 [22] Kwok R. 2009. Outflow of Arctic ocean sea ice into the Greenland and Barents Seas: 1979–2007. Journal of Climate, 22(9): 2438–2457. doi: 10.1175/2008JCLI2819.1 [23] Kwok R, Cunningham G F, Pang S S. 2004. Fram Strait sea ice outflow. Journal of Geophysical Research: Oceans, 109(C1): C01009. doi: 10.1029/2003JC001785 [24] Kwok R, Maslowski W, Laxon S W. 2005. On large outflows of Arctic sea ice into the Barents Sea. Geophysical Research Letters, 32(22): L22503 [25] Kwok R, Pedersen L T, Gudmandsen P, et al. 2010. Large sea ice outflow into the Nares Strait in 2007. Geophysical Research Letters, 37(3): L03502 [26] Kwok R, Spreen G, Pang S. 2013. Arctic sea ice circulation and drift speed: Decadal trends and ocean currents. Journal of Geophysical Research: Oceans, 118(5): 2408–2425. doi: 10.1002/jgrc.20191 [27] Melling H, Gratton Y, Ingram G. 2001. Ocean circulation within the North Water polynya of Baffin Bay. Atmosphere-Ocean, 39(3): 301–325. doi: 10.1080/07055900.2001.9649683 [28] Parkinson C L. 2014. Global sea ice coverage from satellite data: Annual cycle and 35-Yr trends. Journal of Climate, 27(24): 9377–9382. doi: 10.1175/JCLI-D-14-00605.1 [29] Parkinson C L, Cavalieri D J. 2002. A 21 year record of Arctic sea-ice extents and their regional, seasonal and monthly variability and trends. Annals of Glaciology, 34(1): 441–446 [30] Peterson I K, Pettipas R. 2013. Trends in air temperature and sea ice in the Atlantic Large Aquatic Basin and adjoining areas. Canadian Technical Report of Hydrography and Ocean Sciences, Dartmouth: Fisheries and Oceans Canada, 290. [31] Screen J A, Deser C, Simmonds I. 2012. Local and remote controls on observed Arctic warming. Geophysical Research Letters, 39(10): L10709 [32] Serreze M C, Barrett A P, Stroeve J C, et al. 2009. The emergence of surface-based Arctic amplification. The Cryosphere, 3(1): 11–19. doi: 10.5194/tc-3-11-2009 [33] Smedsrud L H, Halvorsen M H, Stroeve J C, et al. 2017. Fram Strait sea ice export variability and September Arctic sea ice extent over the last 80 years. The Cryosphere, 11(1): 65–79. doi: 10.5194/tc-11-65-2017 [34] Smedsrud L H, Sirevaag A, Kloster K, et al. 2011. Recent wind driven high sea ice area export in the Fram Strait contributes to Arctic sea ice decline. The Cryosphere, 5(4): 821–829. doi: 10.5194/tc-5-821-2011 [35] Spreen G, Kern S, Stammer D, et al. 2006. Satellite-based estimates of sea-ice volume flux through Fram Strait. Annals of Glaciology, 44(1): 321–328 [36] Stern H L, Heide-Jørgensen M P. 2003. Trends and variability of sea ice in Baffin Bay and Davis Strait, 1953–2001. Polar Research, 22(1): 11–18 [37] Stroeve J C, Markus T, Boisvert L, et al. 2014. Changes in Arctic melt season and implications for sea ice loss. Geophysical Research Letters, 41(4): 1216–1225. doi: 10.1002/2013GL058951 [38] Stroeve J C, Schroder D, Tsamados M, et al. 2018. Warm winter, thin ice?. The Cryosphere, 12(5): 1791–1809. doi: 10.5194/tc-12-1791-2018 [39] Sumata H, Lavergne T, Girard-Ardhuin F, et al. 2014. An intercomparison of Arctic ice drift products to deduce uncertainty estimates. Journal of Geophysical Research: Oceans, 119(8): 4887–4921. doi: 10.1002/2013JC009724 [40] Tilling R L, Ridout A, Shepherd A. 2016. Near-real-time Arctic sea ice thickness and volume from CryoSat-2. The Cryosphere, 10(5): 2003–2012. doi: 10.5194/tc-10-2003-2016 [41] Tschudi M, Meier W N, Stewart J S, et al. 2019. Polar Pathfinder Daily 25 km EASE-Grid Sea Ice Motion Vectors, Version 4. NASA, Boulder, Colorado, doi: 10.5067/INAWUWO7QH7B. [42] Wu Bingyi, Zhang Renhe, D’Arrigo R, et al. 2013. On the relationship between winter sea ice and summer atmospheric circulation over eurasia. Journal of Climate, 26(15): 5523–5536. doi: 10.1175/JCLI-D-12-00524.1 [43] Yang Qian, Dixon T H, Myers P G, et al. 2016. Recent increases in Arctic freshwater flux affects Labrador Sea convection and Atlantic overturning circulation. Nature Communications, 7: 10525. doi: 10.1038/ncomms10525 [44] Zhang Zehua, Bi Haibo, Sun Ke, et al. 2017. Arctic sea ice volume export through the Fram Strait from combined satellite and model data: 1979–2012. Acta Oceanologica Sinica, 36(1): 44–55. doi: 10.1007/s13131-017-0992-4 [45] Zhang Xiangdong, Sorteberg A, Zhang Jing, et al. 2008. Recent radical shifts of atmospheric circulations and rapid changes in Arctic climate system. Geophysical Research Letters, 35(22): L22701. doi: 10.1029/2008GL035607 [46] Zweng M M, Münchow A. 2006. Warming and freshening of Baffin Bay, 1916–2003. Journal of Geophysical Research: Oceans, 111(C7): C07016. doi: 10.1029/2005JC003093 -


 点击查看大图
计量
- 文章访问数: 634
- HTML全文浏览量: 205
- PDF下载量: 36
- 被引次数: 0

