

Variations in melt supply along an orthogonal supersegment of the Southwest Indian Ridge (16°–25°E)
-
Abstract: The orthogonal supersegment of the ultraslow-spreading Southwest Indian Ridge at 16°–25°E is characterized by significant along-axis variations of mantle potential temperature. A detailed analysis of multibeam bathymetry, gravity, and magnetic data were performed to investigate its variations in magma supply and crustal accretion process. The results revealed distinct across-axis variations of magma supply. Specifically, the regionally averaged crustal thickness reduced systematically from around 7 Ma to the present, indicating a regionally decreasing magma supply. The crustal structure is asymmetric in regional scale between the conjugate ridge flanks, with the faster-spreading southern flank showing thinner crust and greater degree of tectonic extension. Geodynamic models of mantle melting suggested that the observed variations in axial crustal thickness and major element geochemistry can be adequately explained by an eastward decrease in mantle potential temperature of about 40°C beneath the ridge axis. In this work, a synthesized model was proposed to explain the axial variations of magma supply and ridge segmentation stabilities. The existence of large ridge-axis offsets may play important roles in controlling melt supply. Several large ridge-axis offsets in the eastern section (21°–25°E) caused sustained along-axis focusing of magma supply at the centers of eastern ridge segments, enabling quasi-stable segmentation. In contrast, the western section (16°–21°E), which lacks large ridge-axis offsets, is associated with unstable segmentation patterns.
-
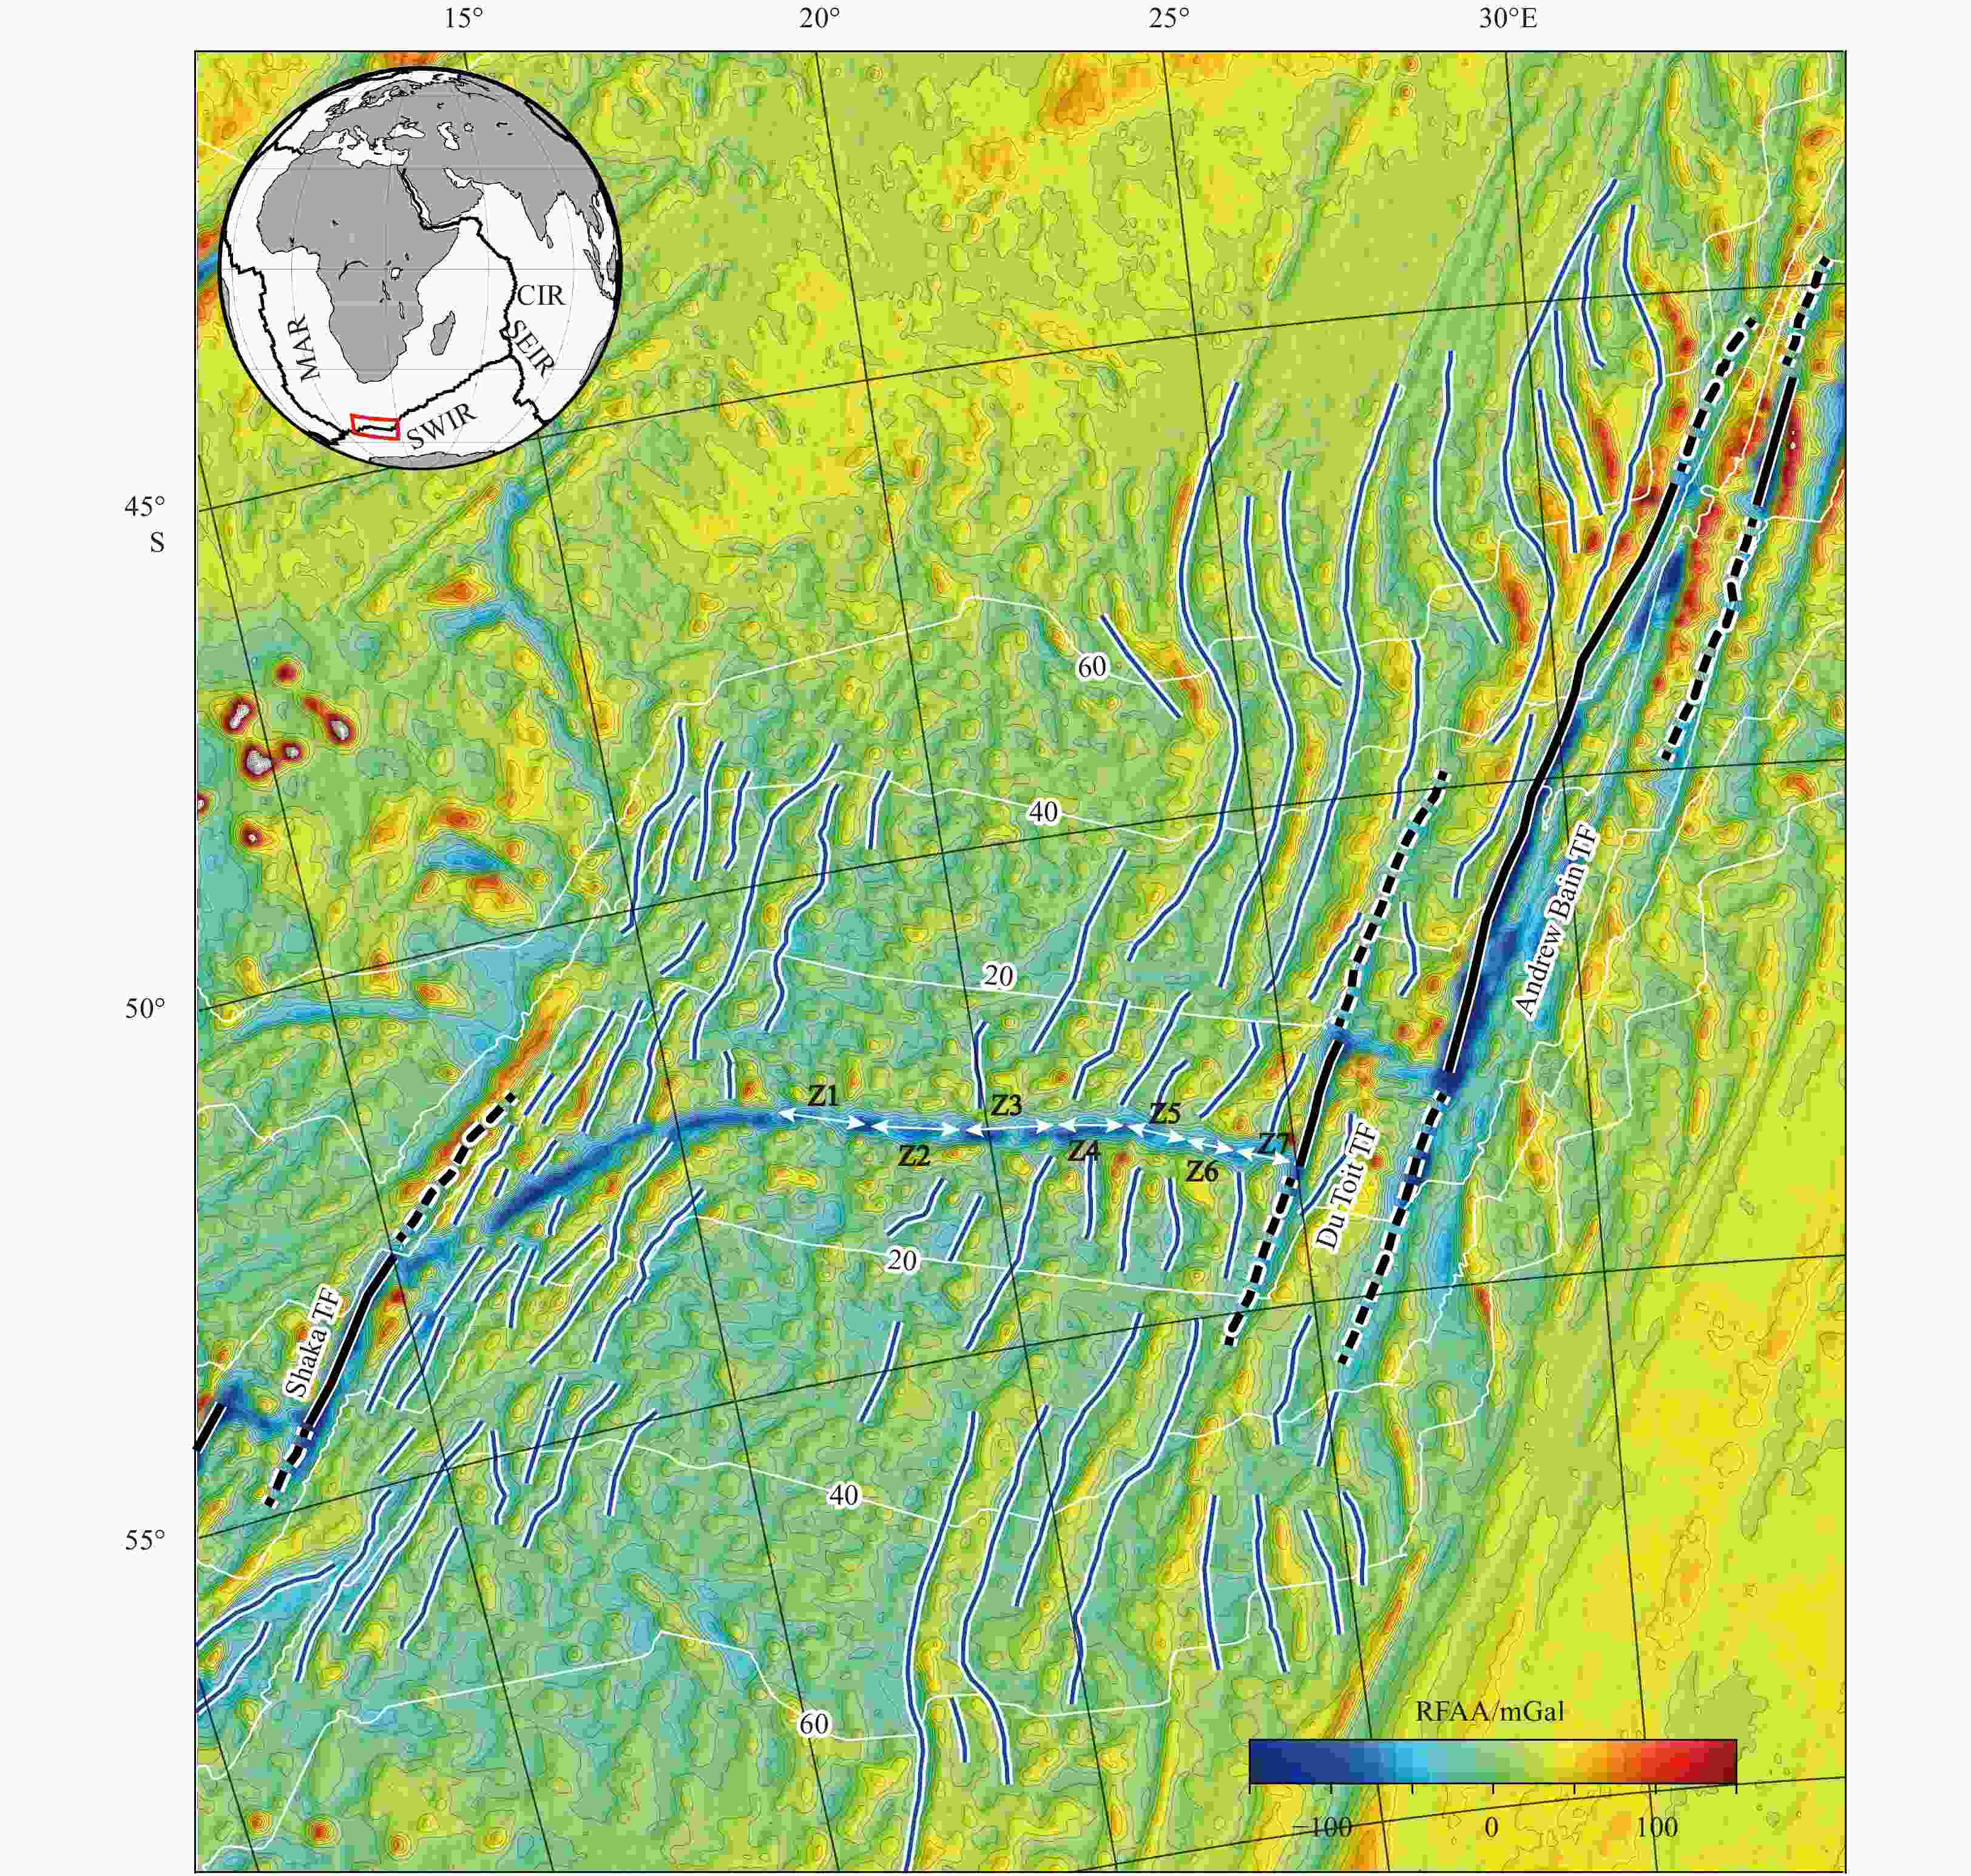
Figure 1. Residual free-air gravity anomaly (RFAA) of the Southwest Indian Ridge at 4°–35°E. The RFAA is calculated from the latest global marine gravity model (Sandwell et al., 2014) after subtracting the crustal age-dependent component (Fig. S1). Segment boundaries are marked by thick black (transform faults and fracture zones) and blue (non-transform discontinuities) lines, respectively. Thin white lines mark crustal age isochrones from Müller et al. (2008). White double arrows show the location of axial zones as defined in Fig. 2. Shaka TF: Shaka transform fault; Du Toit TF: Du Toit transform fault; Andrew Bain TF: Andrew Bain transform fault. The red box in the inset shows the location of the study area. CIR: Central Indian Ridge; SEIR: Southeast Indian Ridge; SWIR: Southwest Indian Ridge; MAR: Mid-Atlantic Ridge.
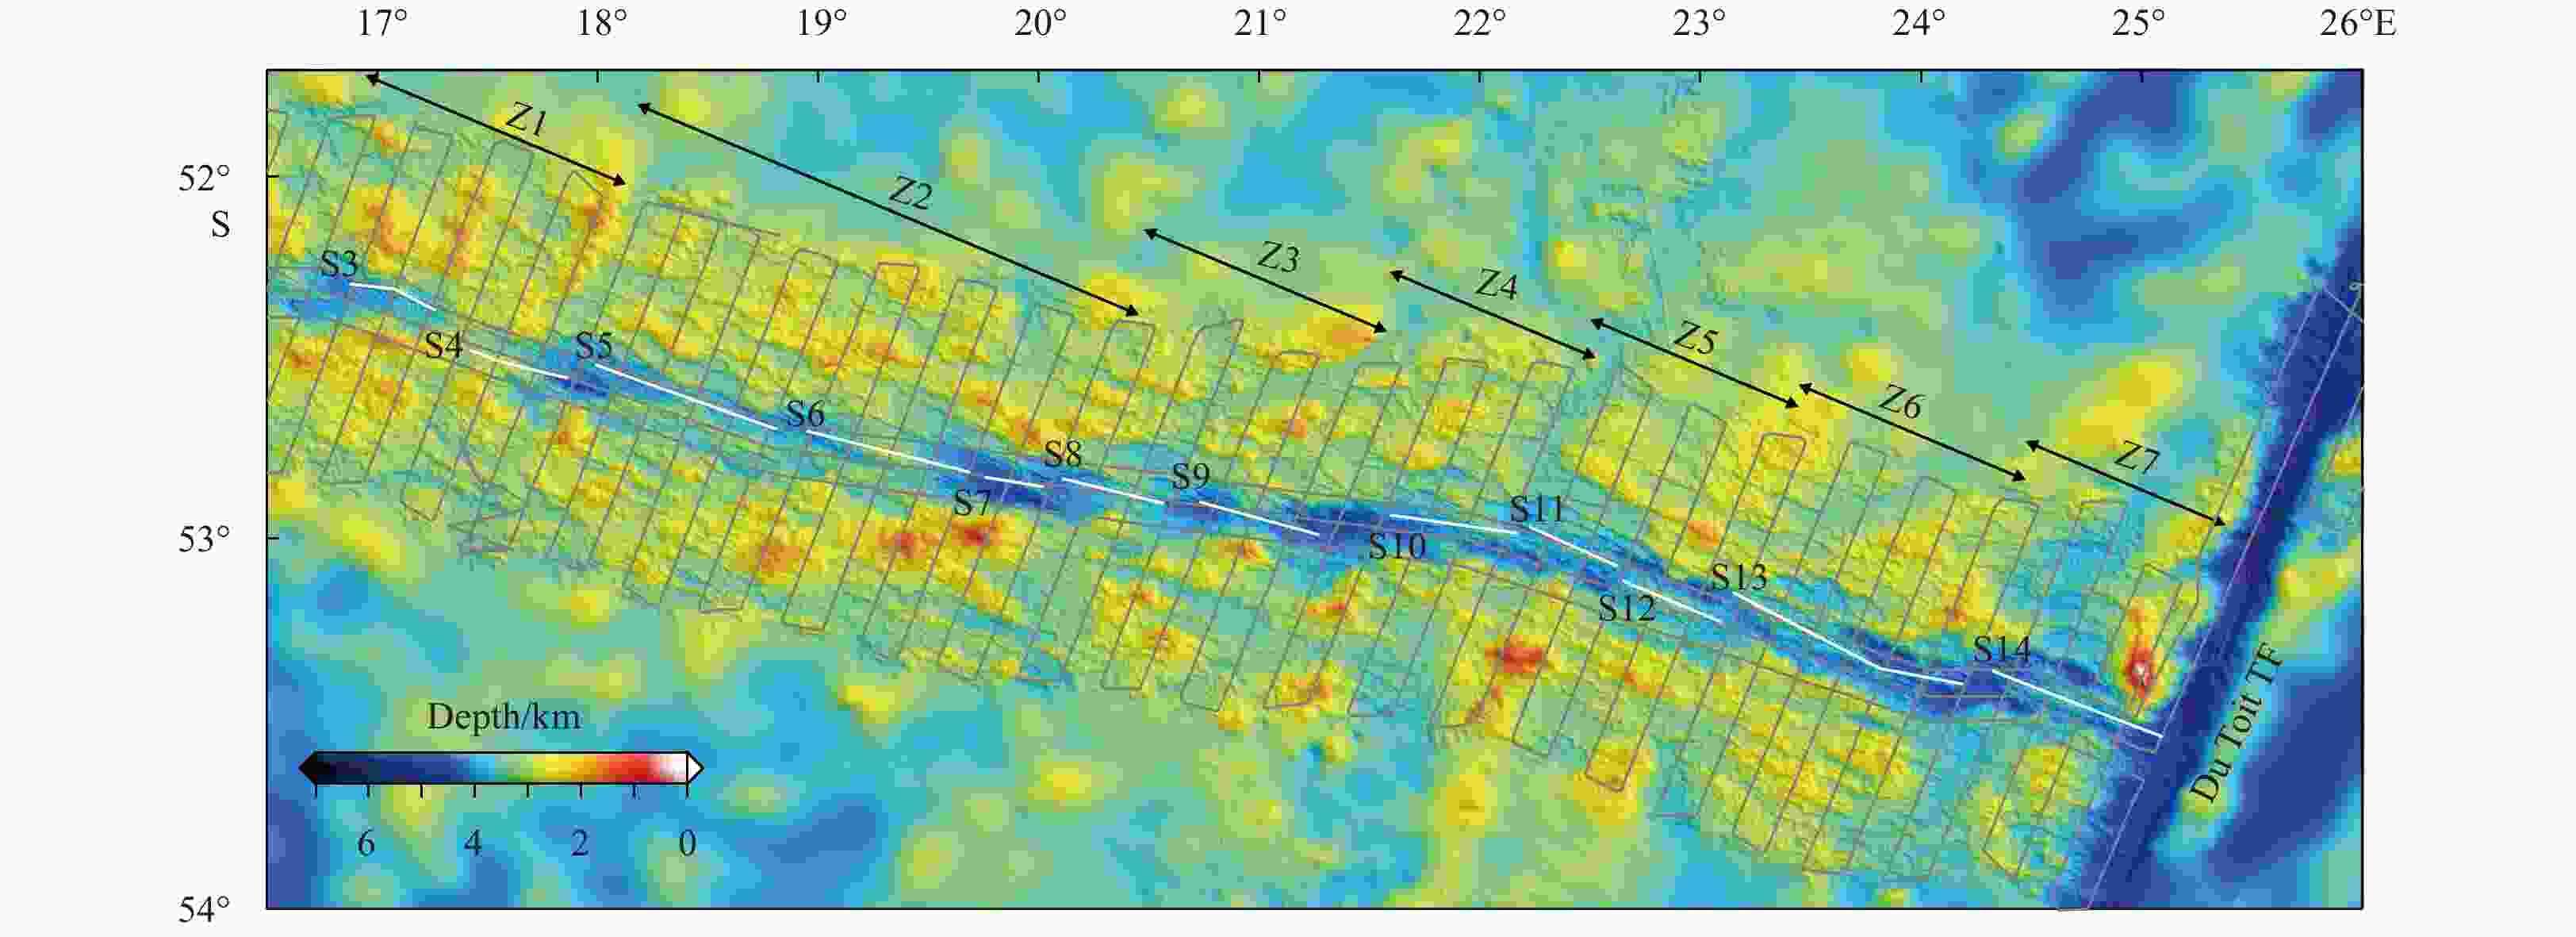
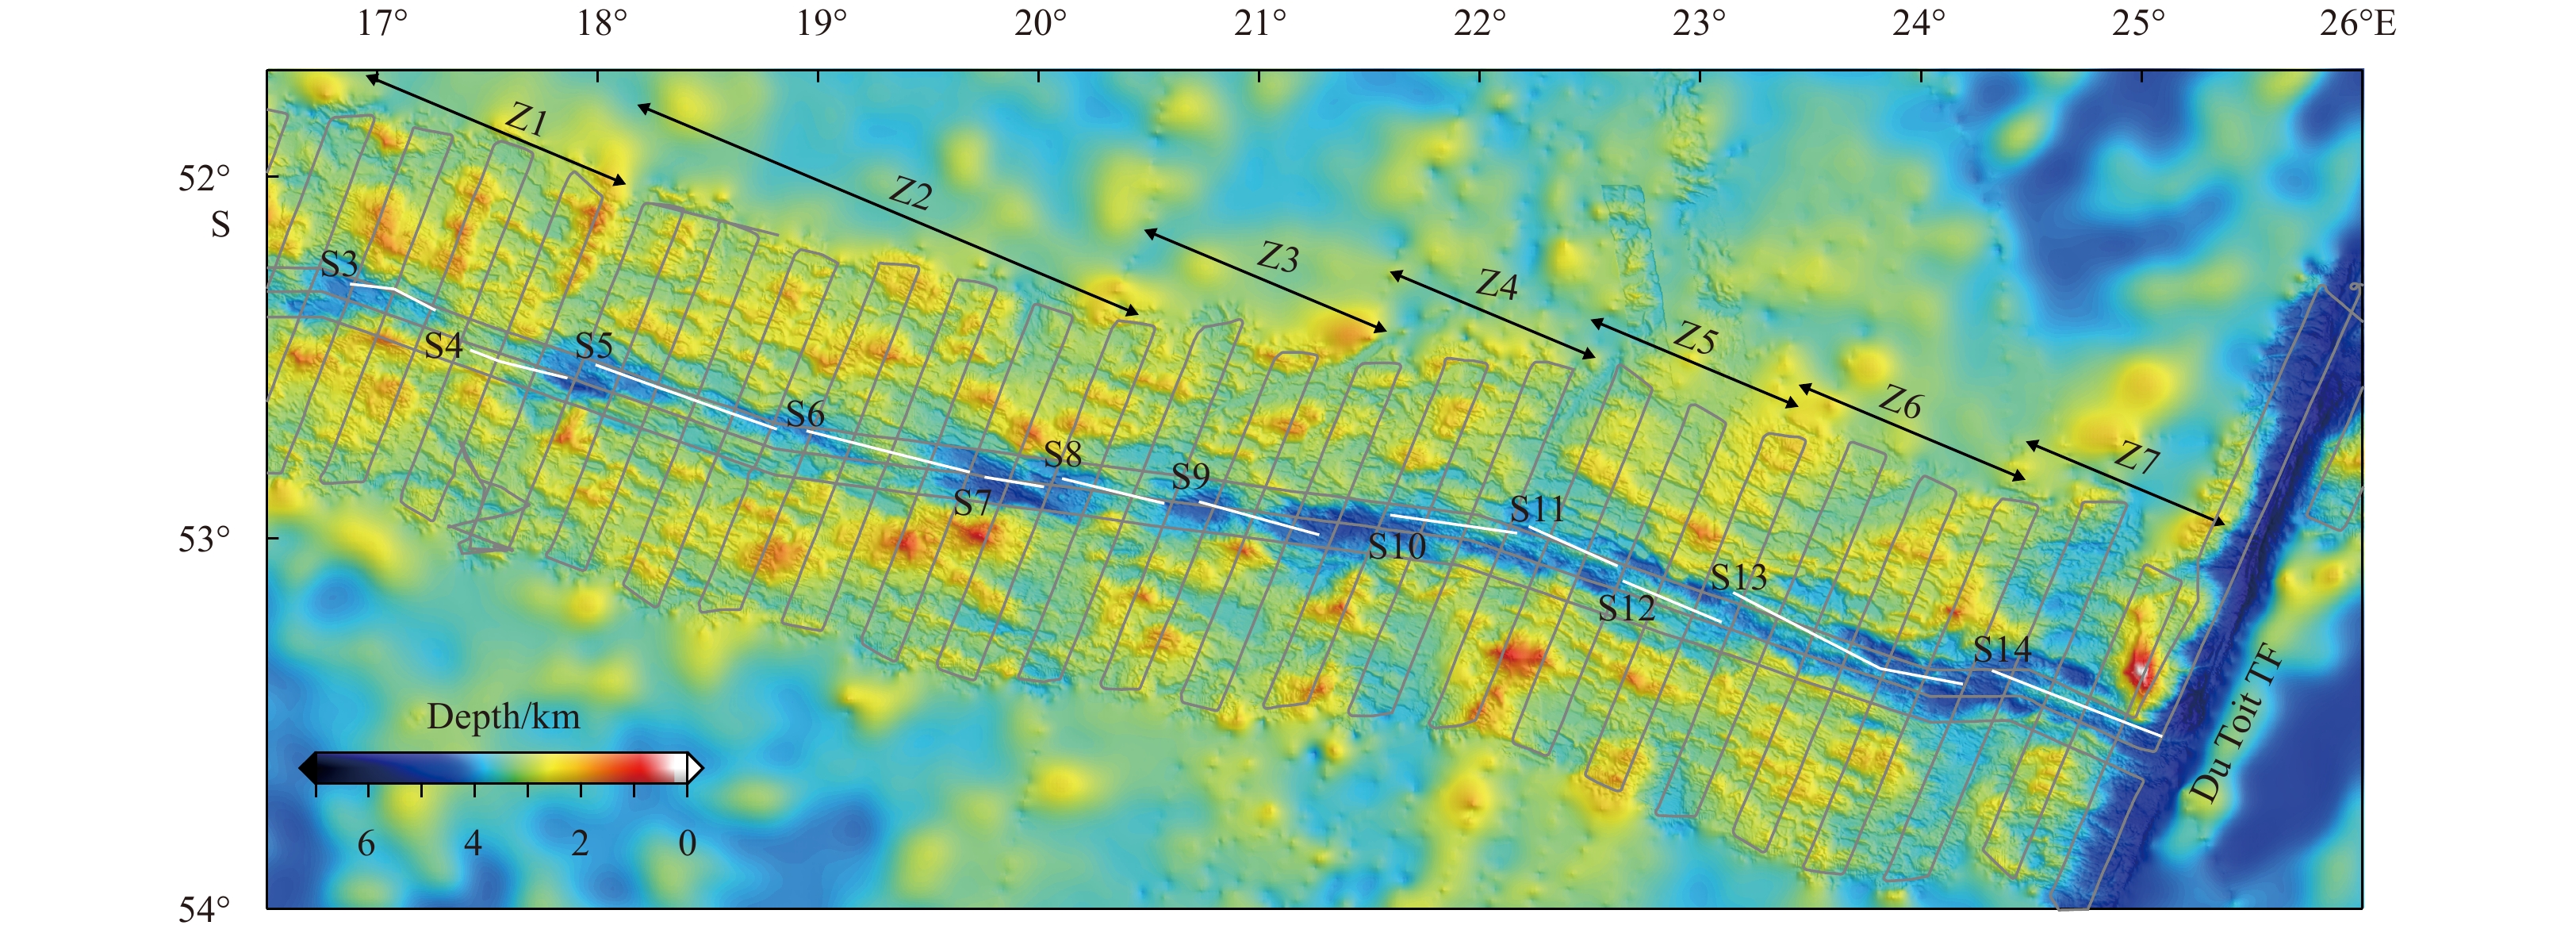
Figure 2. Shaded-relief bathymetric map of the orthogonal supersegment, with multibeam bathymetry near the axis and satellite-derived bathymetry filling the gaps. The white lines indicate ridge segments. Segment names S3 to S14 are adopted from the definition of Grindlay et al. (1998). Z1 to Z7 are zones marked to facilitate analysis. Thin gray lines show the ship tracklines.

Figure 3. Maps of mantle Bouguer anomaly (MBA) of the 16.5°–26°E area (a) (after Grindlay et al., 1998), the residual mantle Bouguer anomaly (RMBA) based on the thermal correction of Fig. S3 (b), and the relative crustal thickness derived from the downward continuation of the RMBA to a reference depth of 9 km (c). Labels are the same as in Fig. 2. The red and black dots in a are magnetic anomaly reversals from DeMets et al. (2015).

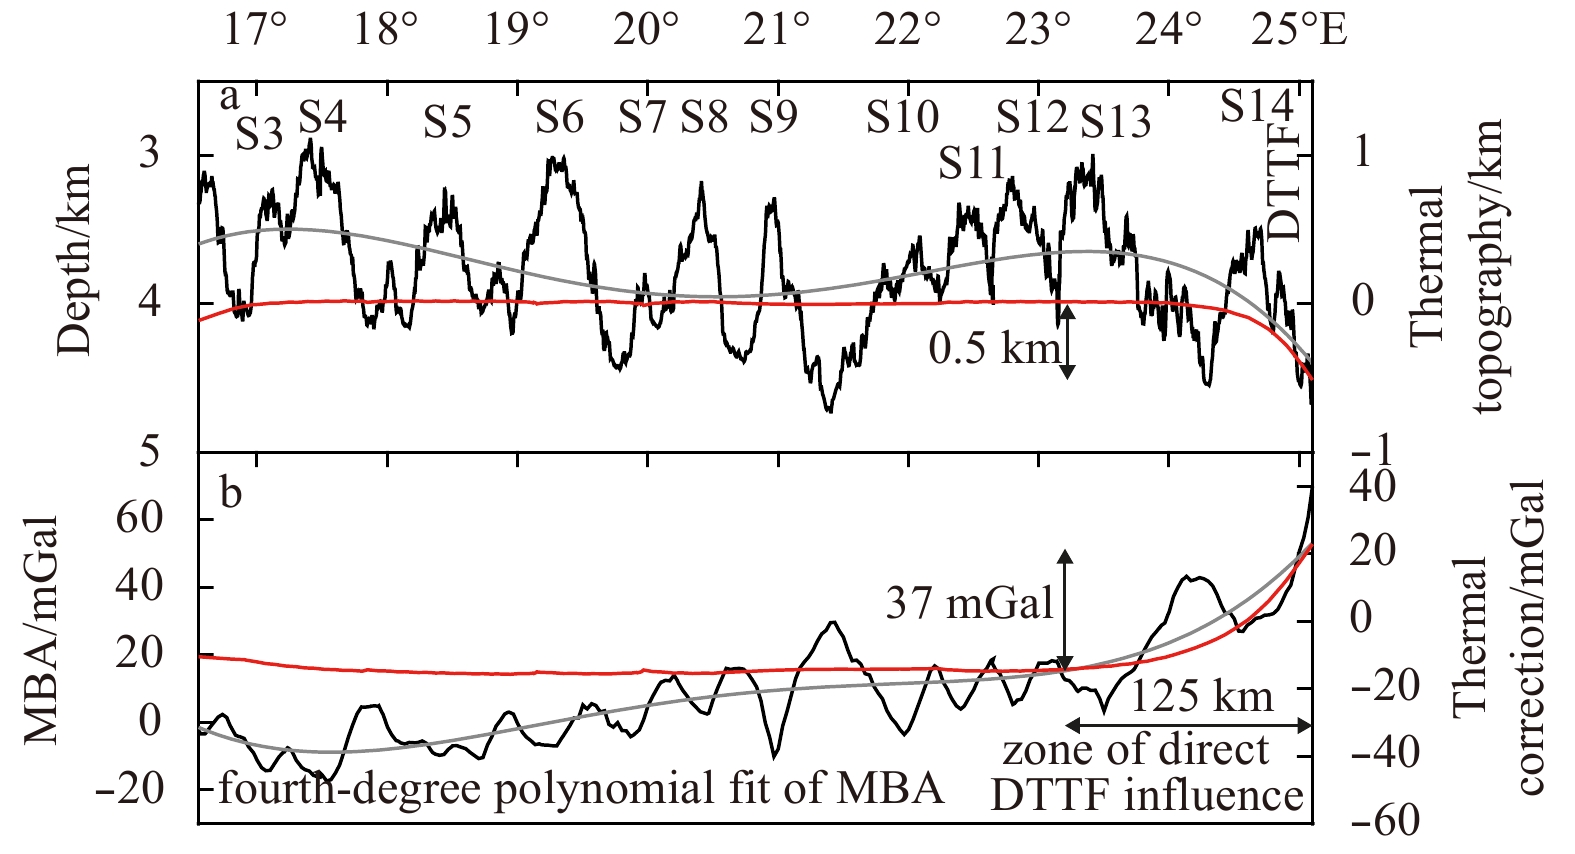
Figure 4. Axial variations of observed and calculated depth and gravity anomalies. a. Along-axis variations of topography (black line) and thermal isostatic topography (red line). Labels in the upper panel show the segments named by Grindlay et al. (1998) as in Fig. 2. DTTF: Du Toit transform fault. b. Along-axis variations of MBA (black line) and the calculated gravity effect of 3D plate cooling (red line). The thick gray line is the fourth-degree polynomial fit of the mantle Bouguer anomaly (MBA).
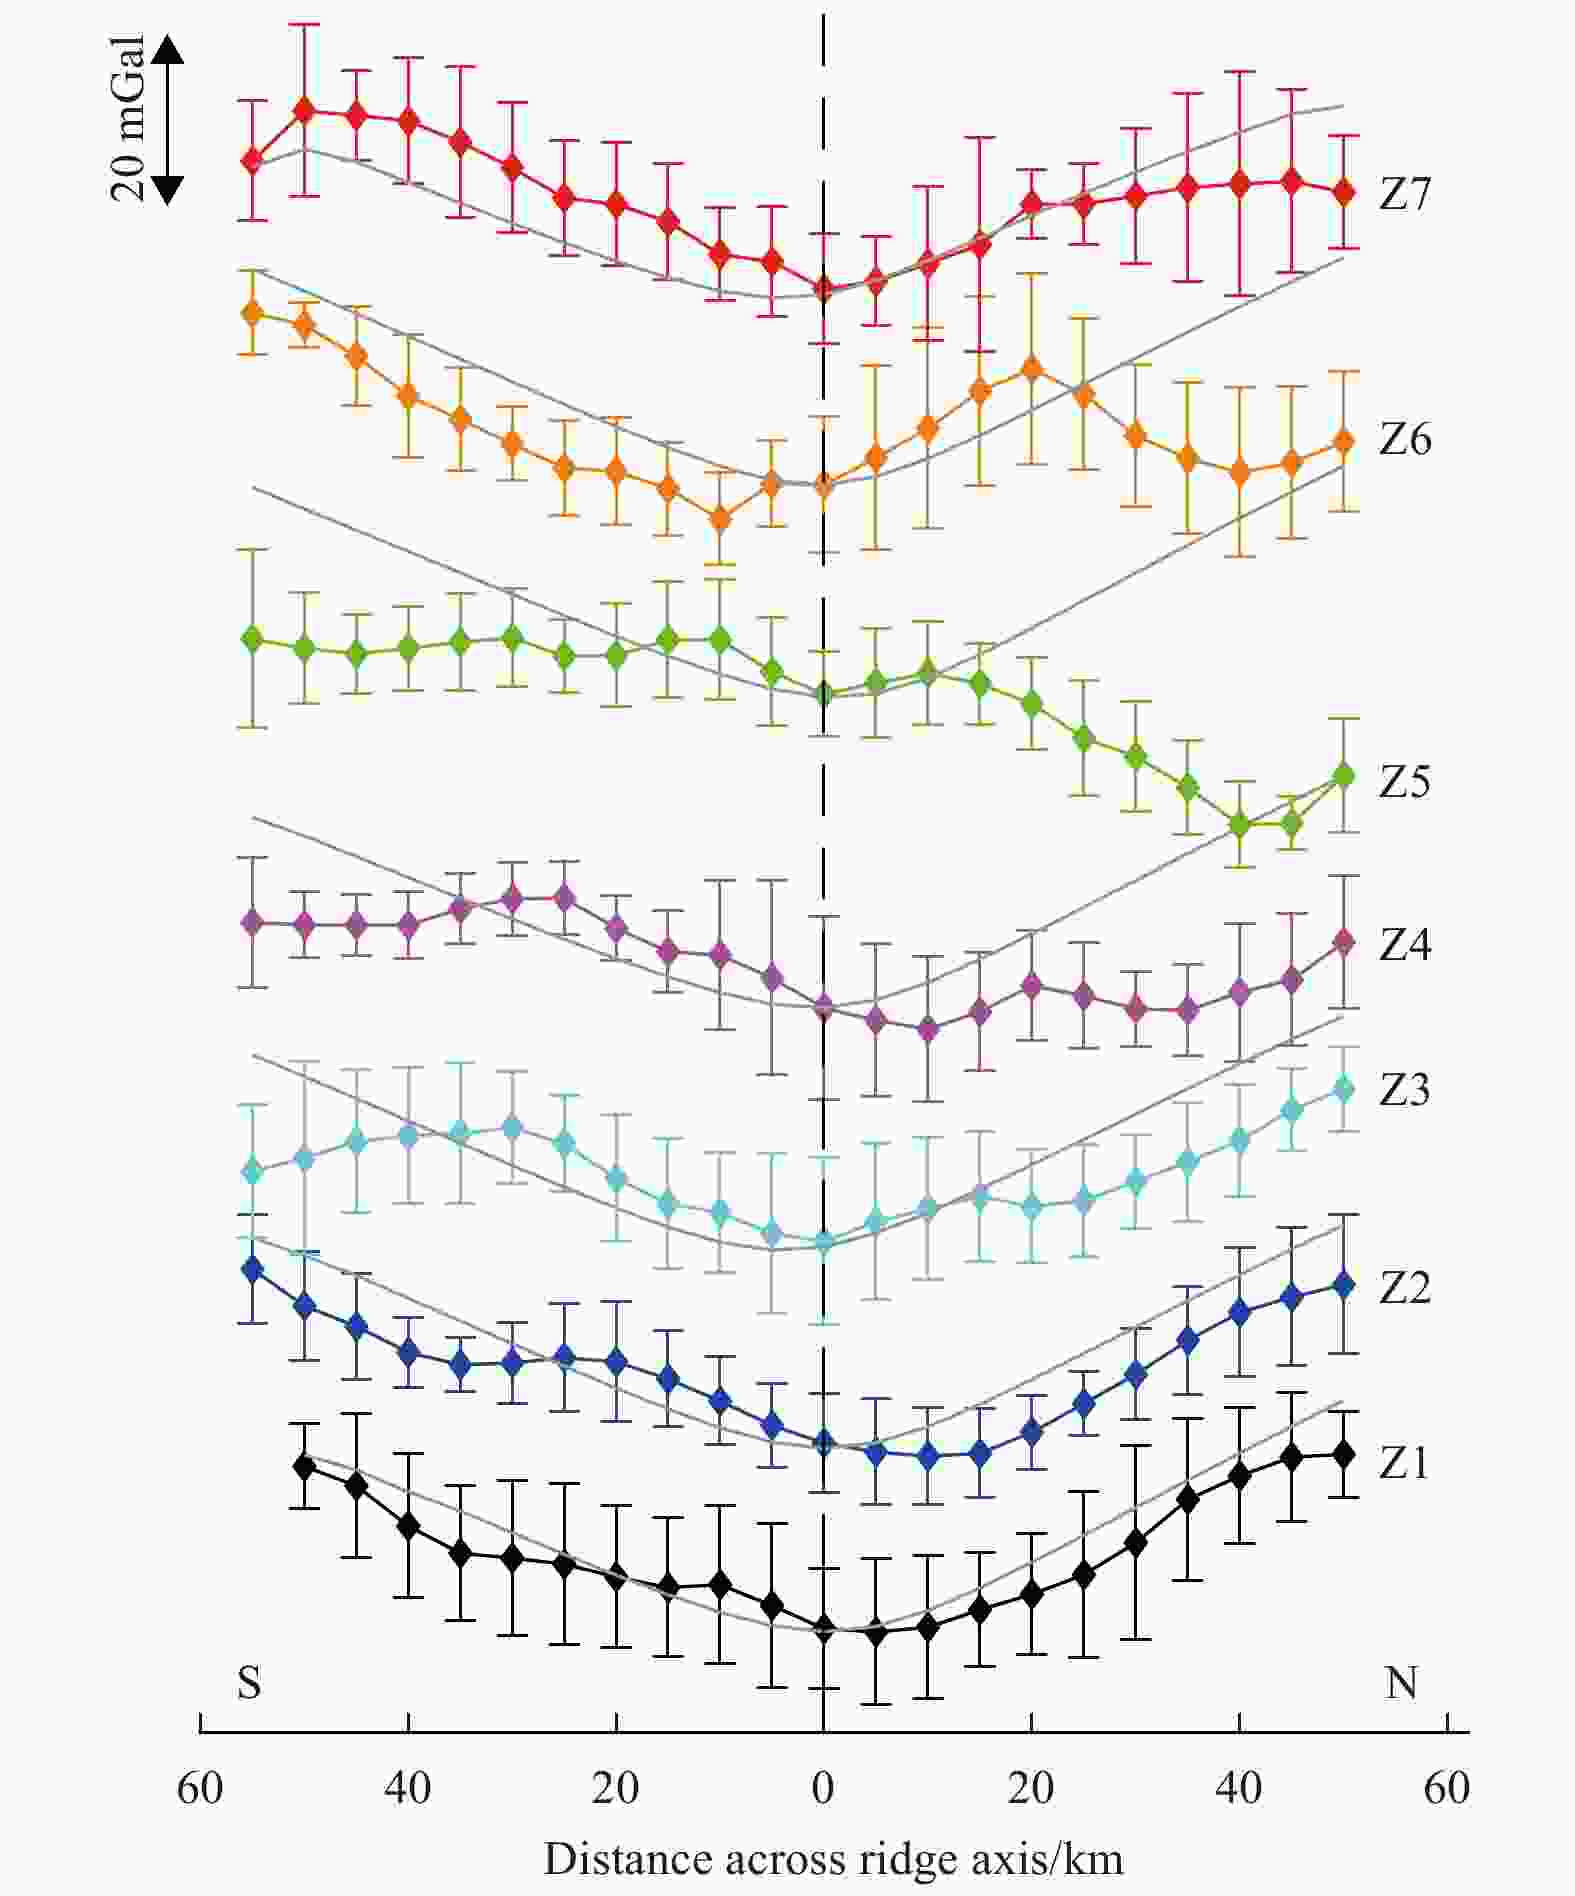
Figure 5. Averaged across-axis variations in MBA along ship tracks in each zone. Gray lines are the averaged values of the calculated gravity effect due to 3D thermal cooling from Fig. 2c; the baseline value of the thermal cooling effect for the entire study area was shifted to match the observed overall values of the axial MBA profiles. The dashed black line indicates the ridge axis position. For illustration purpose, the baselines of each profile pair are shifted. S: south; N: north.
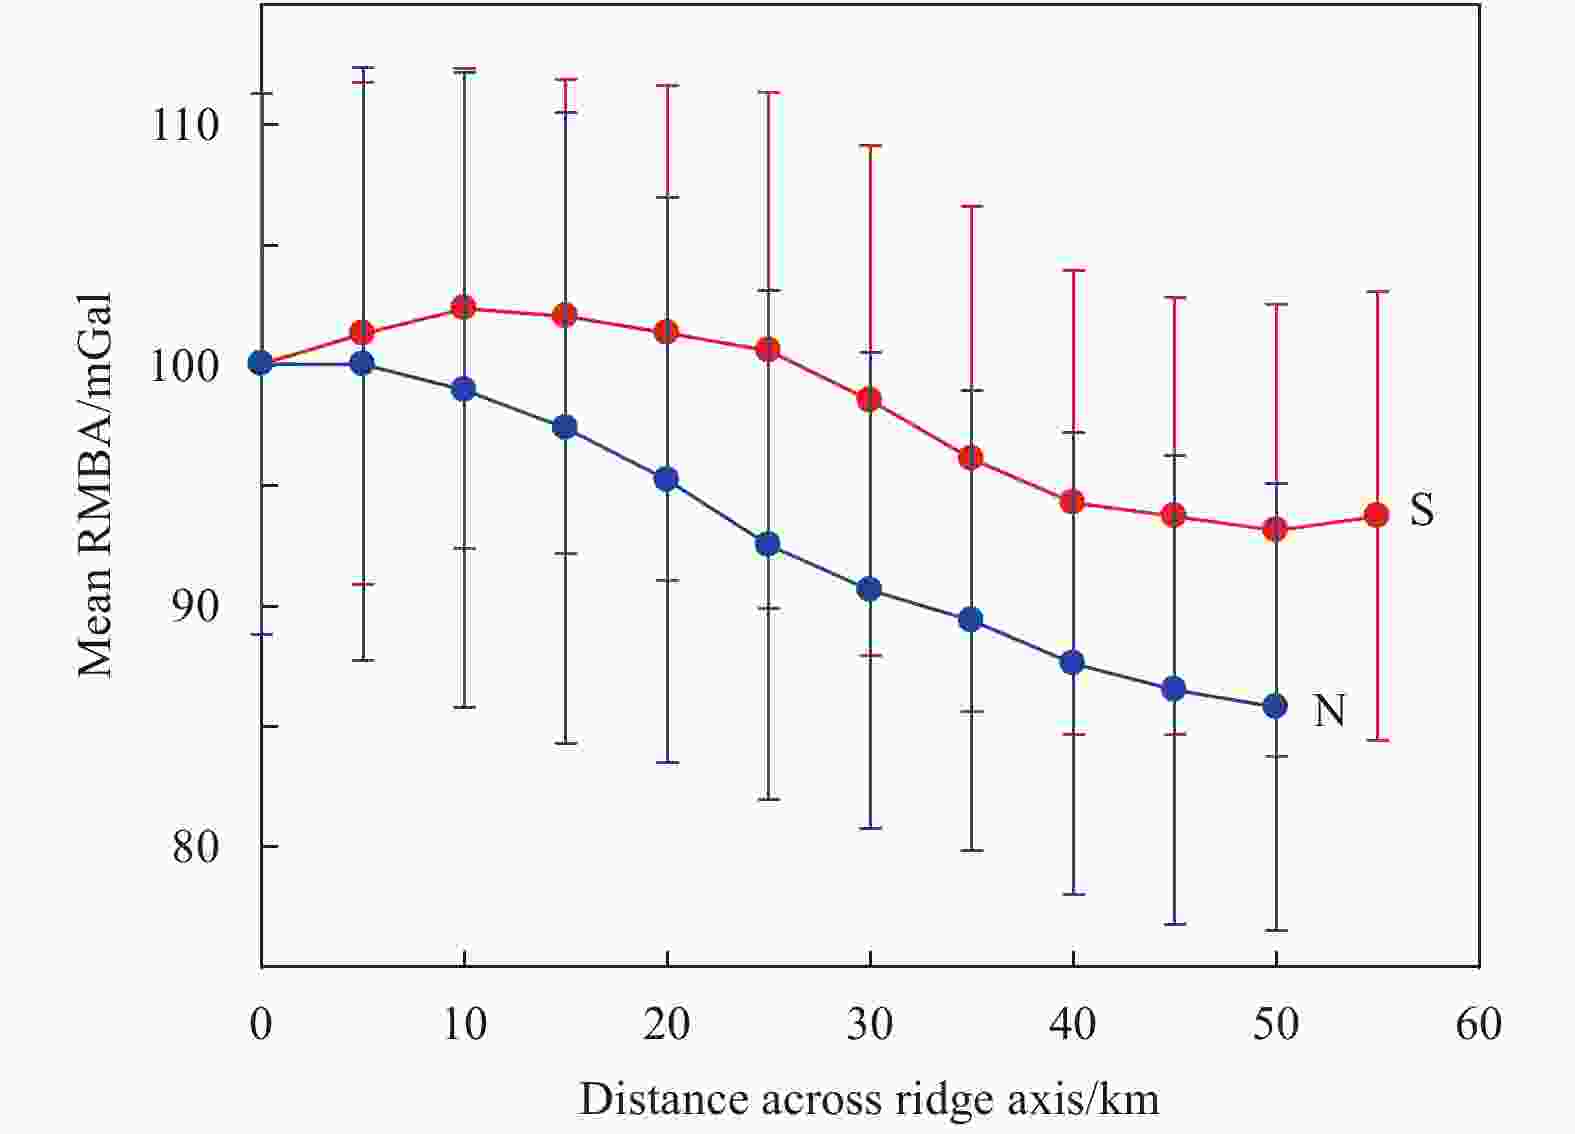
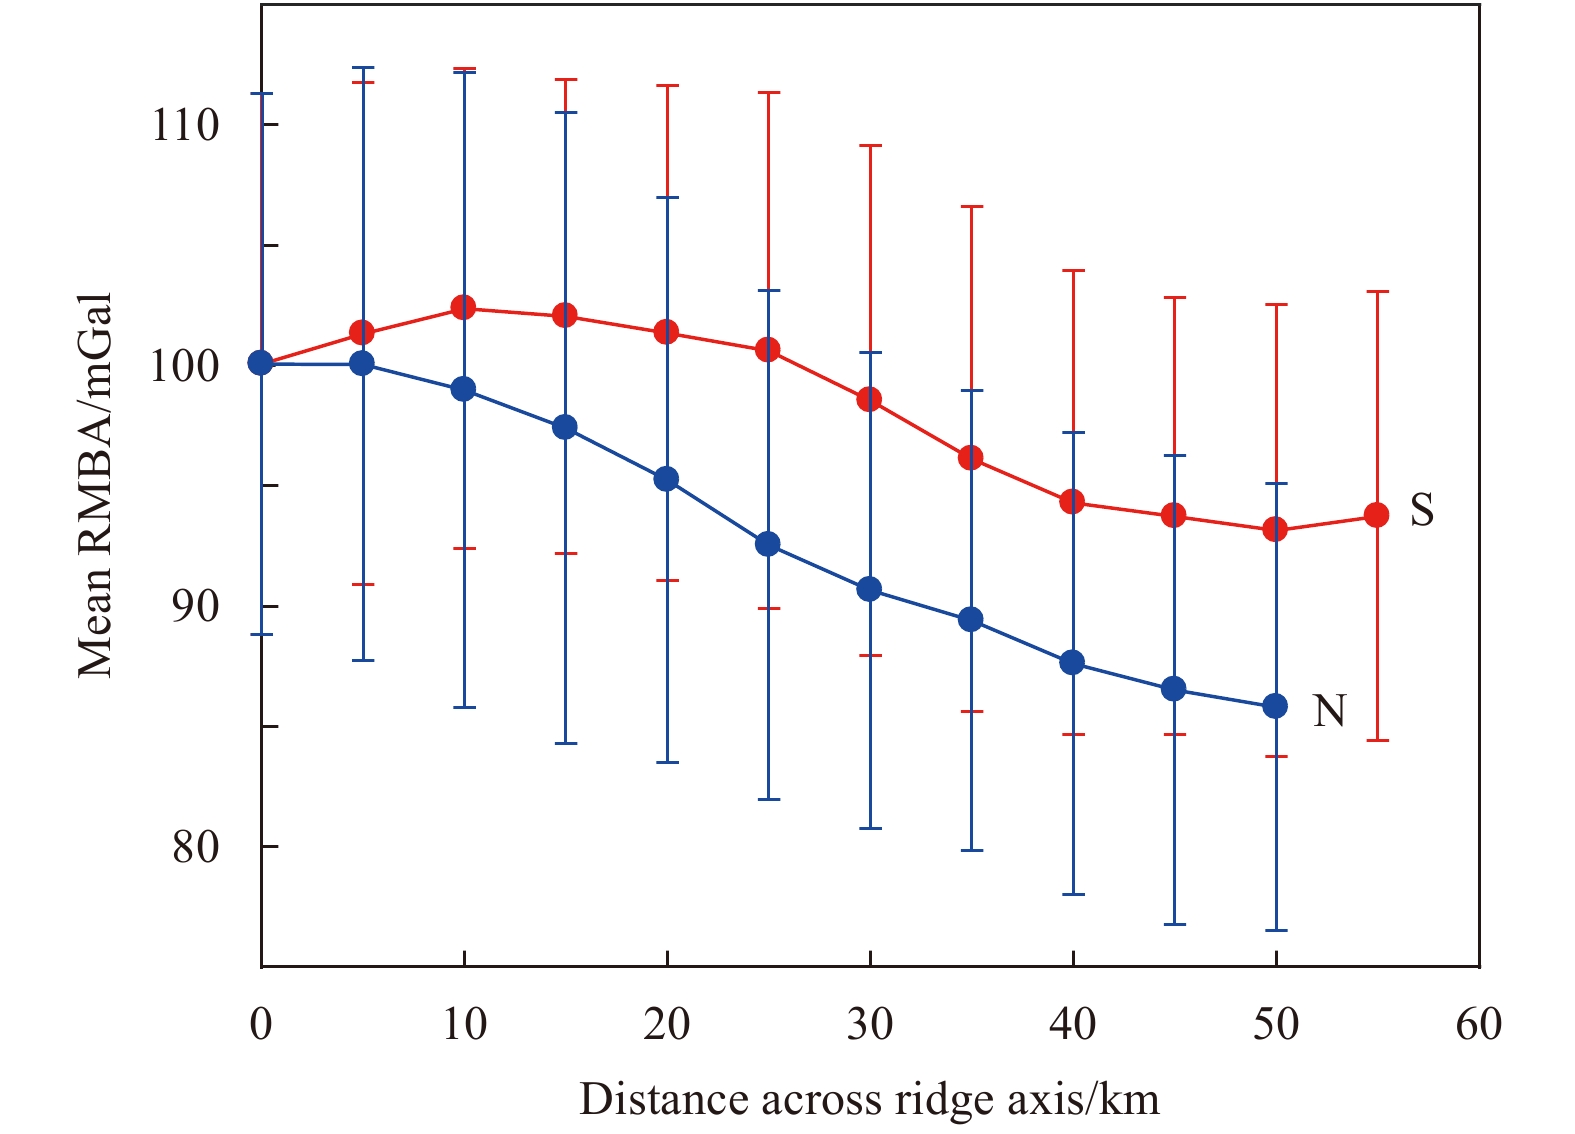
Figure 6. Regionally averaged across-axis variations of RMBA at conjugate ridge flanks in all zones. S: south; N: north.
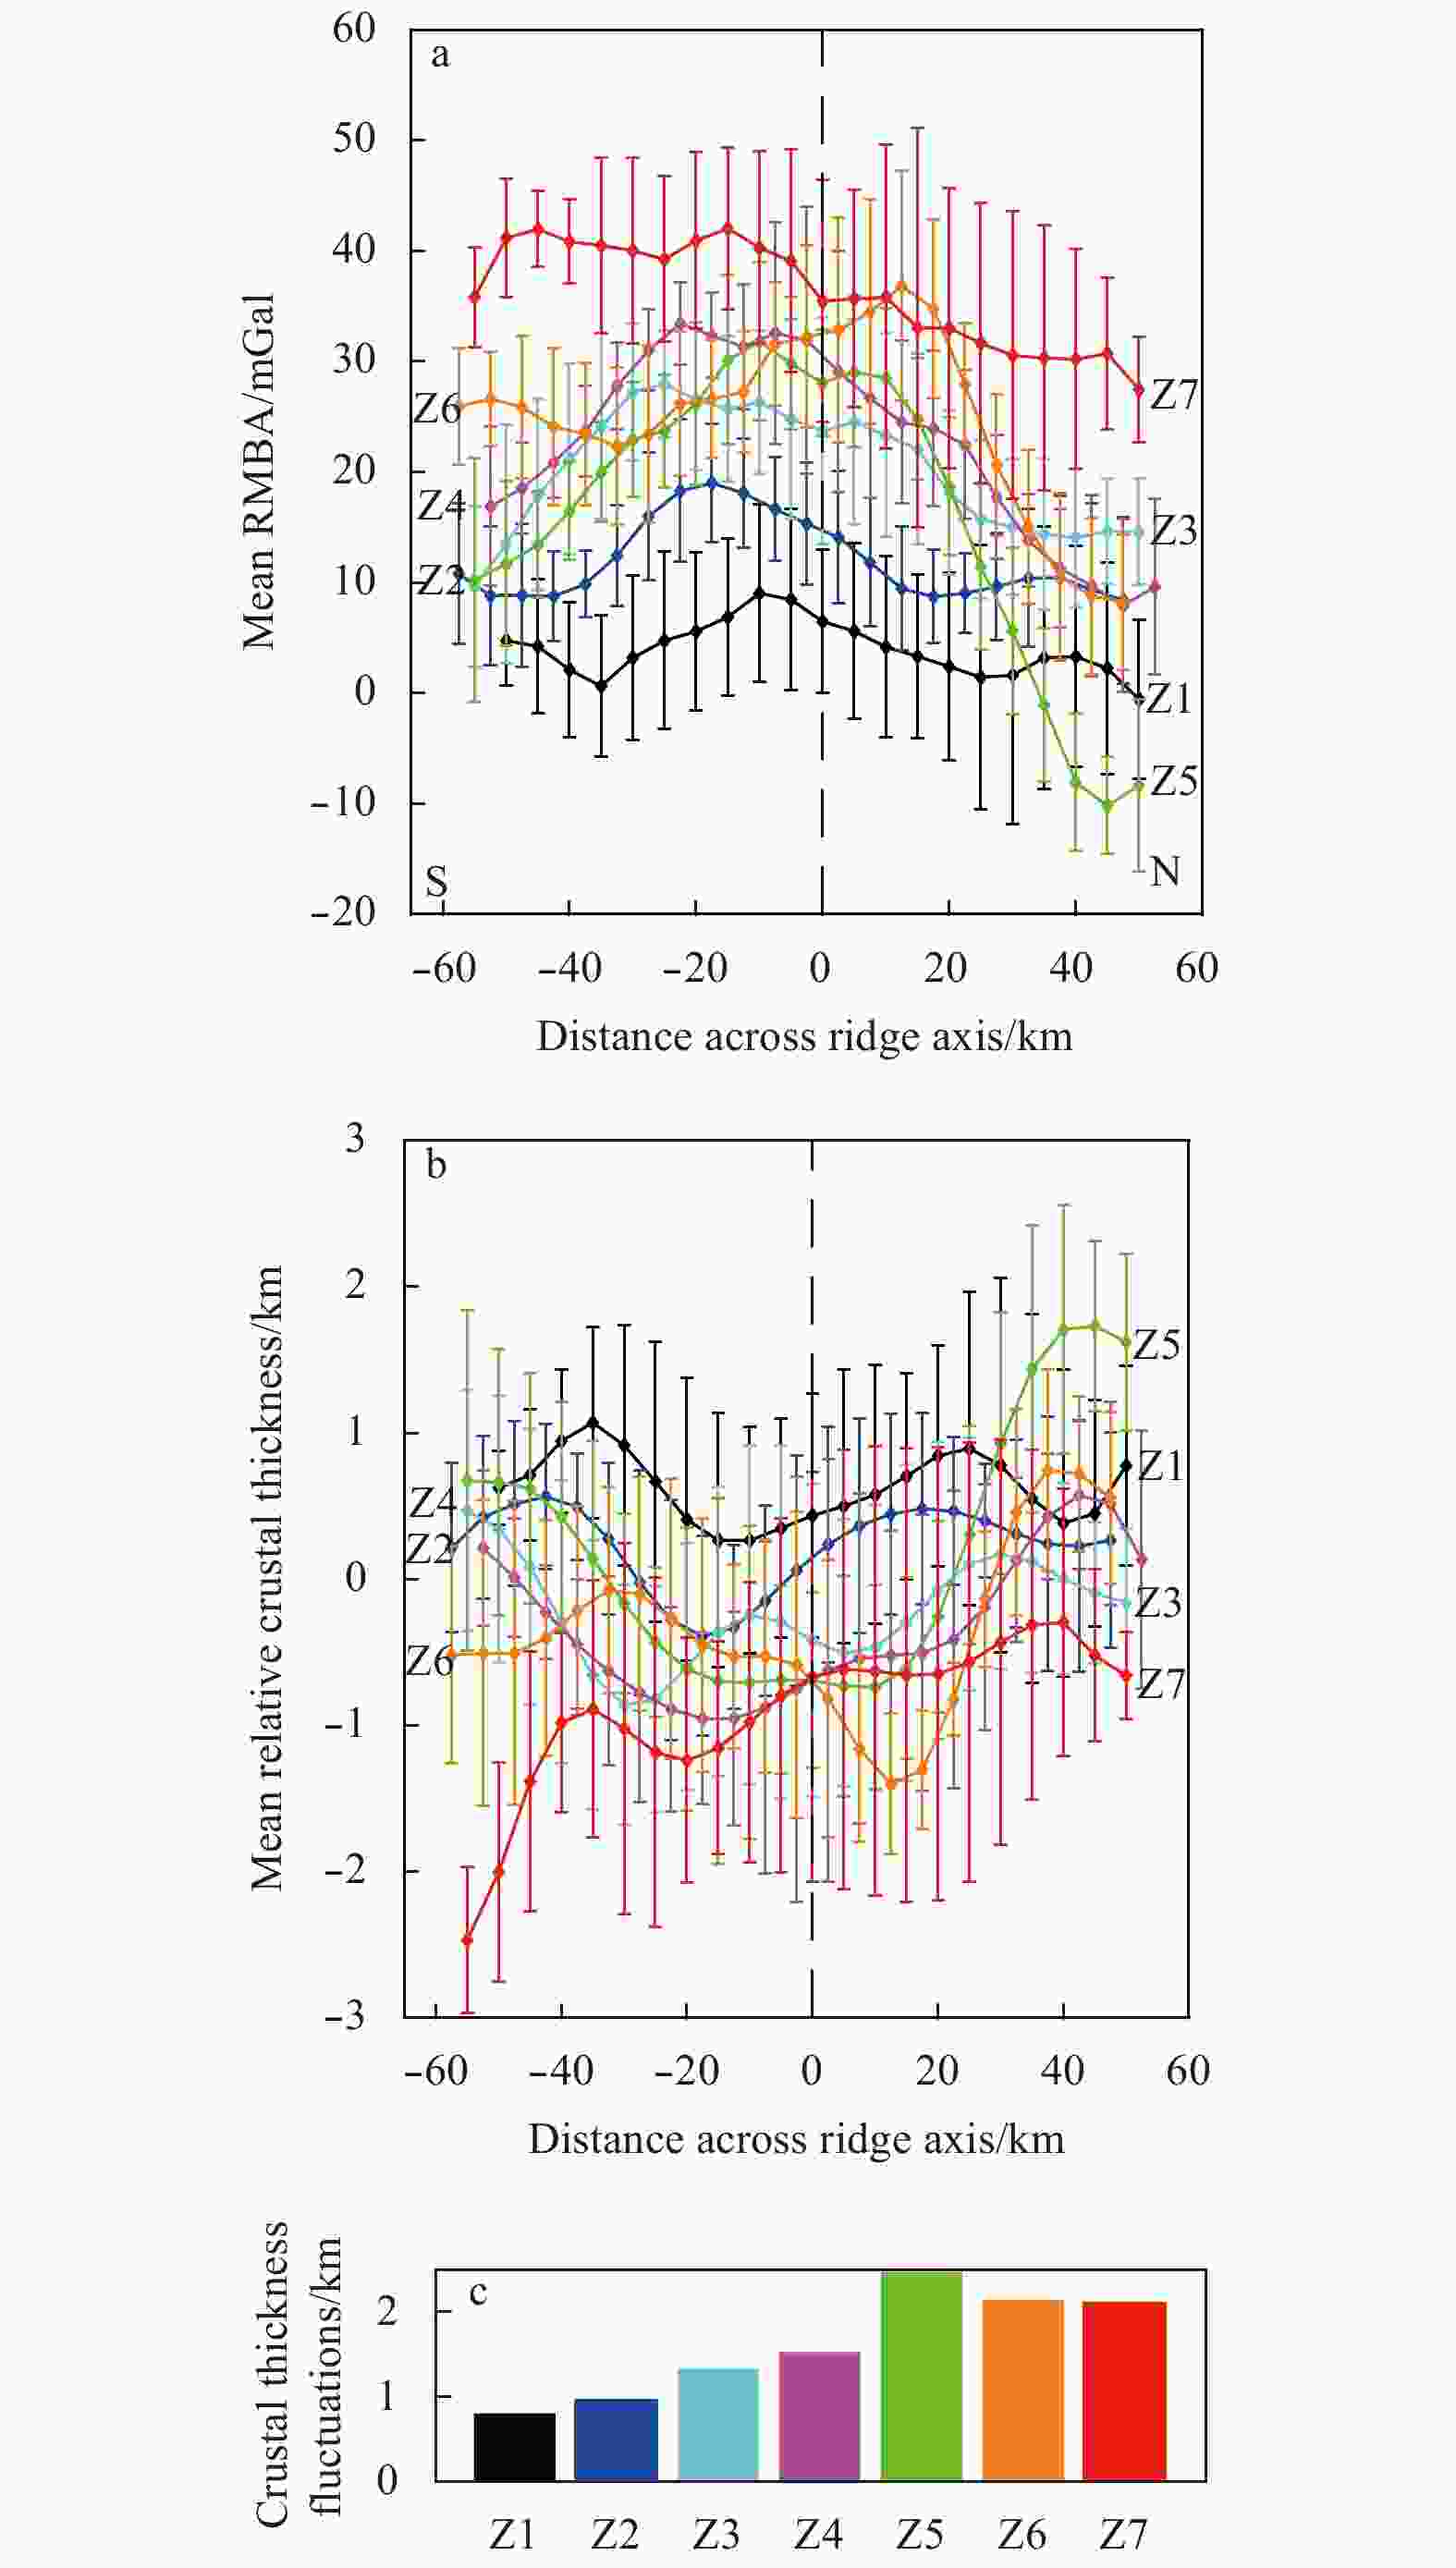
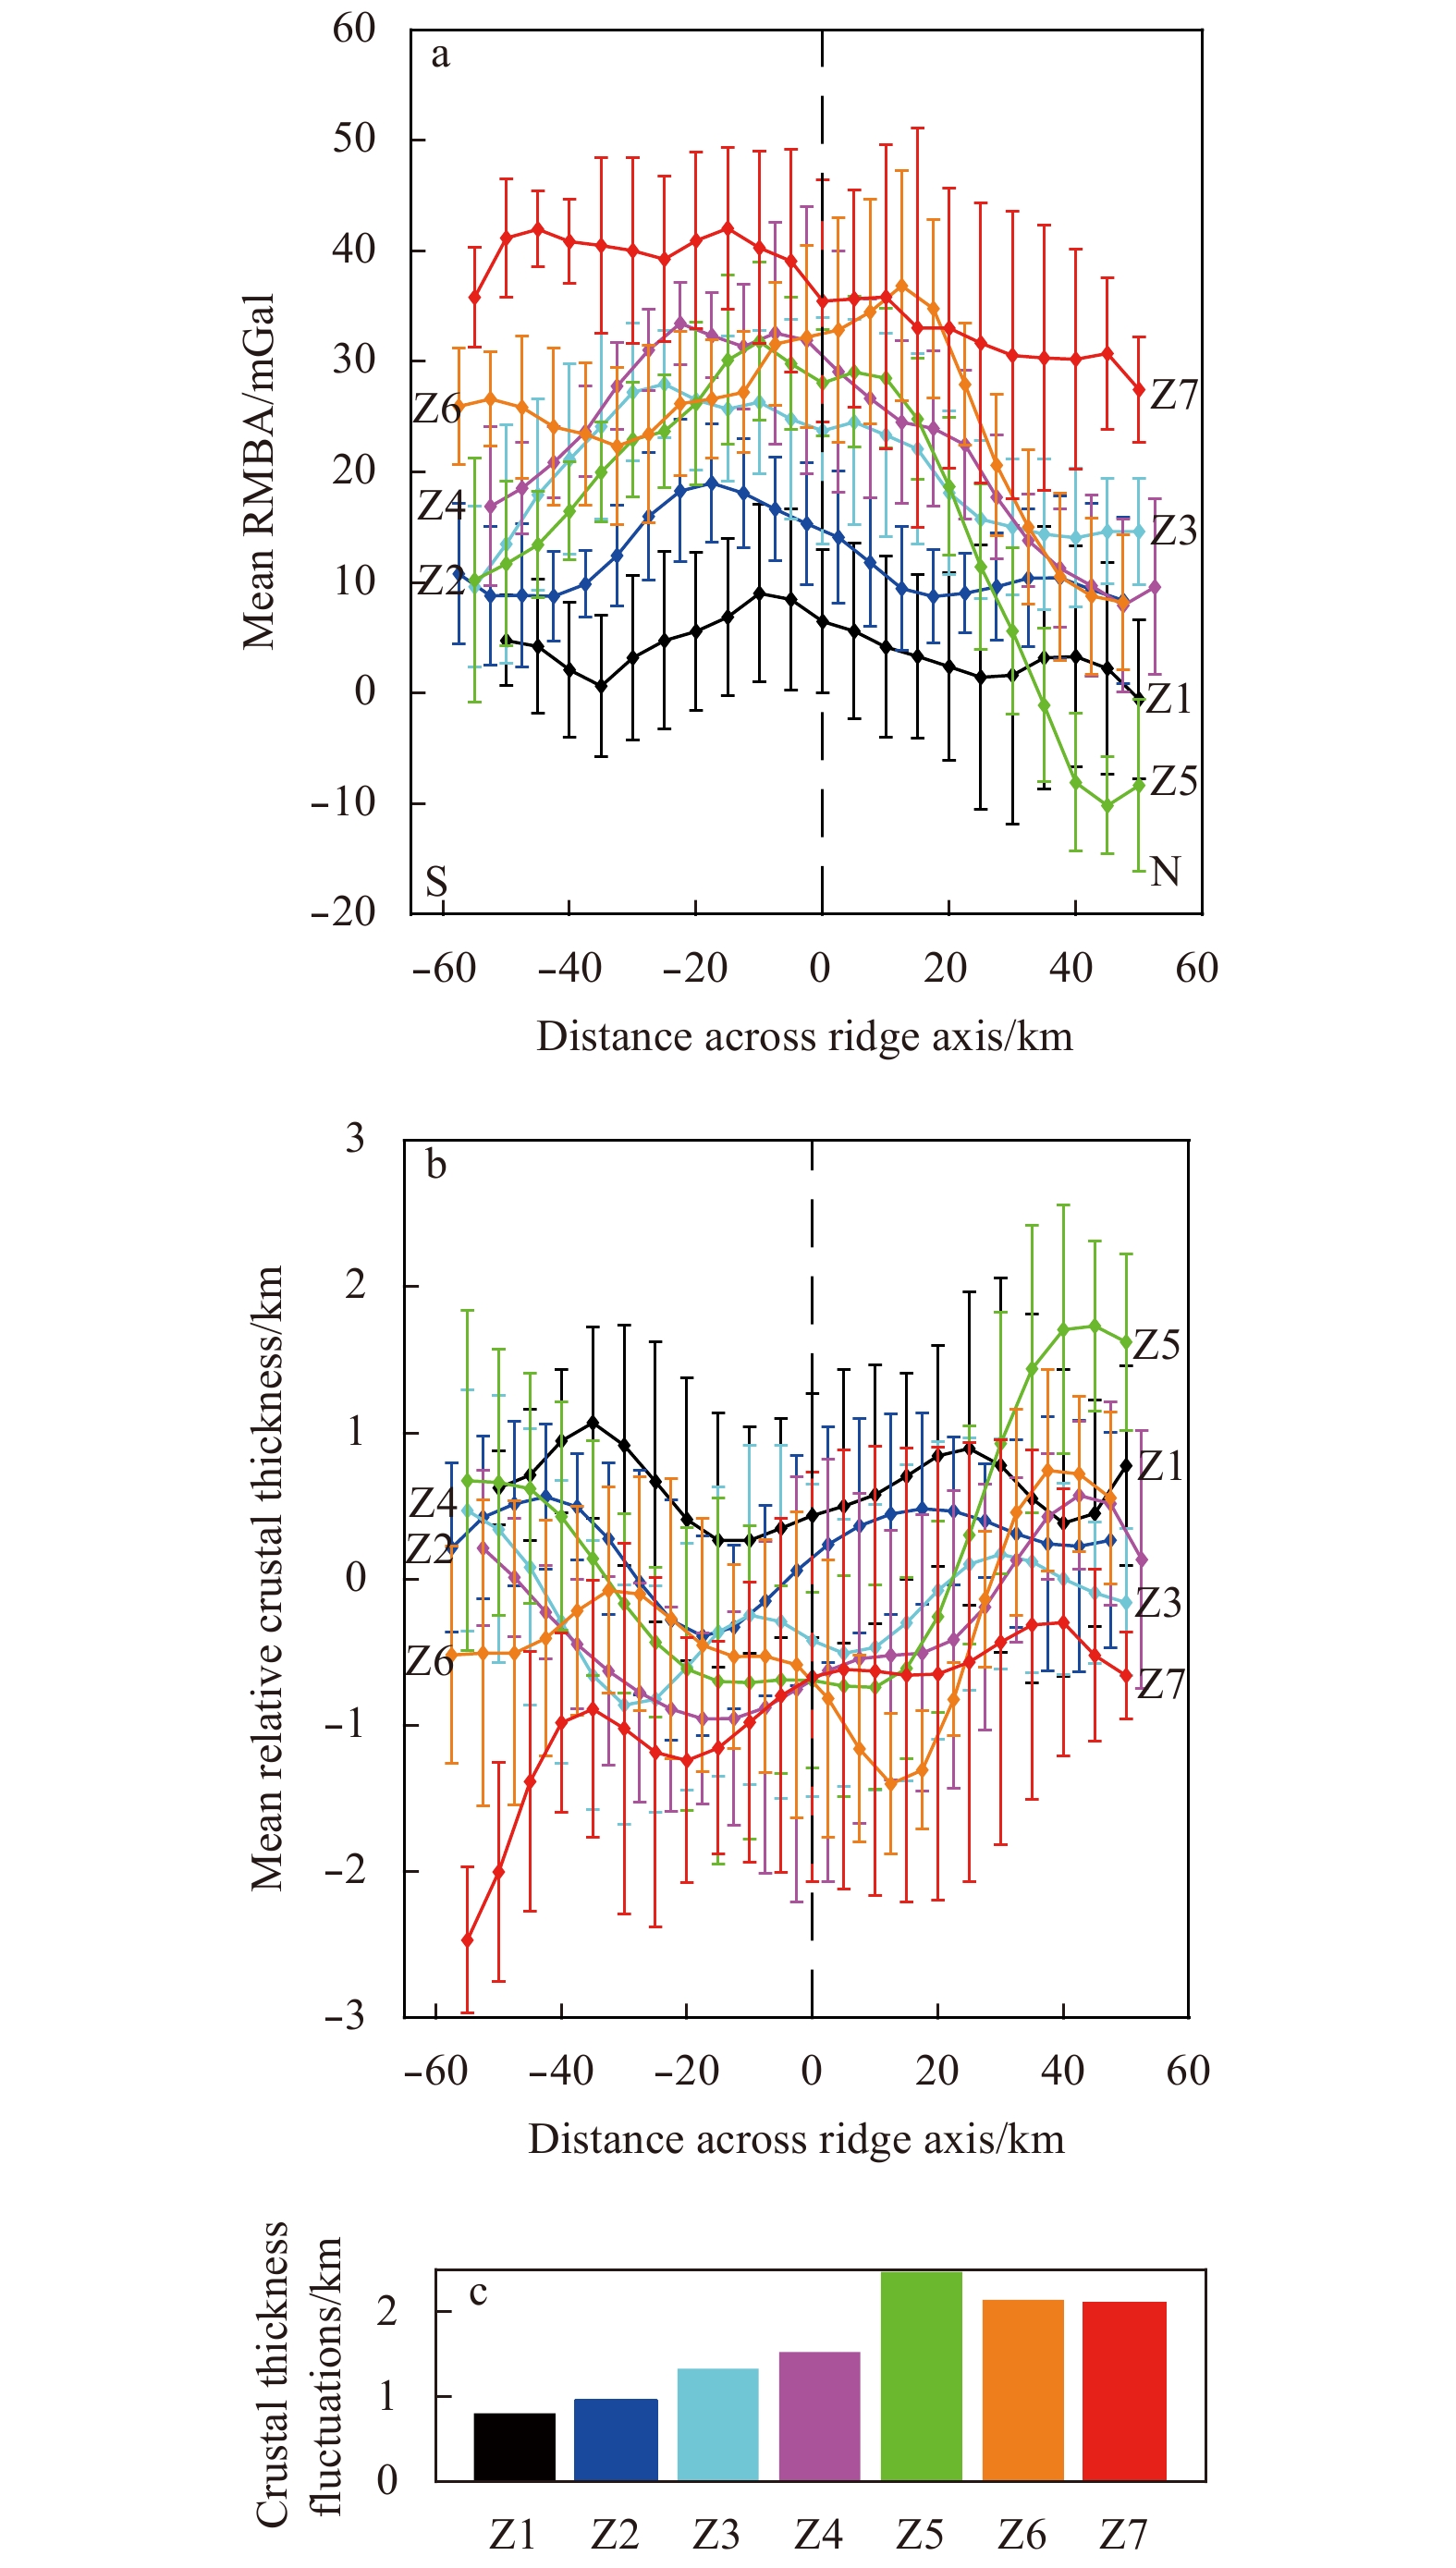
Figure 7. Averaged across-axis variations of RMBA (a) and relative crustal thickness (b) for each zone, and fluctuations of averaged across-axis crustal thickness variations for each zone (c). The dashed black lines in panels a and b indicate the ridge axis position. S: south; N: north.
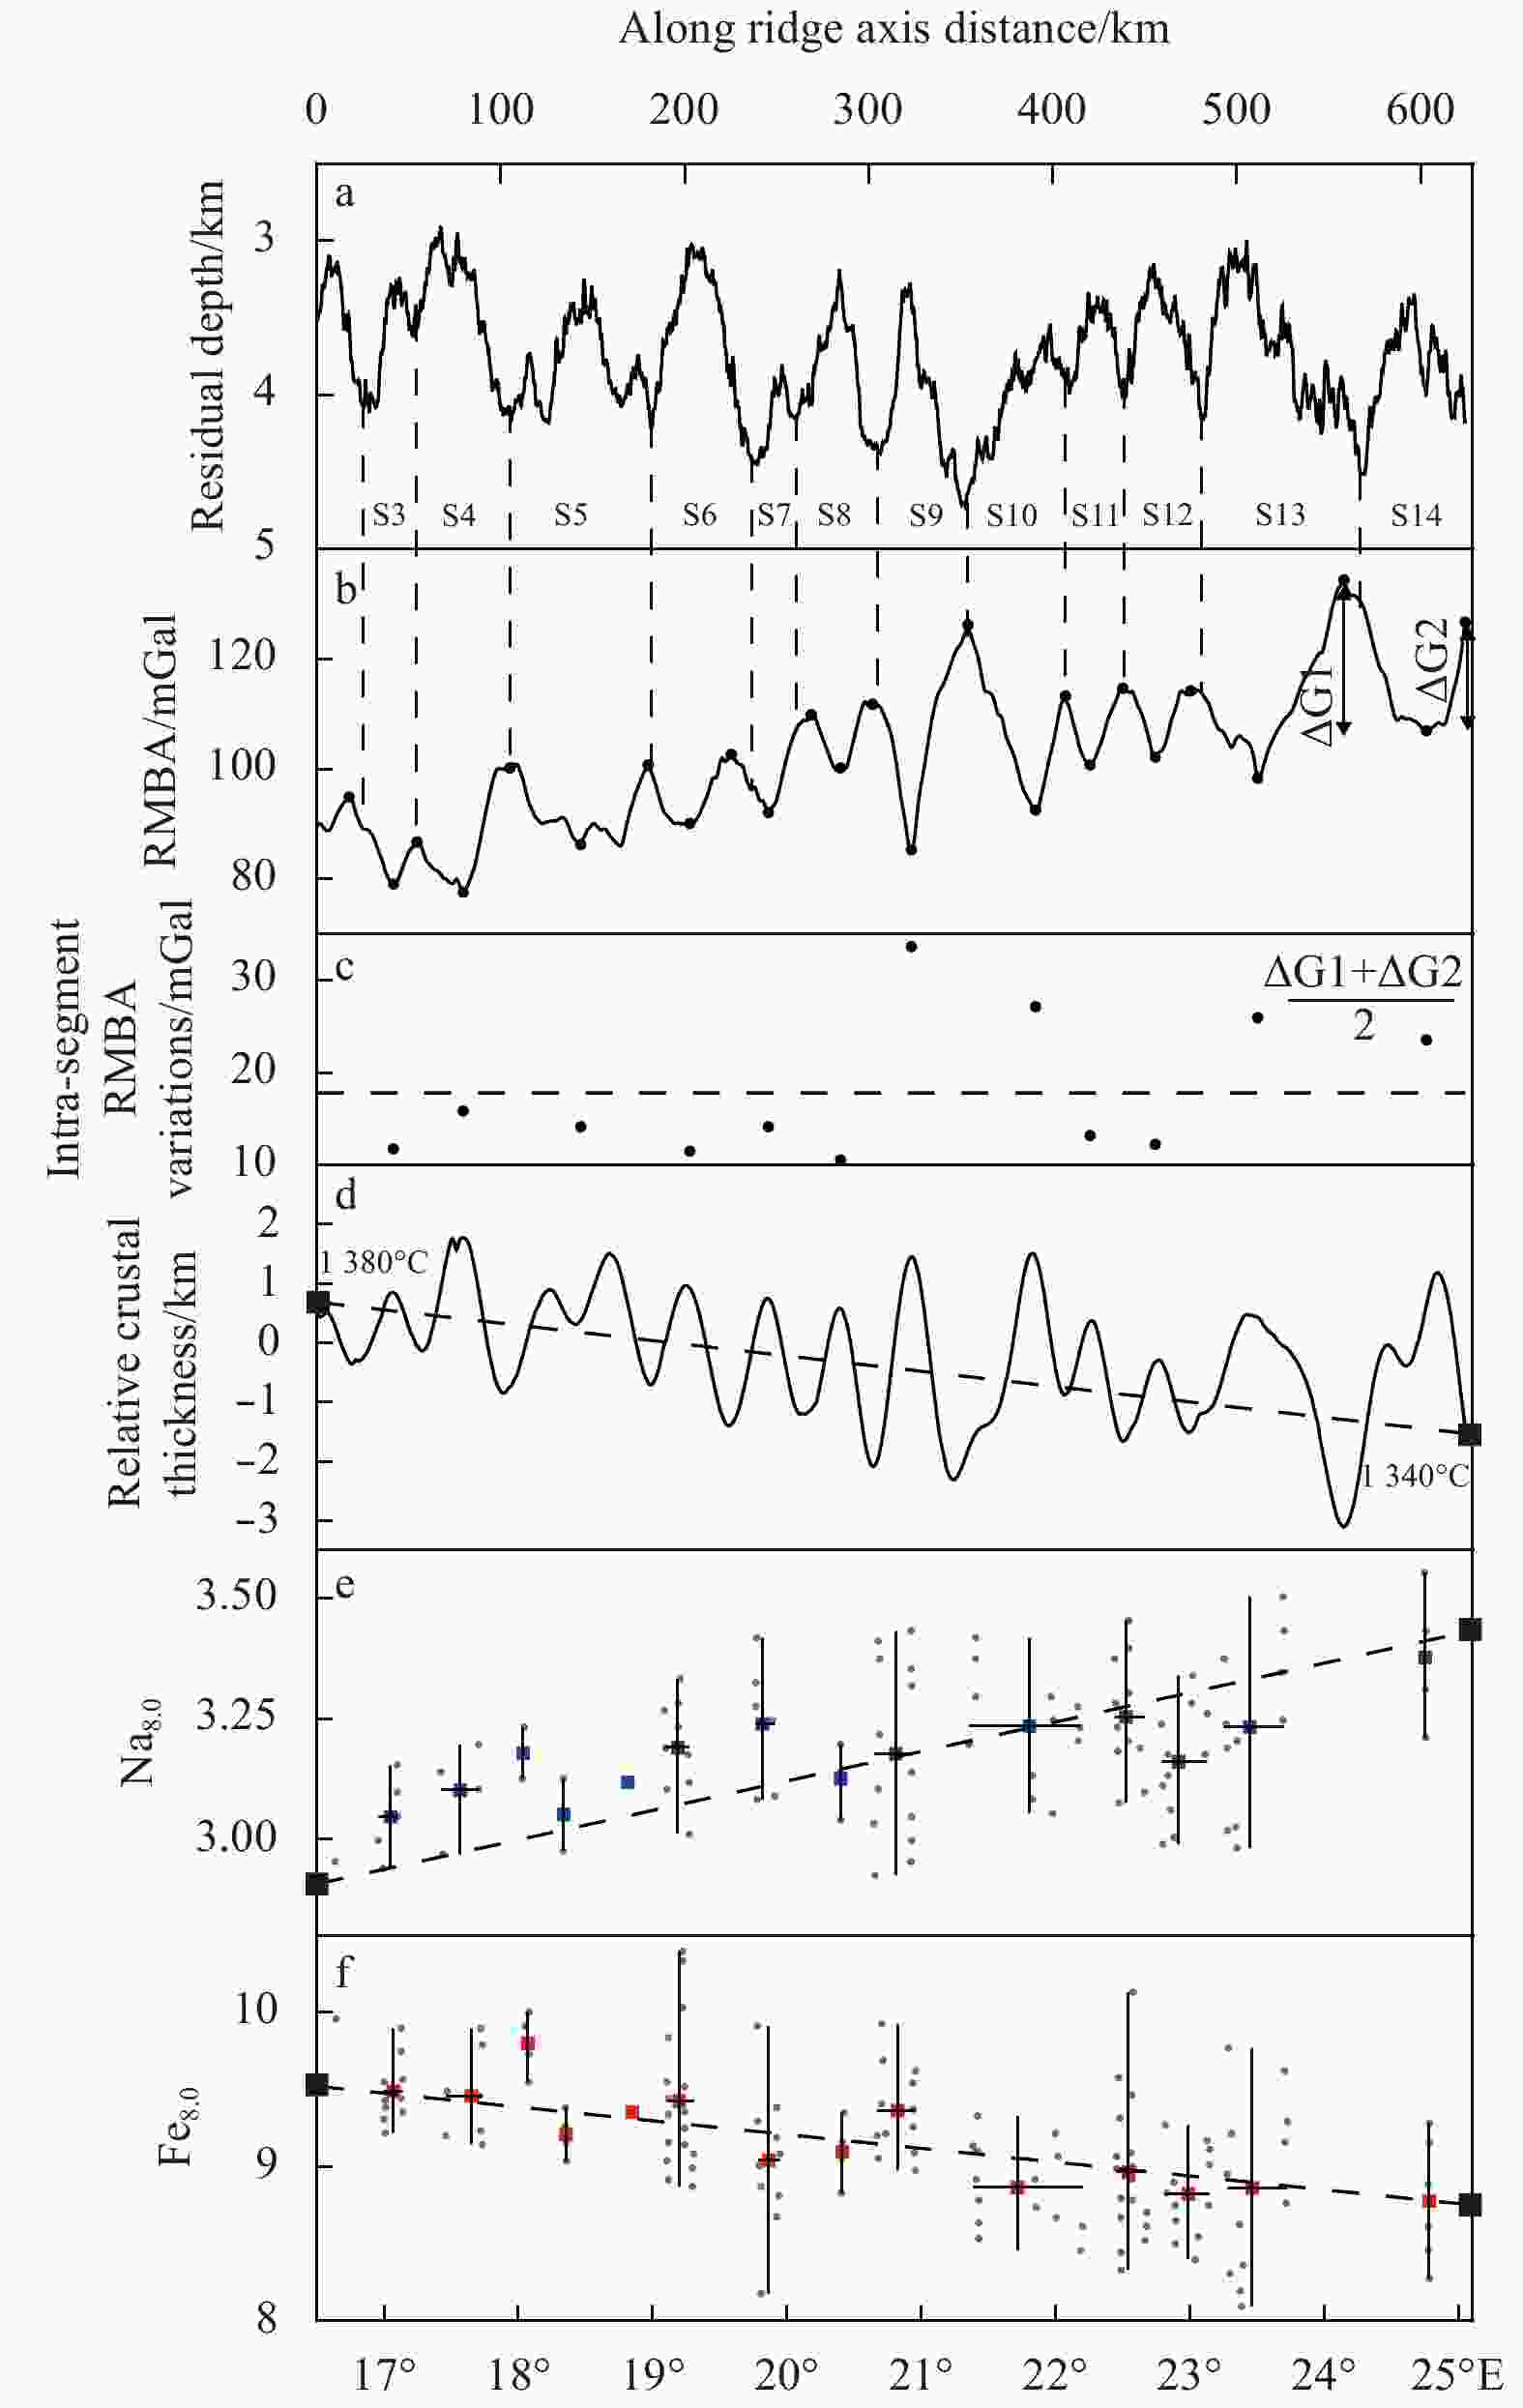
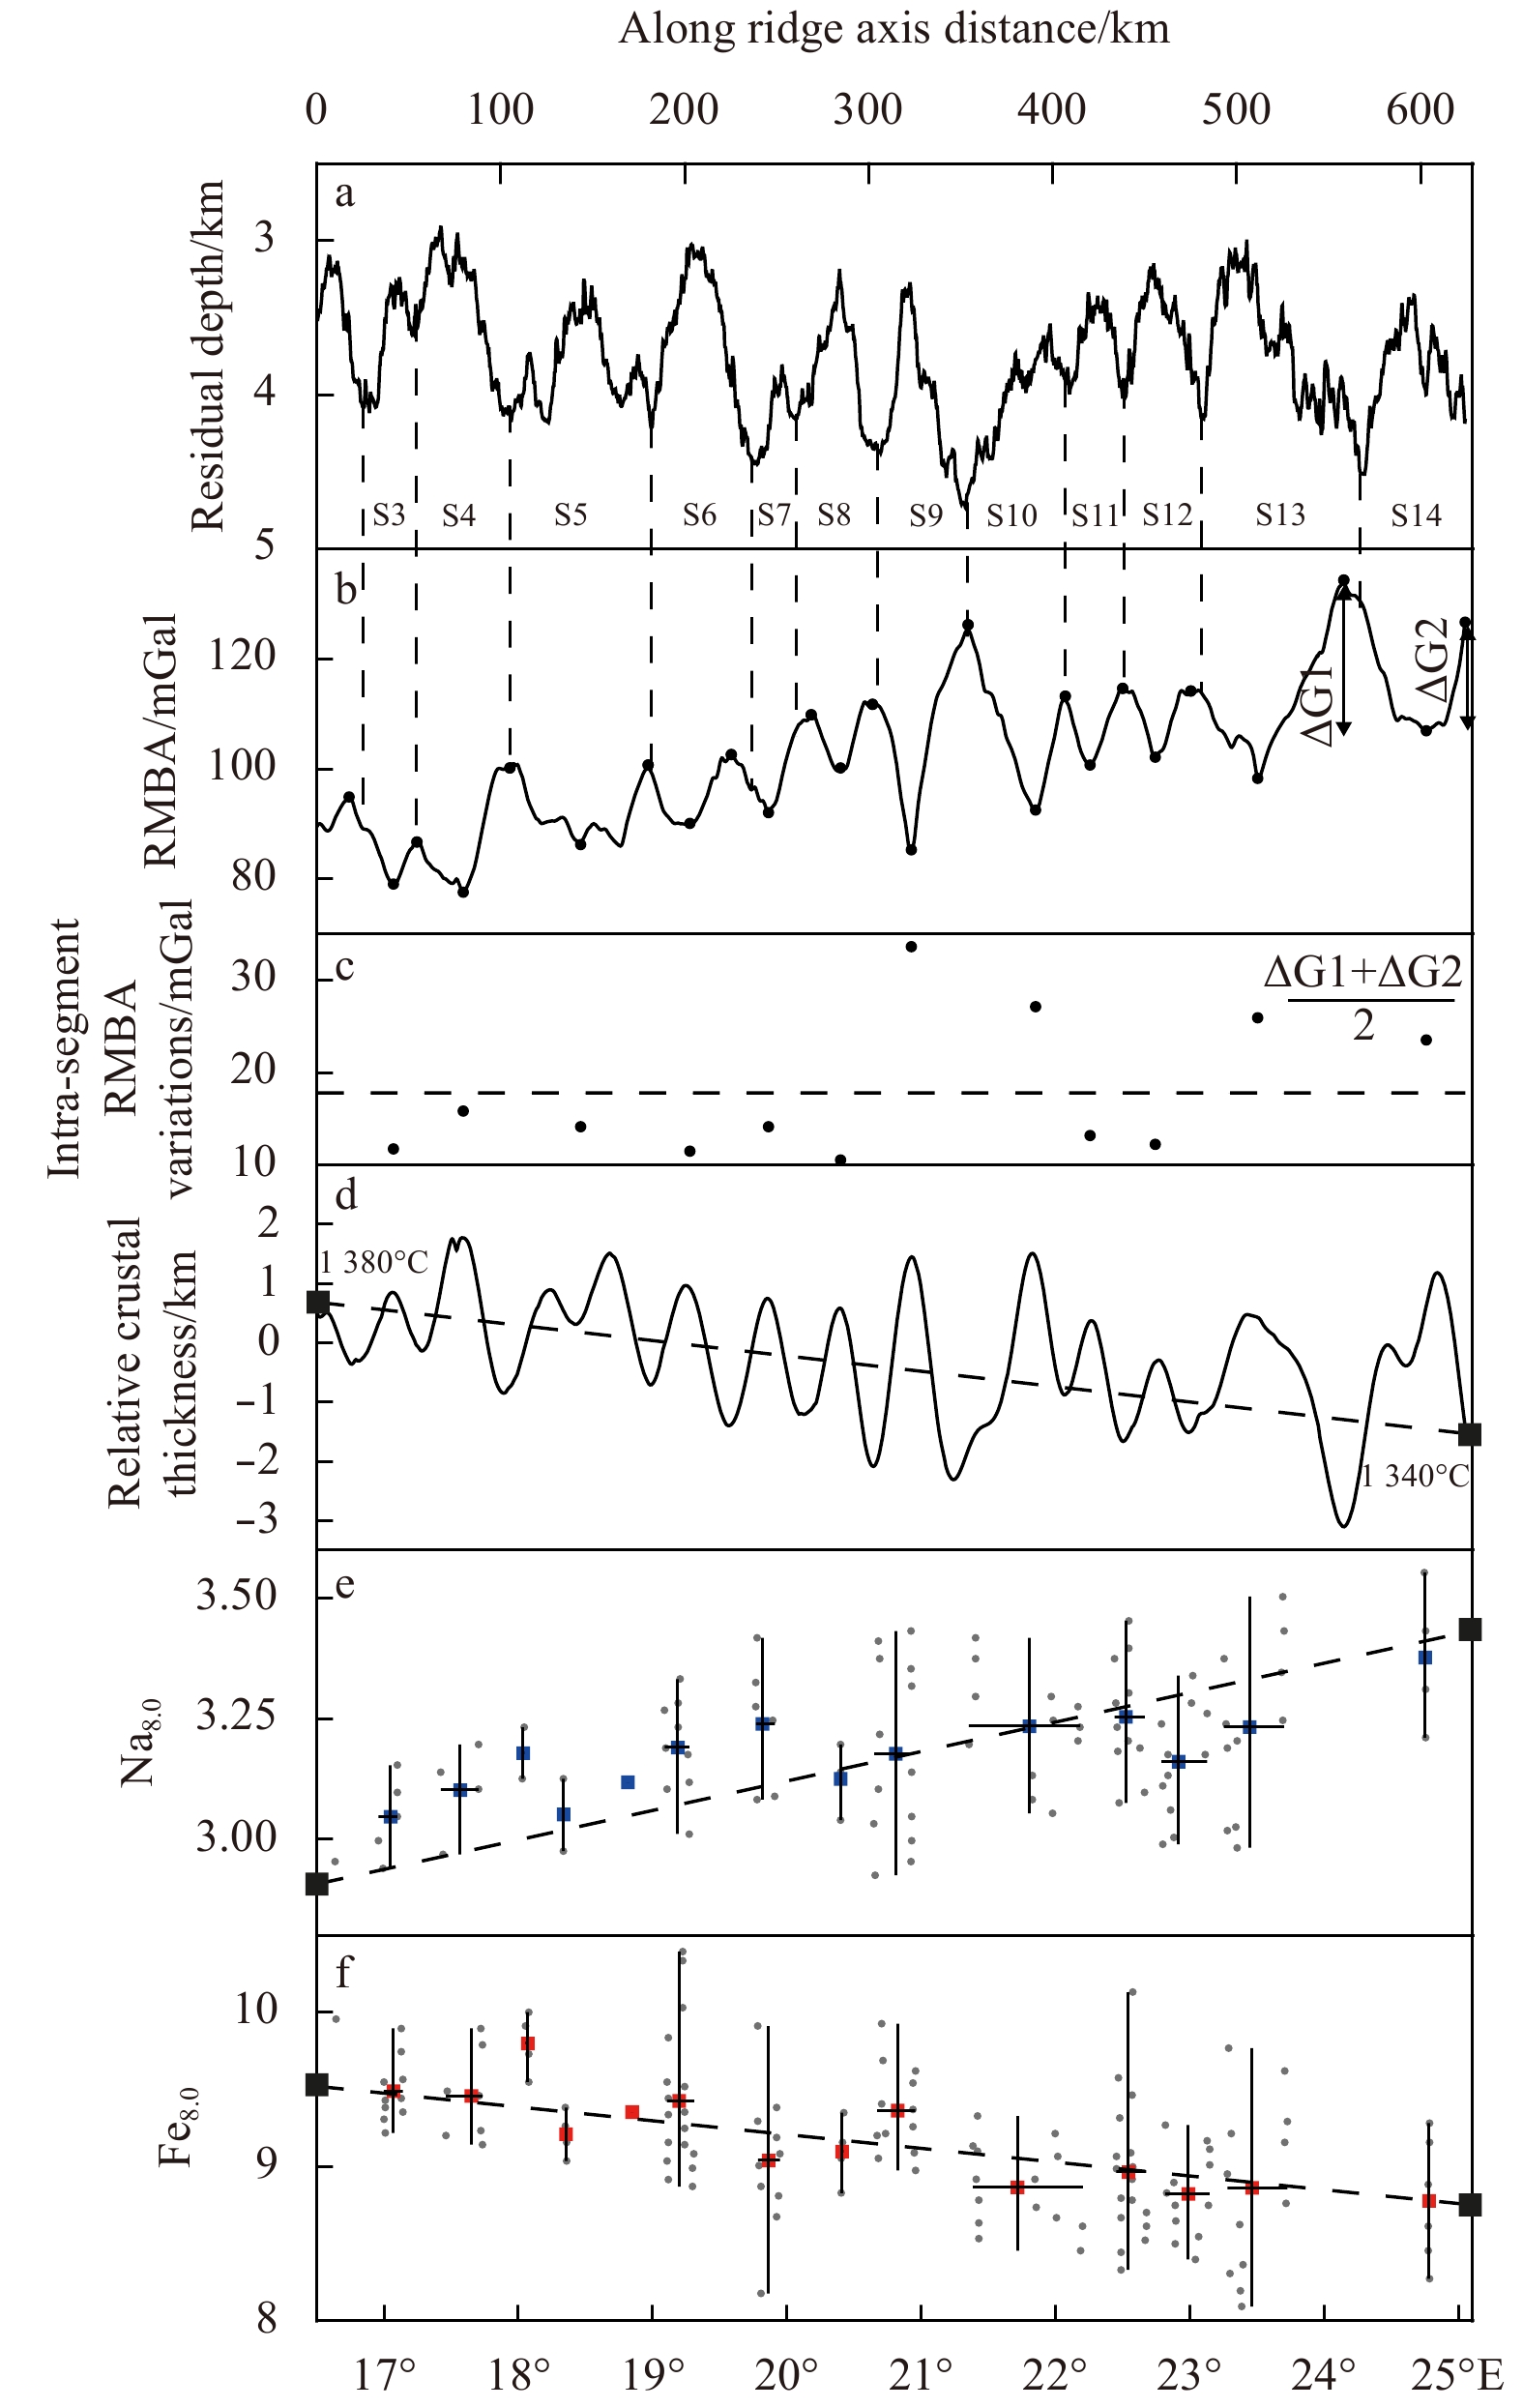
Figure 8. Along-axis variations of residual topography (a), RMBA (b), average intra-segment RMBA variations (c), relative crustal thickness (d) Na8.0 (e), and Fe8.0 (f). The original data of Na8.0 and Fe8.0 (gray dots) are from Standish et al. (2008). In a, S3–S14 mark the segment numbers. Vertically dashed lines indicate the segment ends. Vertical arrows in b indicate the intra-segment RMBA variations (ΔG1, ΔG2). The formula for calculating the averaged intra-segment RMBA variations is given at the upper right of c. Horizontal dashed line in c show the mean variations of intra-segment RMBA variations. Horizontal and vertical thin black lines in e and f show the along-axis extent and the limits of each bin in averaging the Na8.0 and Fe8.0 values, and blue and red squares show the average intra-segment Na8.0 and Fe8.0 variations. Black dashed lines in d, e and f are the predicted changes from the melting models with mantle potential temperature of 1 340 °C at the eastern end and 1 380 °C at the western end as labeled in d.
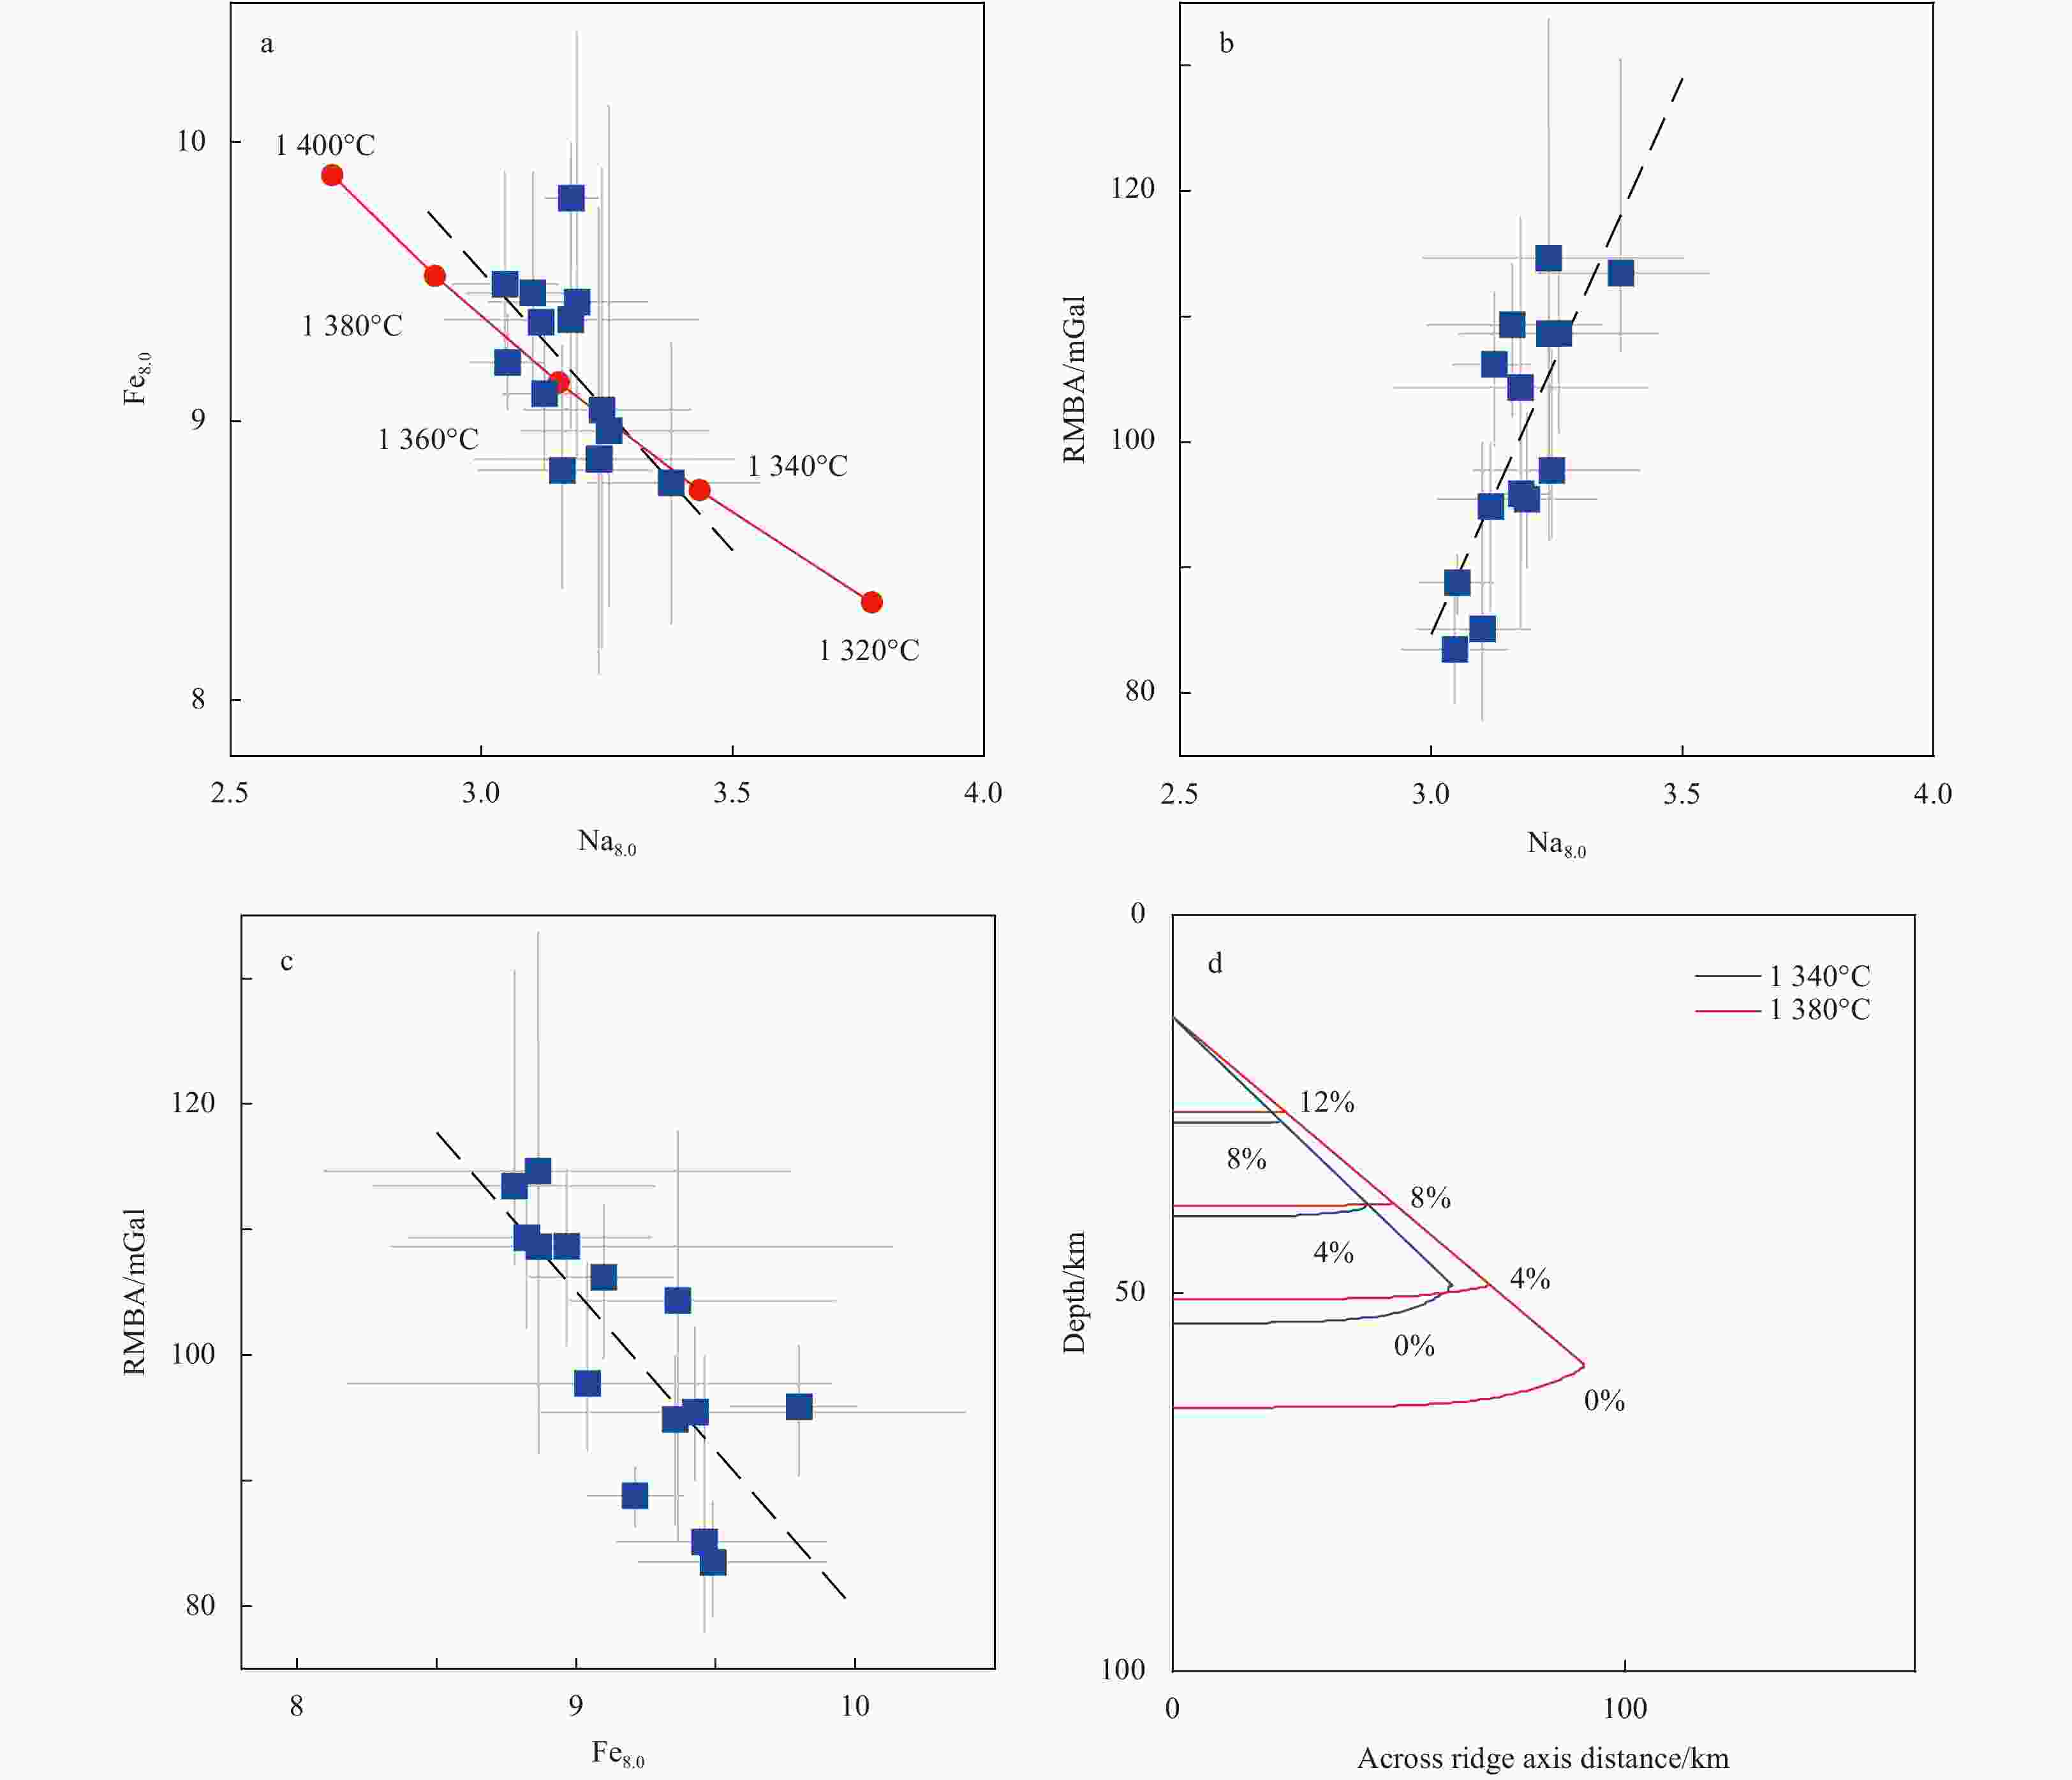
Figure 9. Correlations between the averaged values of the along-axis Na8.0 and Fe8.0 (a), Na8.0 and RMBA (b), and Fe8.0 and RMBA (c); and calculated partial melting zones for mantle potential temperatures of 1 340°C (blue) and 1380°C (red) (d). Blue squares and gray crosses in a, b and c show the averaged values and limits of intra-segment variations of each parameters, respectively. Dashed black lines show the best linear fitting. Red dots in a are the calculated values of Na8.0 and Fe8.0 for different mantle potential temperatures. Labels marked as percentages in d indicate the degree of melting.
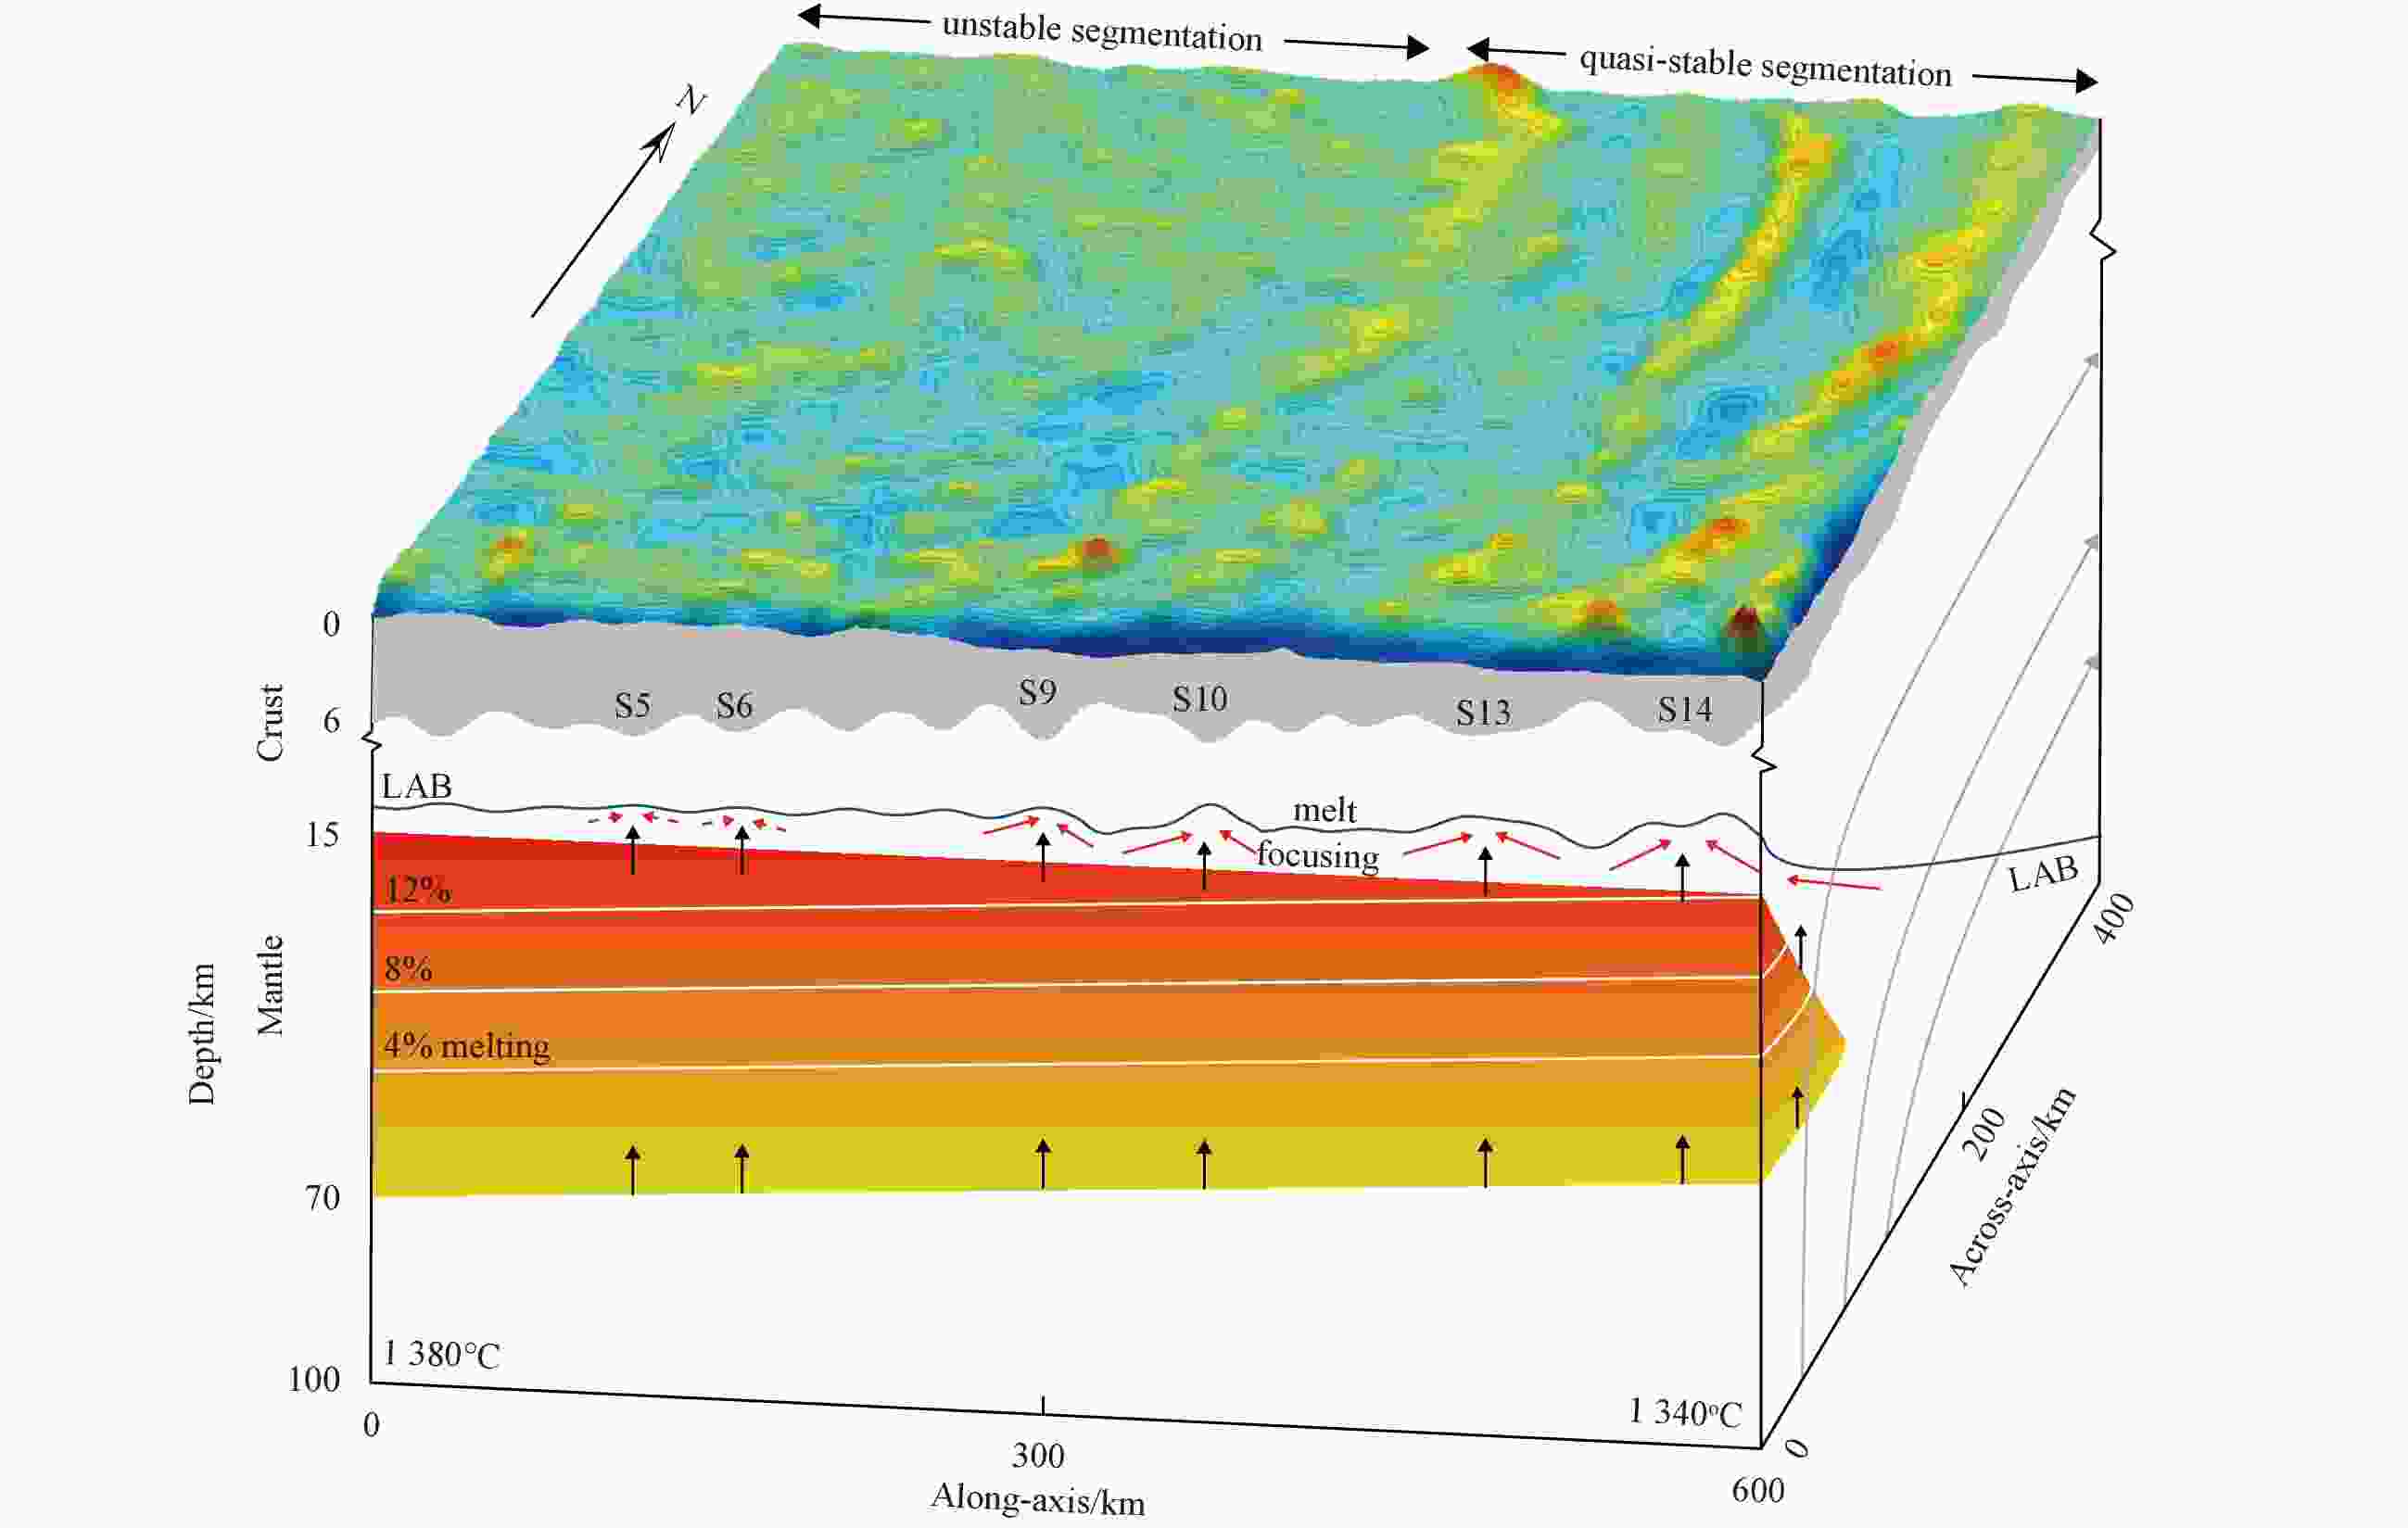
Figure 10. A synthesized model showing key features of the investigated orthogonal supersegment. Top view: Residual FAA as in Fig. 1. Sections of relatively stable (eastern) and unstable (western) segmentation are shown. Front view: Along-ridge variation in crustal thickness (grey), the calculated mantle melting zone (color), and the calculated degree of partial melting (white lines). Also shown are hypothesized lithosphere-asthenosphere boundary (LAB, blue curve). Along-axis melt focusing is interpreted to be stronger at segments S9, S10, S13, and S14 (red solid arrows) than other segments (e.g., segments S5 and S6, red dashed arrows). The western region was hypothesized to have higher mantle temperature and smaller ridge-axis offset, leading to smoother LAB, less sustained magma focusing, and less stable segmentation. In contrast, the relatively large ridge-axis offsets of the eastern section may have resulted in more sustained along-axis focusing of magma supply at individual ridge segments, enabling relatively stable segmentation.
Table 1. Parameters used in modeling 3D mantle temperature field
Parameter Description Value ρm/(kg·m–3) mantle density 3 300 Cp/(J·kg–1·K–1) specific heat capacity 1 250 κ/(W·m–1·K–1) thermal conductivity 3 Q/(J·mol–1) activation energy 2.5×10⁵ R/(J·mol–1·K–1) universal gas constant 8.311 4 Ts/°C surface temperature 0 Tp/°C mantle potential temperature 1 350 Un/(mm·a–1) half–spreading rate in northern flank 6.0 Us/(mm·a–1) half–spreading rate in southern flank 7.4 g/(m·s–2) gravitational acceleration 9.8  下载: 导出CSV
Table 2. Parameters used in modeling 2D mantle melting field
Parameter Description Value ρ/(kg·m–3) mantle density 3 300 η0/(Pa·s) reference viscosity 1019 ηmax/(Pa·s) maximum viscosity 1023 Cp/(J·kg–1·K–1) specific heat capacity 1 250 k/(W·m–1·K–1) thermal conductivity 3 Q/(J·mol–1) activation energy 2.5×10⁵ R/(J·mol–1·K–1) universal gas constant 8.311 4 Ts/°C temperature at the surface of the
thermal model0 Tp/°C mantle potential temperature 1 320–1 400 U/(mm·a–1) half spreading rate 6.7 g/(m·s–2) gravitational acceleration 9.8
下载: 导出CSV
-
[1] Behn M D, Grove T L. 2015. Melting systematics in mid-ocean ridge basalts: application of a plagioclase-spinel melting model to global variations in major element chemistry and crustal thickness. Journal of Geophysical Research: Solid Earth, 120(7): 4863–4886. doi: 10.1002/2015JB011885 [2] Bernard A, Munschy M, Rotstein Y, et al. 2005. Refined spreading history at the Southwest Indian Ridge for the last 96 Ma, with the aid of satellite gravity data. Geophysical Journal International, 162(3): 765–778. doi: 10.1111/j.1365-246X.2005.02672.x [3] Canales J P, Detrick R S, Lin Jian, et al. 2000. Crustal and upper mantle seismic structure beneath the rift mountains and across a nontransform offset at the Mid-Atlantic Ridge (35°N). Journal of Geophysical Research: Solid Earth, 105(B2): 2699–2719. doi: 10.1029/1999JB900379 [4] Cannat M, Rommevaux-Jestin C, Fujimoto H. 2003. Melt supply variations to a magma-poor ultra-slow spreading ridge (Southwest Indian Ridge 61° to 69°E). Geochemistry, Geophysics, Geosystems, 4(8): 9104. doi: 10.1029/2002GC000480 [5] Carbotte S M, Smith D K, Cannat M, et al. 2015. Tectonic and magmatic segmentation of the Global Ocean Ridge System: a synthesis of observations. Geological Society of London, 420(1): 249–295. doi: 10.1144/SP420.5 [6] Dalton C A, Langmuir C H, Gale A. 2014. Geophysical and geochemical evidence for deep temperature variations beneath mid-ocean ridges. Science, 344(6179): 80–83. doi: 10.1126/science.1249466 [7] Dannowski A, Phipps Morgan J, Grevemeyer I, et al. 2018. Enhanced mantle upwelling/melting caused segment propagation, oceanic core complex die off, and the death of a transform fault: the Mid-Atlantic Ridge at 21.5°N. Journal of Geophysical Research: Solid Earth, 123(2): 941–956. doi: 10.1002/2017JB014273 [8] DeMets C, Merkouriev S, Sauter D. 2015. High-resolution estimates of Southwest Indian Ridge plate motions, 20 Ma to present. Geophysical Journal International, 203(3): 1495–1527. doi: 10.1093/gji/ggv366 [9] Dick H J B, Lin Jian, Schouten H. 2003. An ultraslow-spreading class of ocean ridge. Nature, 426(6965): 405–412. doi: 10.1038/nature02128 [10] Escartín J, Cowie P A, Searle R C, et al. 1999. Quantifying tectonic strain and magmatic accretion at a slow spreading ridge segment, Mid-Atlantic Ridge, 29°N. Journal of Geophysical Research: Solid Earth, 104(B5): 10421–10437. doi: 10.1029/1998JB900097 [11] Forsyth D W. 1993. Crustal thickness and the average depth and degree of melting in fractional melting models of passive flow beneath mid-ocean ridges. Journal of Geophysical Research: Solid Earth, 98(B9): 16073–16079. doi: 10.1029/93JB01722 [12] Fox P J, Gallo D G. 1984. A tectonic model for ridge-transform-ridge plate boundaries: implications for the structure of oceanic lithosphere. Tectonophysics, 104(3–4): 205–242 [13] Gente P, Pockalny R A, Durand C, et al. 1995. Characteristics and evolution of the segmentation of the Mid-Atlantic Ridge between 20°N and 24°N during the last 10 million years. Earth and Planetary Science Letters, 129(1–4): 55–71 [14] Georgen J E, Lin Jian, Dick H J B. 2001. Evidence from gravity anomalies for interactions of the Marion and Bouvet hotspots with the Southwest Indian Ridge: effects of transform offsets. Earth and Planetary Science Letters, 187(3–4): 283–300 [15] Gregg P M, Behn M D, Lin Jian, et al. 2009. Melt generation, crystallization, and extraction beneath segmented oceanic transform faults. Journal of Geophysical Research: Solid Earth, 114(B11): B11102 [16] Grindlay N R, Madsen J A, Rommevaux-Jestin C, et al. 1998. A different pattern of ridge segmentation and mantle Bouguer gravity anomalies along the ultra-slow spreading Southwest Indian Ridge (15°30'E to 25°E). Earth and Planetary Science Letters, 161(1–4): 243–253 [17] Hooft E E E, Detrick R S, Toomey D R, et al. 2000. Crustal thickness and structure along three contrasting spreading segments of the Mid-Atlantic Ridge, 33.5°–35°N. Journal of Geophysical Research: Solid Earth, 105(B4): 8205–8226. doi: 10.1029/1999JB900442 [18] Hosford A, Lin Jian, Detrick R S. 2001. Crustal evolution over the last 2 m.y. at the Mid-Atlantic Ridge OH-1 segment, 35°N. Journal of Geophysical Research, 106(B7): 13269–13285. doi: 10.1029/2001JB000235 [19] Kuo B Y, Forsyth D W. 1988. Gravity anomalies of the ridge-transform system in the South Atlantic between 31° and 34.5°S: upwelling centers and variations in crustal thickness. Marine Geophysical Researches, 10(3–4): 205–232 [20] Lin Jian, Phipps Morgan J. 1992. The spreading rate dependence of three-dimensional mid-ocean ridge gravity structure. Geophysical Research Letters, 19(1): 13–16. doi: 10.1029/91GL03041 [21] Lin Jian, Purdy G, Schouten H, et al. 1990. Evidence from gravity data for focusedmagmatic accretionalong the Mid-Atlantic Ridge. Nature, 344(6267): 627–632. doi: 10.1038/344627a0 [22] Macdonald K C, Scheirer D S, Carbotte S M. 1991. Mid-ocean ridges: discontinuities, segments and giant cracks. Science, 253(5023): 986–994. doi: 10.1126/science.253.5023.986 [23] Magde L S, Sparks D W. 1997. Three-dimensional mantle upwelling, melt generation, and melt migration beneath segment slow spreading ridges. Journal of Geophysical Research: Solid Earth, 1997(B9): 20571–20583 [24] Müller R D, Sdrolias M, Gaina C, et al. 2008. Age, spreading rates, and spreading asymmetry of the world’s ocean crust. Geochemistry, Geophysics, Geosystems, 9(4): Q04006. doi: 10.1029/2007GC001743 [25] Pariso J E, Sempéré J C, Rommevaux C. 1995. Temporal and spatial variations in crustal accretion along the Mid-Atlantic Ridge (29°–31°30′N) over the last 10 m.y.: implications from a three-dimensional gravity study. Journal of Geophysical Research: Solid Earth, 100(B9): 17781–17794. doi: 10.1029/95JB01146 [26] Parker R L. 1973. The rapid calculation of potential anomalies. Geophysical Journal International, 31(4): 447–455. doi: 10.1111/j.1365-246X.1973.tb06513.x [27] Patriat P, Sauter D, Munschy M, et al. 1997. A survey of the Southwest Indian Ridge axis between Atlantis II fracture zone and the Indian Ocean triple junction: regional setting and large scale segmentation. Marine Geophysical Researches, 19(6): 457–480. doi: 10.1023/A:1004312623534 [28] Phipps Morgan J, Forsyth D W. 1988. Three-dimensional flow and temperature perturbations due to a transform offset: effects on oceanic crustal and upper mantle structure. Journal of Geophysical Research: Solid Earth, 93(B4): 2955–2966. doi: 10.1029/JB093iB04p02955 [29] Sandwell D T, Müller R D, Smith W H F, et al. 2014. New global marine gravity model from CryoSat-2 and Jason-1 reveals buried tectonic structure. Science, 346(6205): 65–67. doi: 10.1126/science.1258213 [30] Sauter D, Patriat P, Rommevaux-Jestin C, et al. 2001. The Southwest Indian Ridge between 49°15′E and 57°E: focused accretion and magma redistribution. Earth and Planetary Science Letters, 192(3): 303–317. doi: 10.1016/S0012-821X(01)00455-1 [31] Schouten H, Klitgord K D, Whitehead J A. 1985. Segmentation of mid-ocean ridges. Nature, 317(6034): 225–229. doi: 10.1038/317225a0 [32] Sempéré J C, Lin Jian, Brown H S, et al. 1993. Segmentation and morphotectonic variations along a slow-spreading center: the Mid-Atlantic Ridge (24°00′N–30°40′N). Marine Geophysical Researches, 15(3): 153–200. doi: 10.1007/BF01204232 [33] Sparks D W, Parmentier E M, Phipps Morgan J. 1993. Three-dimensional mantle convection beneath a segmented spreading center: implications for along-axis variations in crustal thickness and gravity. Journal of Geophysical Research: Solid Earth, 98(B12): 21977–21995. doi: 10.1029/93JB02397 [34] Standish J J, Dick H J B, Michael P J, et al. 2008. MORB generation beneath the ultraslow spreading Southwest Indian Ridge (9°–25°E): major element chemistry and the importance of process versus source. Geochemistry, Geophysics, Geosystems, 9(5): Q05004. doi: 10.1029/2008GC001959 [35] Tolstoy M, Harding A J, Orcutt J A. 1993. Crustal thickness on the Mid-Atlantic Ridge: bull’s-eye gravity anomalies and focused accretion. Science, 262(5134): 726–729. doi: 10.1126/science.262.5134.726 [36] Tozer B, Sandwell D T, Smith W H F, et al. 2019. Global bathymetry and topography at 15 arc sec: SRTM15+. Earth and Space Science, 6: 1847–1864. doi: 10.1029/2019EA000658 [37] Tucholke B E, Lin Jian, Kleinrock M C, et al. 1997. Segmentation and crustal structure of the western Mid-Atlantic Ridge flank, 25°25′–27°10′N and 0–29 m.y. Journal of Geophysical Research: Solid Earth, 102(B5): 10203–10223. doi: 10.1029/96JB03896 [38] Wang T T, Tucholke B E, Lin Jian. 2015. Spatial and temporal variations in crustal production at the Mid-Atlantic Ridge, 25°N–27°30′N and 0–27 Ma. Journal of Geophysical Research: Solid Earth, 120(4): 2119–2142. doi: 10.1002/2014JB011501 [39] Wessel P, Smith W H F. 1998. New, improved version of generic mapping tools released. Eos, Transactions American Geophysical Union, 79(47): 579. doi: 10.1029/98EO00426 [40] Yang H J, Kinzler R J, Grove T L, et al. 1996. Experiments and models of anhydrous, basaltic olivine-plagioclase-augite saturated melts from 0.001 to 10 kbar. Contributions to Mineralogy and Petrology, 124(1): 1–18. doi: 10.1007/s004100050169 [41] Zhang Fan, Lin Jian, Zhang Xubo, et al. 2018. Asymmetry in oceanic crustal structure of the South China Sea basin and its implications on mantle geodynamics. International Geology Review, 62(7–8): 840–858. doi: 10.1080/00206814.2018.1425922 [42] Zhang Tao, Lin Jin, Gao Jinyao. 2019. Asymmetric crustal structure of the ultraslow-spreading Mohns Ridge. International Geology Review, 62(5): 568–584. doi: 10.1080/00206814.2019.1627586 [43] Zheng Tingting, Tucholke B E, Lin Jian. 2019. Long-term evolution of nontransform discontinuities at the Mid-Atlantic Ridge, 24°N–27°30′N. Journal of Geophysical Research: Solid Earth, 124(10): 10023–10055. doi: 10.1029/2019JB017648 -
 Supplementary information-Zhacaicai.pdf

-


 点击查看大图

计量
- 文章访问数: 1061
- HTML全文浏览量: 370
- PDF下载量: 59
- 被引次数: 0

