

Forward modeling and inversion of the relation model between the gas content of plume and its seismic attribute
-
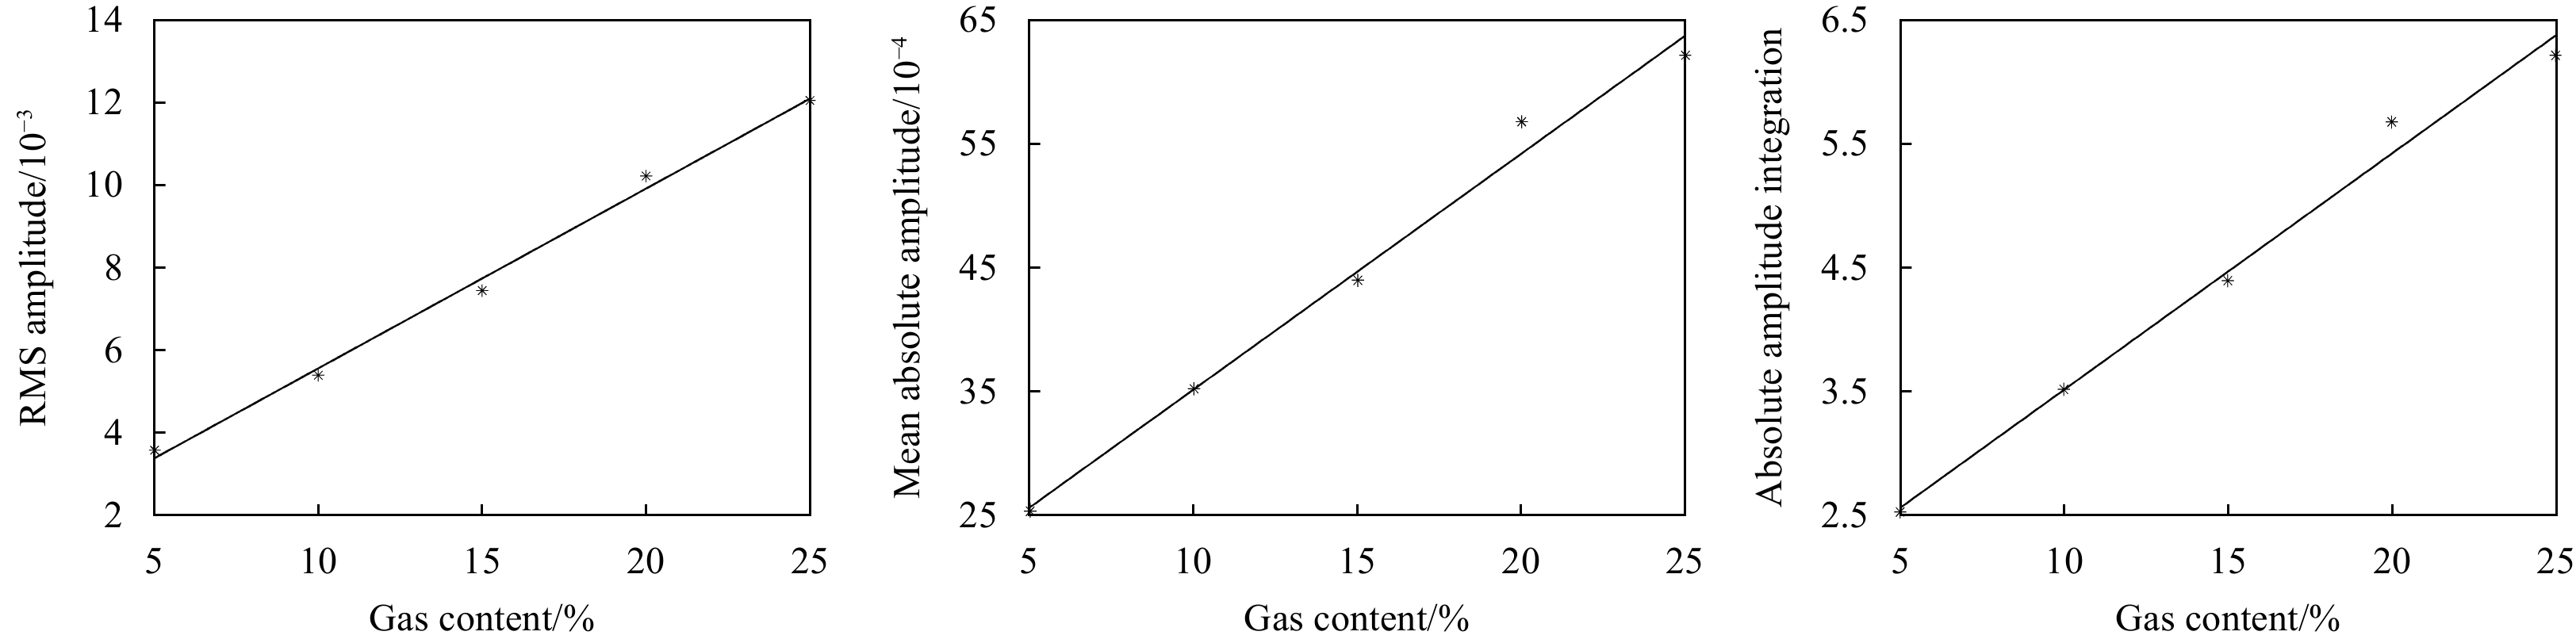
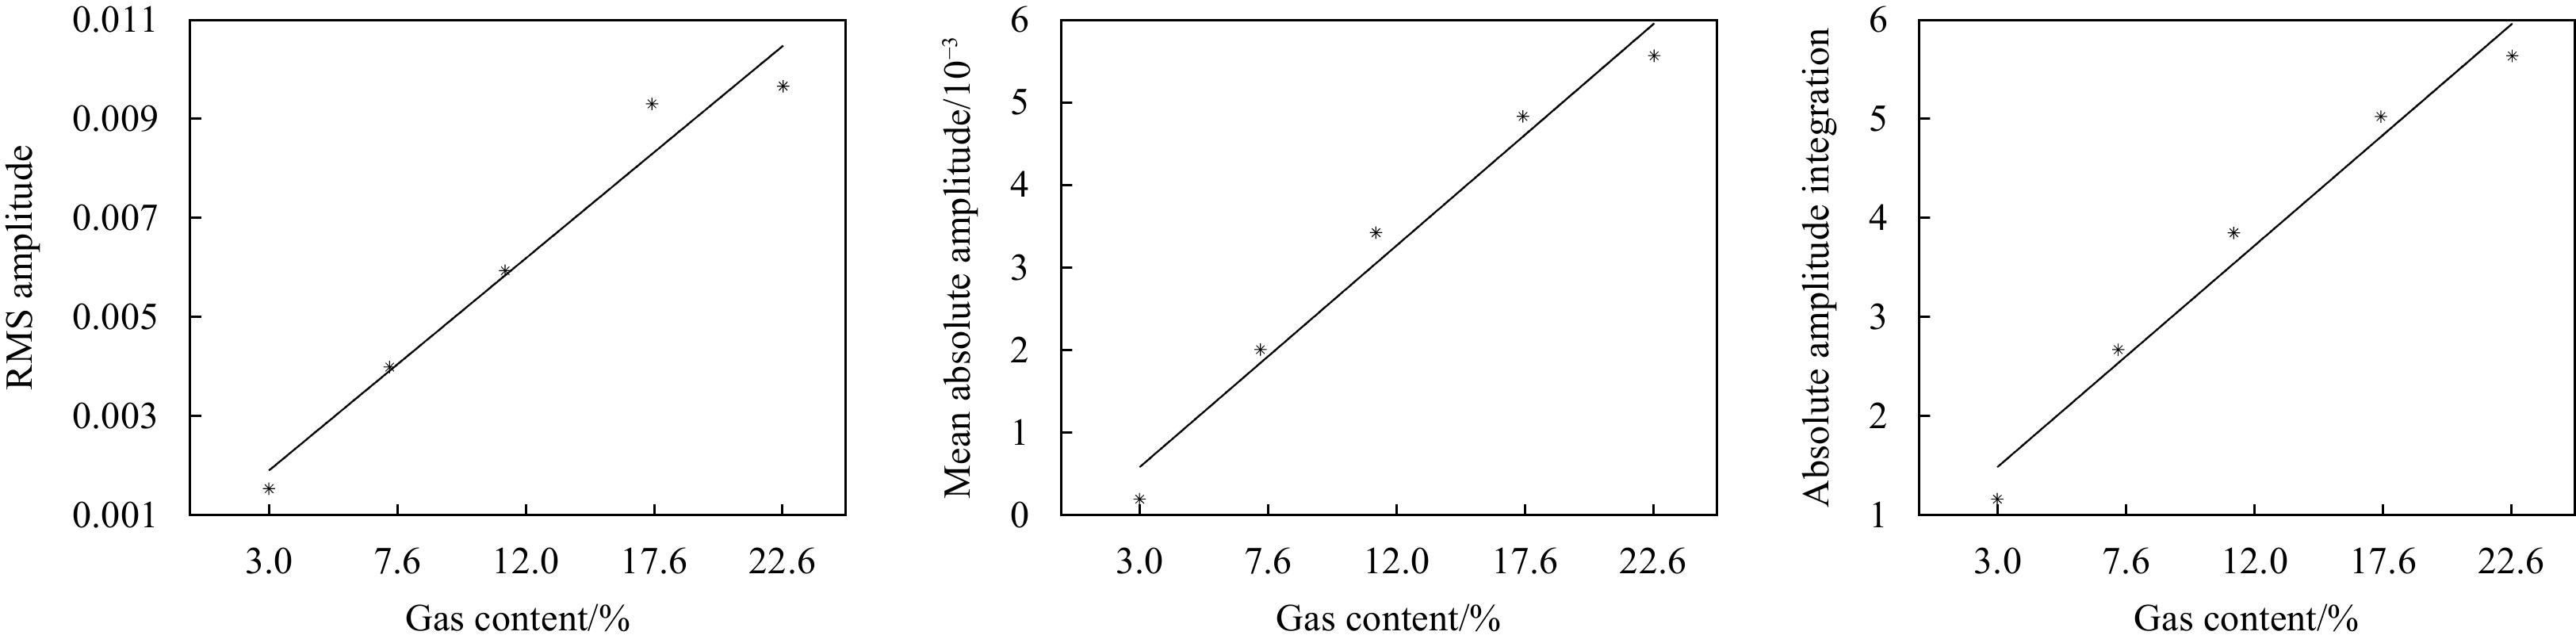
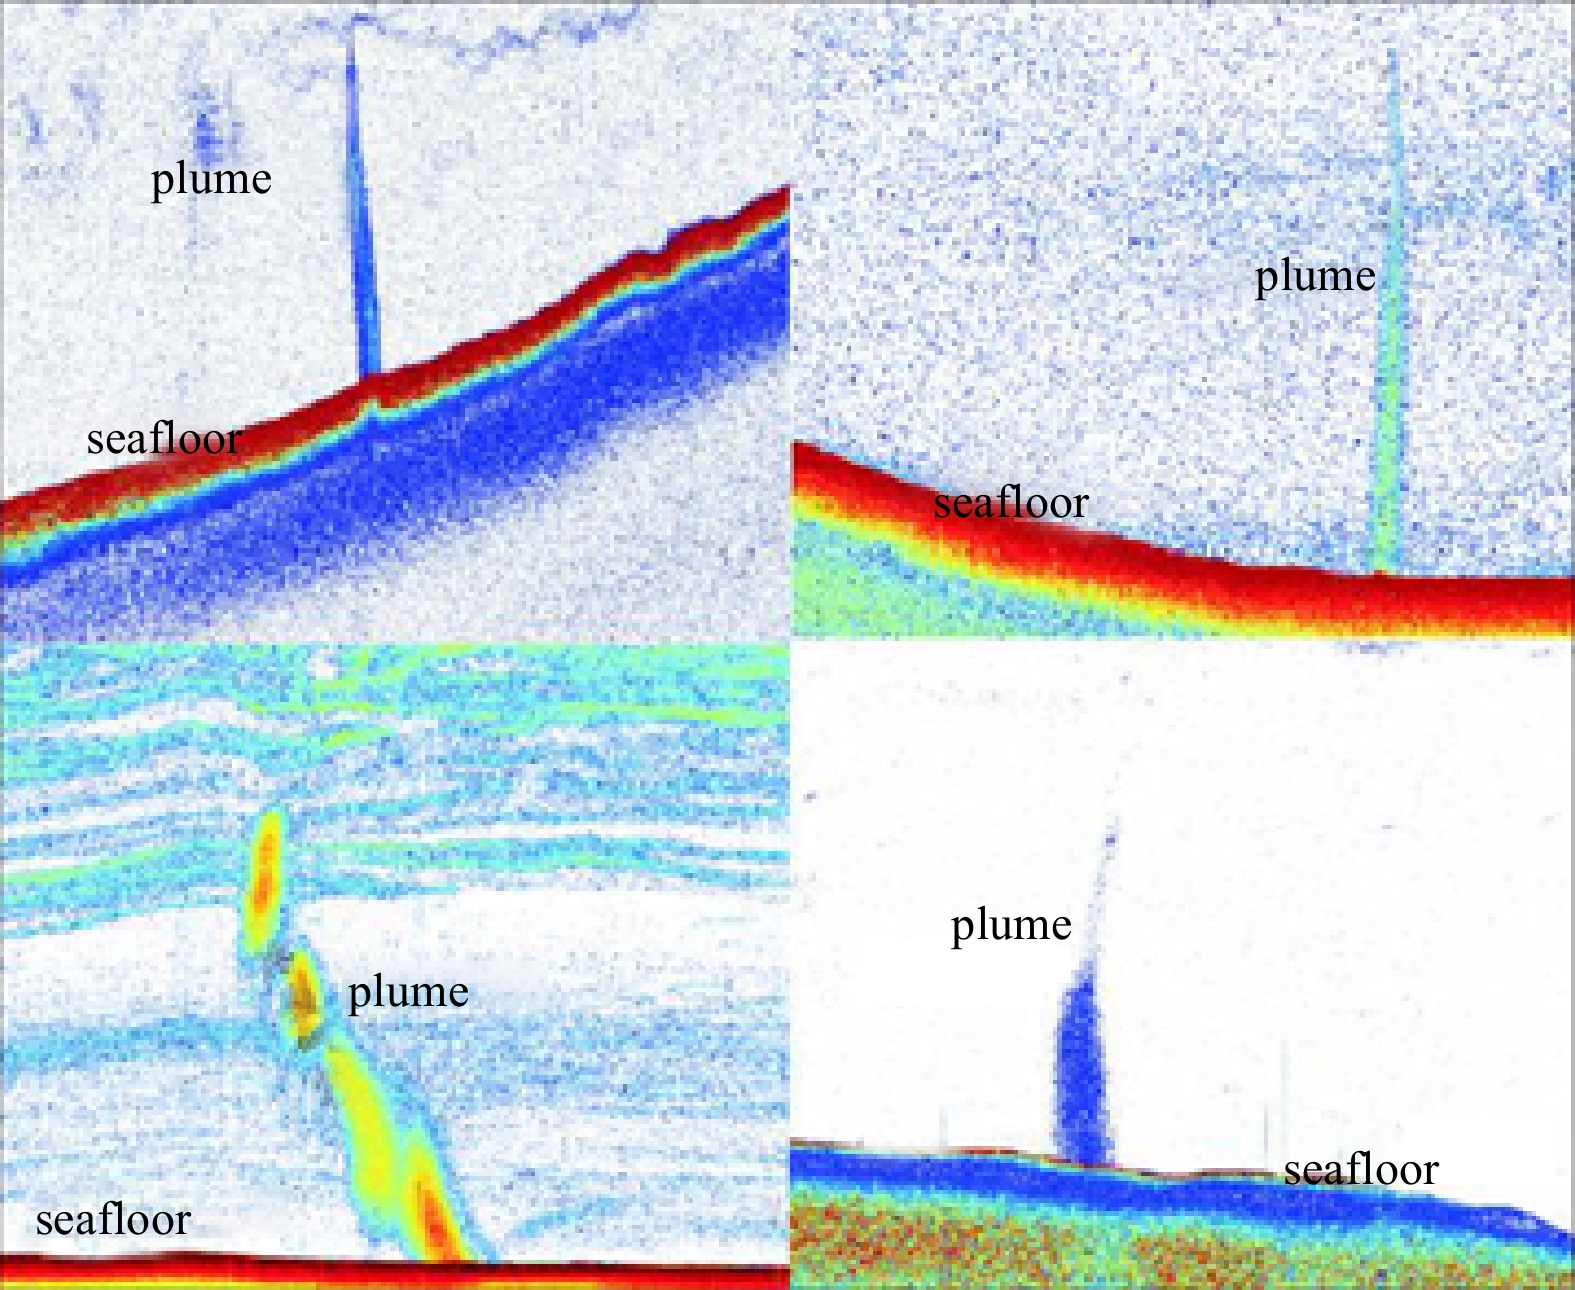
Abstract: The methane bubble plume attracts interest because it offers direct evidence of seafloor gas leakage and plays an indirect role in the exploration and identification of natural gas hydrate. In this study, based on established plume models and their migration sections, three amplitude-class attributes were extracted from three formations for the migration sections of five plumes, and the correlation between the gas content and seismic attribute was obtained. As the gas content increases, the amplitude attribute correspondingly increases, and the linear correlation is relatively good. Moreover, correlation coefficients between gas content and amplitude attributes are close to 1.0. By using linear fitting, the relation model between the gas content of the plume and the seismic attribute was obtained. The relation model was subsequently used to invert the gas content from a real data-bearing plume. Comparison of the gas content section of the plume with the attribute section and real seismic section reveals common distribution characteristics, namely, the color of the section in the lower right corner is dark. If the amplitude value is large in the seismic section of the real plume, the amplitude attribute value is also large in the corresponding attribute section, and the inverted value of the gas content is also large (because gas content and amplitude are linearly correlated), which indicates that the plume bubbles of the section in the lower right corner is intensively distributed. Finally, the obtained gas content section of the plume can reflect the distribution of the plume bubble content more simply and intuitively, from which the distribution law of seafloor bubbles can be deduced, and this lays a foundation for the further estimation of the gas content of the plume and hydrate reserves.
-
Key words:
- methane plume /
- natural gas hydrate /
- gas content /
- seismic attribute /
- linear fitting
-
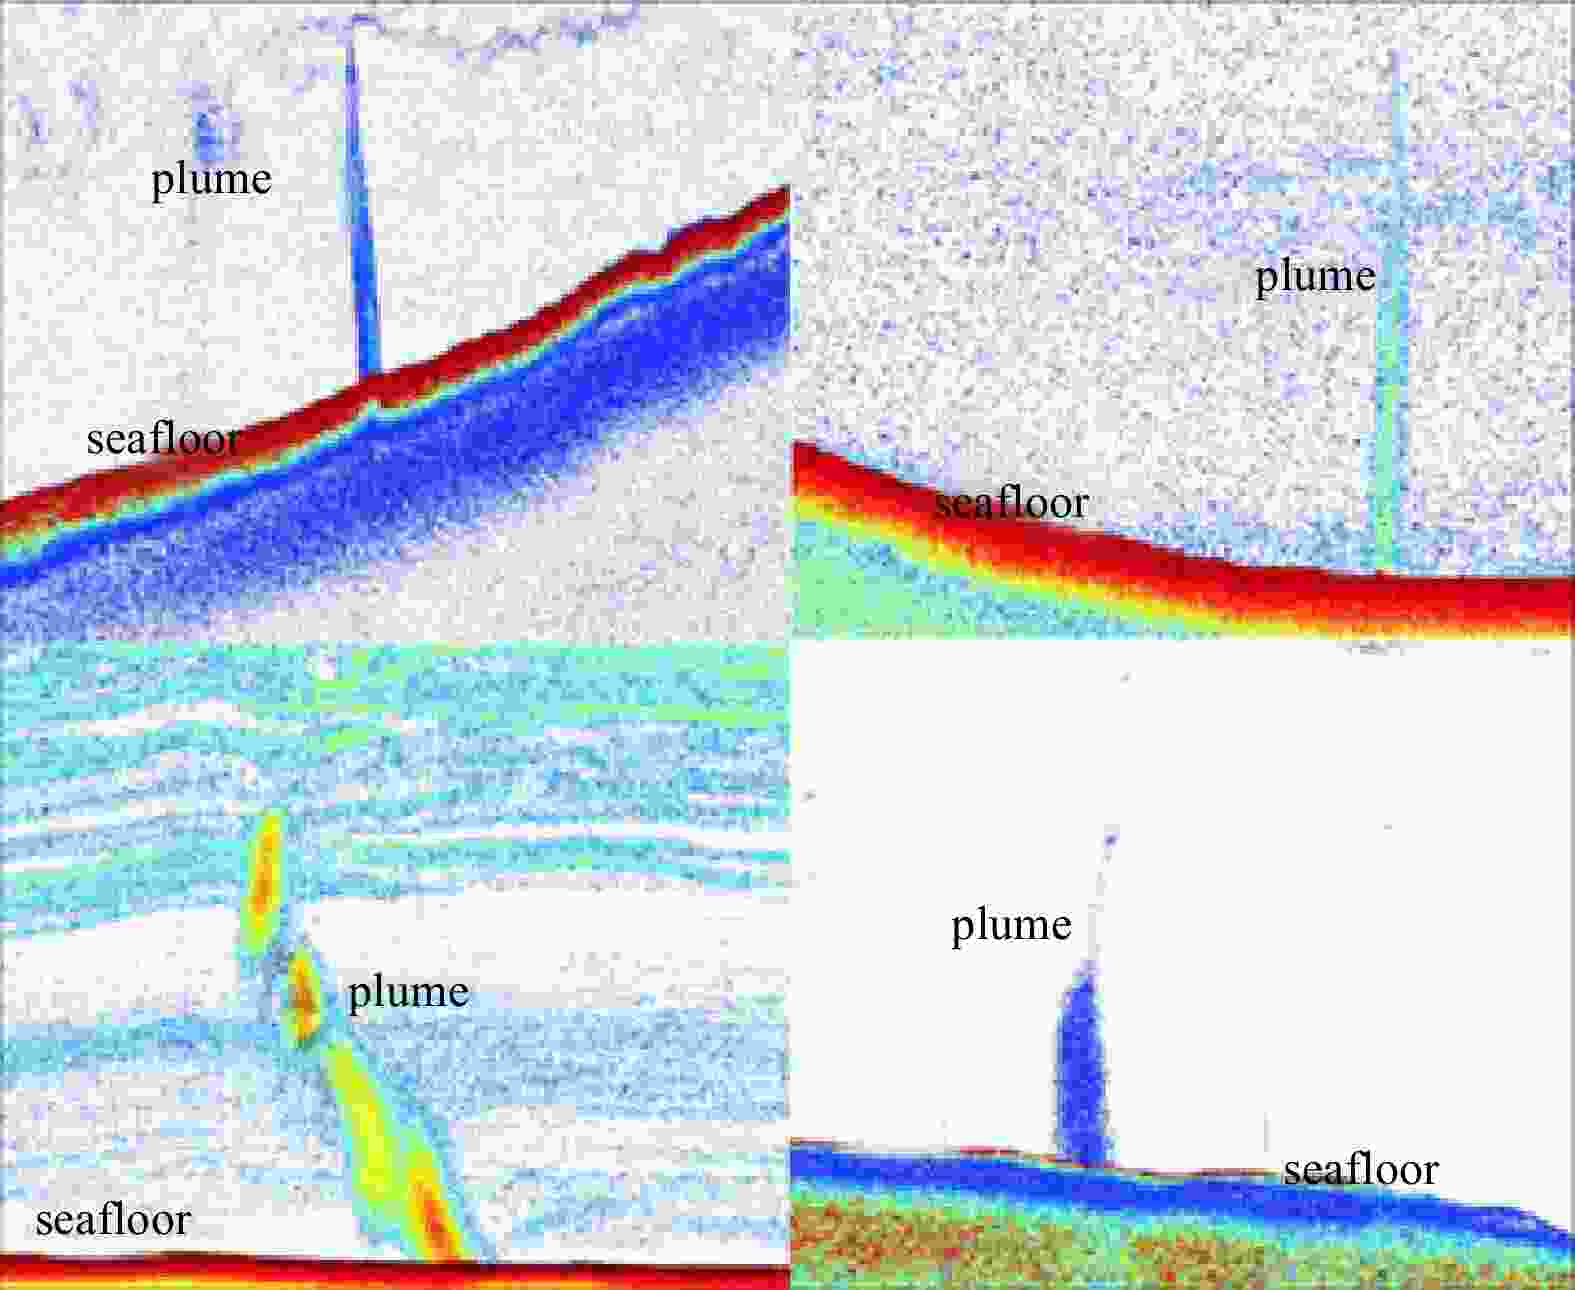
Figure 1. Bubble plume in cold seepage in the Okhotsk Sea (Luan et al., 2010).
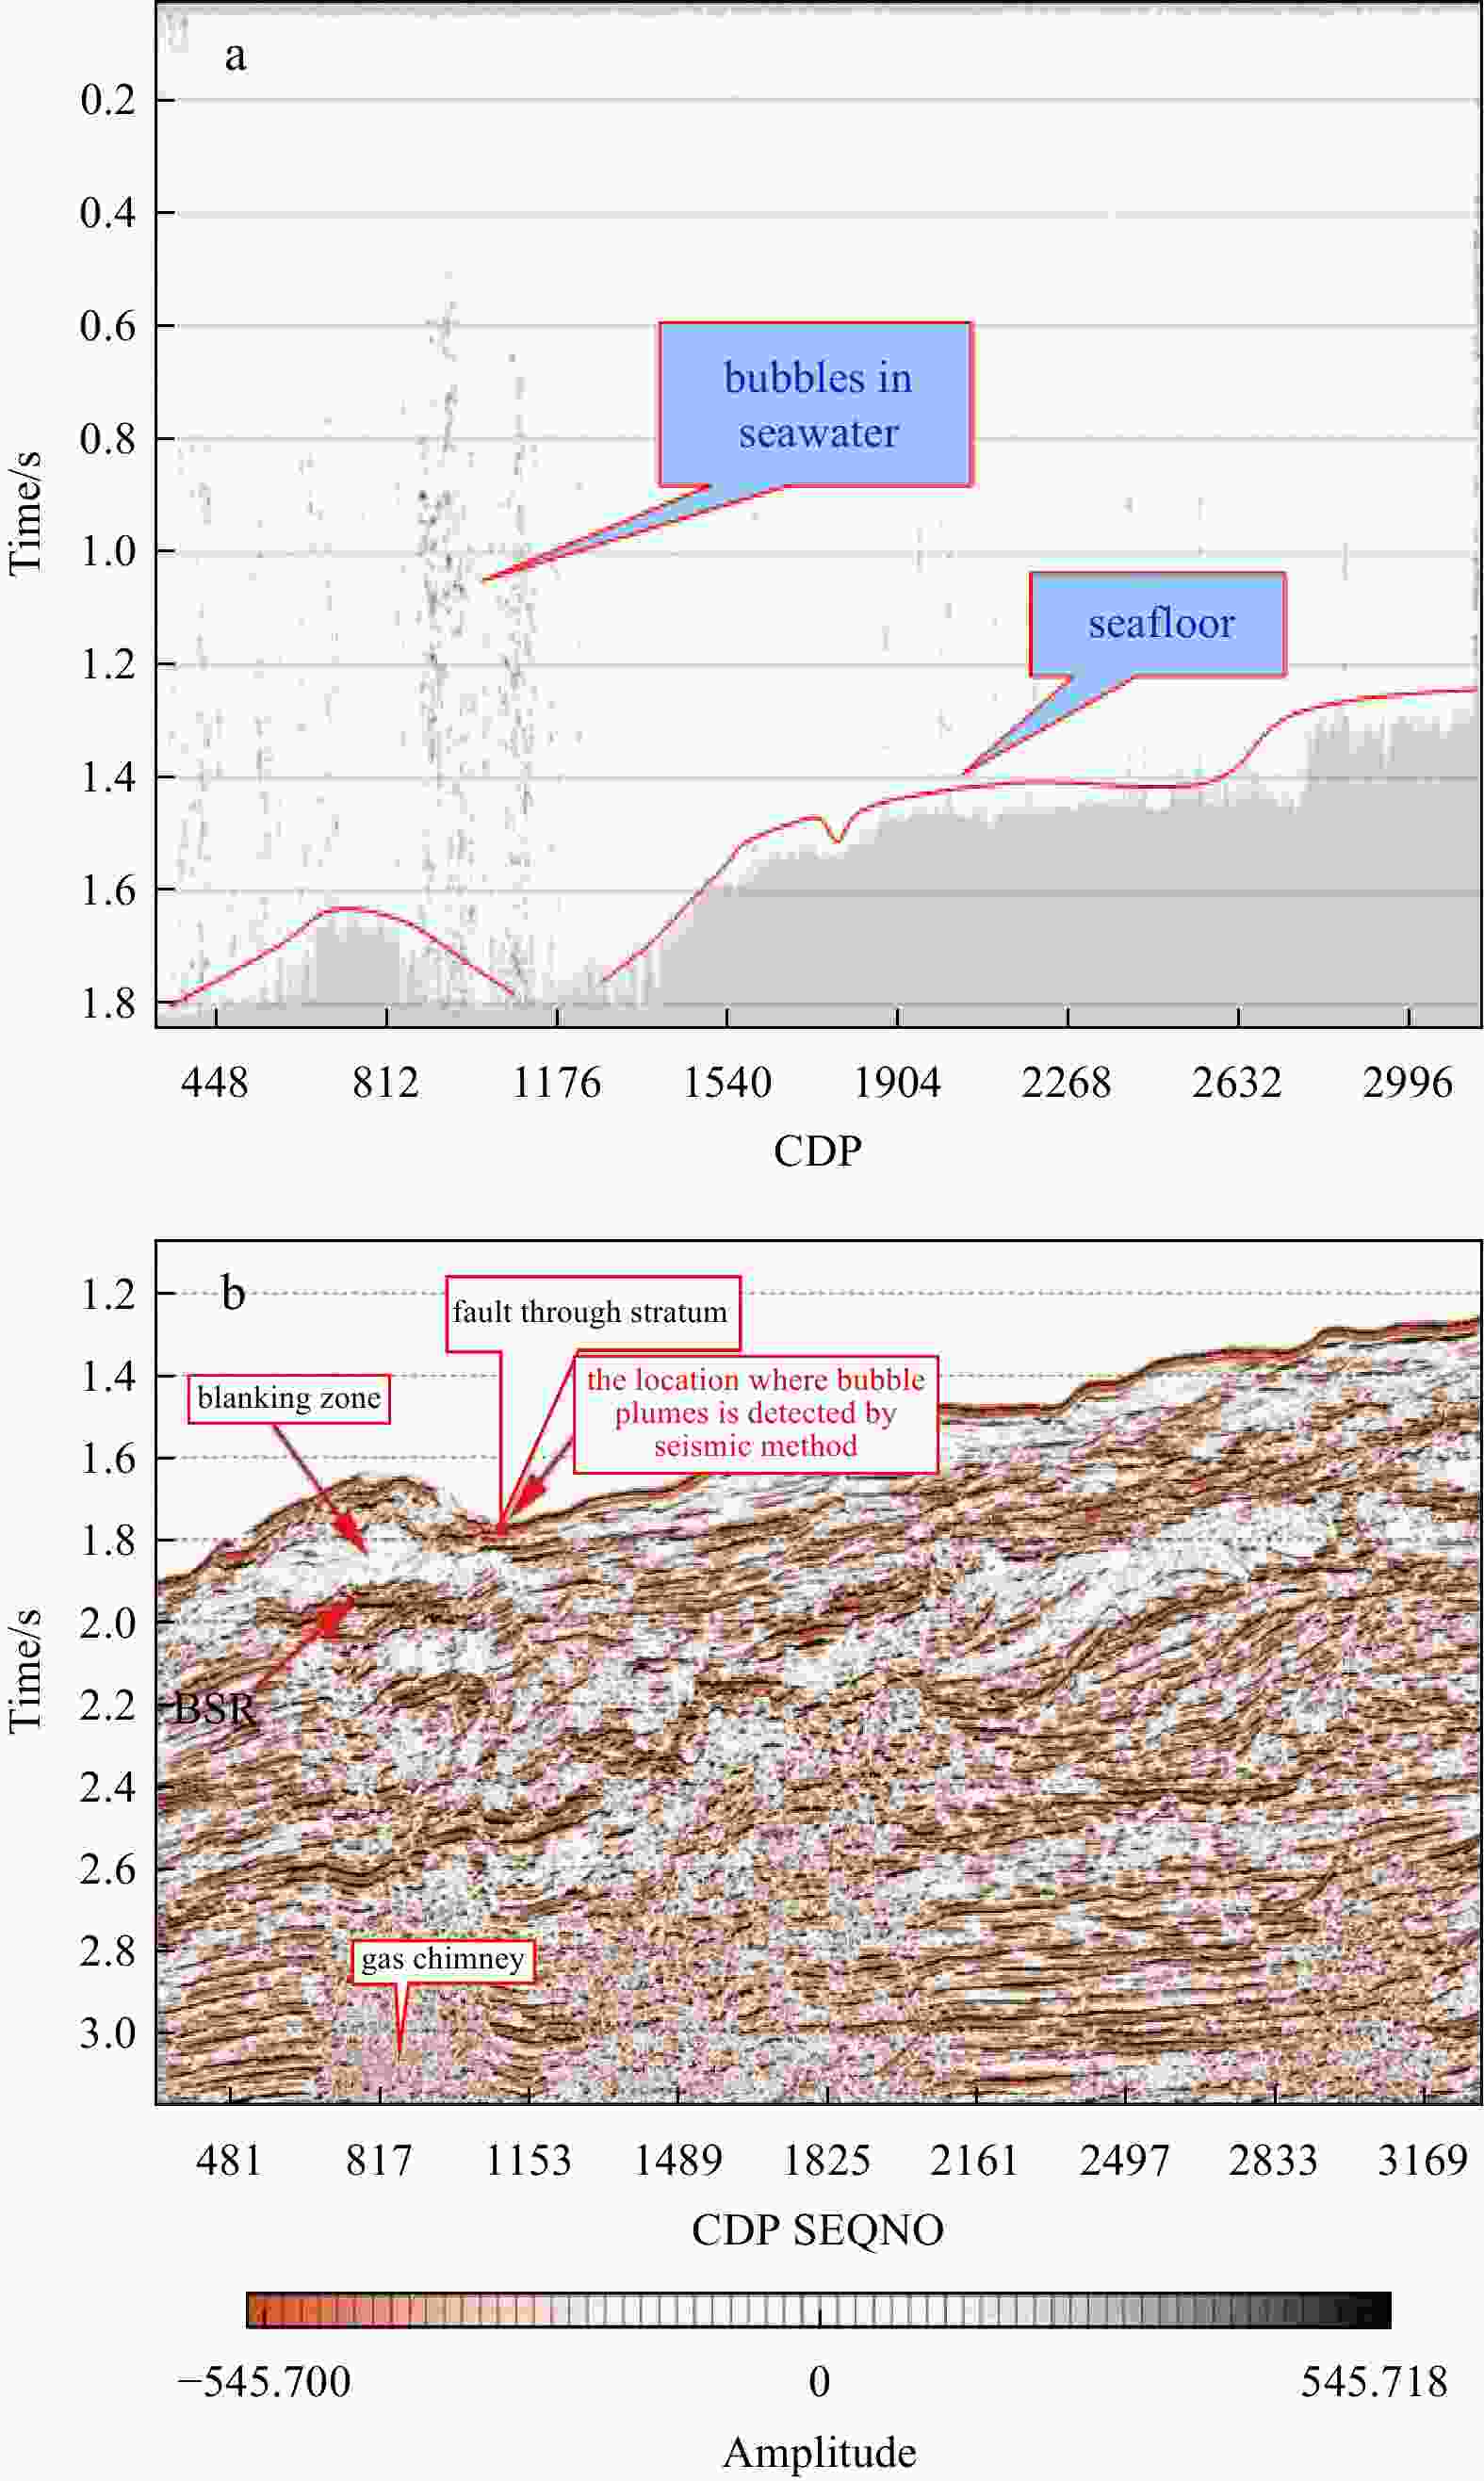
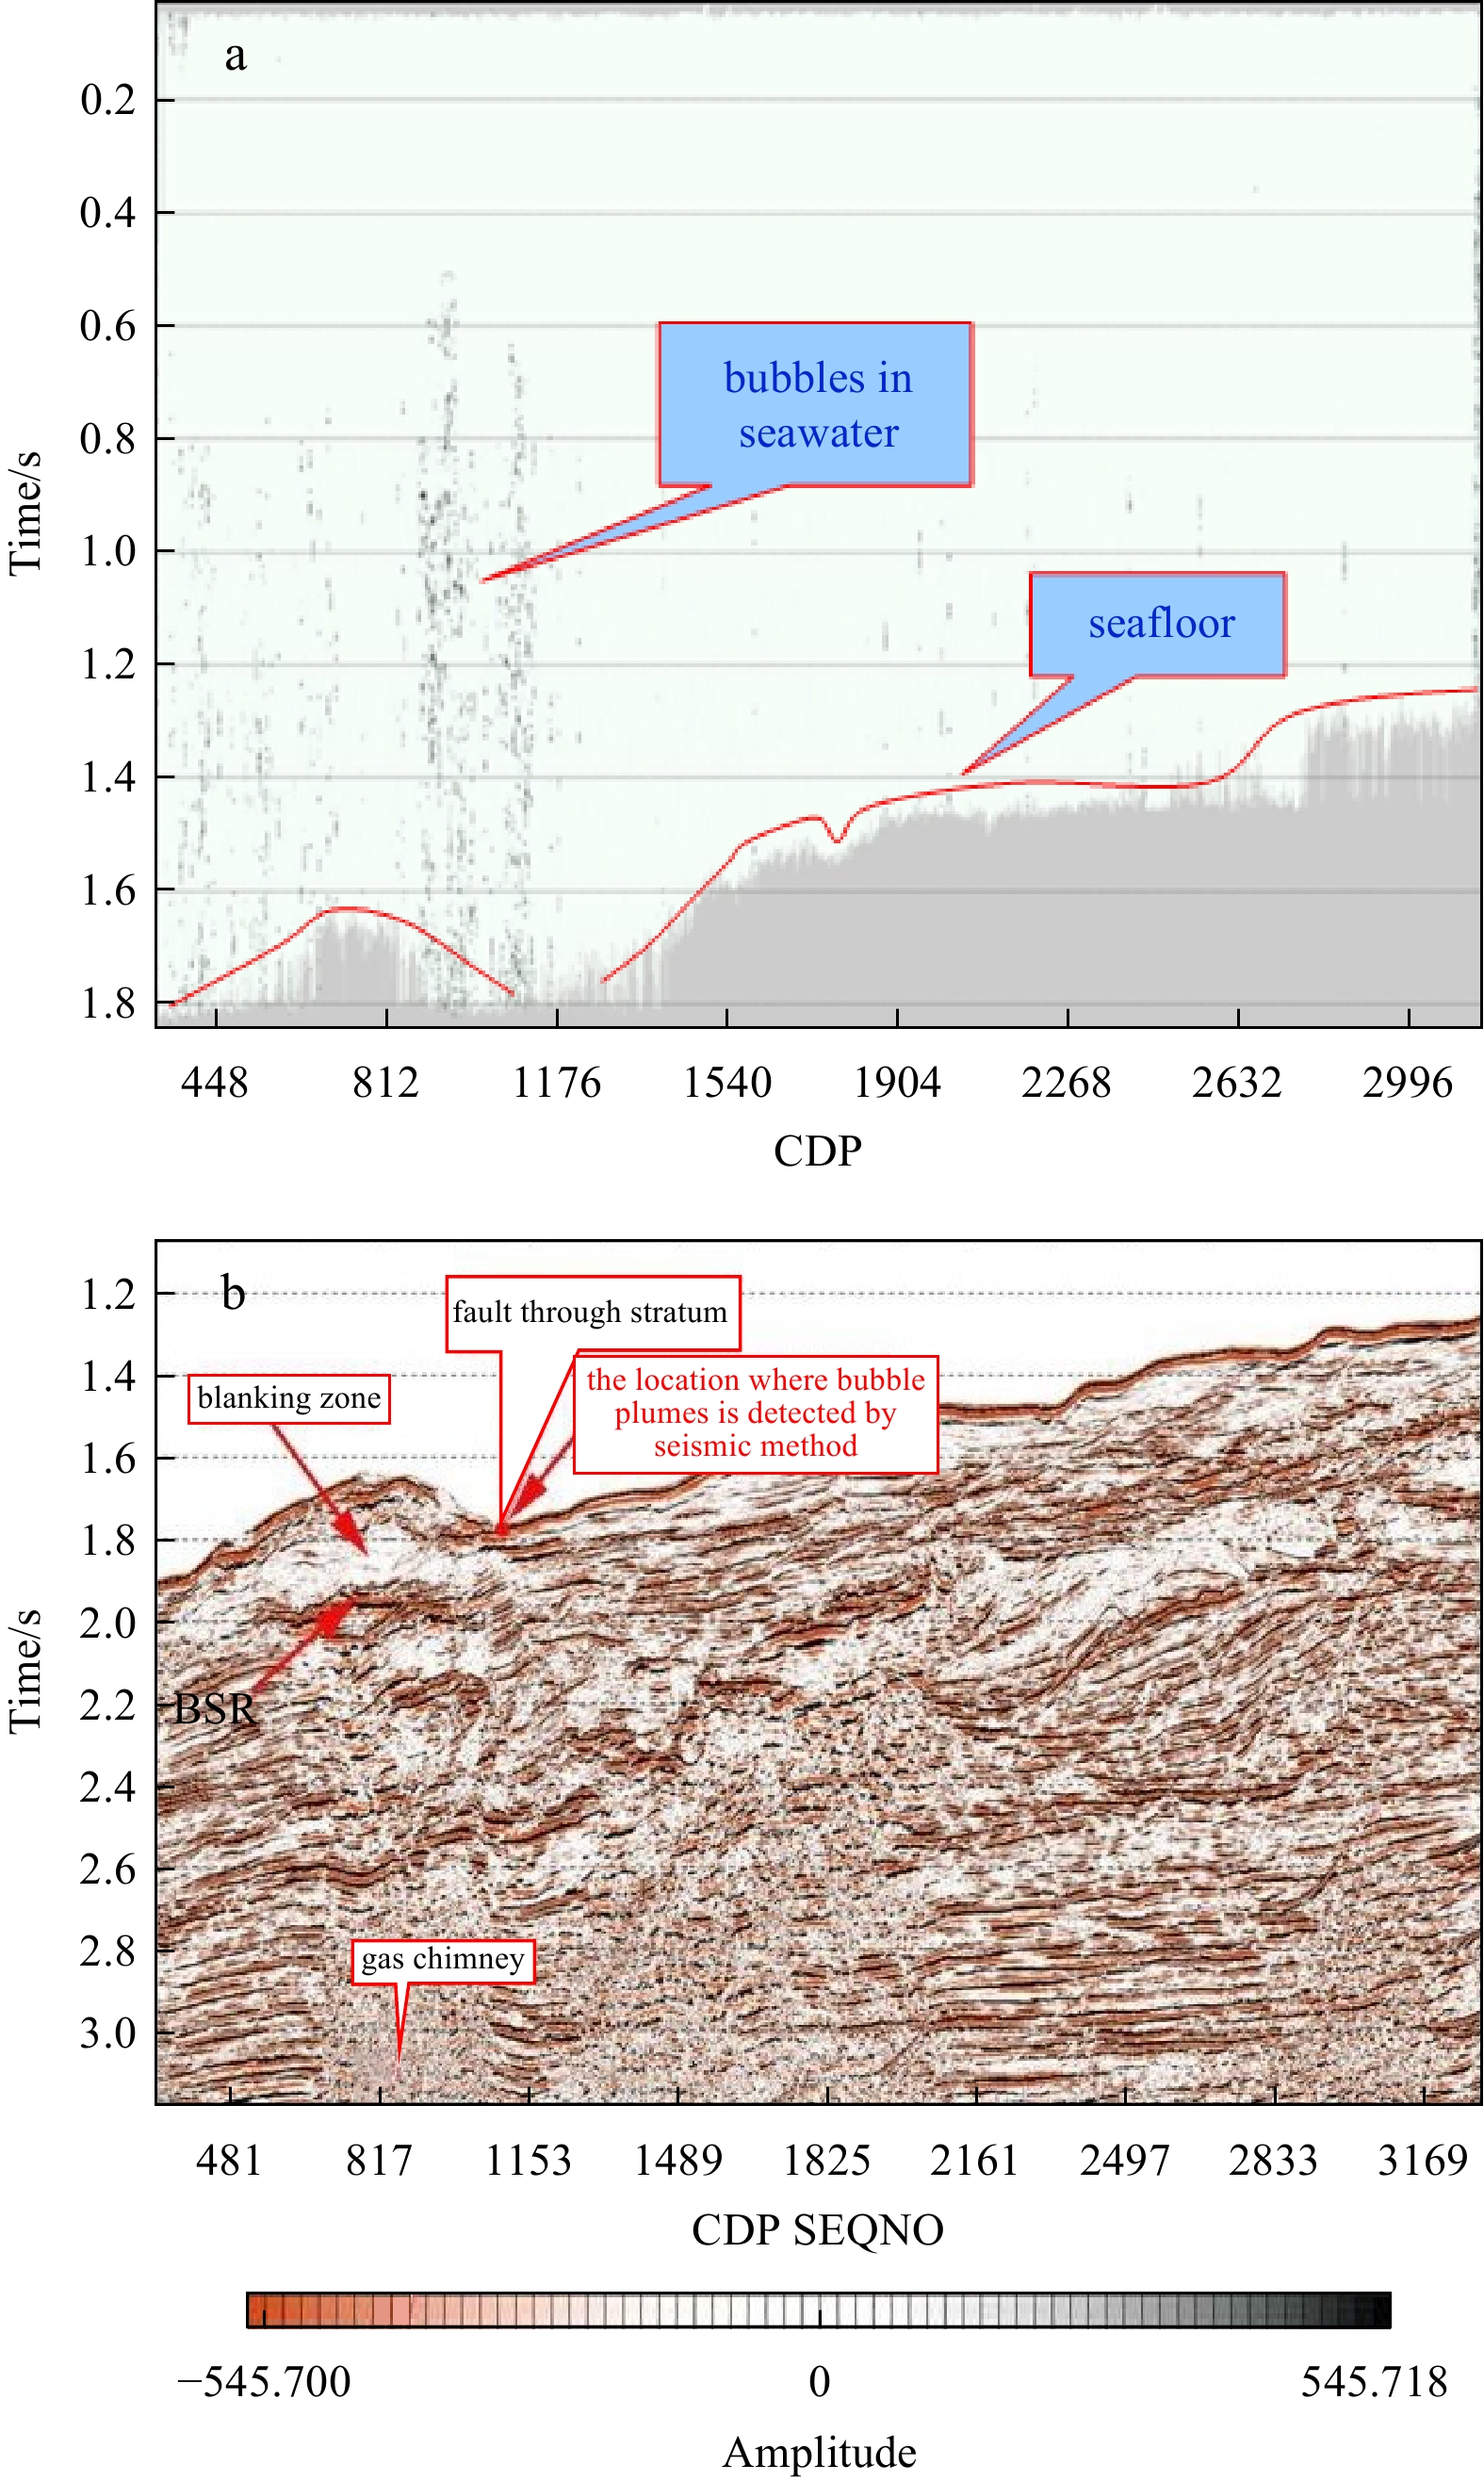
Figure 2. Bubble plume (a) and seismic migration section (b) in the survey area in the South China Sea (You et al., 2015). BSR: bottom simulating reflector, CDP: common depth point, SEQNO: sequence number.
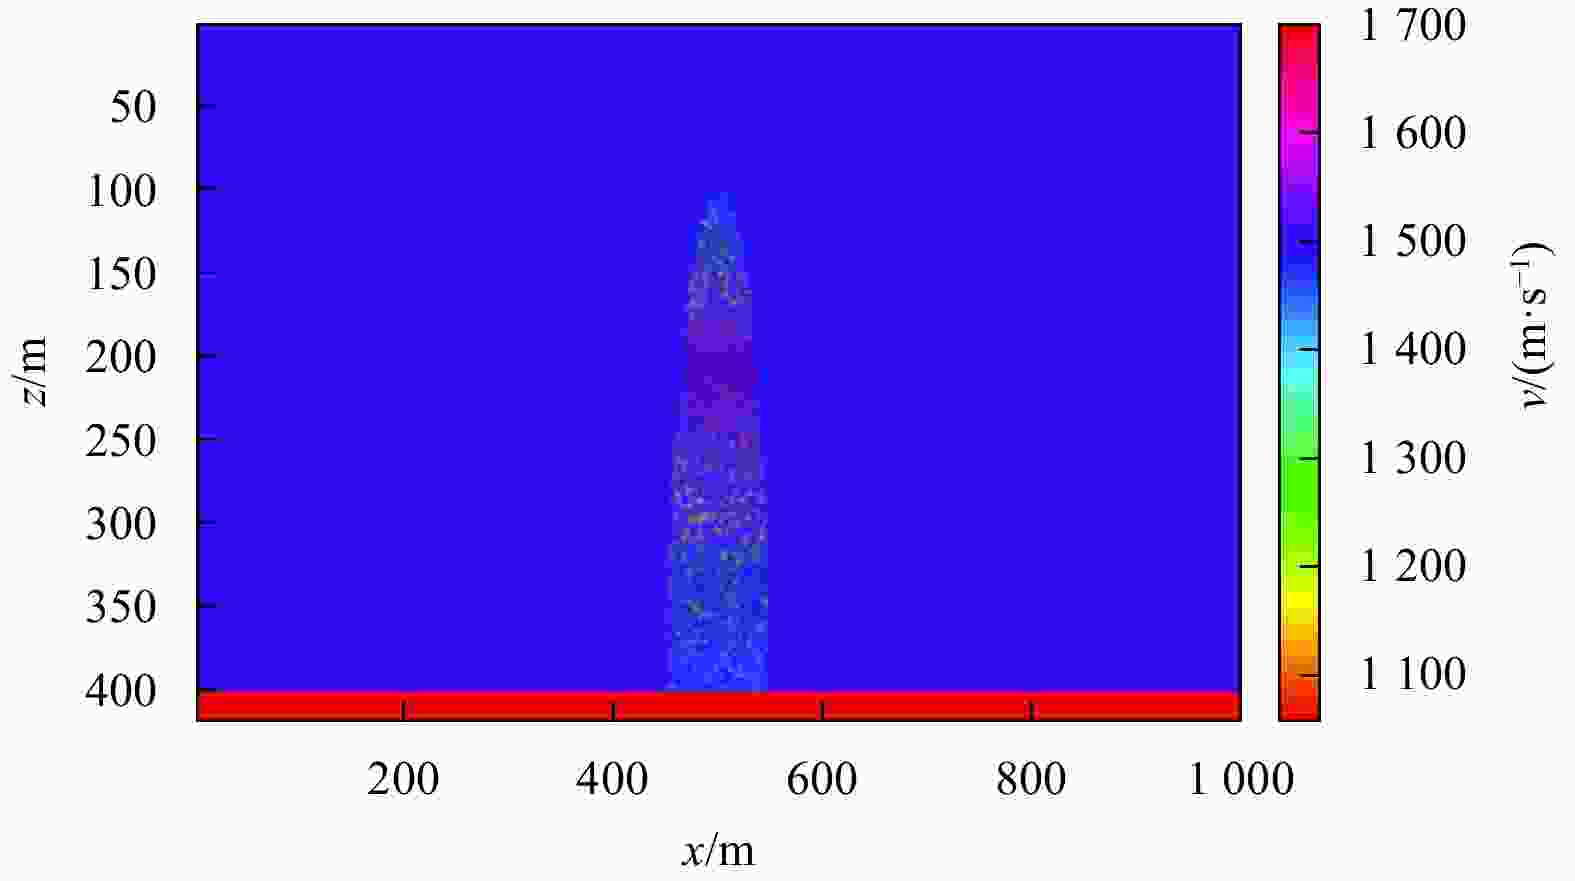
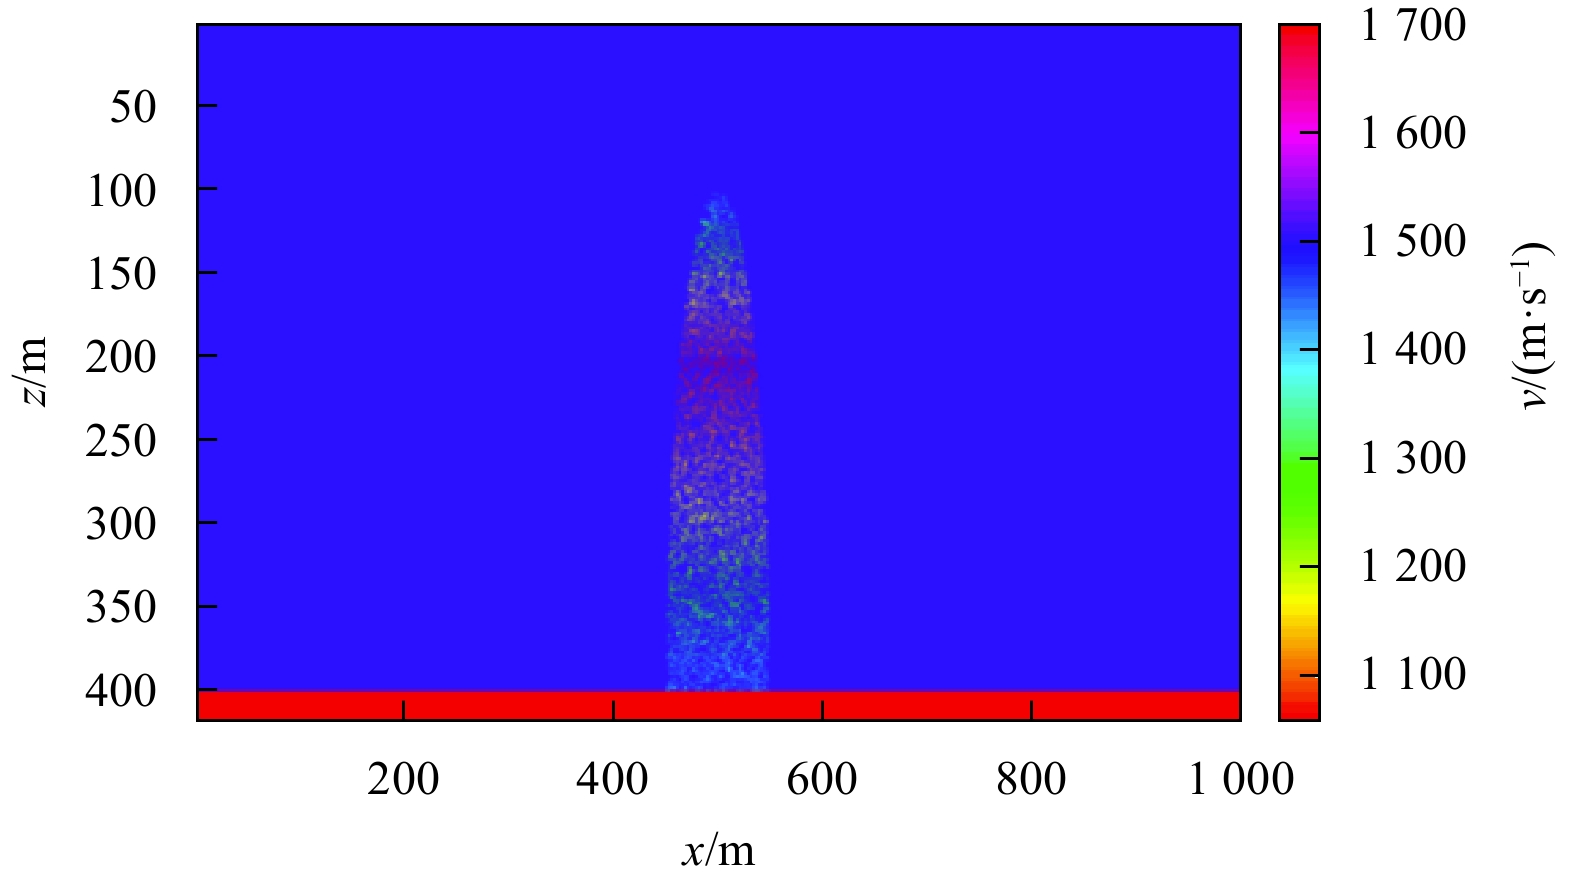
Figure 3. Model of the velocity of the plume (You et al., 2015).
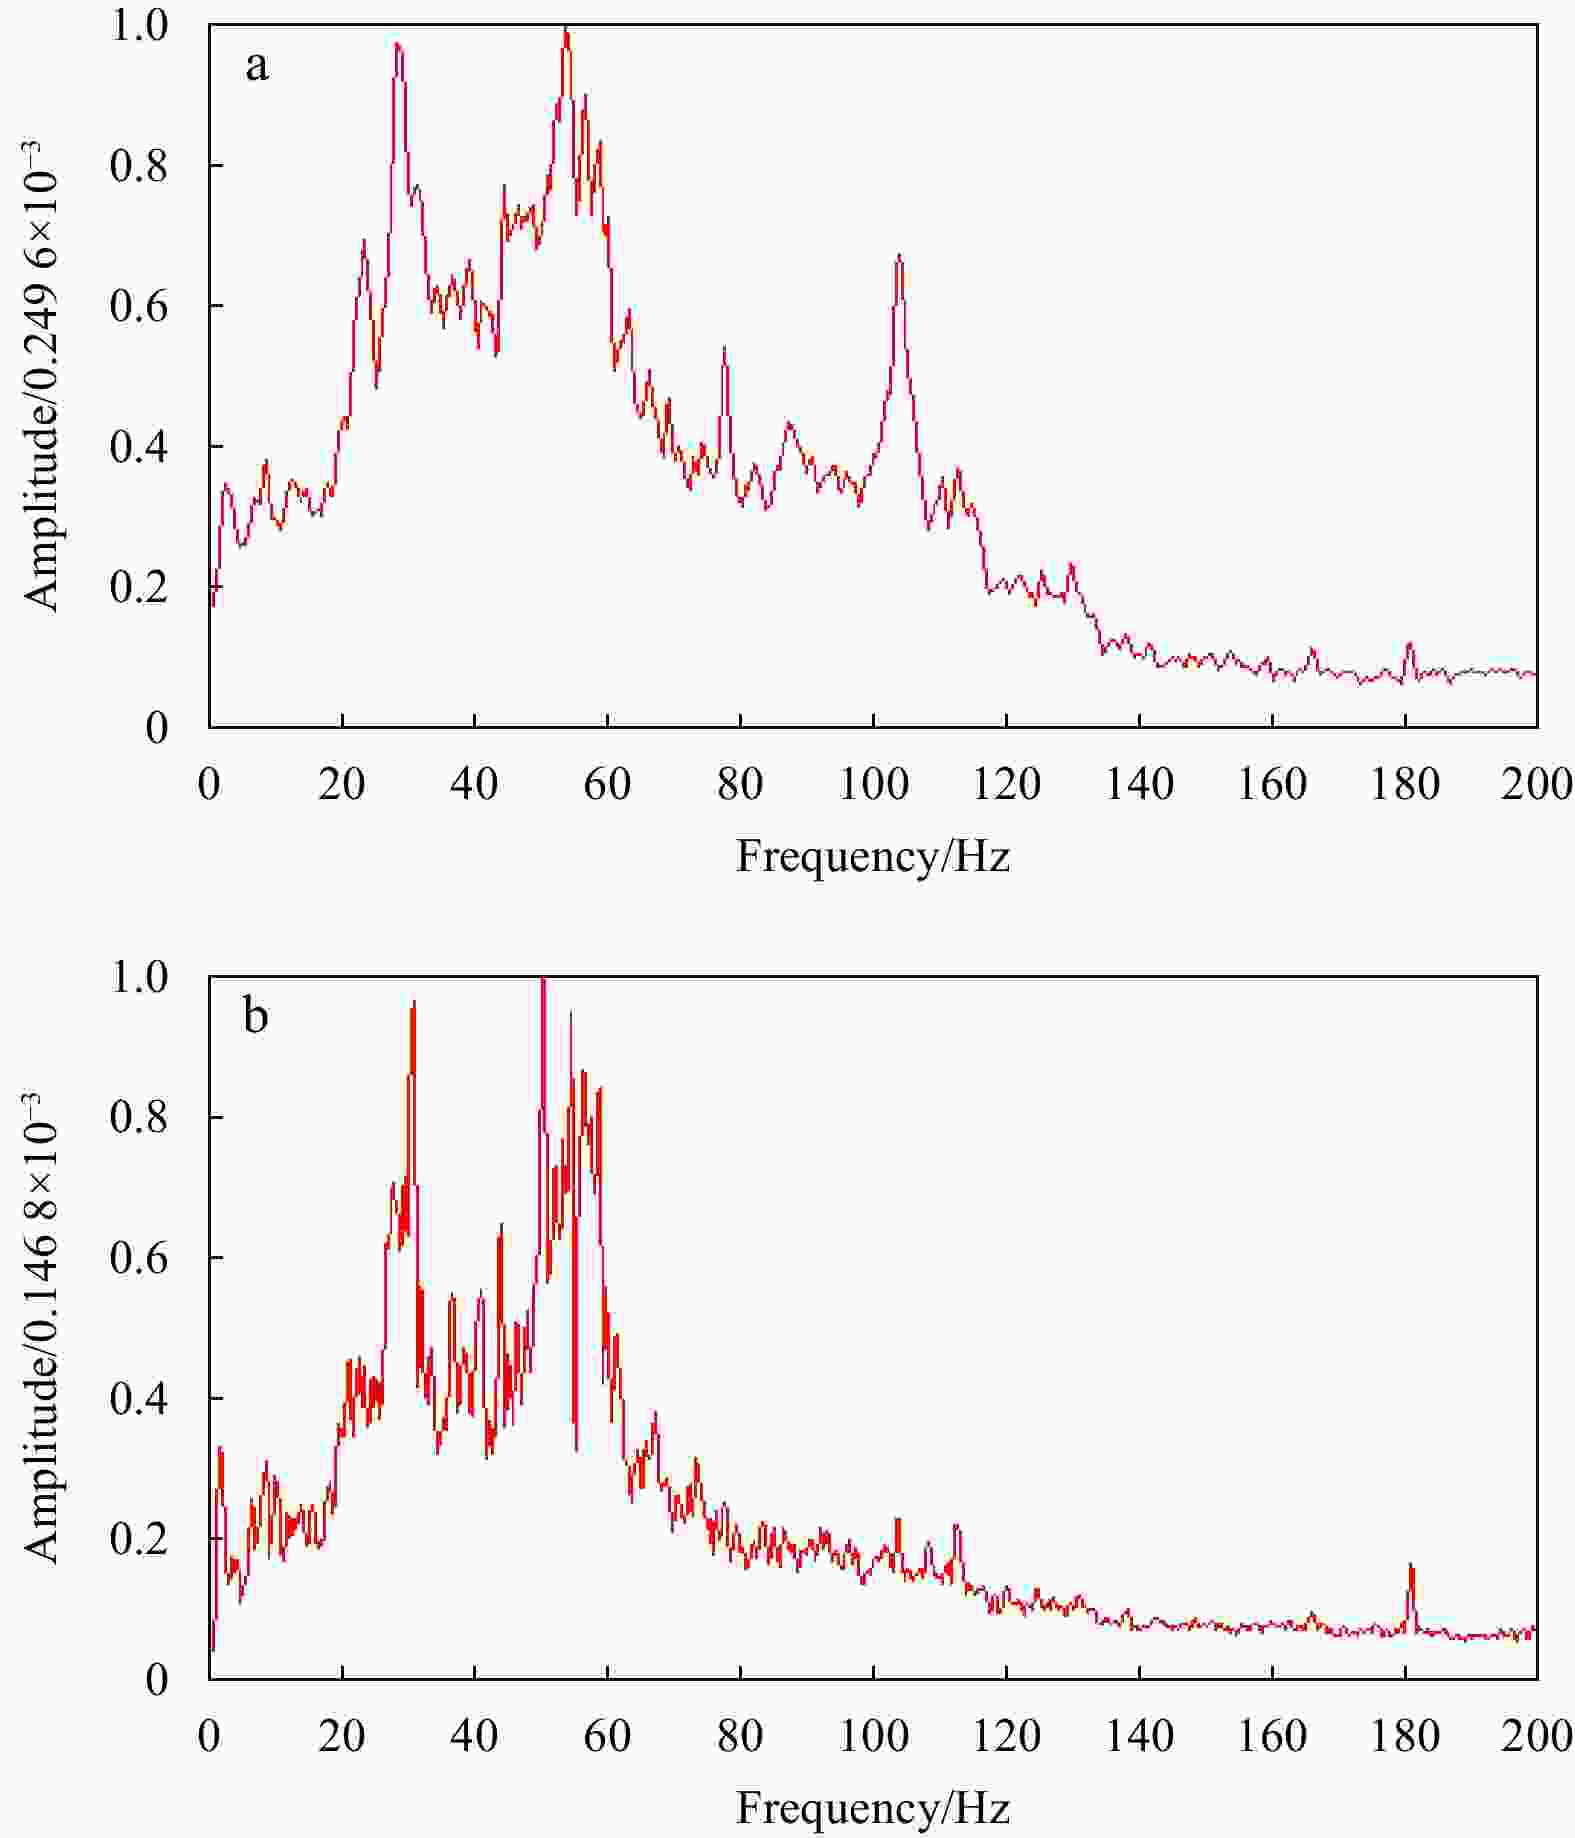
Figure 4. The spectrum of seismic section in Fig. 2a. a. The spectrum of trace-gather; b. the spectrum of shot-gather.
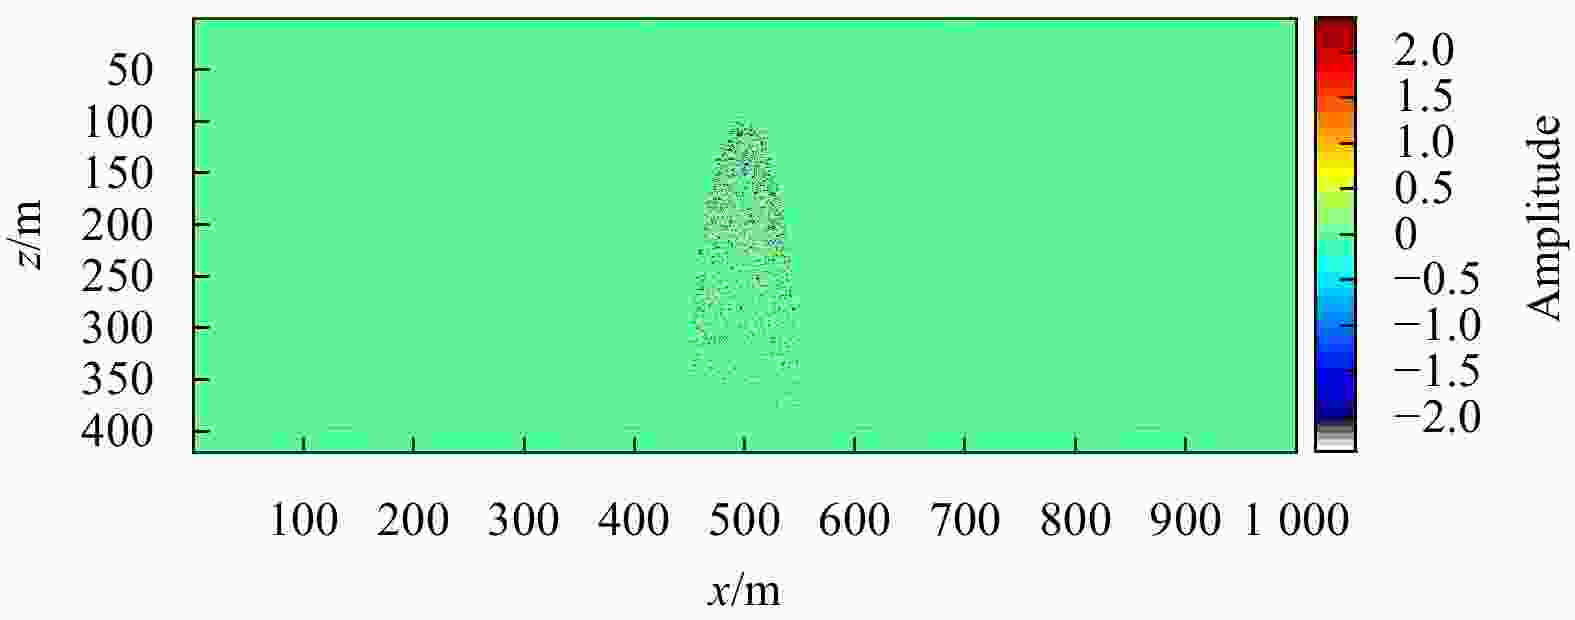
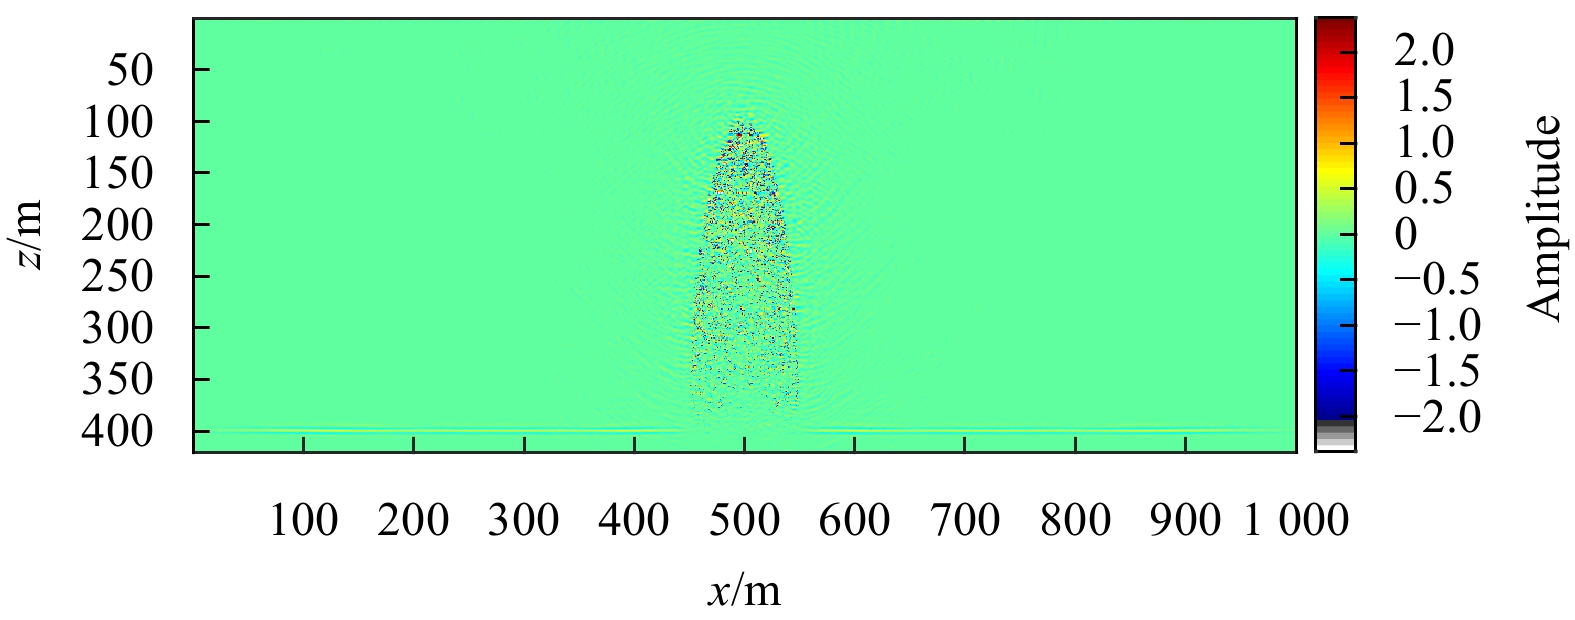
Figure 5. Migration section of the plume model with a background gas content of 10%–15%–10% (You et al., 2015).
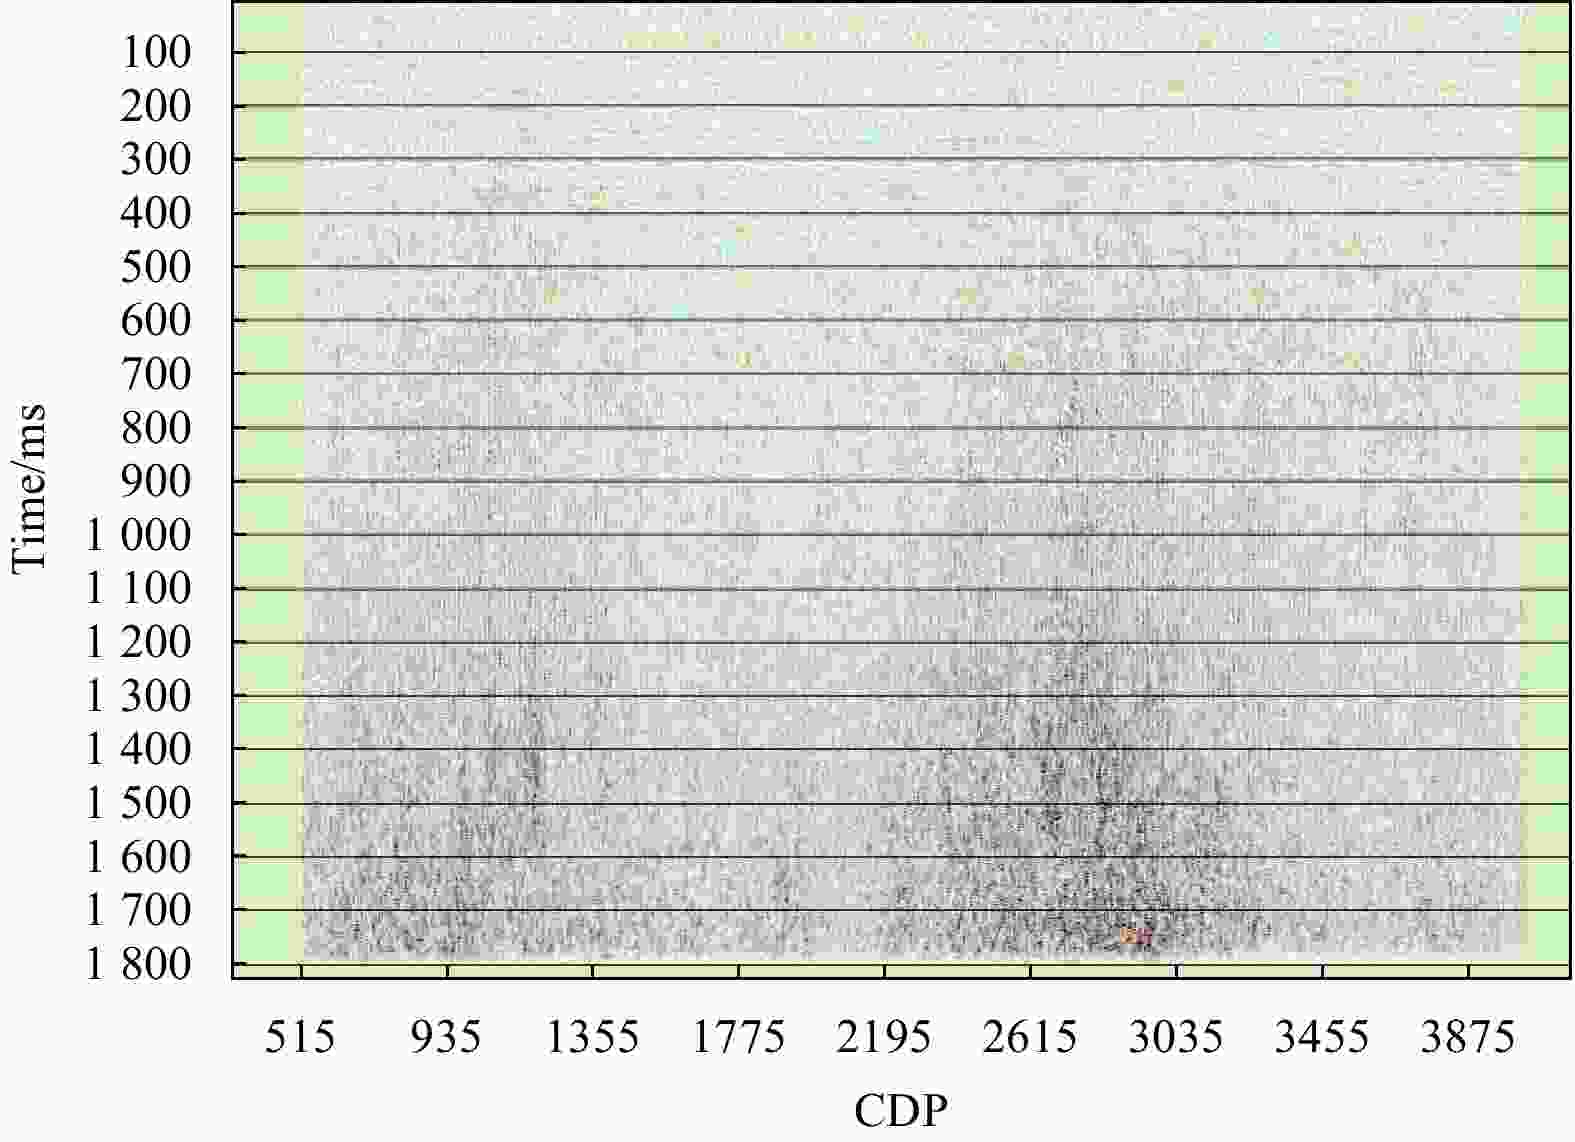
Figure 10. Plume section of a certain survey area in the South China Sea. CDP: common depth point.
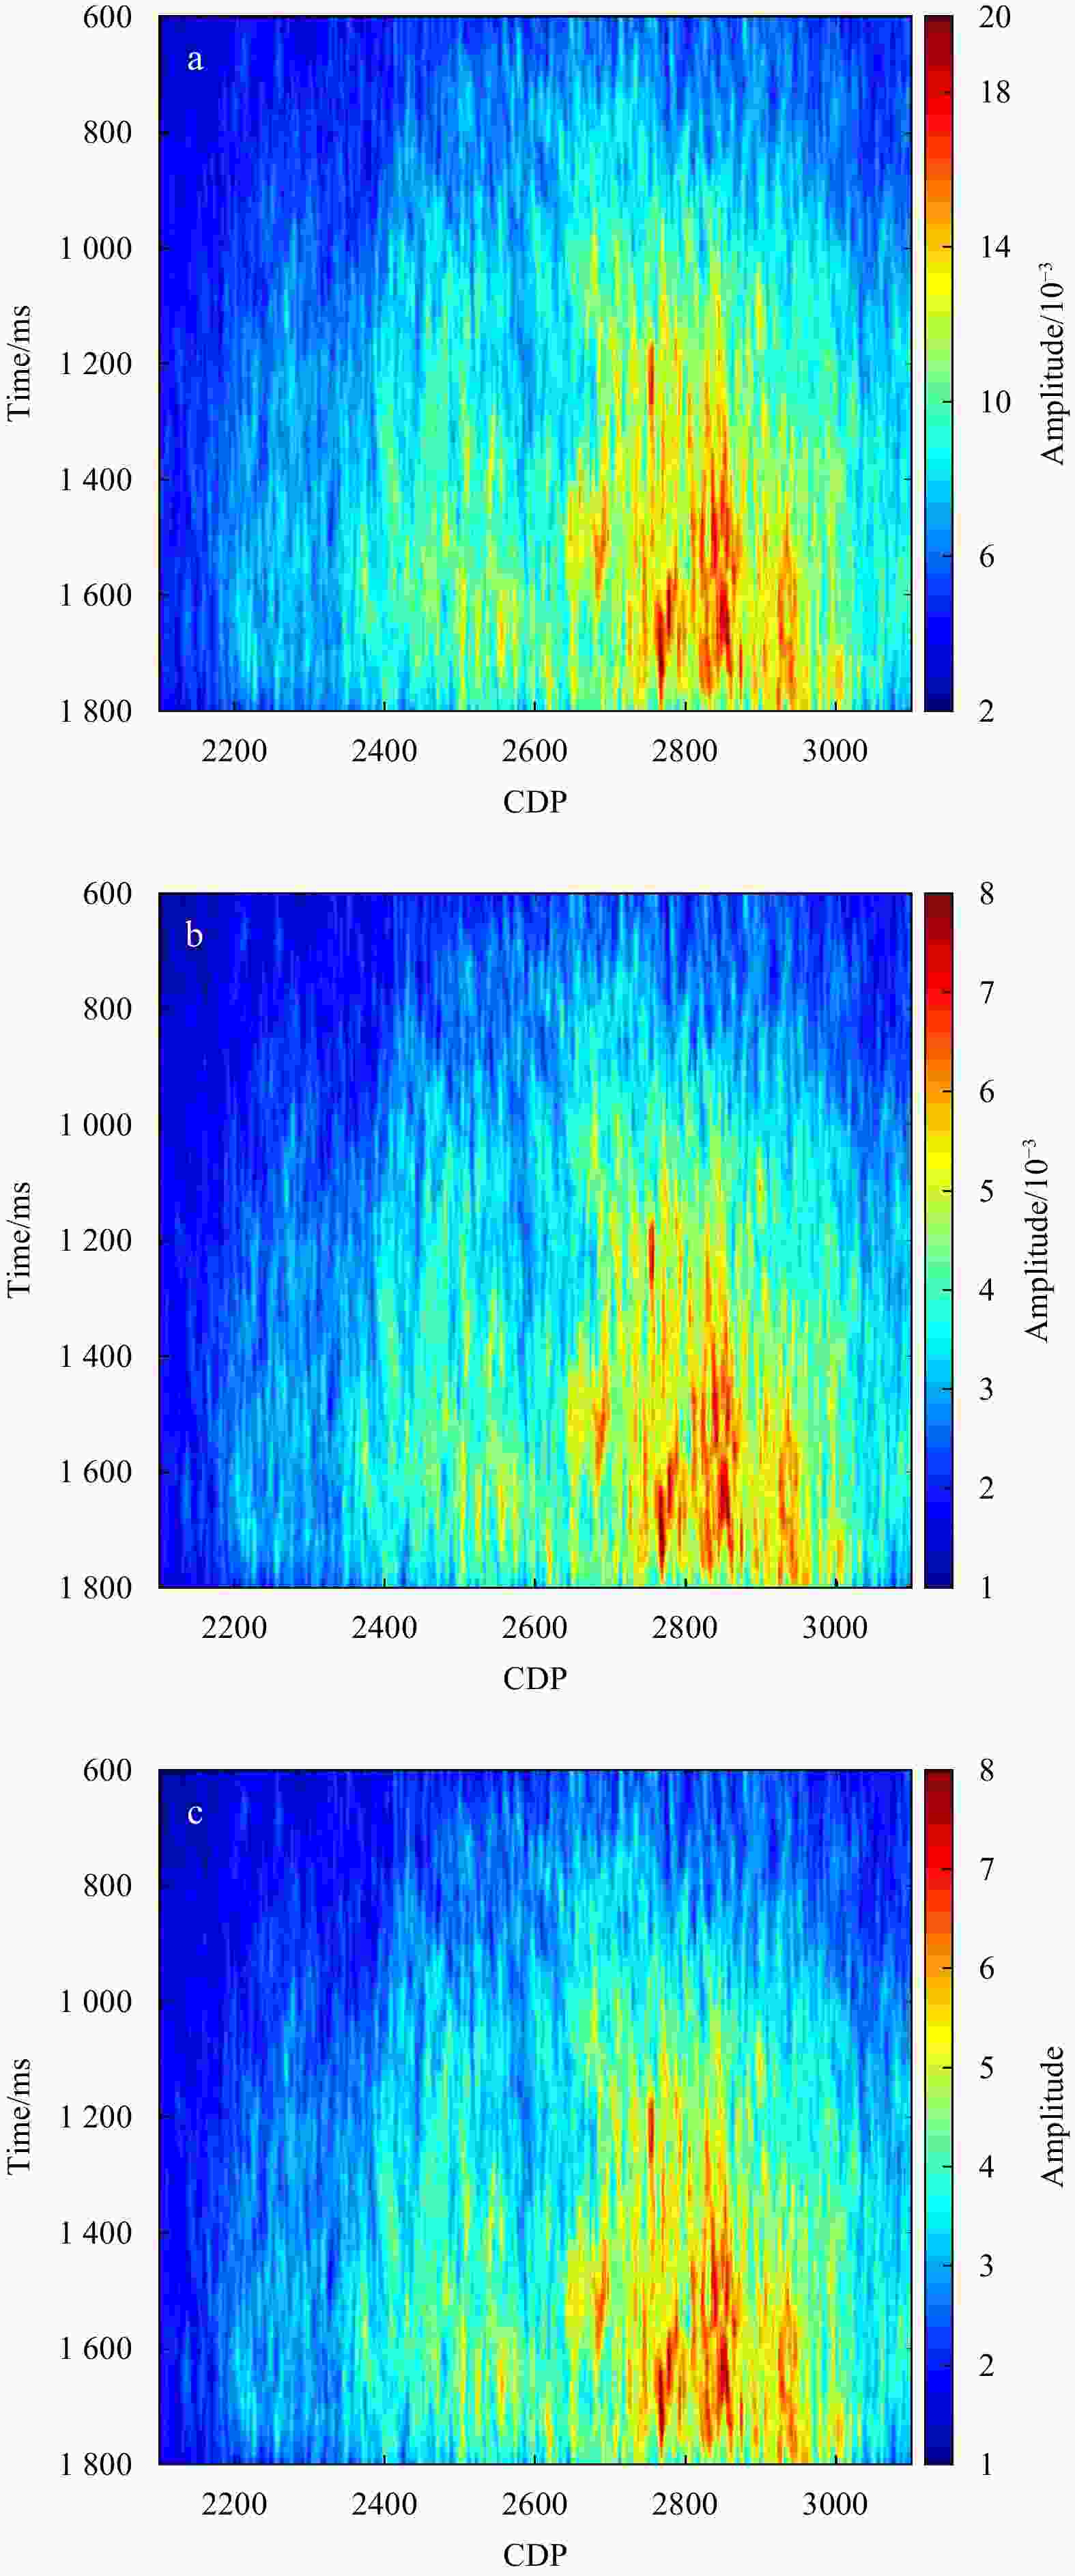
Figure 11. Three sections of the amplitude attribute. a. RMS amplitude; b. average absolute amplitude; c. absolute amplitude integration.
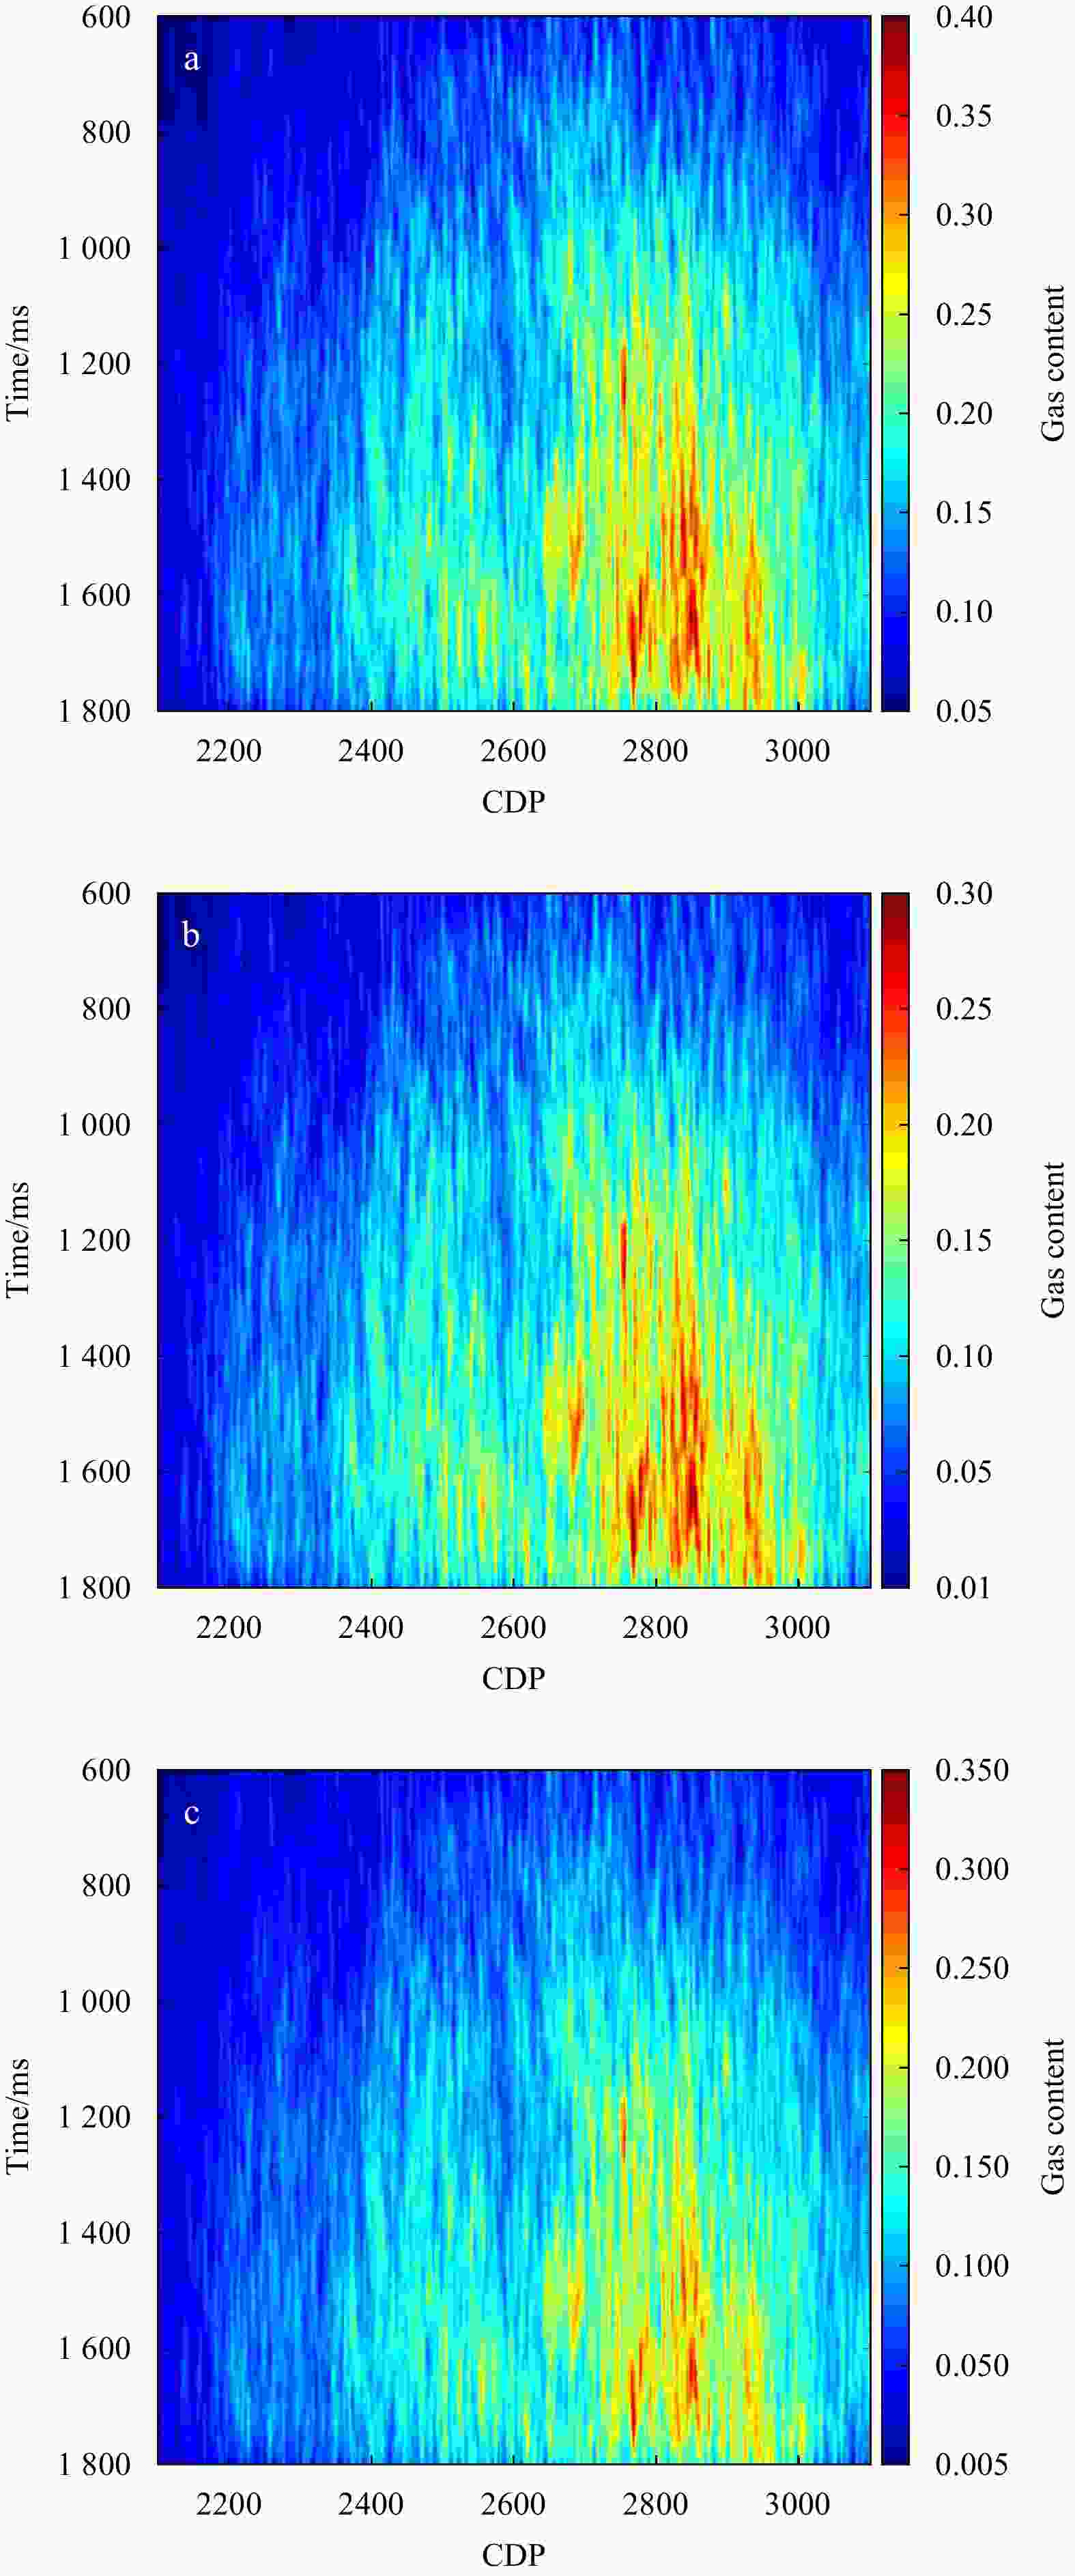
Figure 12. Gas content sections inverted by the amplitude attributes. a. Gas content section inverted by the RMS amplitude attribute; b. gas content section inverted by the average absolute amplitude attribute; c. gas content section inverted by the absolute amplitude integration attribute. CDP: common depth point.
Table 1. Gas content of three formations of five models
Model Formation 1 Formation 2 Formation 3 m1 0.018 0.05 0.030 m2 0.060 0.10 0.076 m3 0.110 0.15 0.120 m4 0.160 0.20 0.176 m5 0.210 0.25 0.226  下载: 导出CSV
Table 2. Correlation coefficients between gas content and amplitude attributes of three formations
Amplitude attributes Formation 1 Formation 2 Formation 3 RMS amplitude 0.989 3 0.997 4 0.980 7 Average absolute amplitude 0.977 3 0.994 7 0.985 8 Absolute amplitude integration 0.977 3 0.994 7 0.985 8
下载: 导出CSV
Table 3. Relation models between the gas content and amplitude attributes of three formations
Amplitude attribute Formation 1 Formation 2 Formation 3 RMS amplitude y11=0.0628x11+2.5×10⁻⁴ y21=0.0435x21+1.2×10⁻³ y31=0.0444x31+5.9×10⁻⁴ Average absolute amplitude y12=0.0252x12+6.7×10⁻⁴ y22=0.0191x22+1.6×10⁻³ y32=0.0228x32+8.0×10⁻⁴ Absolute amplitude integration y13=25.2x13+0.67 y23=19.1x23+1.6 y33=22.8x33+0.8
下载: 导出CSV
Table 4. Correlation coefficients between gas content and amplitude attribute
Amplitude attributes RMS amplitude Average absolute amplitude Absolute amplitude integration Correlation coefficients 0.949 5 0.977 7 0.977 7
下载: 导出CSV
-
[1] Brown A R. 1996. Seismic attributes and their classification. The Leading Edge, 15(10): 1090. doi: 10.1190/1.1437208 [2] Charlou J L, Donval J P, Zitter T, et al. 2003. Evidence of methane venting and geochemistry of brines on mud volcanoes of the eastern Mediterranean Sea. Deep Sea Research Part I: Oceanographic Research Papers, 50(8): 941–958. doi: 10.1016/s0967-0637(03)00093-1 [3] Chen Yilan, Ding Jisheng, Zhang Haiquan, et al. 2019. Multibeam water column data research in the Taixinan Basin: implications for the potential occurrence of natural gas hydrate. Acta Oceanologica Sinica, 38(5): 129–133. doi: 10.1007/s13131-019-1444-0 [4] Chen Q, Sidney S. 1997. Seismic attribute technology for reservoir forecasting and monitoring. The Leading Edge, 16(5): 445–450. doi: 10.1190/1.1437657 [5] Chen Jiangxin, Tong Siyou, Han Tonggang, et al. 2020. Modelling and detection of submarine bubble plumes using seismic oceanography. Journal of Marine Systems, 209: 103375. doi: 10.1016/j.jmarsys.2020.103375 [6] Di Pengfei, Feng Dong, Gao Libao, et al. 2008. In situ measurement of fluid flow and signatures of seep activity at marine seep sites. Progress in Geophysics (in Chinese), 23(5): 1592–1602 [7] Duan Peiran, Luan Xiwu, Yu Yi, et al. 2020. Numerical simulation of seismic waves of bubble plumes in submarine cold seepages. Chinese Journal of Geophysics (in Chinese), 63(2): 753–765. doi: 10.6038/cjg2020M0533 [8] Freire A F M, Matsumoto R, Santos L A. 2011. Structural-stratigraphic control on the Umitaka Spur gas hydrates of Joetsu Basin in the eastern margin of Japan Sea. Marine and Petroleum Geology, 28(10): 1967–1978. doi: 10.1016/j.marpetgeo.2010.10.004 [9] Fu Chao, Li Shengli, Yu Xinghe, et al. 2019. Patterns of gas hydrate accumulation in mass transport deposits related to canyon activity: example from Shenhu drilling area in the South China Sea. Acta Oceanologica Sinica, 38(5): 118–128. doi: 10.1007/s13131-019-1443-1 [10] Matsumoto R, Gong Jianming. 2006. Methane plumes over a marine gas hydrate system in the eastern margin of the Sea of Japan: a proposed mechanism for the transport of significant subsurface methane to shallow waters. Marine Geology Letters (in Chinese), 22(5): 33. doi: 10.16028/j.1009-2722.2006.05.009 [11] Greinert J, Artemov Y, Egorov V, et al. 2006. 1300-m-high rising bubbles from mud volcanoes at 2080 m in the Black Sea: hydroacoustic characteristics and temporal variability. Earth and Planetary Science Letters, 244(1–2): 1–15. doi: 10.1016/j.jpgl.2006.02.011 [12] Heeschen K U, Tréhu A M, Collier R W, et al. 2003. Distribution and height of methane bubble plumes on the Cascadia Margin characterized by acoustic imaging. Geophysical Researcher Letters, 30(12): 1643. doi: 10.1029/2003gl016974 [13] Korn M. 1993. Seismic waves in random media. Journal of Applied Geophysics, 29(3–4): 247–269. doi: 10.1016/0926-9851(93)90007-L [14] Li Canping, Gou Limin, You Jiachun, et al. 2016. Further studies on the numerical simulation of bubble plumes in the cold seepage active region. Acta Oceanologica Sinica, 35(1): 118–124. doi: 10.1007/s13131-016-0803-3 [15] Li Canping, Gou Limin, You Jiachun. 2017. Numerical simulation of bubble plumes and an analysis of their seismic attributes. Journal of Ocean University of China, 16(2): 223–232. doi: 10.1007/s11802-017-3069-2 [16] Li Canping, Liu Xuewei, Gou Limin, et al. 2013. Numerical simulation of bubble plumes in overlying water of gas hydrate in the cold seepage active region. Science China: Earth Sciences, 56(4): 579–587. doi: 10.1007/s11430-012-4508-y [17] Liu Shanqi, Yin Fengling, Zhu Bojing, et al. 2015. Numerical simulation on the formation of cold seepage. Chinese Journal of Geophysics (in Chinese), 58(5): 1731–1741. doi: 10.6038/cjg20150523 [18] Luan Xiwu, Liu Hong, Yue Baojing. 2010. Characteristics of cold seepage on side scan sonar sonogram. Geoscience (in Chinese), 24(3): 474–480. doi: 10.3969/j.issn.1000-8527.2010.03.009 [19] Mavko G, Mukerji T, Dvorkin J. 2003. The Rock Physics Handbook: Tools for Seismic Analysis of Porous Media. Cambridge: Cambridge University Press, 106–142 [20] Sassen R, Losh S L, Cathles III L, et al. 2001. Massive vein-filling gas hydrate: relation to ongoing gas migration from the deep subsurface in the Gulf of Mexico. Marine and Petroleum Geology, 18(5): 551–560. doi: 10.1016/S0264-8172(01)00014-9 [21] Sauter E J, Muyakshin S I, Charlou J L, et al. 2006. Methane discharge from a deep-sea submarine mud volcano into the upper water column by gas hydrate-coated methane bubbles. Earth and Planetary Science Letters, 243(3–4): 354–365. doi: 10.1016/j.jpgl.2006.01.041 [22] Shipboard Scientific Party. 2002. Drilling gas hydrates on hydrate ridge, Cascadia continental margin. In: Leg 204 Preliminary Report. College Station, TX: Texas A&M University [23] Taner M T, Koehler F, Sheriff R E. 1979. Complex seismic trace analysis. Geophysics, 44(6): 1041–1063. doi: 10.1190/1.1440994 [24] Tryon M D, Brown K M. 2004. Fluid and chemical cycling at Bush Hill: implications for gas-and hydrate-rich environments. Geochemistry, Geophysics, Geosystems, 5(12): Q12004. doi: 10.1029/2004gc000778 [25] Tryon M D, Brown K M, Torres M E. 2002. Fluid and chemical flux in and out of sediments hosting methane hydrate deposits on Hydrate Ridge, OR, II: hydrological processes. Earth and Planetary Science Letters, 201(3–4): 541–557. doi: 10.1016/s0012-821x(02)00732-x [26] Wu Rushan, Aki K. 1993. Scattering and Attenuation of Seismic Waves (in Chinese). Li Yuche, Lu Shoude, trans. Beijing: Seismic Press, 1–5 [27] Xia Jie, Pang Zhaojun, Jin Dongping. 2012. Inner resonance of an in-plane elastic tethered satellite system. Journal of Vibration Engineering (in Chinese), 25(3): 232–237. doi: 10.3969/j.issn.1004-4523.2012.03.002 [28] You Jiachun, Li Canping, Cheng Lifang, et al. 2015. Numerical simulation of methane plumes based on effective medium theory. Arabian Journal of Geosciences, 8(11): 9089–9100. doi: 10.1007/s12517-015-1916-2 [29] Yuan Wenjun, Shang Yadong, Huang Yong, et al. 2013. The representation of meromorphic solutions to certain ordinary differential equations and its applications. Scientia Sinica Mathematica, 43(6): 563–575. doi: 10.1360/012012-159 -


 点击查看大图
计量
- 文章访问数: 556
- HTML全文浏览量: 180
- PDF下载量: 19
- 被引次数: 0

