

-
Abstract: In this paper, an ice floe inner stress caused by the wave-induced bending moment is derived to estimate the stress failure of ice floe. The strain and stress failures are combined to establish a wave-induced ice yield scheme. We added ice stress and strain failure module in the Finite-Volume Community Ocean Model (FVCOM), which already includes module of ice-induced wave attenuation. Thus a fully coupled wave-ice dynamical interaction model is established based on the ice and wave modules of FVCOM. This model is applied to reproduce the ice and wave fields of the breakup events observed during the second Sea Ice Physics and Ecosystem Experiment (SIPEX-2) voyage. The simulation results show that by adopting the combined wave-induced ice yield scheme, the model can successfully predict the ice breakup events, which the strain failure model is unable to predict. By comparing the critical significant wave height deduced from strain and stress failure schemes, it is concluded that the ice breakup is caused by the strain failure when wave periods are shorter than a threshold value, while the stress failure is the main reason for the ice breakup when wave periods are longer than the threshold value. Neglecting either of these two ice-break inducement mechanisms could overestimate the ice floe size, and thus underestimate the velocity of the ice lateral melt and increase the error of simulation of polar ice extent.
-
Key words:
- wave-ice interaction /
- FVCOM /
- stress failure /
- ice lateral melt
-
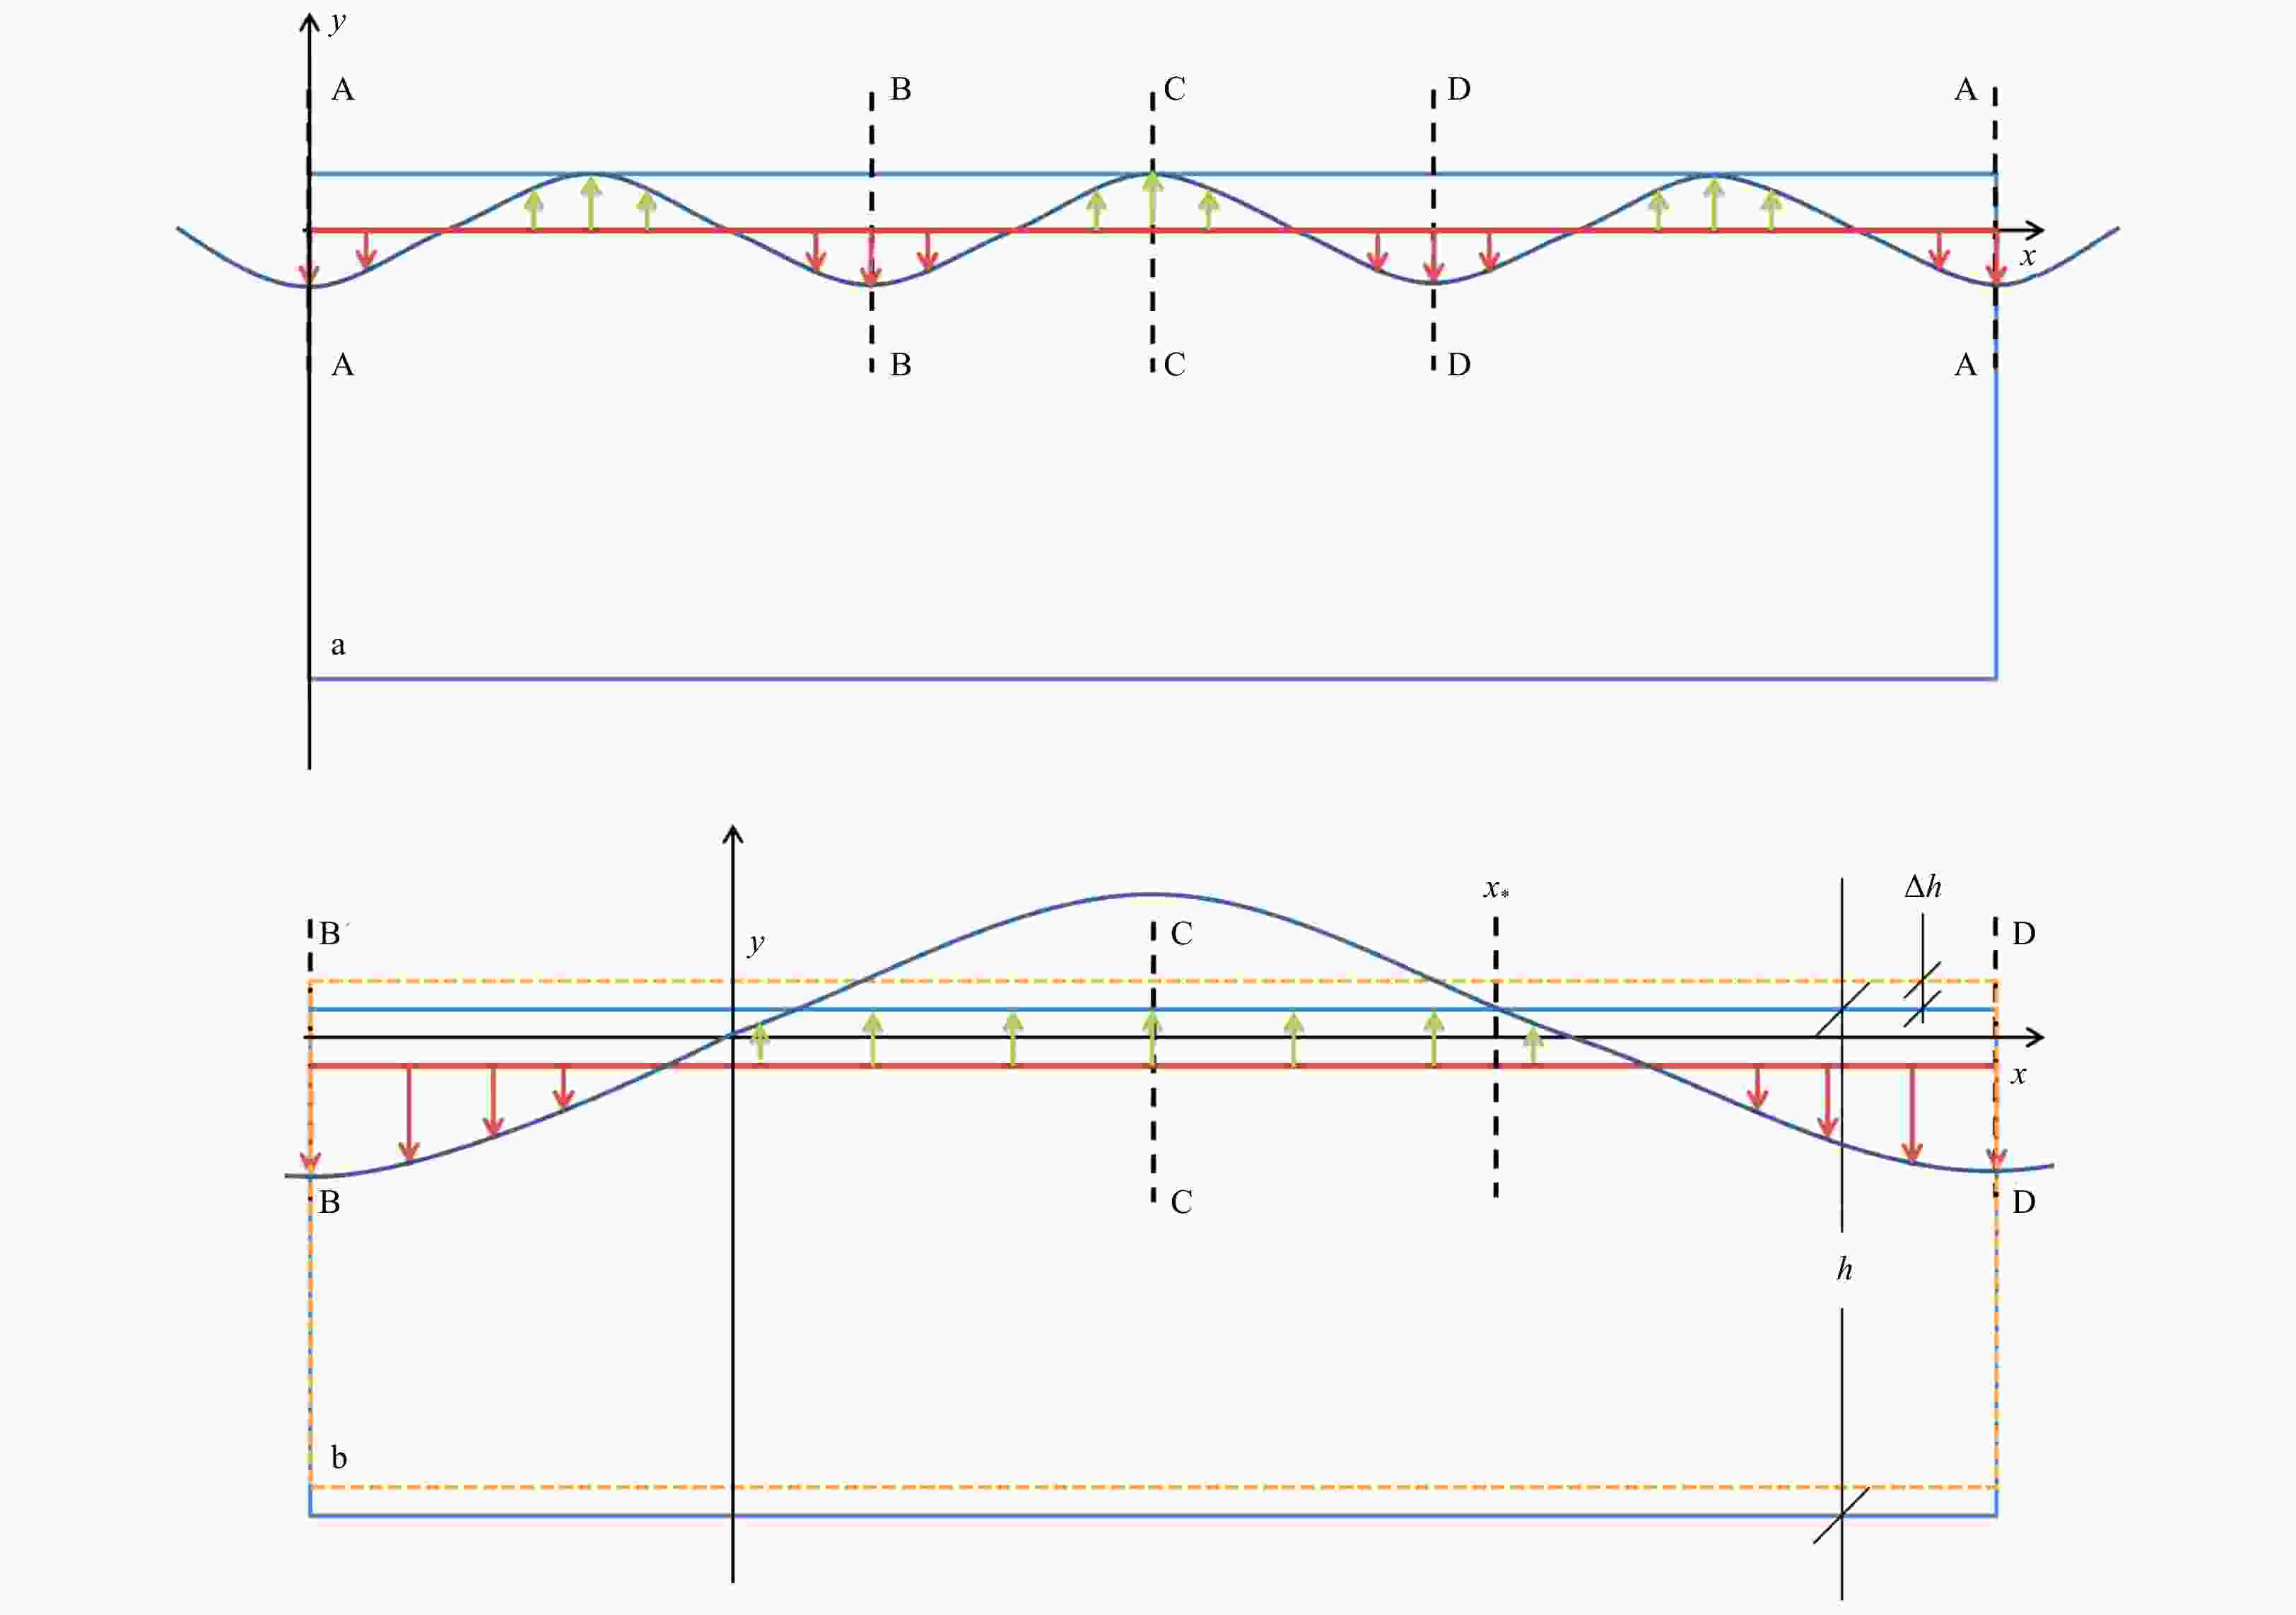
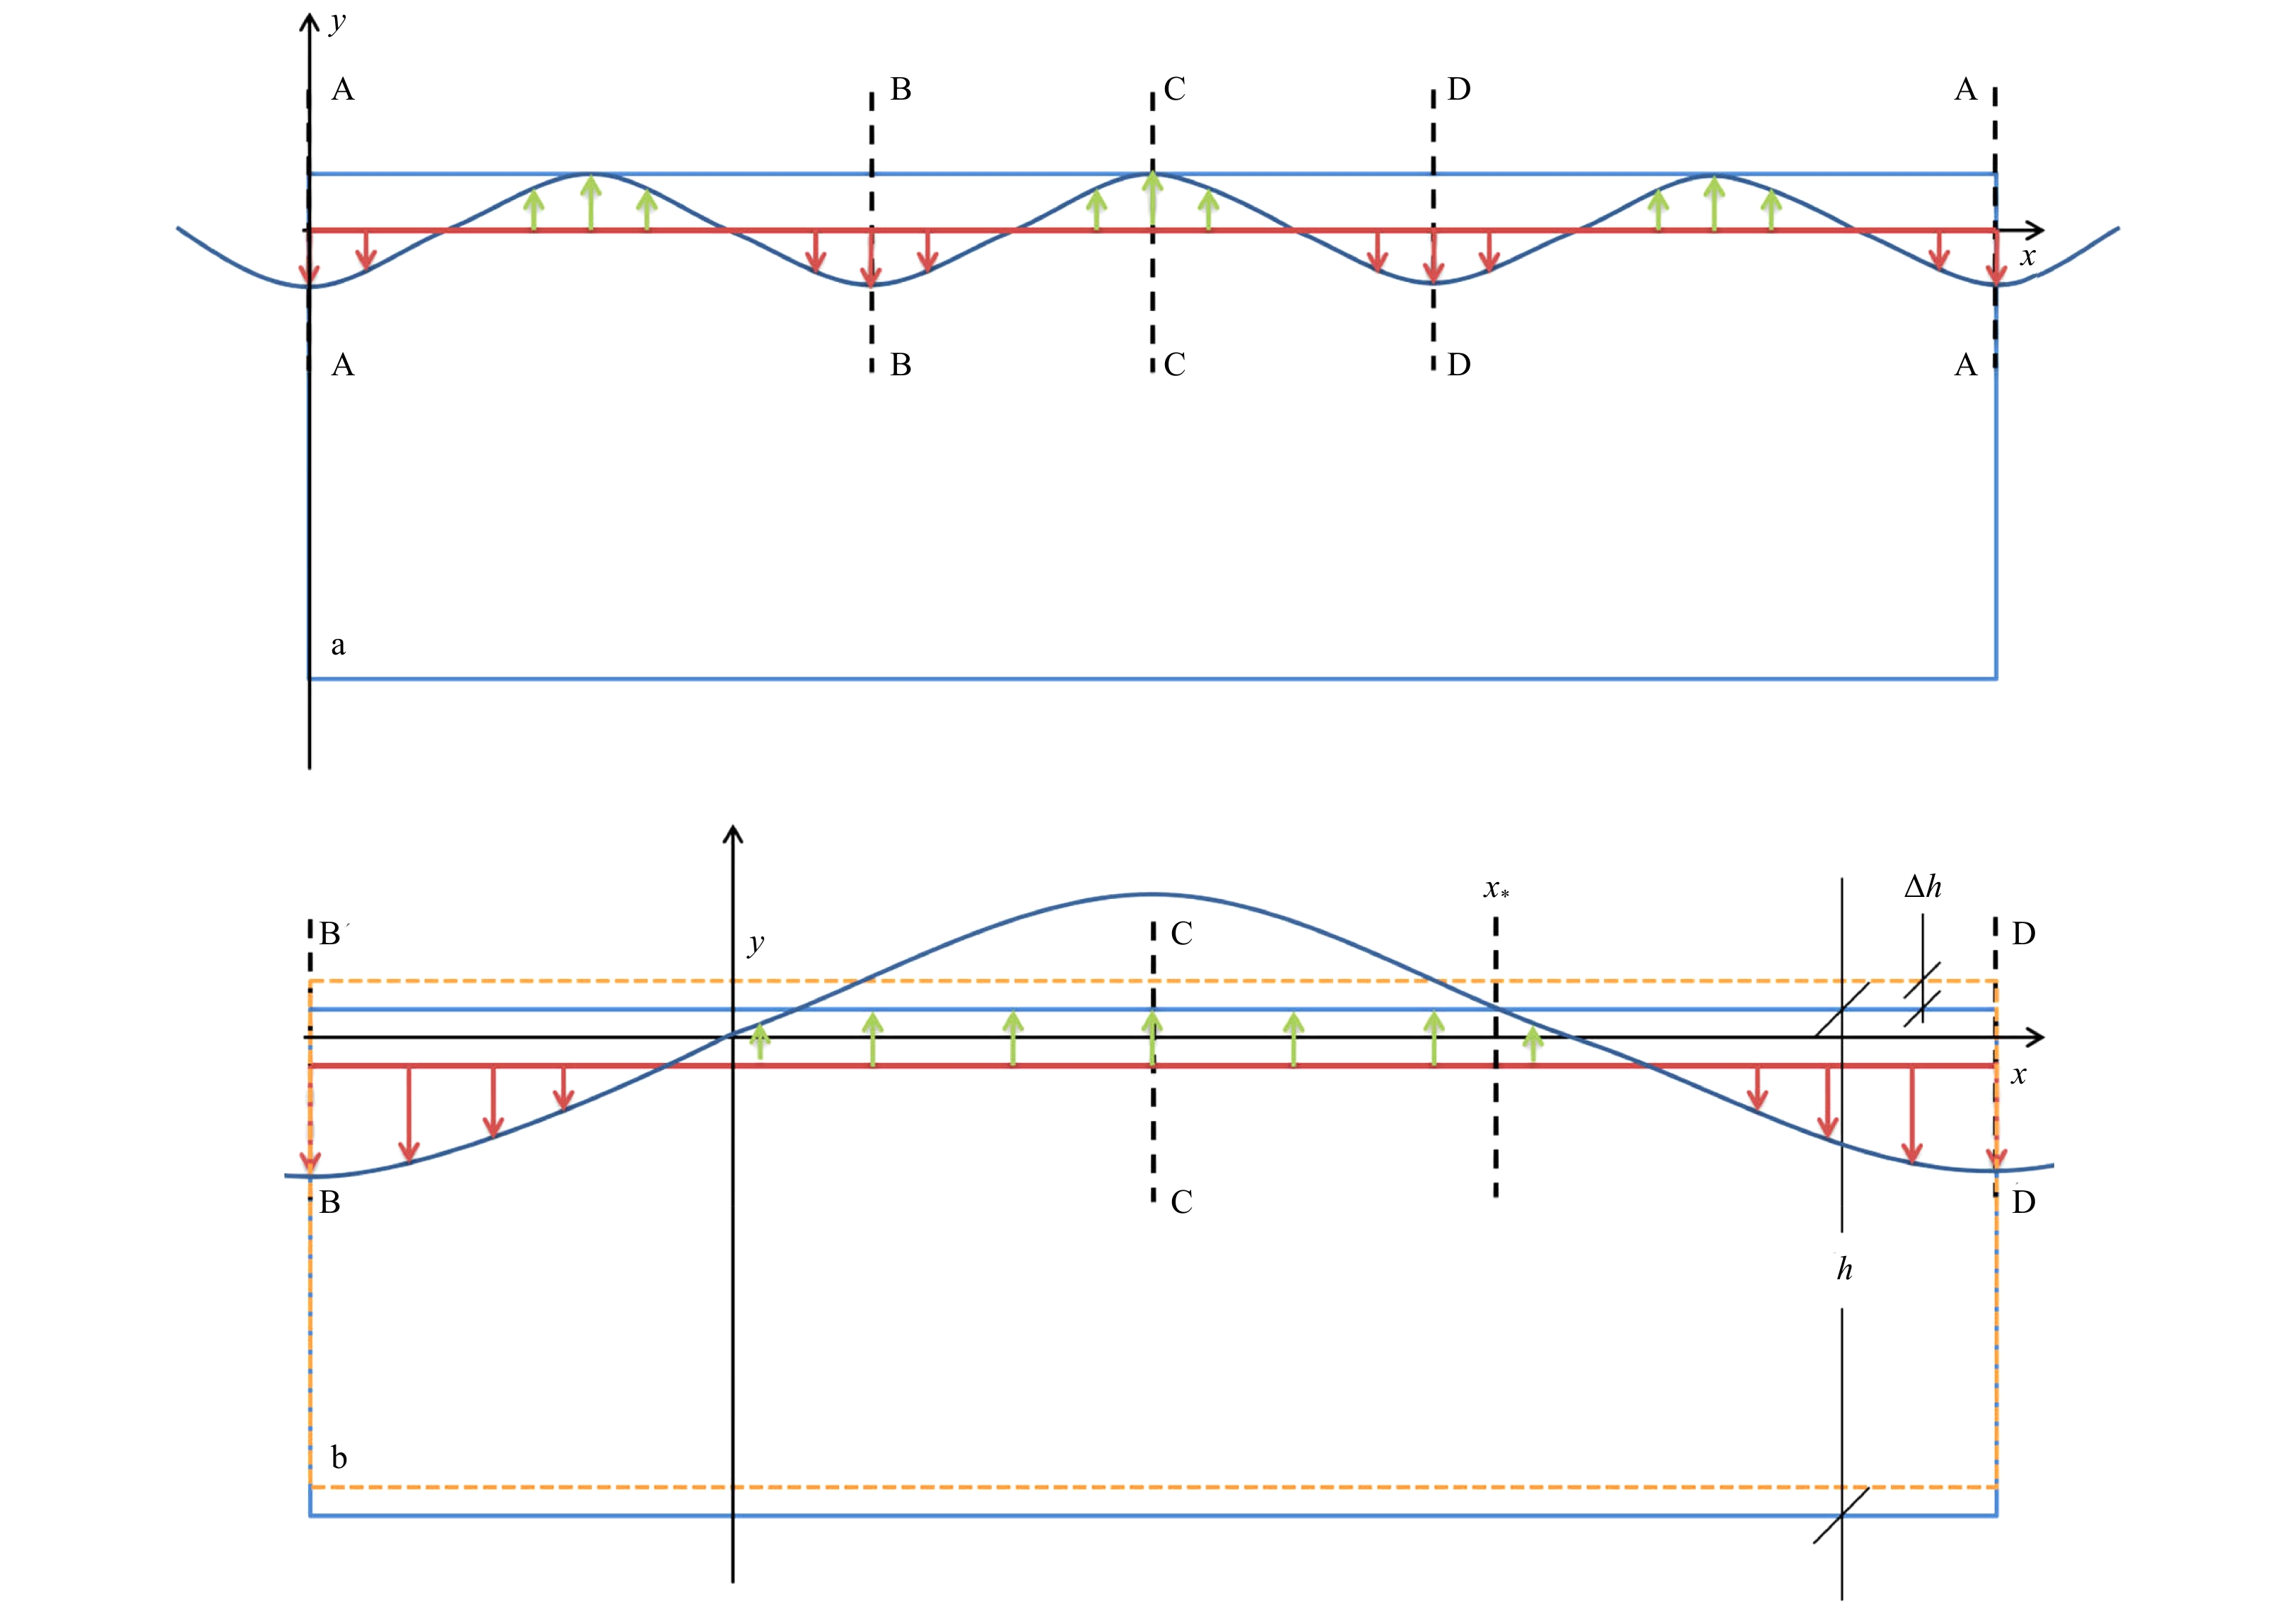
Figure 1. The force analysis of an ice floe when wave traveling through. Wave crests are lower than the ice floe surface and stay stable (a), and wave crests are over the ice floe surface and ice floe sink to become stable again (b). The red lines are free surfaces. The orange imaginary rectangles are original floe position when it is still unstable. Green vectors are buoyance over free surface while red vectors are ice gravity below free surface.
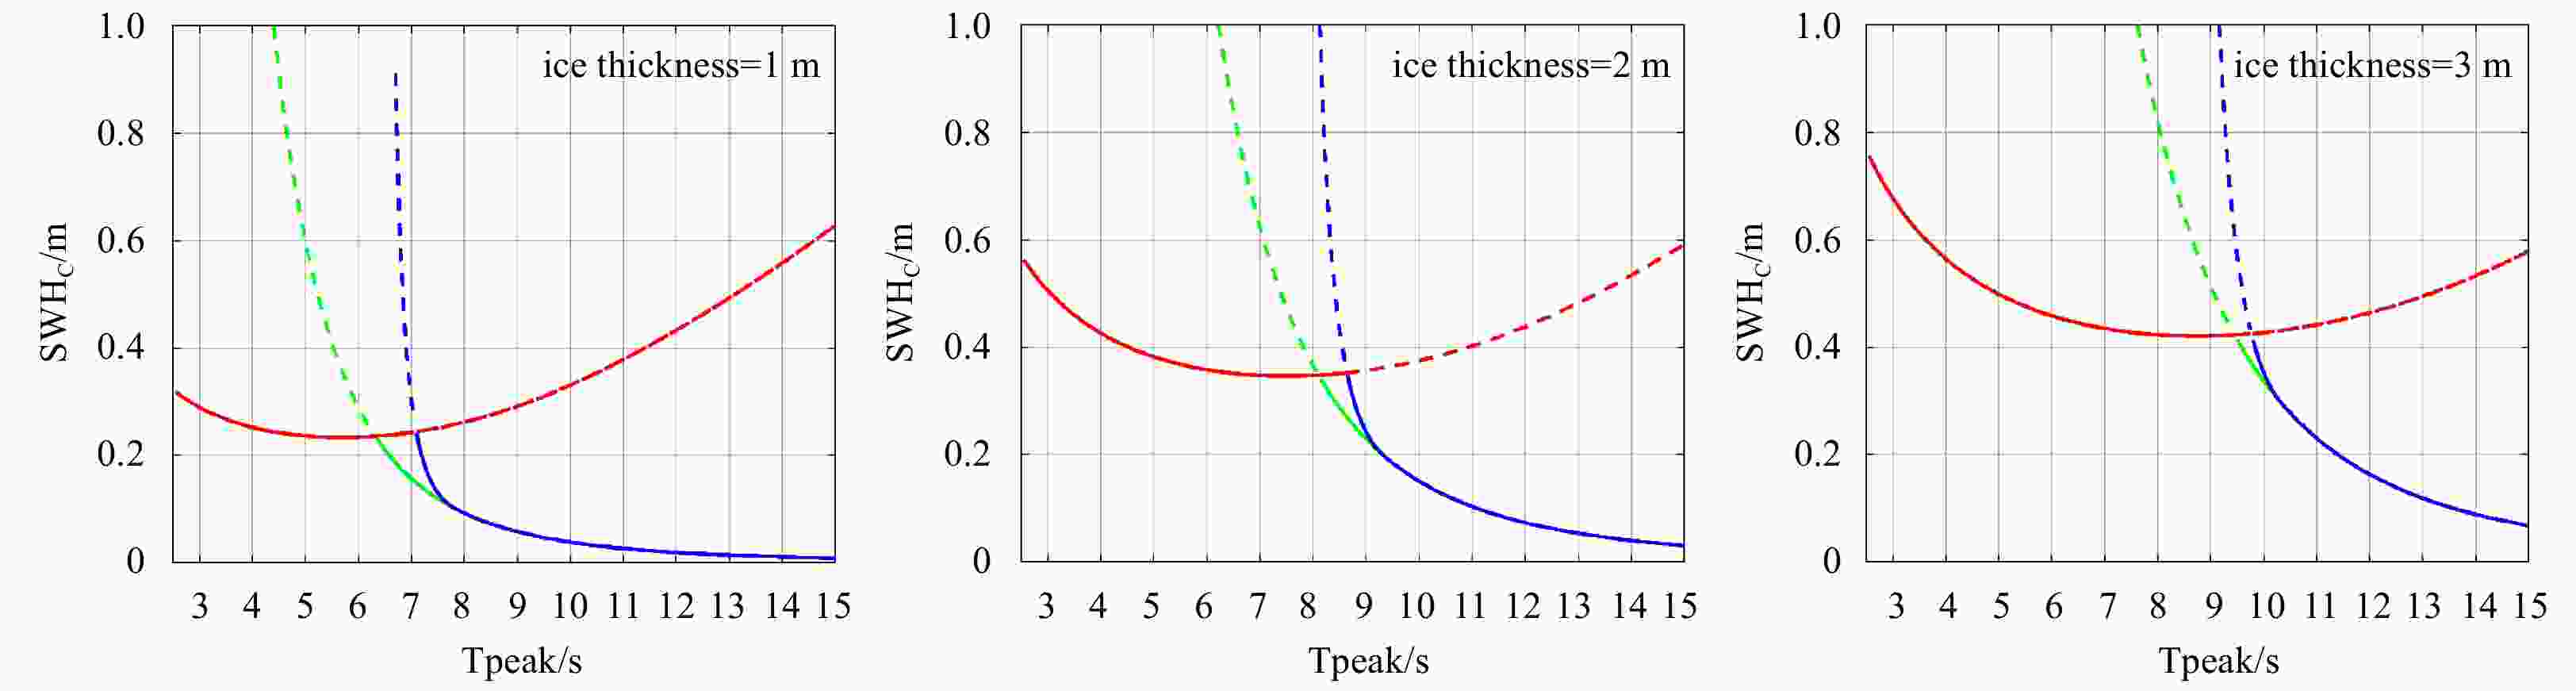
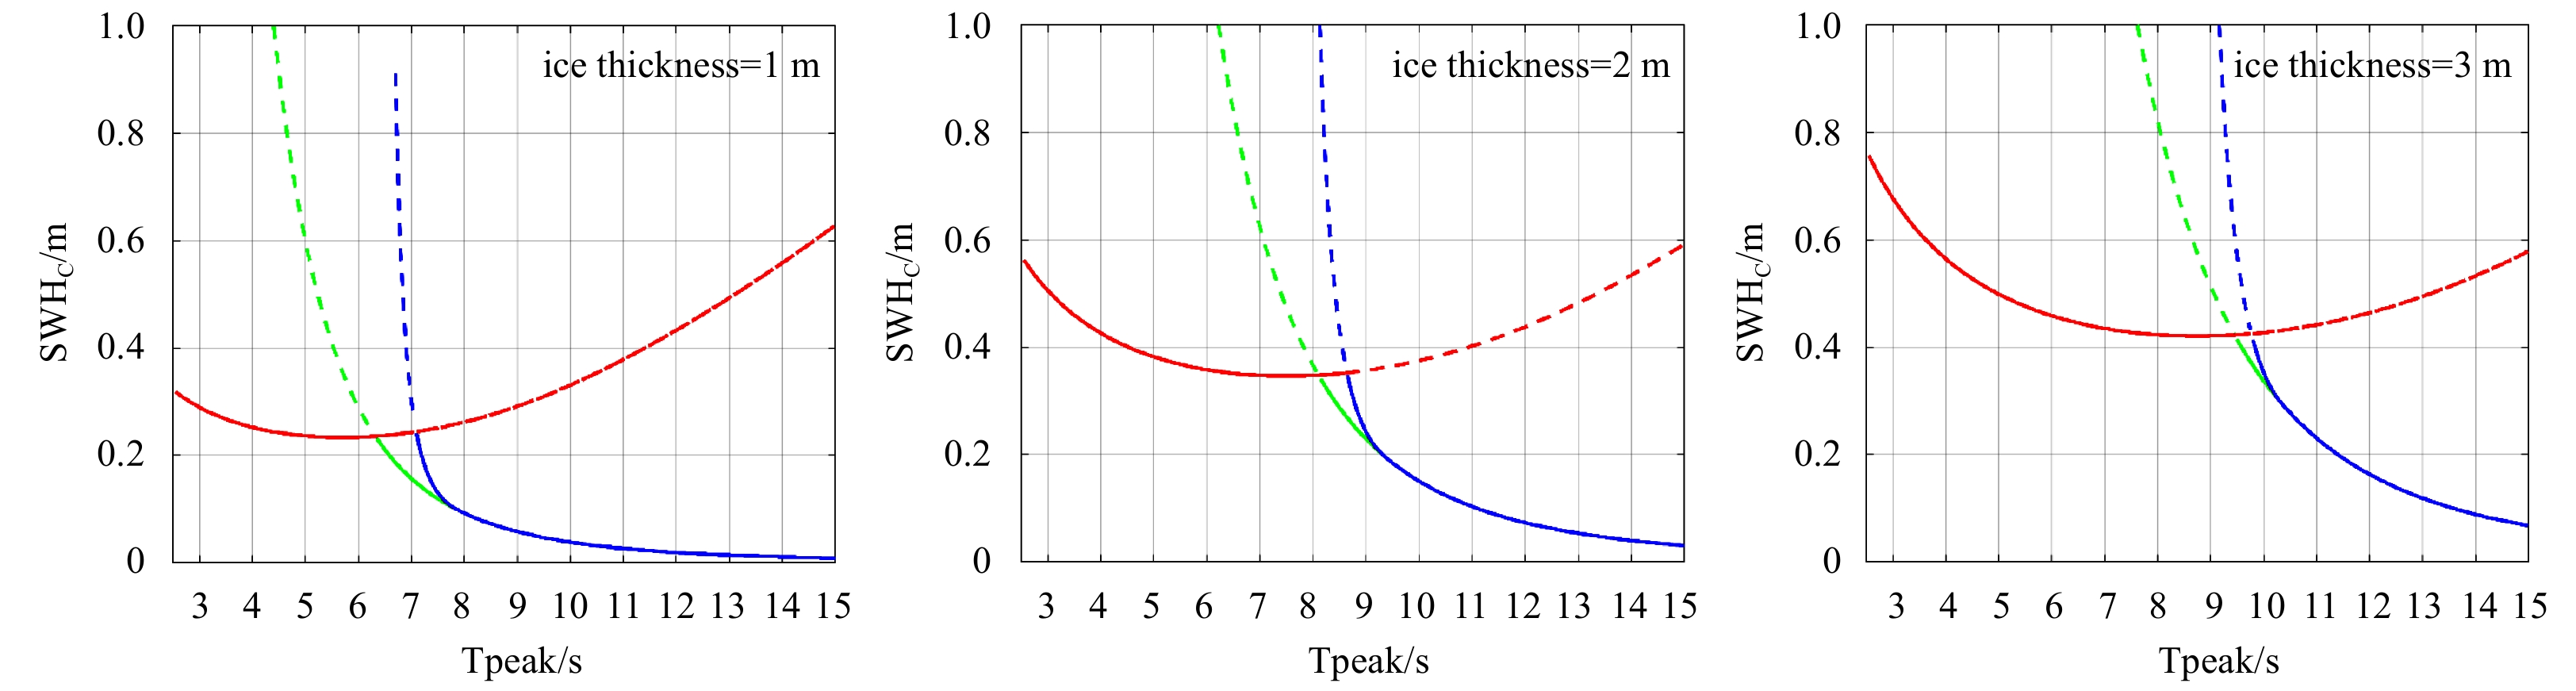
Figure 2. Changes of the critical significant wave height (SWHc) versus peak period (Tpeak) when ice thickness is 1 m (a), 2 m (b), and 3 m (c). The red, green and blue lines refer to the critical SWH calculated from the critical strain,
${M_{\rm{C}} ^{{\rm{B}} - {\rm{D}}}}_1$ induced critical stress and critical stress calculated from the combination of${M_{{\rm{C}} }^{{\rm{B}} - {\rm{D}}}}_1$ and${M_{{\rm{C}} }^{{\rm{B}} - {\rm{D}}}}_2$ . The solid lines refer to the relatively small critical wave amplitude, comparing the strain and stress yield amplitudes, while the imaginary lines are relatively large ones.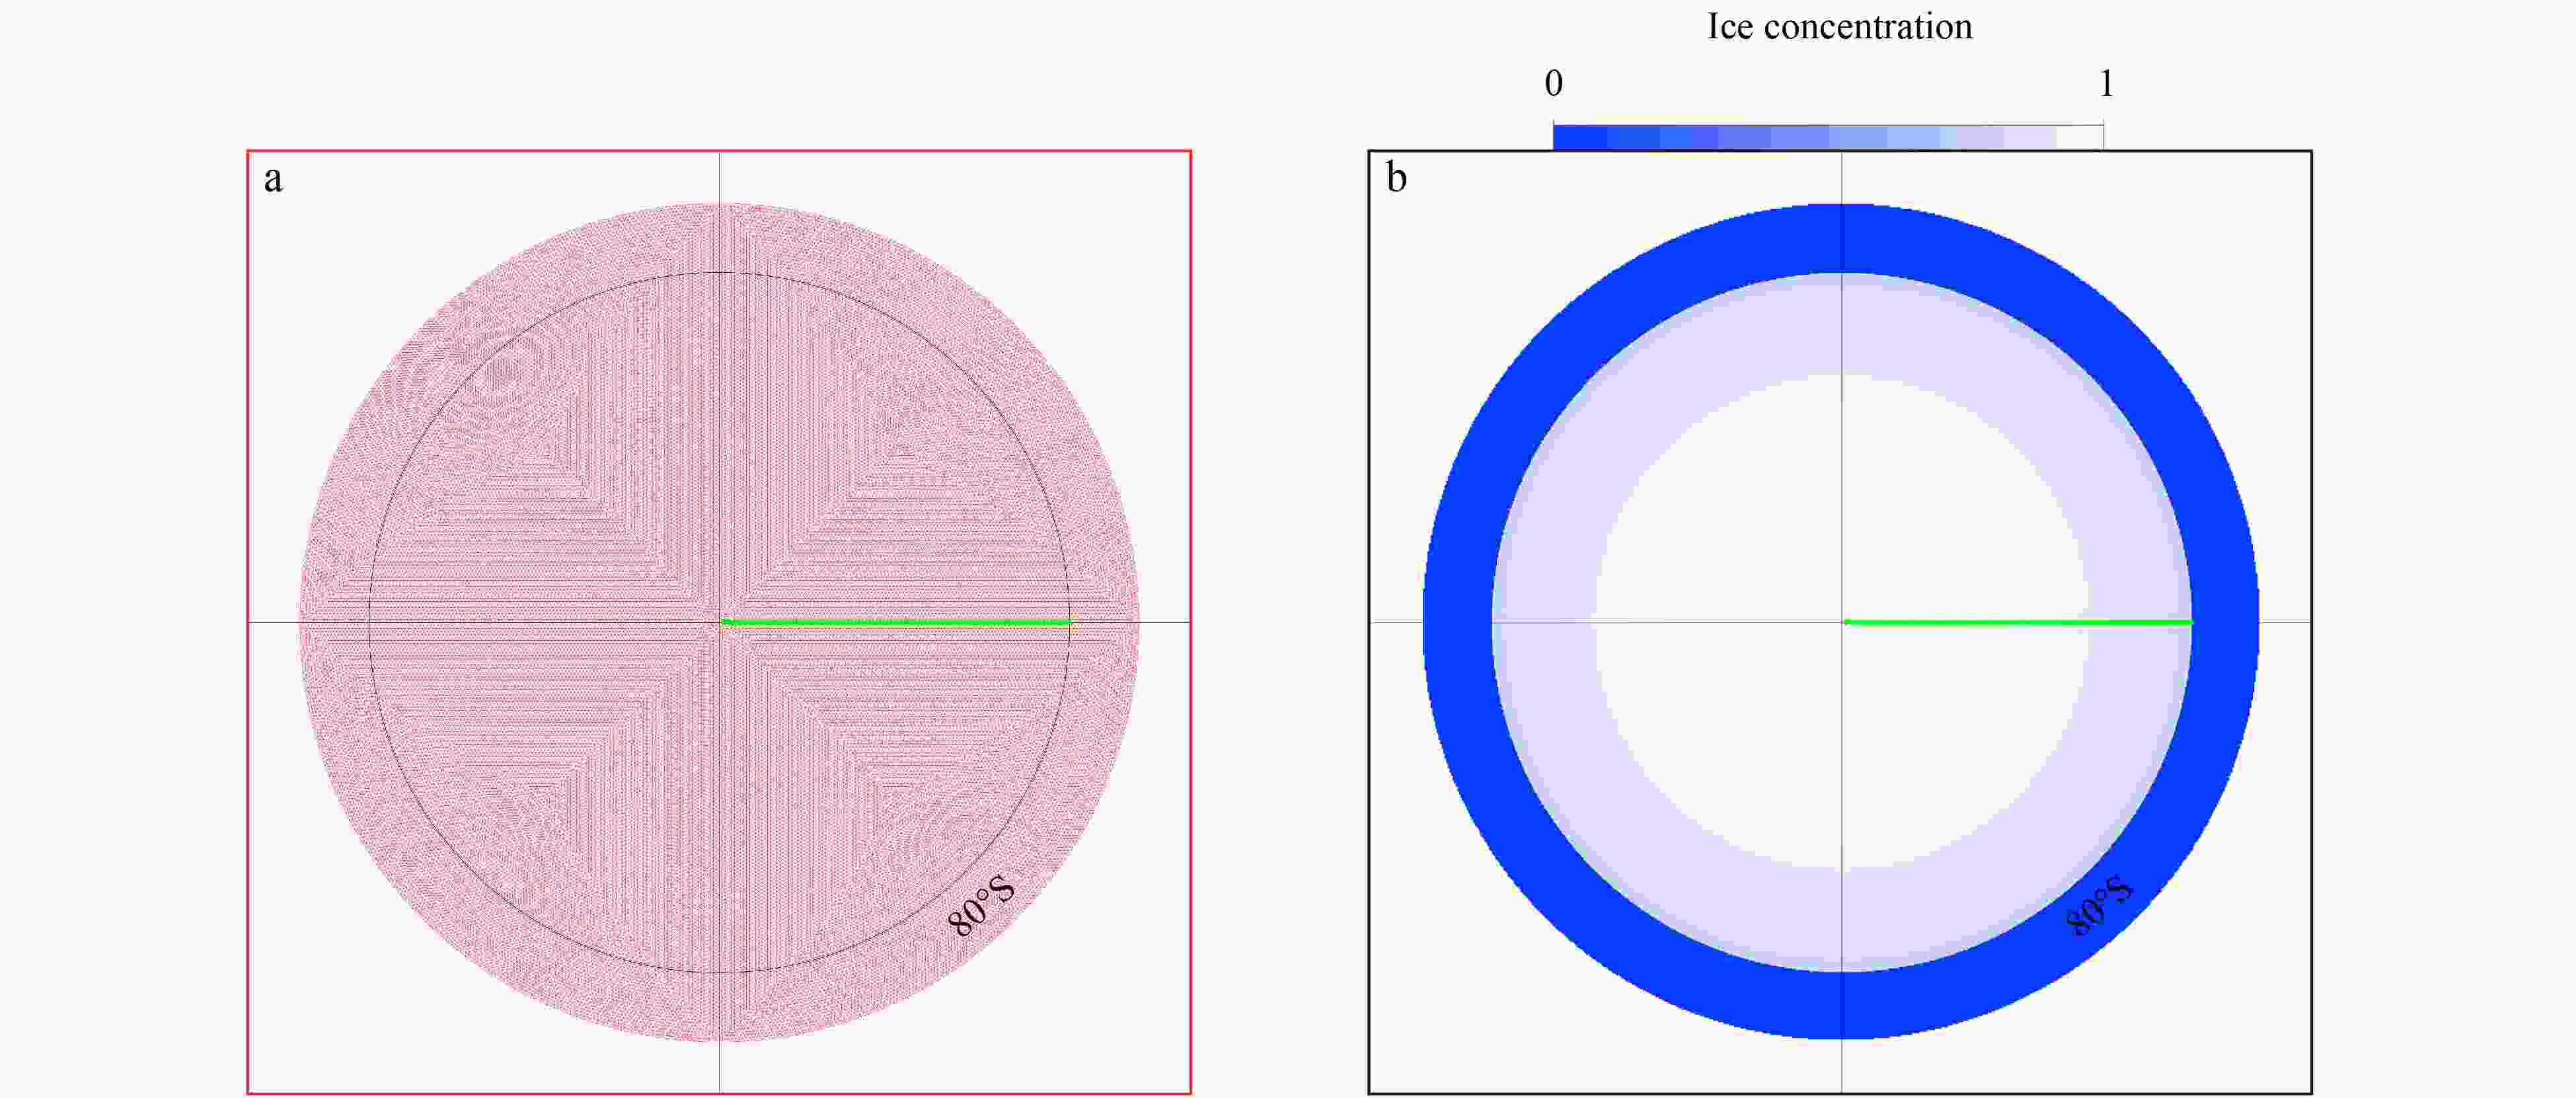
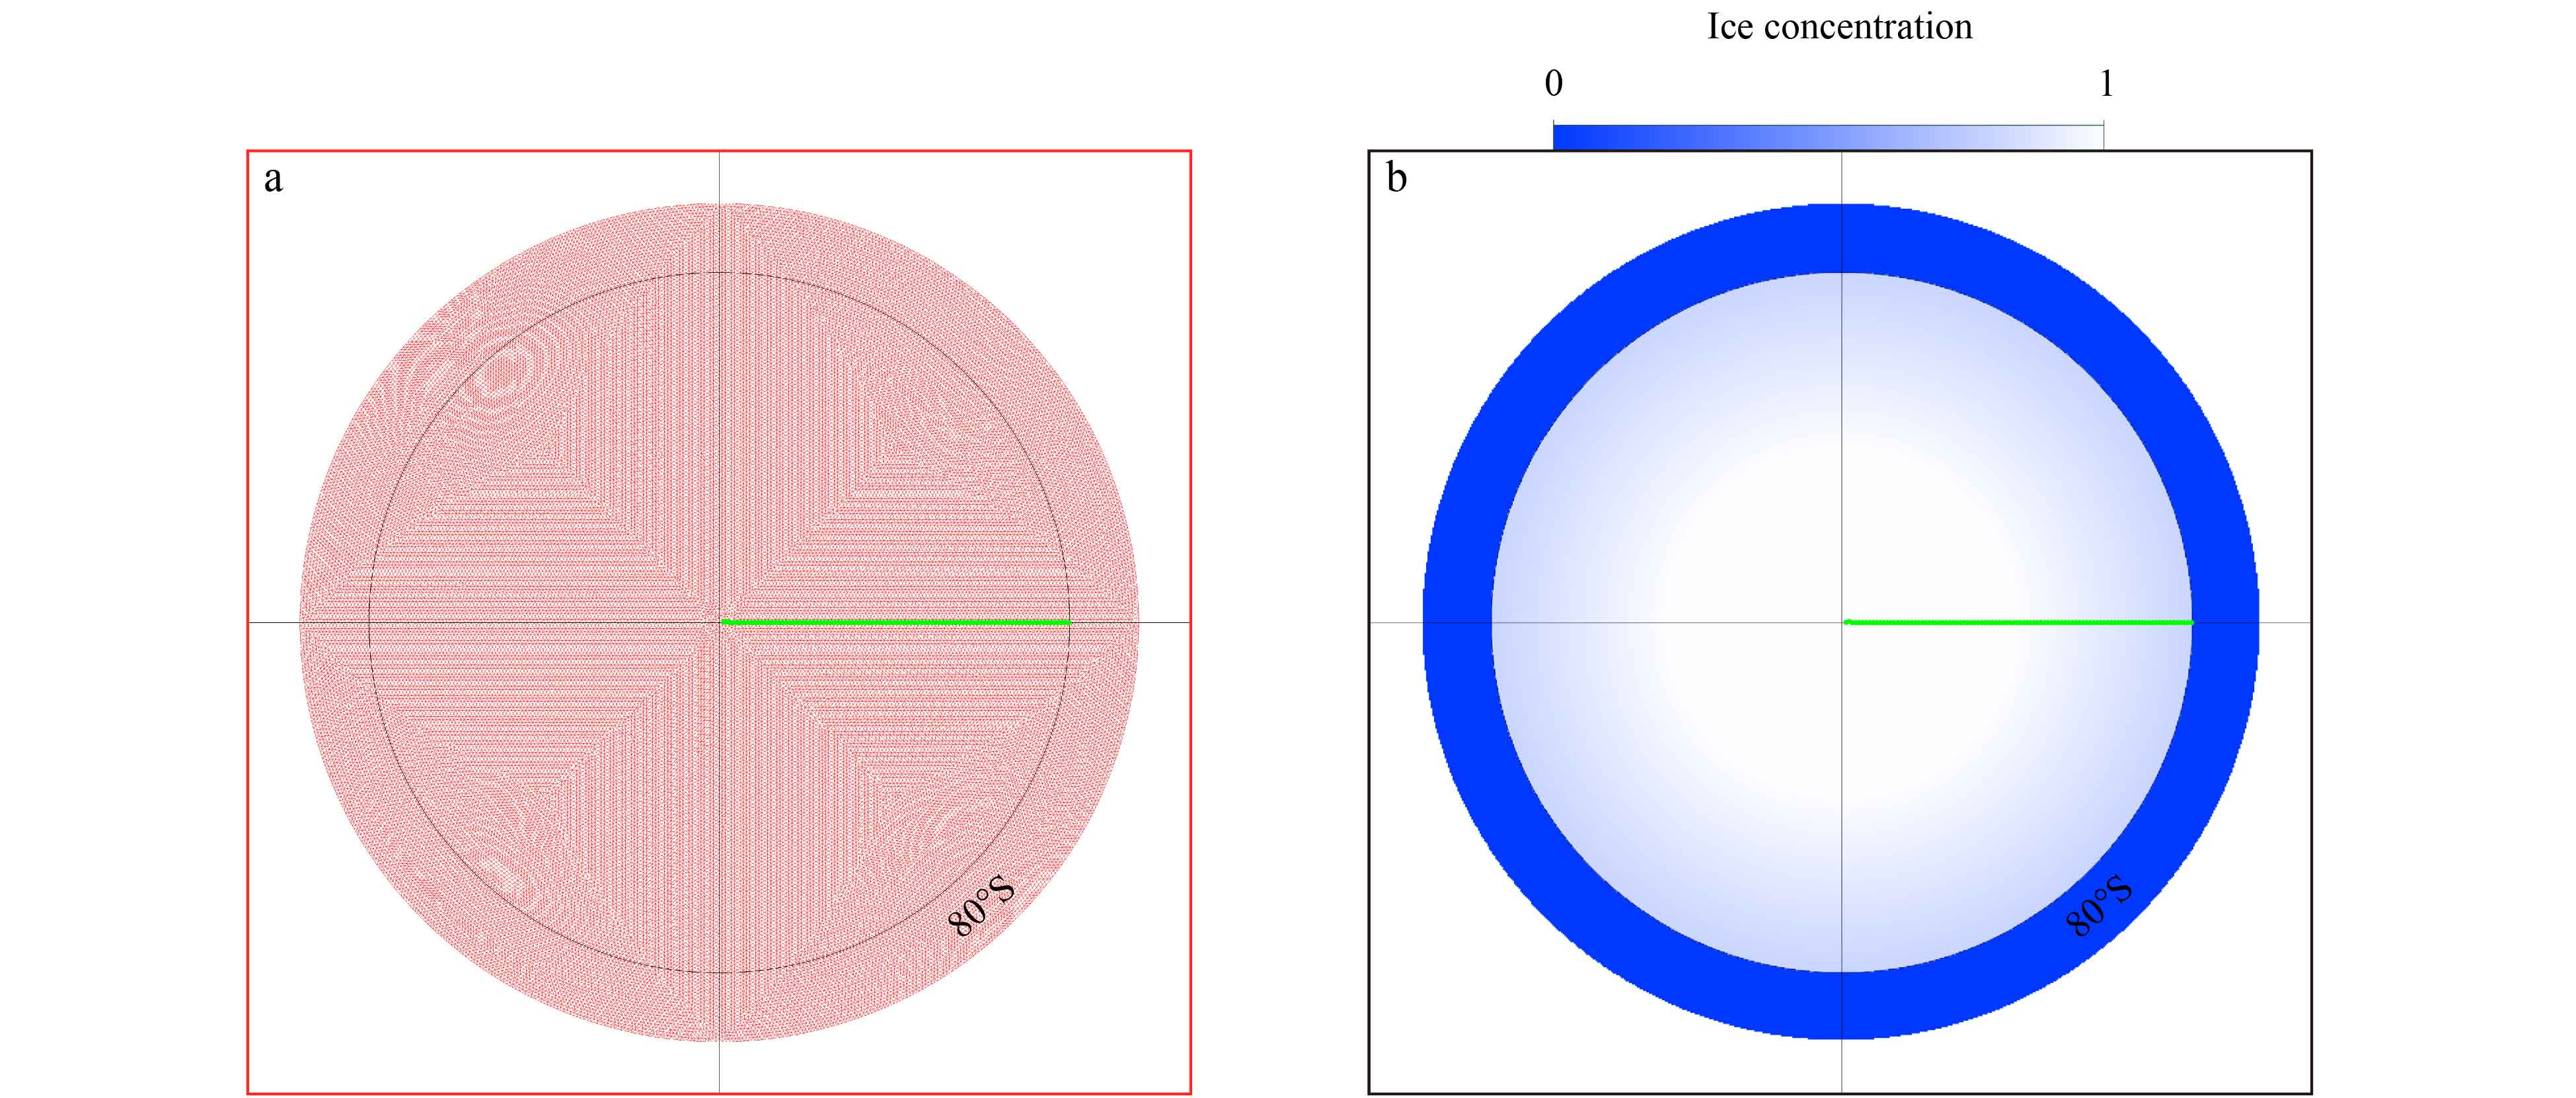
Figure 3. The horizontal mesh grid of the ideal model (a) and the ice concentration (b). The green line is the transect which is show in Fig. 4.
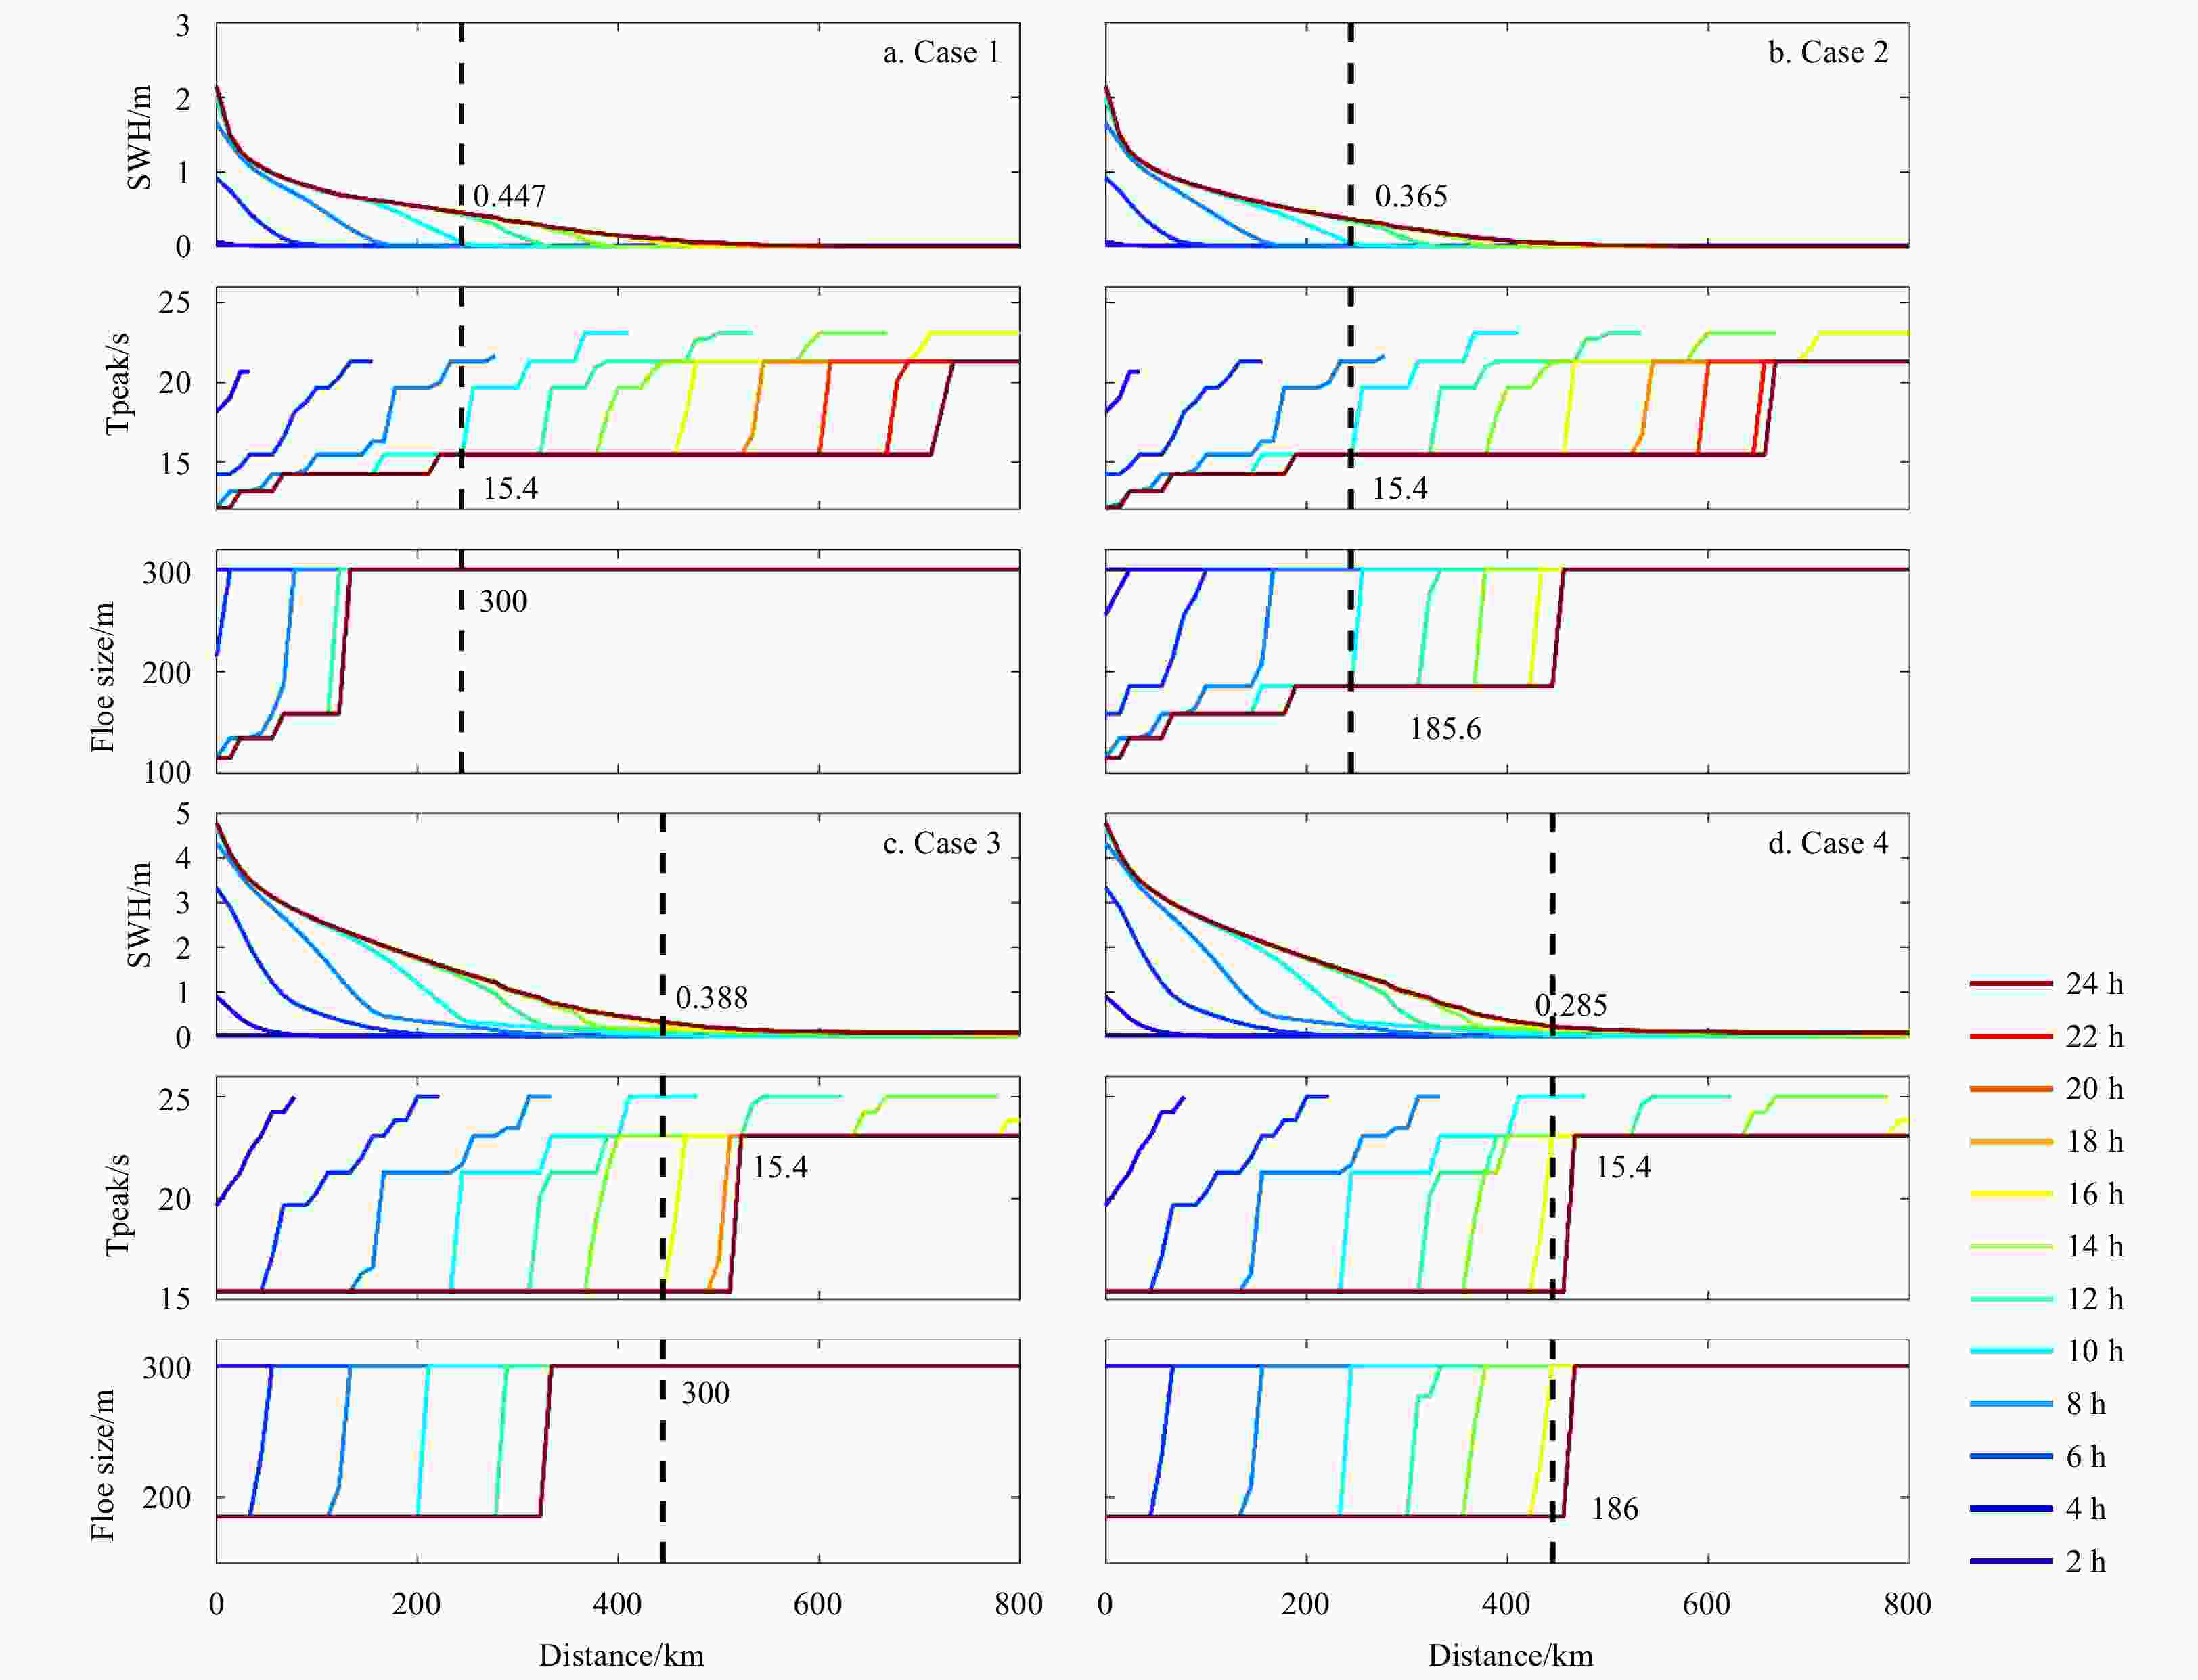
Figure 4. Changes of the significant wave height (SWH), peak period (Tpeak) and floe size versus the distance from the ice edge, for Case 1 to Case 4. Different colors, from blue to red, refer to different times, with the time intervals of each adjacent line being 2 h. The numbers are the value at the black dashed line of the final situation.
Table 1. An overview of the two ice floe breakup events, showing the time the events occur, the distances from the ice edge (D), the estimated observed SWH (
$ {\mathrm{S}\mathrm{W}\mathrm{H}}_{\mathrm{o}} $ ), Tpeak ($ {\mathrm{T}\mathrm{p}\mathrm{e}\mathrm{a}\mathrm{k}}_{\mathrm{o}} $ ), the simulated SWH ($ {\mathrm{S}\mathrm{W}\mathrm{H}}_{\rm{s}} $ ), and Tpeak ($ {\mathrm{T}\mathrm{p}\mathrm{e}\mathrm{a}\mathrm{k}}_{\rm{s}} $ )Time D/km $ {\mathrm{S}\mathrm{W}\mathrm{H}}_{\rm{o}} $/m $ {\mathrm{S}\mathrm{W}\mathrm{H}}_{\rm{s}} $/m $ {\mathrm{T}\mathrm{p}\mathrm{e}\mathrm{a}\mathrm{k}}_{\rm{o}} $/s $ {\mathrm{T}\mathrm{p}\mathrm{e}\mathrm{a}\mathrm{k}}_{\rm{s}} $/s Event A 09:00 Sept. 25, 2012 244 0.5 0.37 15 15.4 Event B 13:00 Oct. 1, 2012 455 0.1 0.29 15 15.4  下载: 导出CSV
Table 2. Model setting for four cases
Open boundary Wave-induced ice yield scheme SWH/m Tpeak/s Strain model Stress model Case 1 2.2 12 √ Case 2 2.2 12 √ √ Case 3 5 15 √ Case 4 5 15 √ √
下载: 导出CSV
-
[1] Asplin M G, Galley R, Barber D G, et al. 2012. Fracture of summer perennial sea ice by ocean swell as a result of Arctic storms. Journal of Geophysical Research: Oceans, 117(C6): C06025 [2] Bai Peng, Wang Jia, Chu P, et al. 2020. Modeling the ice-attenuated waves in the Great Lakes. Ocean Dynamics, 70(7): 991–1003. doi: 10.1007/s10236-020-01379-z [3] Cavalieri D J, Parkinson C L, Vinnikov K Y. 2003. 30-Year satellite record reveals contrasting Arctic and Antarctic decadal sea ice variability. Geophysical Research Letters, 30(18): 1970 [4] Chen Changsheng, Beardsley R C, Cowles G. 2006. An unstructured grid, finite-volume coastal ocean model (FVCOM) system. Oceanography, 19(1): 78–89. doi: 10.5670/oceanog.2006.92 [5] Chen C, Beardsley R C, Cowles G, et al. 2013. An unstructured-grid, finite-volume community ocean model FVCOM user manual. SMAST-UMASSD Technical Report-13-0701, Dartmouth: University of Massachusetts-Dartmouth, 404 [6] Chen Changsheng, Liu Hedong, Beardsley R C. 2003. An unstructured grid, finite-volume, three-dimensional, primitive equations ocean model: application to coastal ocean and estuaries. Journal of Atmospheric and Oceanic Technology, 20(1): 159–186. doi: 10.1175/1520-0426(2003)020<0159:AUGFVT>2.0.CO;2 [7] Dean C H. 1966. The attenuation of ocean waves near the open ocean/pack ice boundary. In: Proceedings of the Symposium on Antarctic Oceanography. Santiago, Chile: Scientific Committee on Antarctic Research, 13–16 [8] Doble M J, Bidlot J R. 2013. Wave buoy measurements at the Antarctic sea ice edge compared with an enhanced ECMWF WAM: progress towards global waves-in-ice modelling. Ocean Modelling, 70: 166–173. doi: 10.1016/j.ocemod.2013.05.012 [9] Dumont D, Kohout A, Bertino L. 2011. A wave-based model for the marginal ice zone including a floe breaking parameterization. Journal of Geophysical Research: Oceans, 116(C4): C04001 [10] Fujisaki-Manome A, Anderson E J, Kessler J A, et al. 2020. Simulating impacts of precipitation on ice cover and surface water temperature across large lakes. Journal of Geophysical Research: Oceans, 125(5): e2019JC015950. doi: 10.1029/2019JC015950 [11] Gao Guoping, Chen Changsheng, Qi Jianhua, et al. 2011. An unstructured-grid, finite-volume sea ice model: development, validation, and application. Journal of Geophysical Research: Oceans, 116(C8): C00D04 [12] Ivanov V, Alexeev V, Koldunov N V, et al. 2016. Arctic ocean heat impact on regional ice decay: a suggested positive feedback. Journal of Physical Oceanography, 46(5): 1437–1456. doi: 10.1175/JPO-D-15-0144.1 [13] Josberger E G, Martin S. 1981. A laboratory and theoretical study of the boundary layer adjacent to a vertical melting ice wall in salt water. Journal of Fluid Mechanics, 111: 439–473. doi: 10.1017/S0022112081002450 [14] Kohout A L, Meylan M H. 2008. An elastic plate model for wave attenuation and ice floe breaking in the marginal ice zone. Journal of Geophysical Research: Oceans, 113(C9): C09016. doi: 10.1029/2007JC004434 [15] Kohout A L, Williams M J M, Dean S M, et al. 2014. Storm-induced sea-ice breakup and the implications for ice extent. Nature, 509(7502): 604–607. doi: 10.1038/nature13262 [16] Kohout A L, Williams M J M, Toyota T, et al. 2015. In situ observations of wave-induced sea ice breakup. Deep-Sea Research Part II: Topical Studies in Oceanography, 131: 22–27. doi: 10.1016/j.dsr2.2015.06.010 [17] Kwok R, Cunningham G F, Wensnahan M, et al. 2009. Thinning and volume loss of the Arctic Ocean sea ice cover: 2003–2008. Journal of Geophysical Research: Oceans, 114(C7): C07005. doi: 10.1029/2009JC005312 [18] Liu A K, Holt B, Vachon P W. 1991. Wave propagation in the marginal ice zone: model predictions and comparisons with buoy and synthetic aperture radar data. Journal of Geophysical Research: Oceans, 96(C3): 4605–4621. doi: 10.1029/90JC02267 [19] Maykut G A, Perovich D K. 1987. The role of shortwave radiation in the summer decay of a sea ice cover. Journal of Geophysical Research: Oceans, 92(C7): 7032–7044. doi: 10.1029/JC092iC07p07032 [20] Meier W, Stroeve J, Fetterer F, et al. 2005. Reductions in Arctic sea ice cover no longer limited to summer. Eos, Transactions American Geophysical Union, 86(36): 326 [21] Meylan M H, Bennetts L G, Cavaliere C, et al. 2015. Experimental and theoretical models of wave-induced flexure of a sea ice floe. Physics of Fluids, 27(4): 041704. doi: 10.1063/1.4916573 [22] Qi Jianhua, Chen Changsheng, Beardsley R C, et al. 2009. An unstructured-grid finite-volume surface wave model (FVCOM-SWAVE): implementation, validations and applications. Ocean Modelling, 28(1–3): 153–166. doi: 10.1016/j.ocemod.2009.01.007 [23] Robin G D Q. 1963. Wave propagation through fields of pack ice. Philosophical Transactions of the Royal Society A: Mathematical, Physical and Engineering Sciences, 255(1057): 313–339 [24] Schwarz J, Frederking R, Gavrillo V, et al. 1981. Standardized testing methods for measuring mechanical properties of ice. Cold Regions Science and Technology, 4(3): 245–253. doi: 10.1016/0165-232X(81)90007-0 [25] Squire V A. 2020. Ocean wave interactions with sea ice: a reappraisal. Annual Review of Fluid Mechanics, 52: 37–60. doi: 10.1146/annurev-fluid-010719-060301 [26] Squire V A, Meylan M. 1994. Changes to ocean wave spectra in a marginal ice zone 2. Osaka, Japan: The International Society of Offshore and Polar Engineers [27] Squire V A. 2007. Of ocean waves and sea–ice revisited. Cold Regions Science and Technology, 49: 110–133. doi: 10.1016/j.coldregions.2007.04.007 [28] Squire V A, Vaughan G L, Bennetts L G. 2009. Ocean surface wave evolvement in the Arctic Basin. Geophysical Research Letters, 36(22): L22502. doi: 10.1029/2009GL040676 [29] Squire V A. 2020. Ocean wave interactions with sea ice: a reappraisal. Annual Review of Fluid Mechanics, 52(1): 37–60 [30] Steele M. 1992. Sea ice melting and floe geometry in a simple ice-ocean model. Journal of Geophysical Research: Oceans, 97(C11): 17729–17738. doi: 10.1029/92JC01755 [31] Stroeve J, Holland M M, Meier W, et al. 2007. Arctic sea ice decline: faster than forecast. Geophysical Research Letters, 34(9): L09501 [32] Wadhams P, Squire V A, Goodman D J, et al. 1988. The attenuation rates of ocean waves in the marginal ice zone. Journal of Geophysical Research: Oceans, 93(C6): 6799–6818. doi: 10.1029/JC093iC06p06799 [33] Williams T D, Bennetts L G, Squire V A, et al. 2013a. Wave-ice interactions in the marginal ice zone. Part 1: theoretical foundations. Ocean Modelling, 71: 81–91. doi: 10.1016/j.ocemod.2013.05.010 [34] Williams T D, Bennetts L B, Squire V A, et al. 2013b. Wave-ice interactions in the marginal ice zone. Part 2: numerical implementation and sensitivity studies along 1D transects of the ocean surface. Ocean Modelling, 71: 92–101. doi: 10.1016/j.ocemod.2013.05.011 [35] Worby A P, Steer A, Lieser J L, et al. 2011. Regional-scale sea-ice and snow thickness distributions from in situ and satellite measurements over East Antarctica during SIPEX 2007. Deep-Sea Research Part II: Topical Studies in Oceanography, 58(9–10): 1125–1136 [36] Zhang Yang, Chen Changsheng, Beardsley R C, et al. 2020. Applications of an unstructured grid surface wave model (FVCOM-SWAVE) to the Arctic Ocean: the interaction between ocean waves and sea ice. Ocean Modelling, 145: 101532. doi: 10.1016/j.ocemod.2019.101532 -


 点击查看大图
计量
- 文章访问数: 607
- HTML全文浏览量: 254
- PDF下载量: 21
- 被引次数: 0

