

Arctic sea ice concentration retrieval using the DT-ASI algorithm based on FY-3B/MWRI data
-
Abstract: Sea ice concentration (SIC) is one of the most important indicators when monitoring climate changes in the polar region. With the development of the Chinese satellite technology, the FengYun (FY) series has been applied to retrieve the sea ice parameters in the polar region. In this paper, to improve the SIC retrieval accuracy from the passive microwave (PM) data of the Microwave Radiation Imager (MWRI) aboard on the FengYun-3B (FY-3B) Satellite, the dynamic tie-point (DT) Arctic Radiation and Turbulence Interaction Study (ARTIST) Sea Ice (ASI) (DT-ASI) SIC retrieval algorithm is applied and obtained Arctic SIC data for nearly 10 a (from November 18, 2010 to August 19, 2019). Also, by applying a land spillover correction scheme, the erroneous sea ice along coastlines in melt season is removed. The results of FY-3B/DT-ASI are obviously improved compared to that of FY-3B/NT2 (NASA-Team2) in both SIC and sea ice extent (SIE), and are highly consistent with the results of similar products of AMSR2 (Advanced Microwave Scanning Radiometer 2)/ASI and AMSR2/DT-ASI. Compared with the annual average SIC of FY-3B/NT2, our result is reduced by 2.31%. The annual average SIE difference between the two FY-3Bs is 1.65×10⁶ km2, of which the DT-ASI algorithm contributes 87.9% and the land spillover method contributes 12.1%. We further select 58 MODIS (Moderate-resolution Imaging Spectroradiometer) cloud-free samples in the Arctic region and use the tie-point method to retrieve SIC to verify the accuracy of these SIC products. The root mean square difference (RMSD) and mean absolute difference (MAD) of the FY-3B/DT-ASI and MODIS results are 17.2% and 12.7%, which is close to those of two AMSR2 products with 6.25 km resolution and decreased 8% and 7.2% compared with FY-3B/NT2. Further, FY-3B/DT-ASI has the most significant improvement where the SIC is lower than 60%. A high-quality SIC product can be obtained by using the DT-ASI algorithm and our work will be beneficial to promote the application of FengYun Satellite.
-
Key words:
- DT-ASI /
- FY-3B/MWRI /
- sea ice concentration /
- MODIS
-
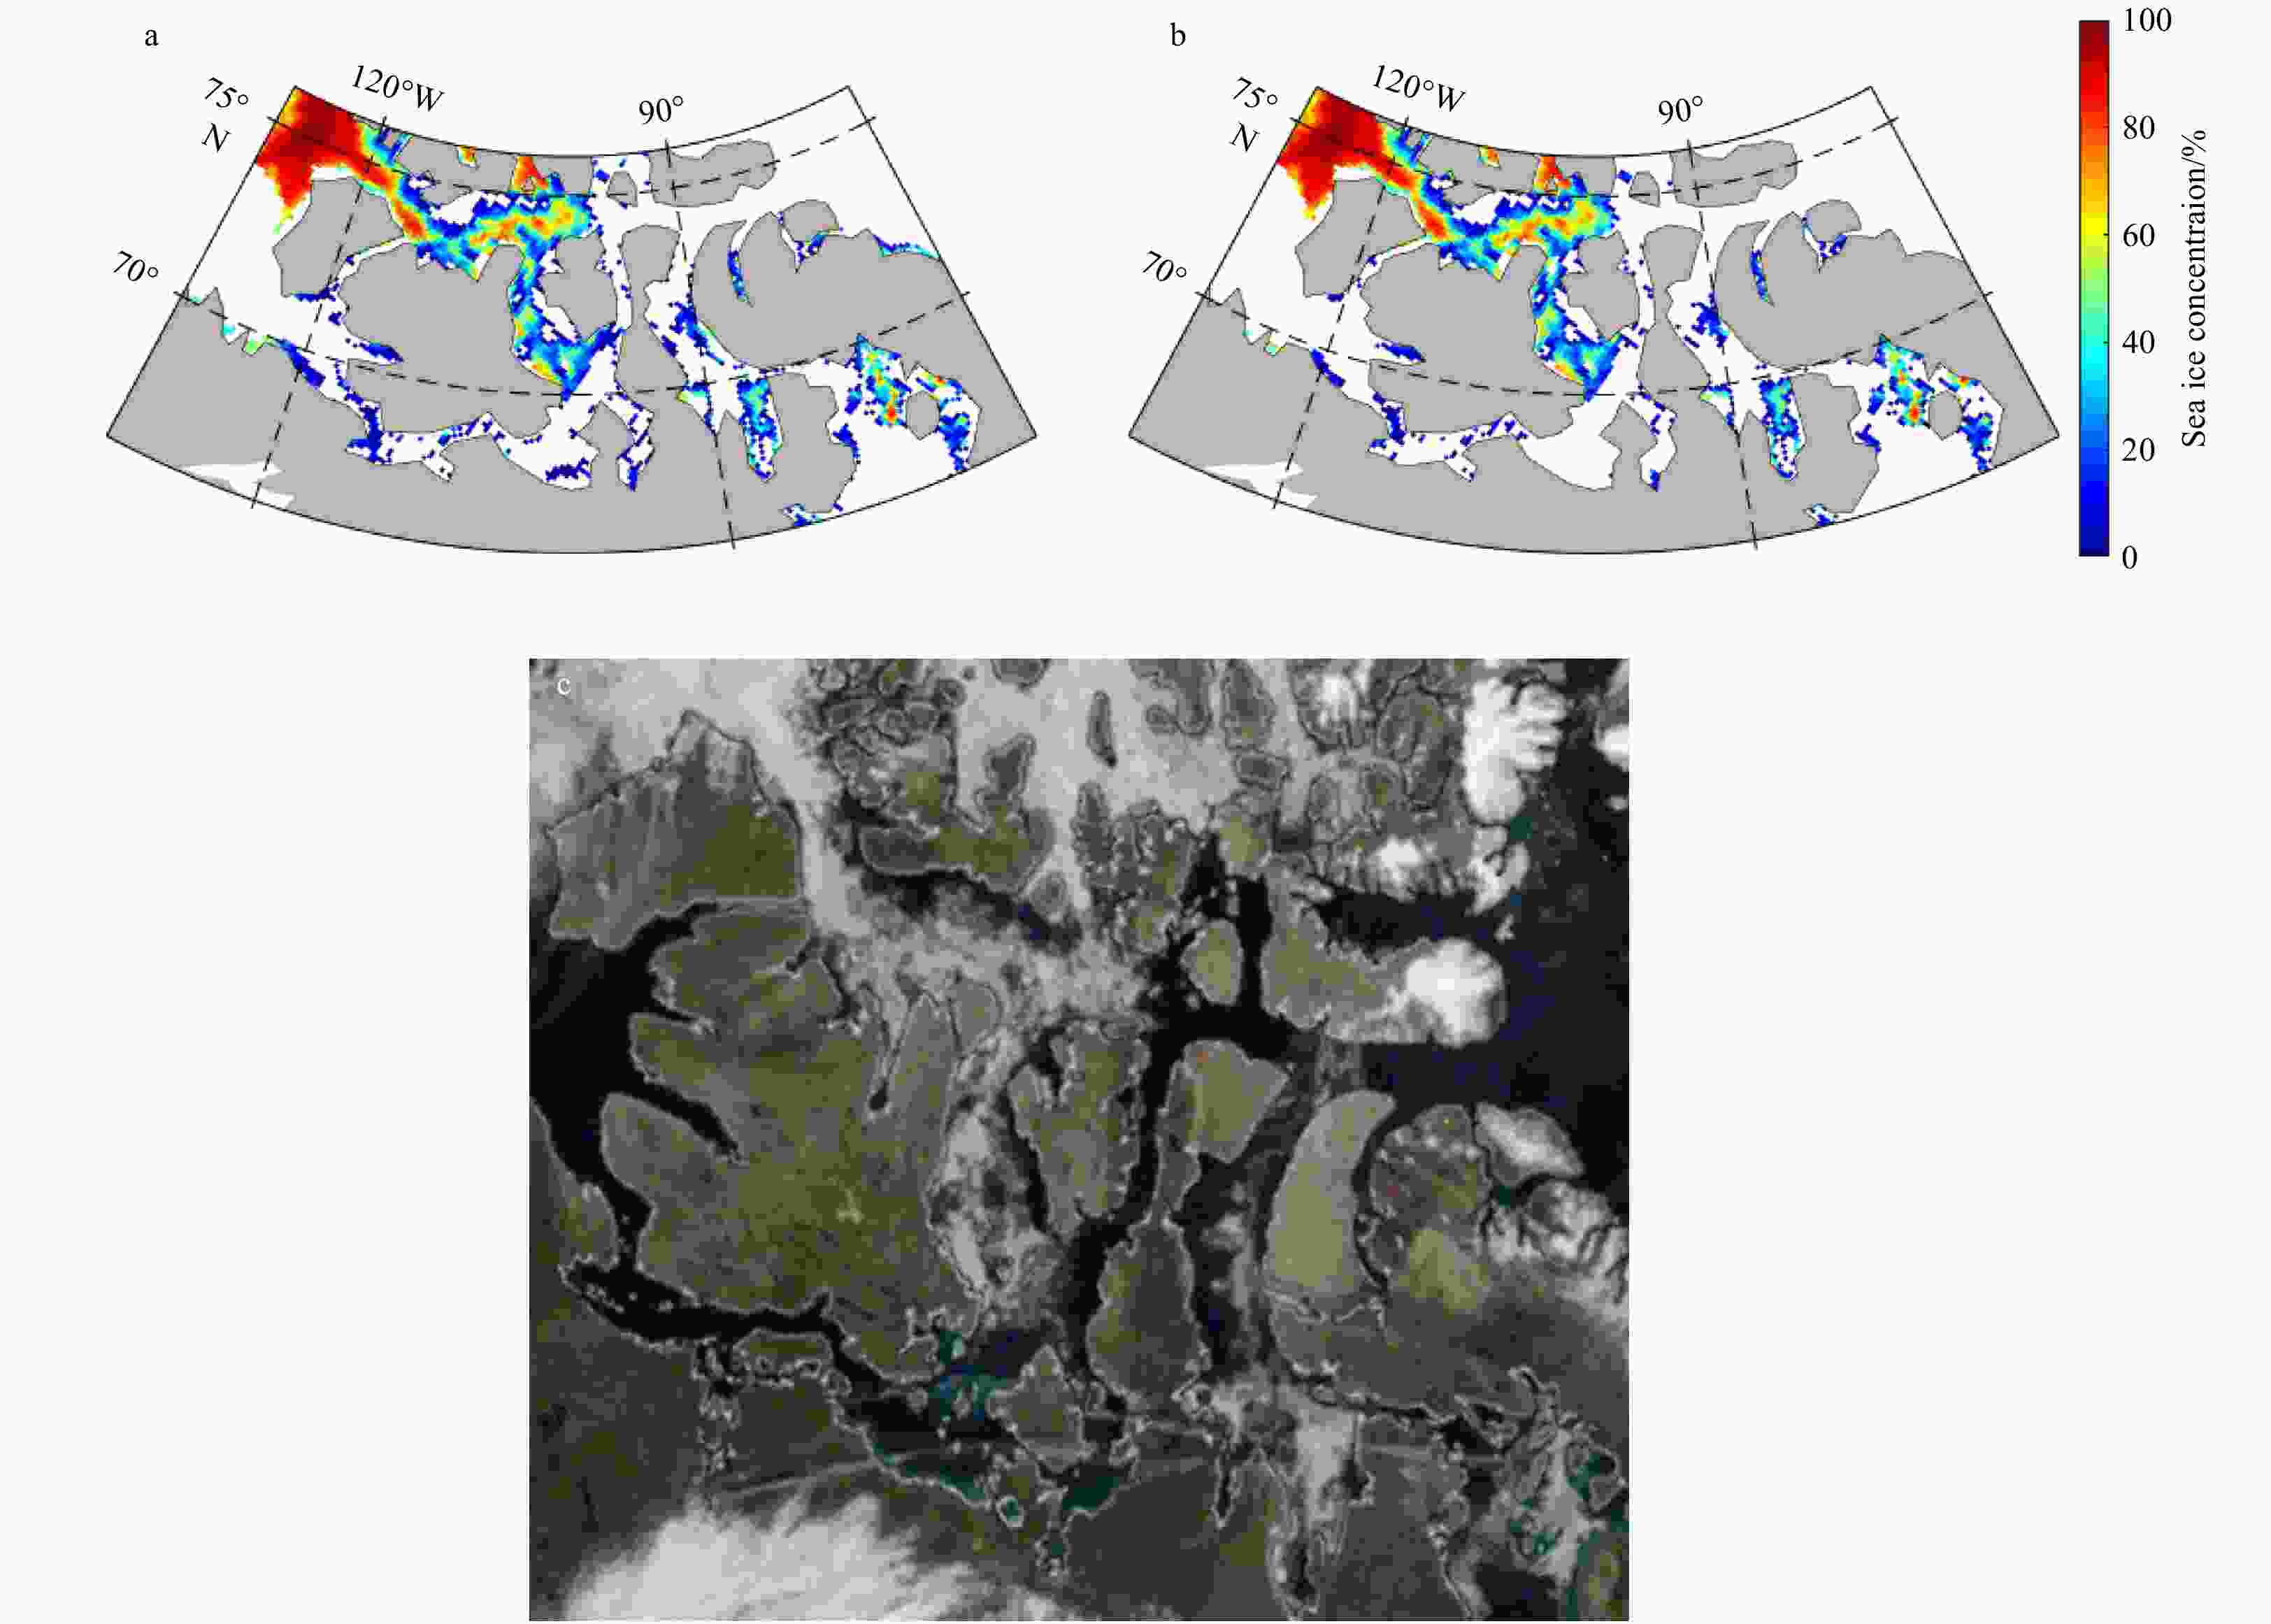
Figure 1. Sea ice concentration in the Canadian Arctic Archipelago on August 8, 2016. a. Without land spillover correction, b. with land spillover correction, and c. satellite imagery from NASA Worldview (https://worldview.earthdata.nasa.gov) .
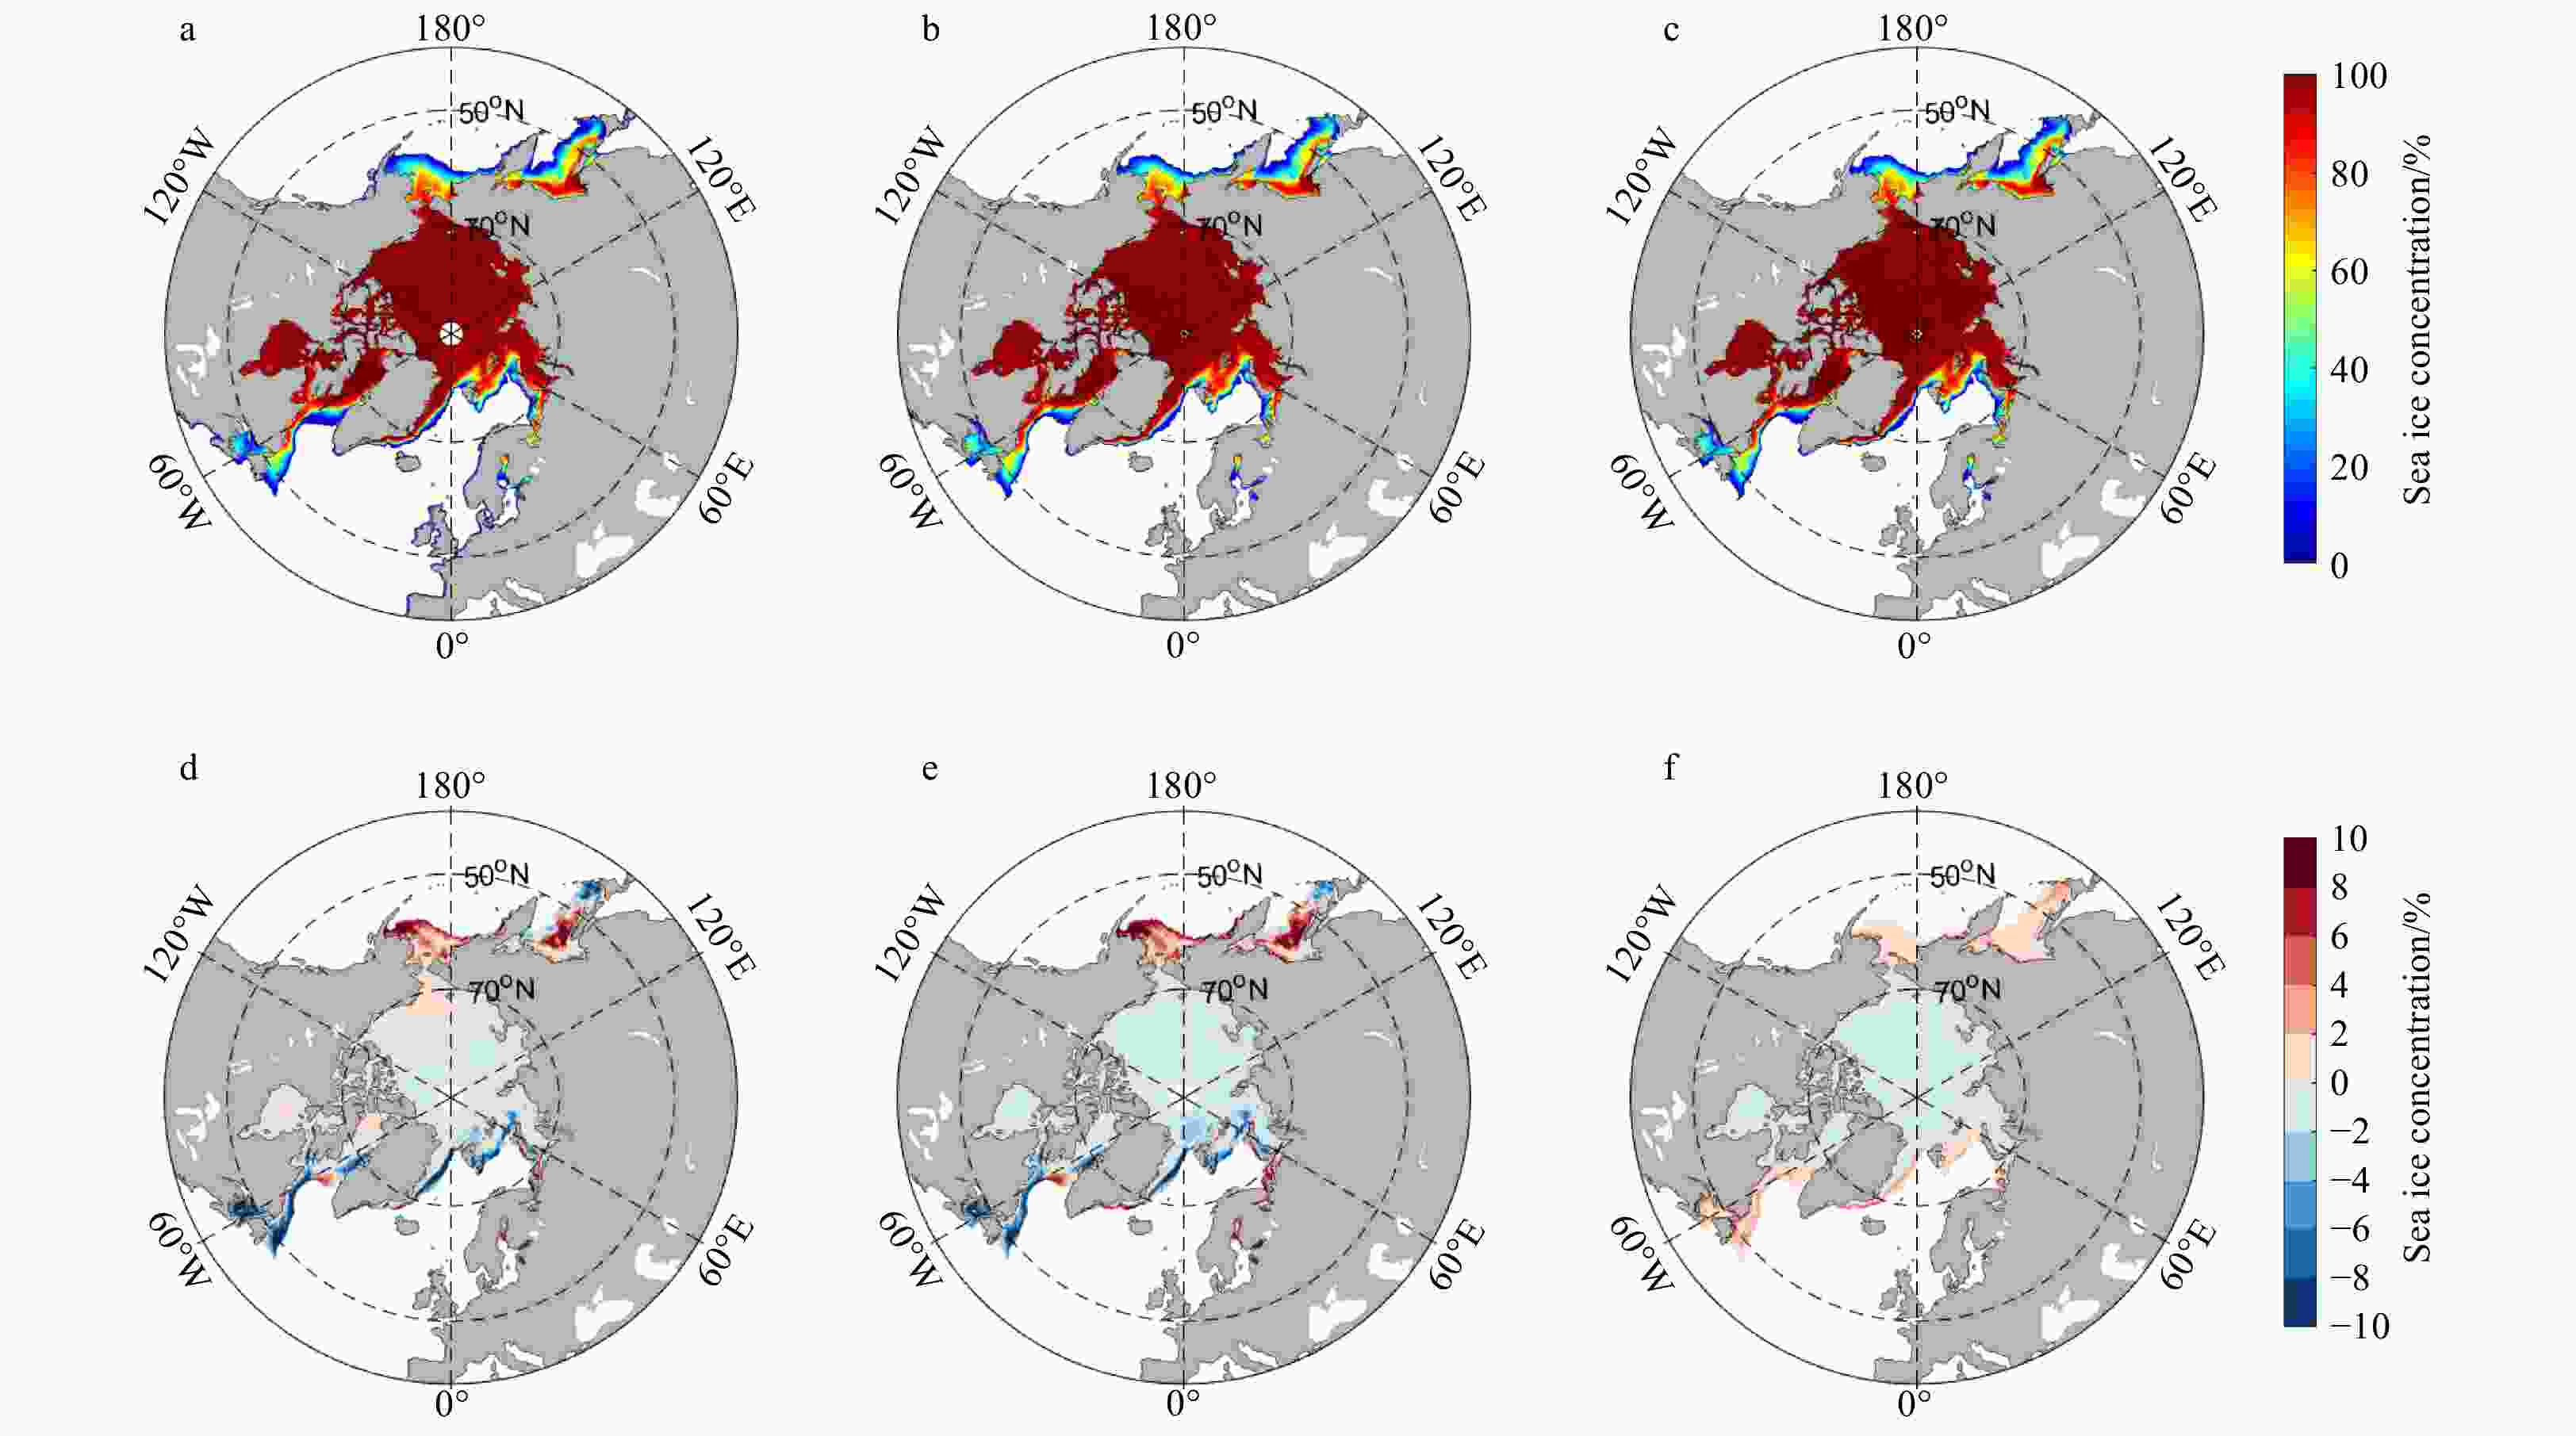
Figure 2. Monthly averaged sea ice concentration in March. a. FY-3B/DT-ASI, b. AMSR2/DT-ASI, c. AMSR2/ASI, and d-f. sea ice concentration differences between FY-3B/DT-ASI and AMSR2/DT-ASI, FY-3B/DT-ASI and AMSR2/DT-ASI, and AMSR2/DT-ASI and AMSR2/ASI.
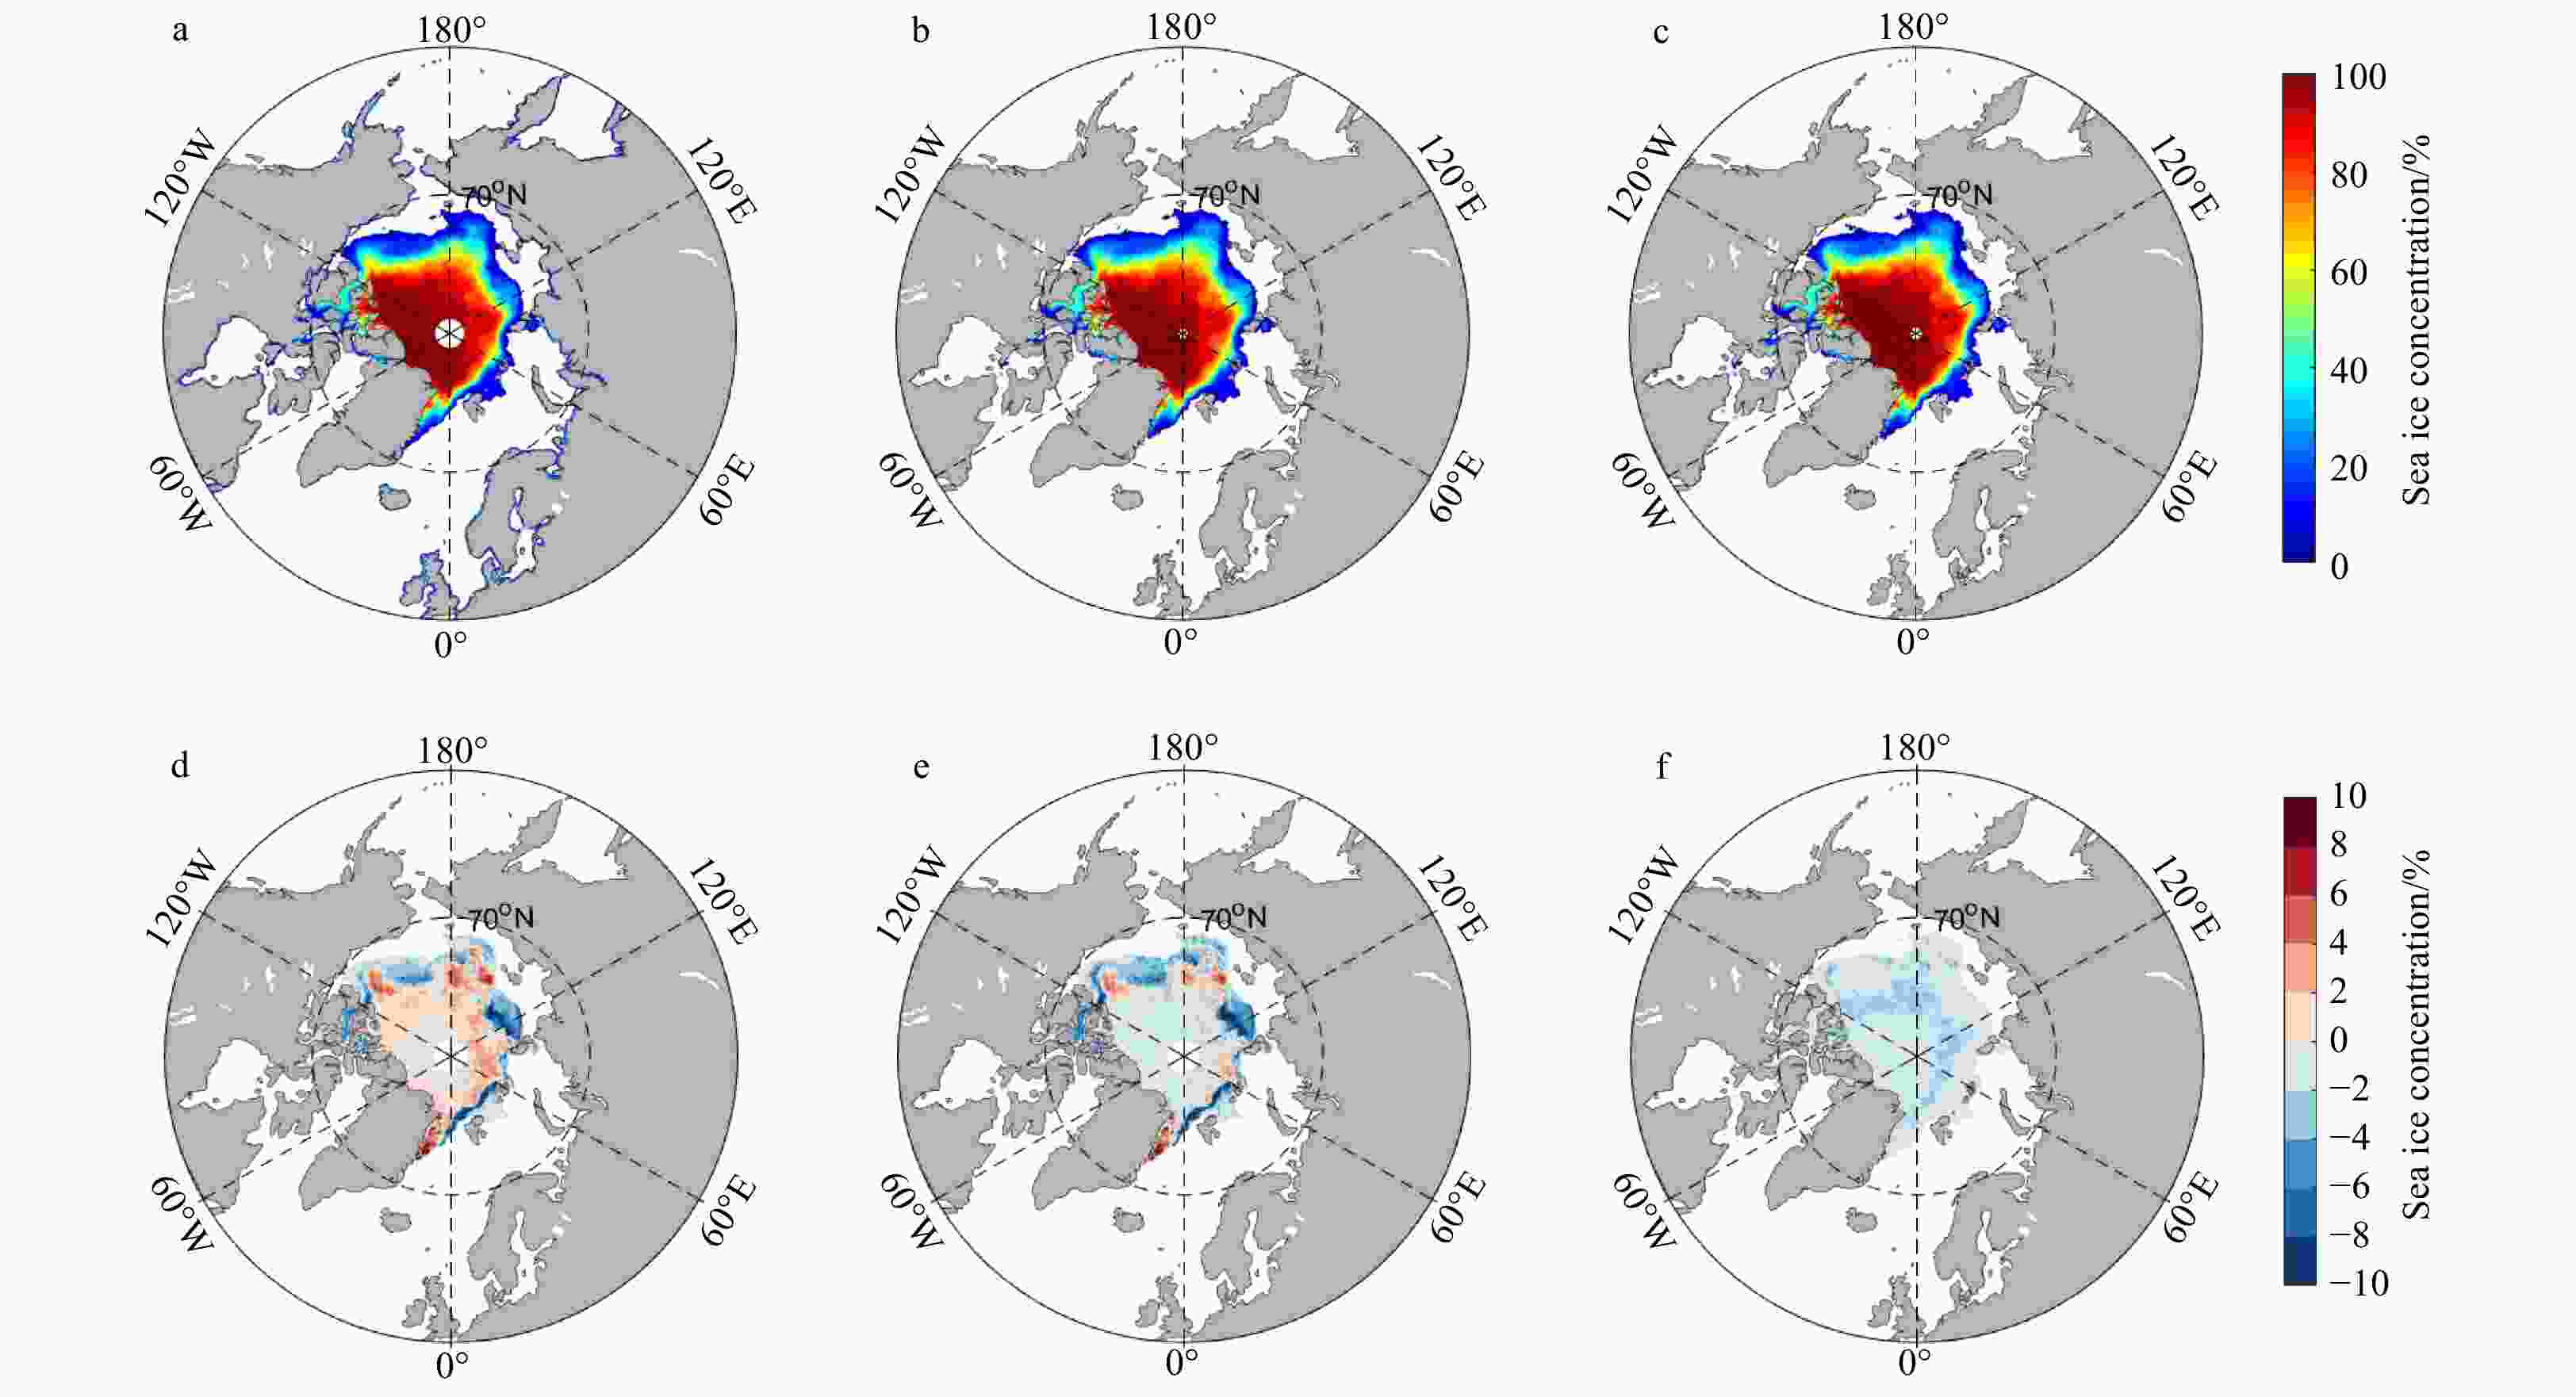
Figure 3. Monthly averaged sea ice concentration in September. a. FY-3B/DT-ASI, b. AMSR2/DT-ASI, c. AMSR2/ASI, and d-f. sea ice concentration differences between FY-3B/DT-ASI and AMSR2/DT-ASI, FY-3B/DT-ASI and AMSR2/DT-ASI, and AMSR2/DT-ASI and AMSR2/ASI.

Figure 4. Arctic sea ice concentration from FY-3B/DT-ASI (a) and FY-3B/NT2 (b) on May 14, 2016 as well as their difference (c).
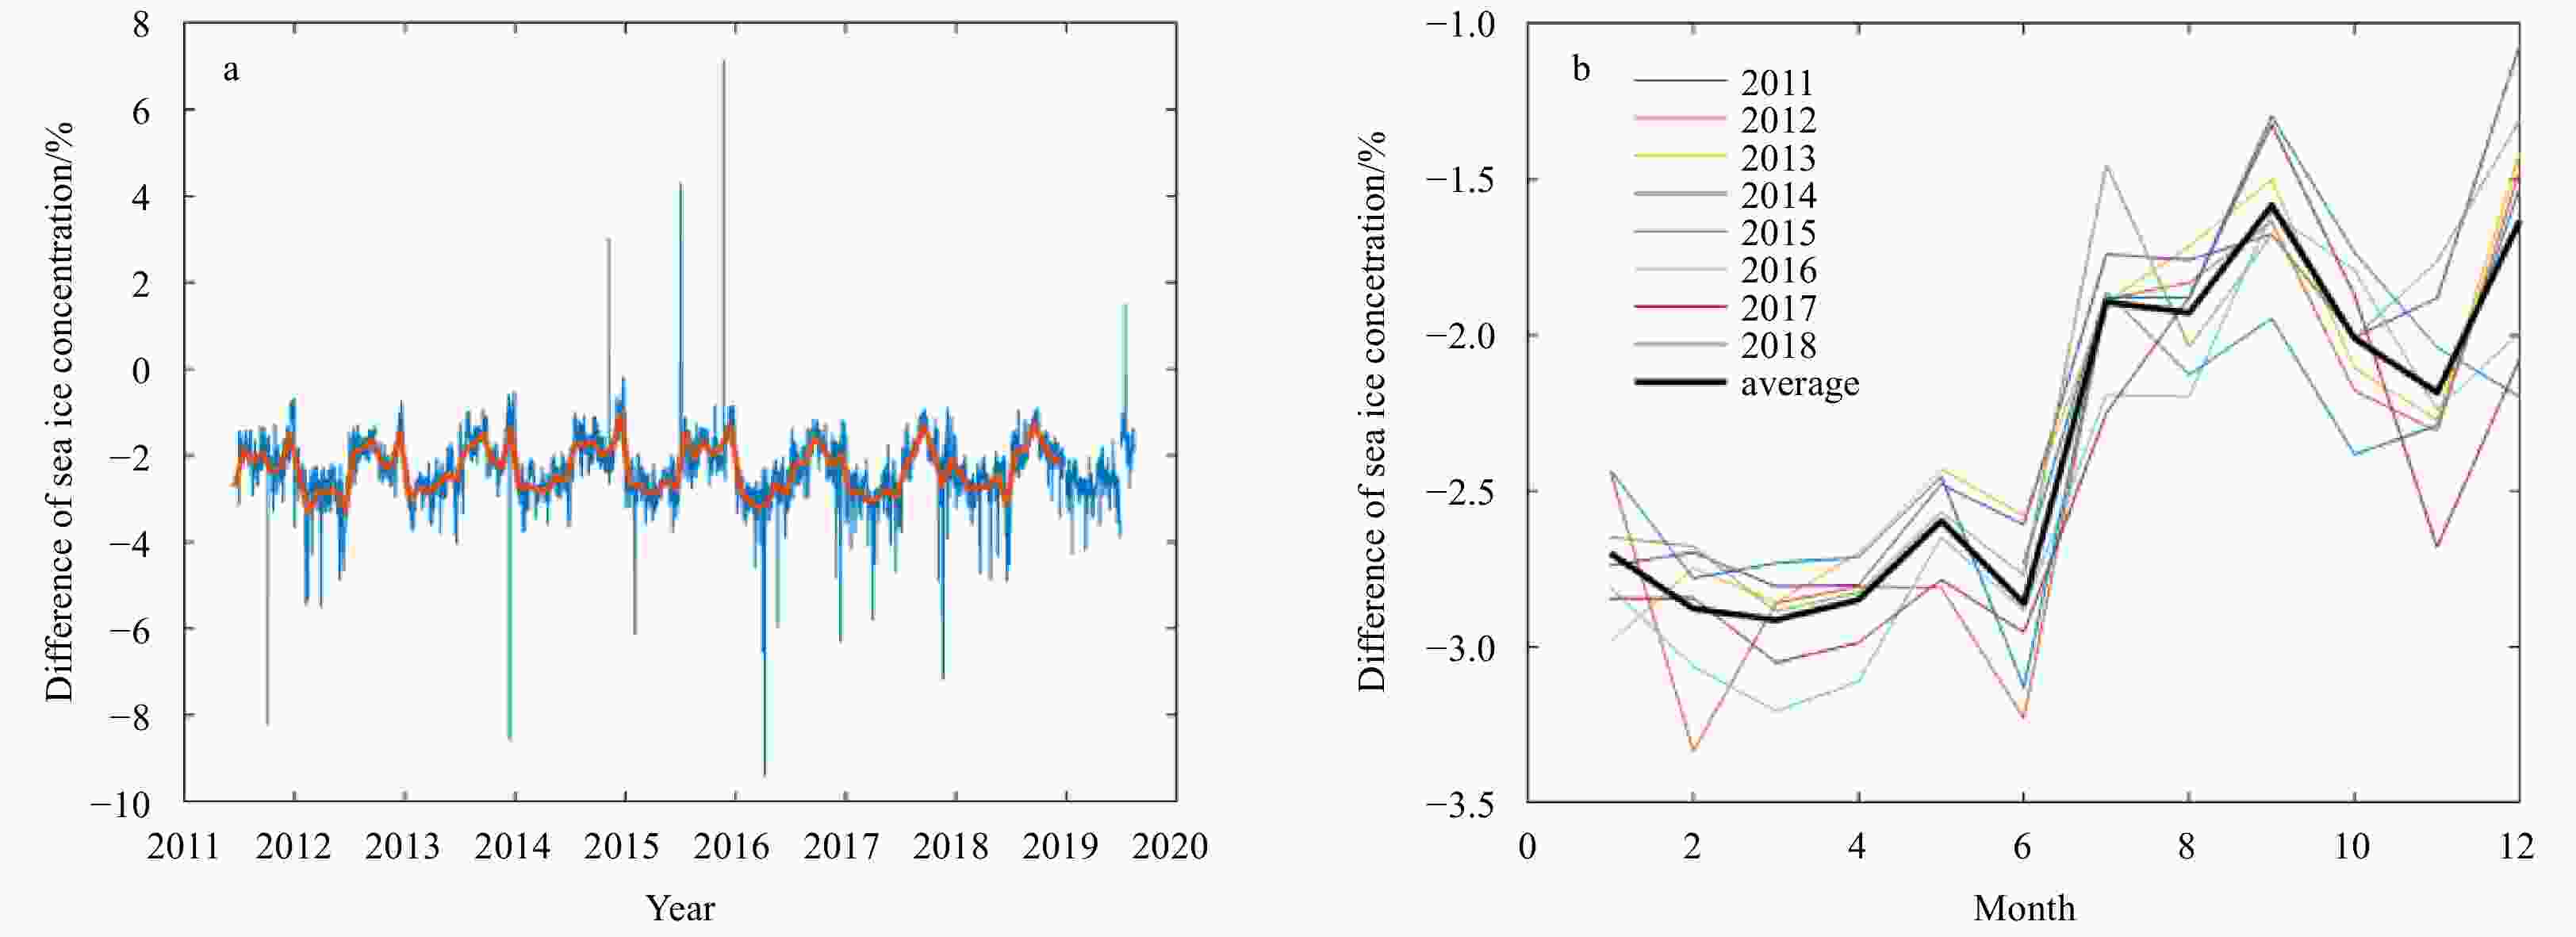
Figure 5. Time series of the daily spatial averaged difference of FY-3B/DT-ASI and FY-3B/NT2 (a), and the monthly spatial averaged sea ice concentration difference of FY-3B/DT-ASI and FY-3B/NT2 (b). The red line in a represents the monthly mean.

Figure 6. Time series of comparison of sea ice extent (SIE) from different datasets (a), differences of SIE with those from SSMI/NT2 (b, DIF1), differences of SIE with those from AMSR2/ASI (c, DIF2), time series of comparison of sea ice area (SIA) from different datasets (d), and differences of SIA with those from AMSR2/ASI (e, DIF1). The color coding of the lines in the different plots are the same as for the respective SIE and SIA plots. The brown dotted line is FY-3B/DT-ASI (V0) which represents without using the land spillover method.

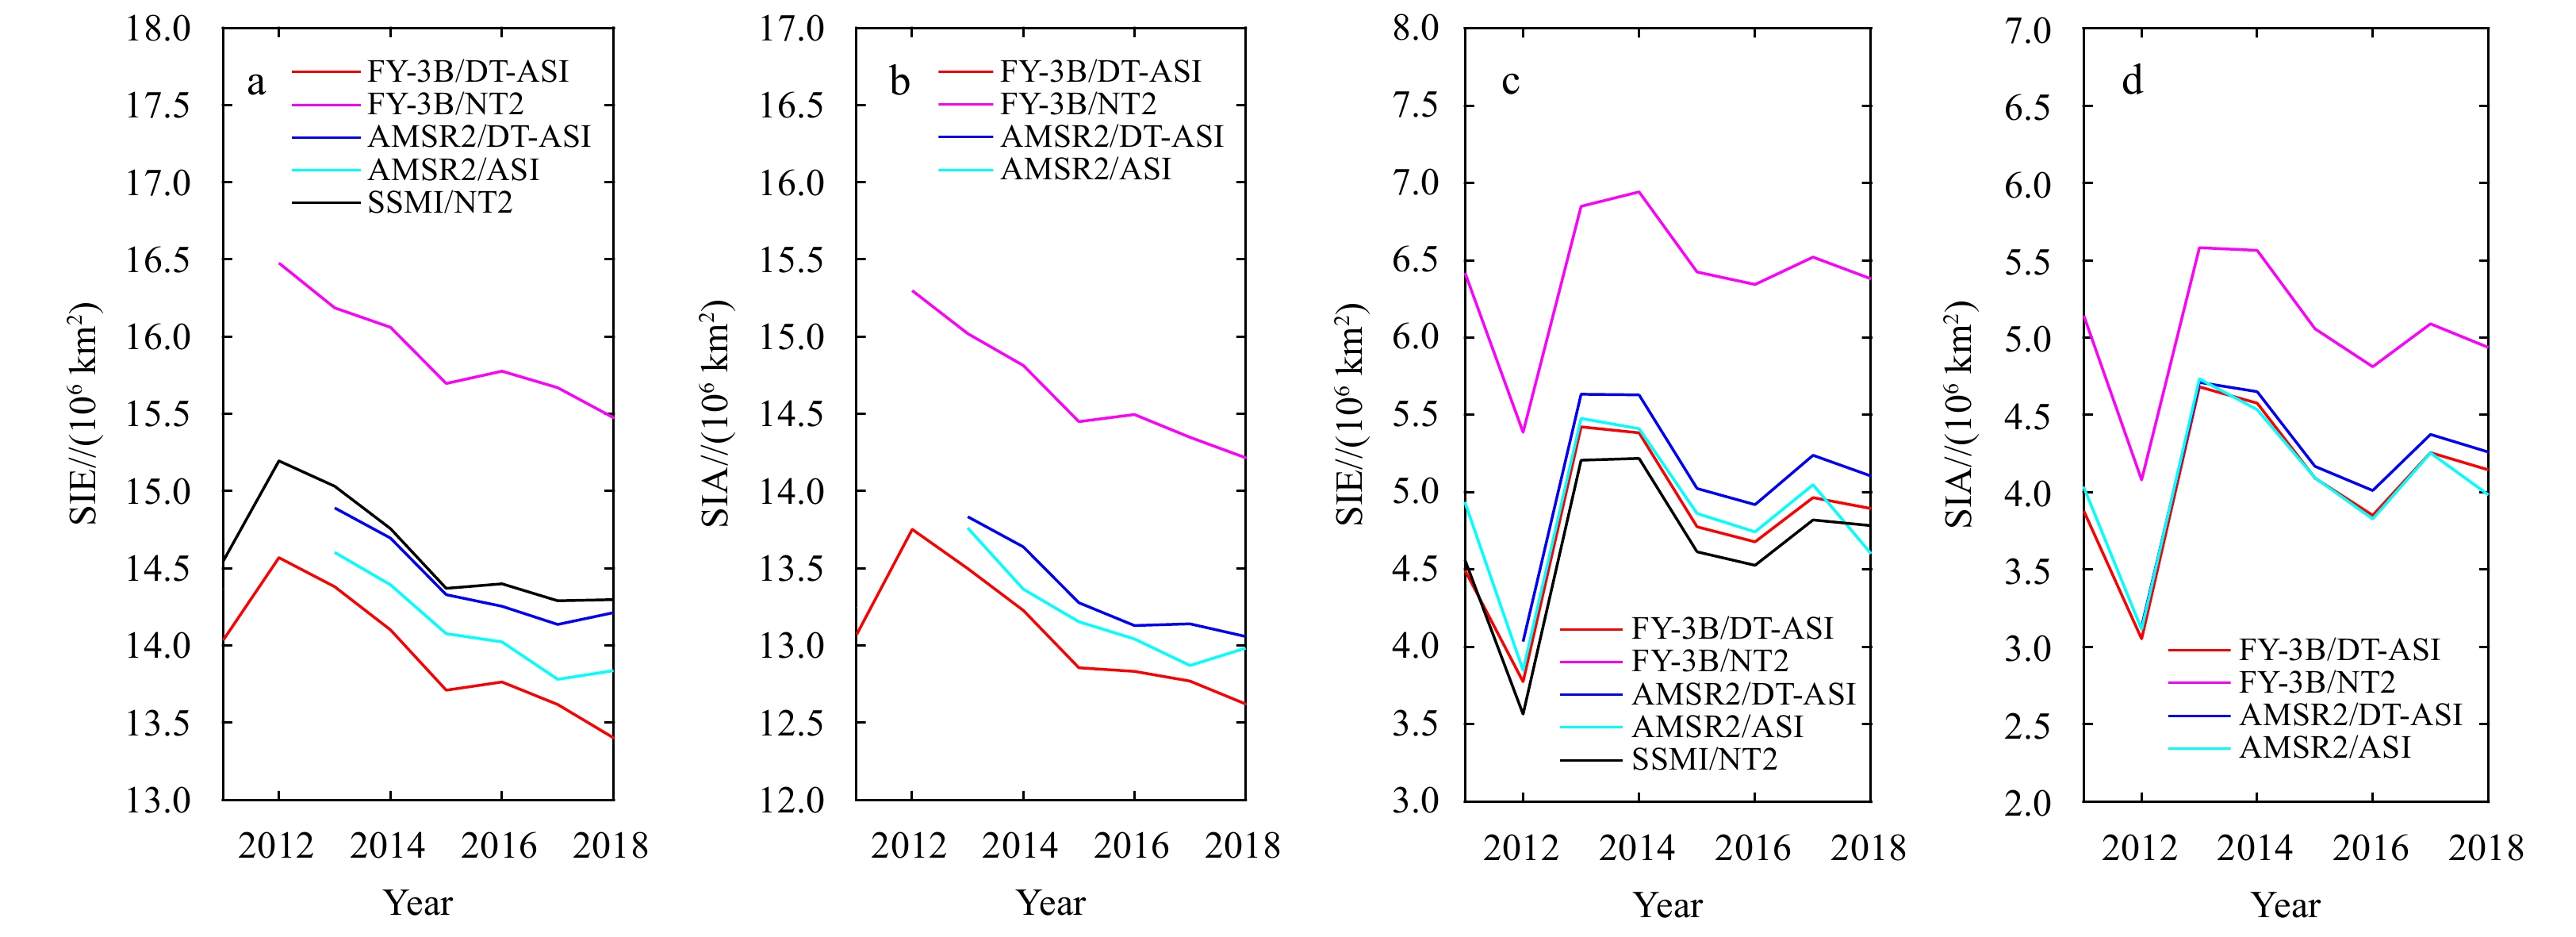
Figure 7. Monthly averaged sea ice extent (SIE) and sea ice area (SIA) of different datasets in March and September. a. SIE for March, b. SIA for March, c. SIE for September, and d. SIA for September.

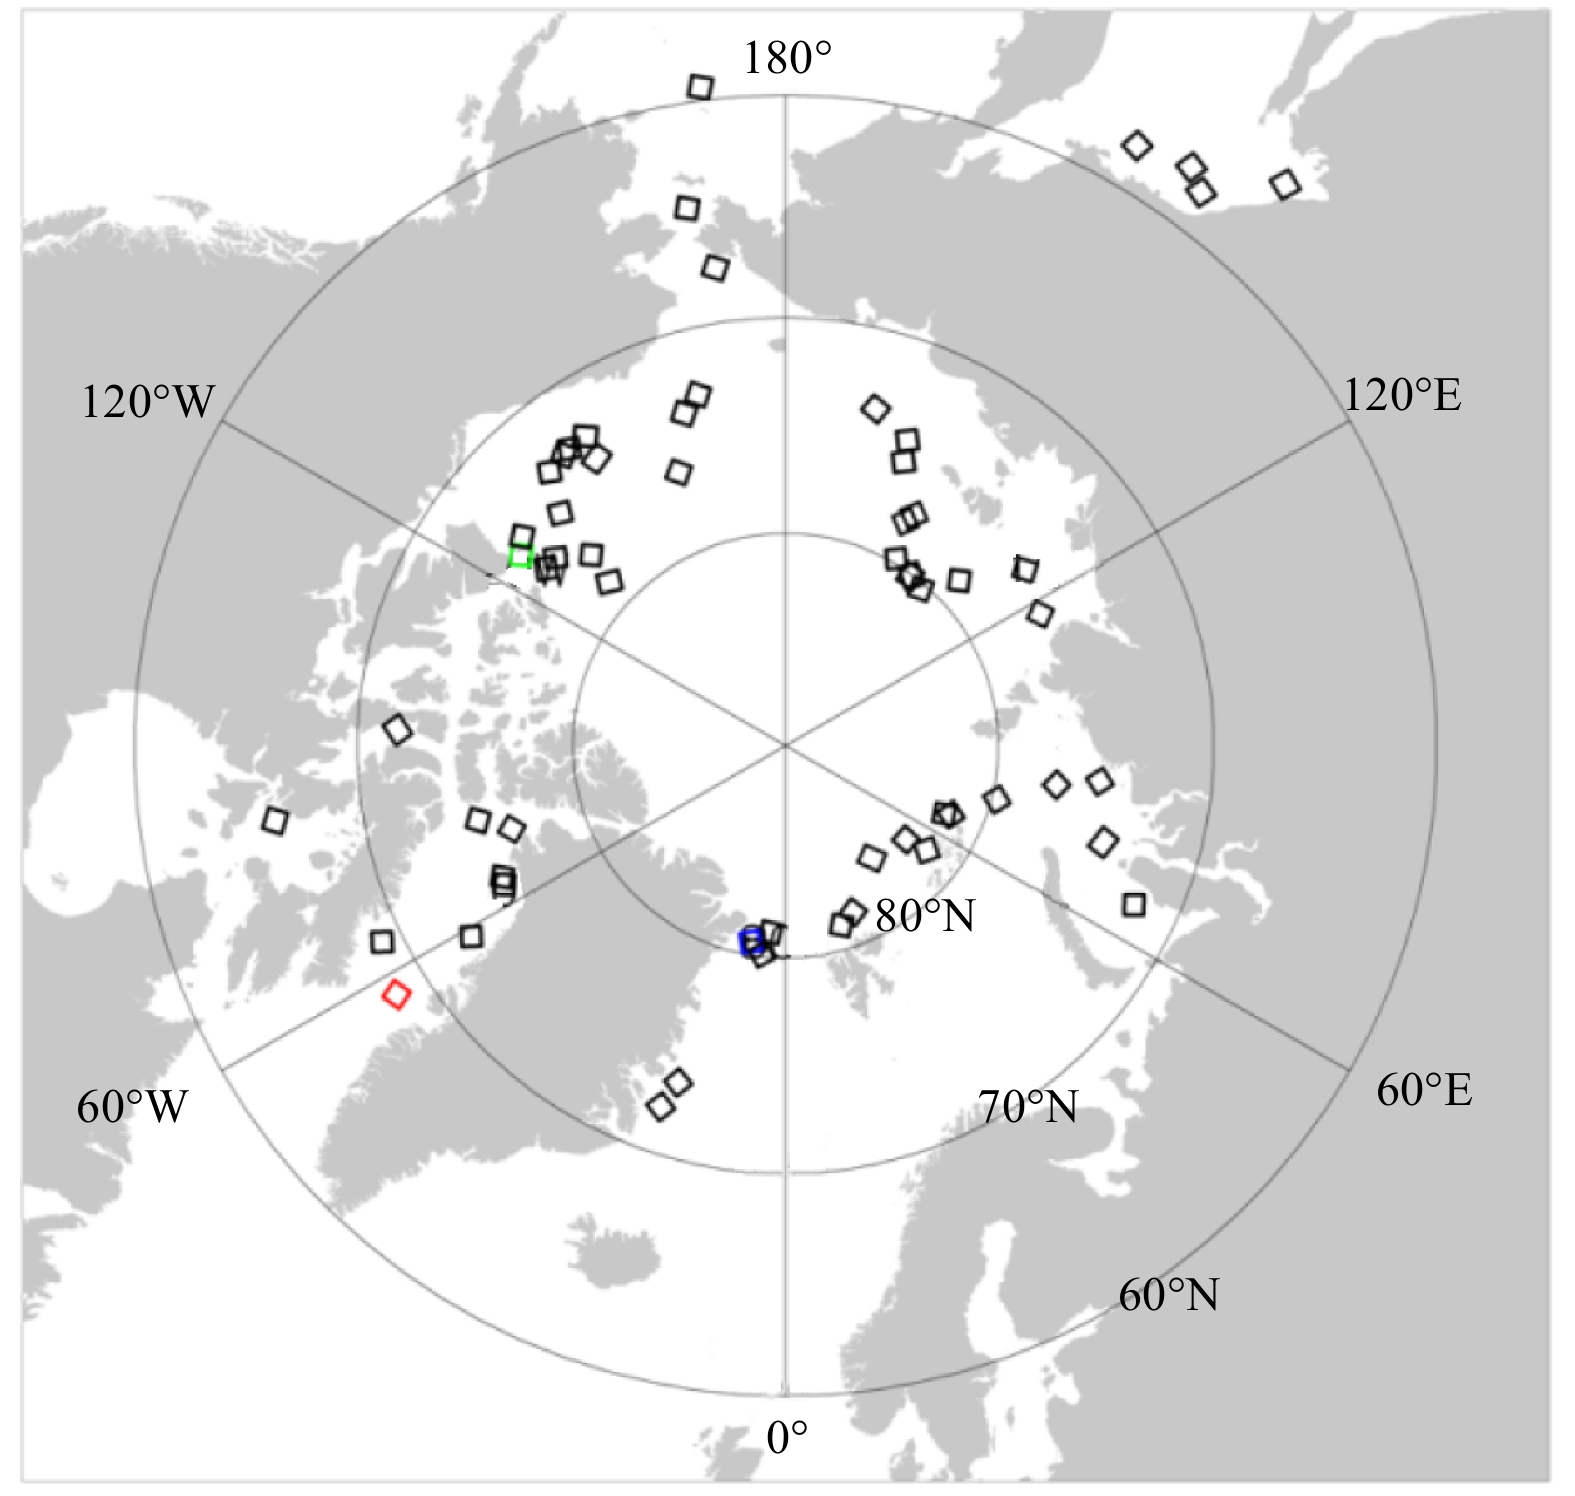
Figure 8. Selection of MODIS broadband top of the atmosphere reflectance images. The red, green, and blue squares show the positions of samples 10, 29, and 34, respectively.

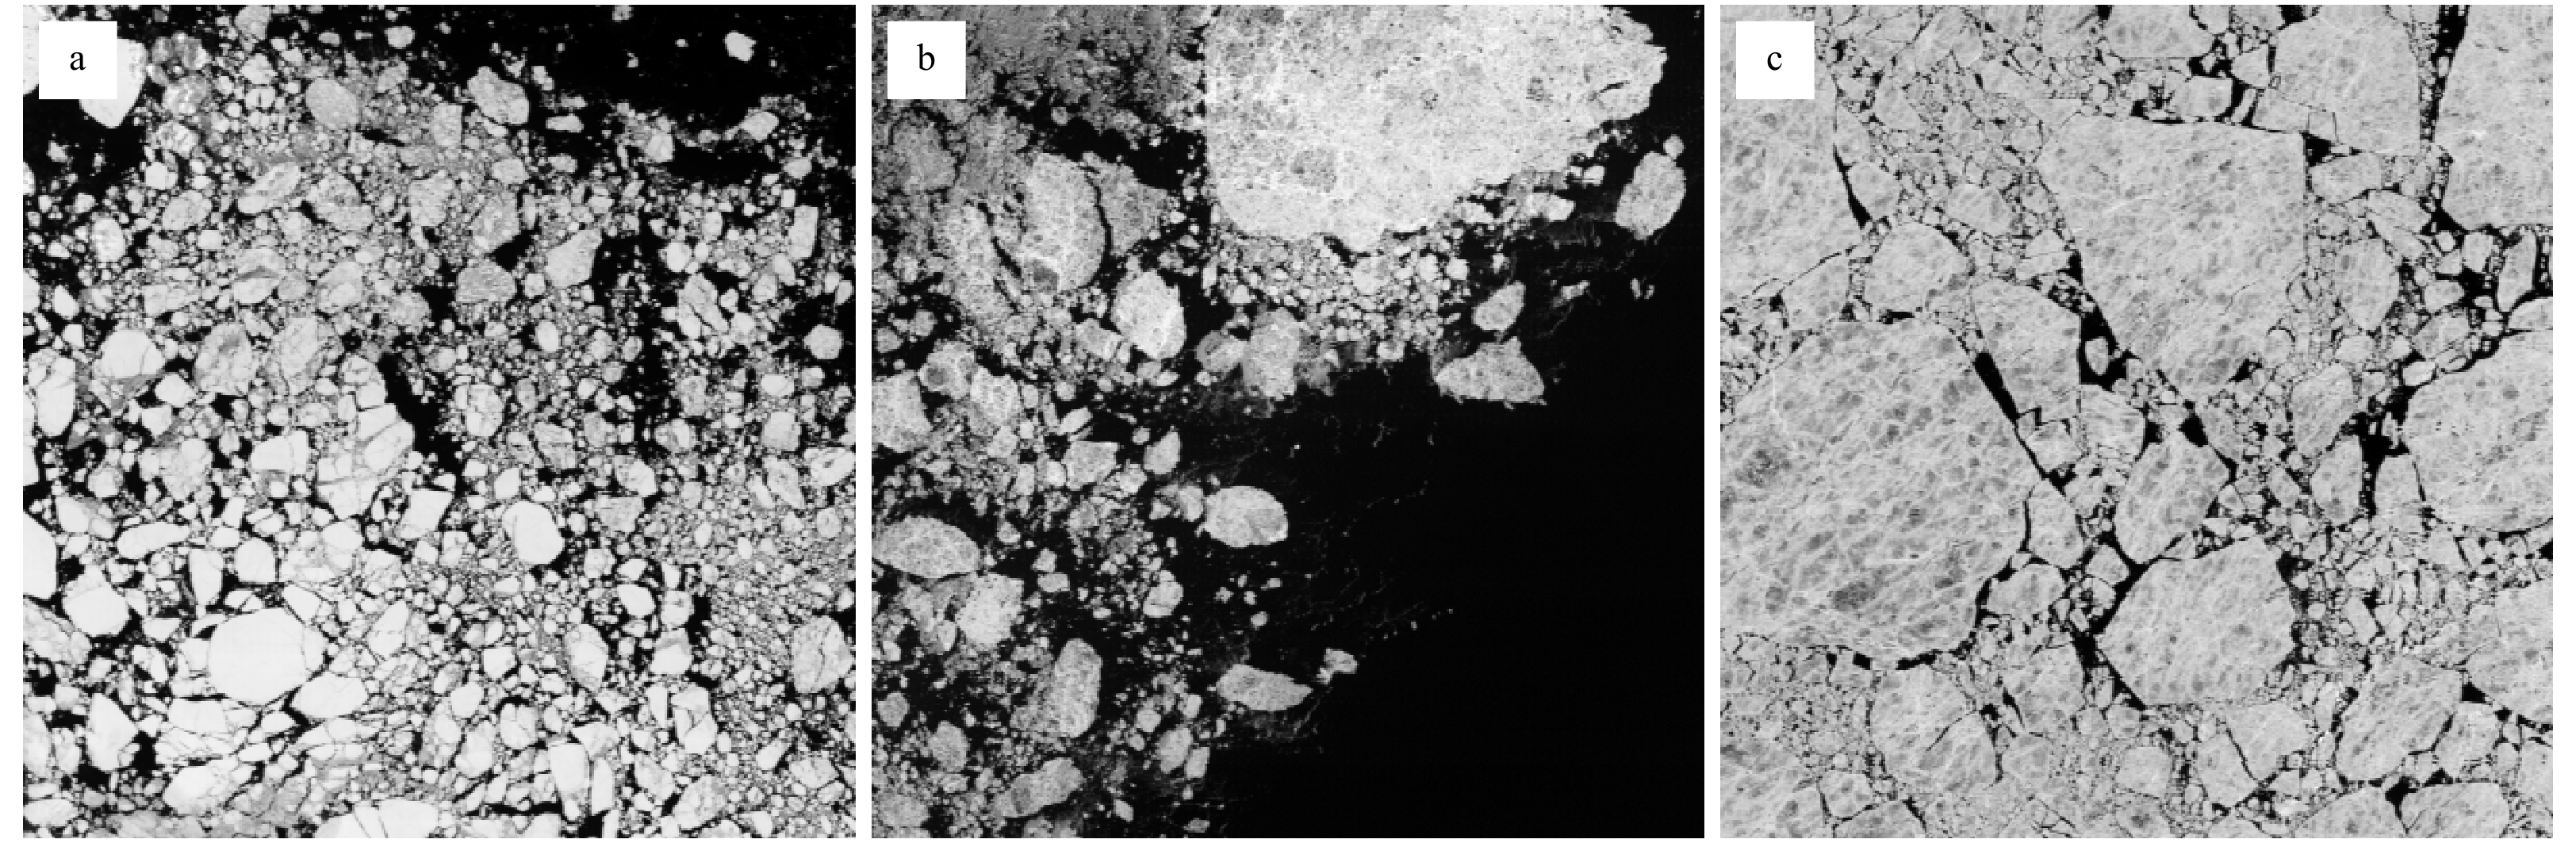
Figure 9. MODIS broadband TOA reflectance images. a. Sample 10; b. Sample 29; and c. Sample 34.
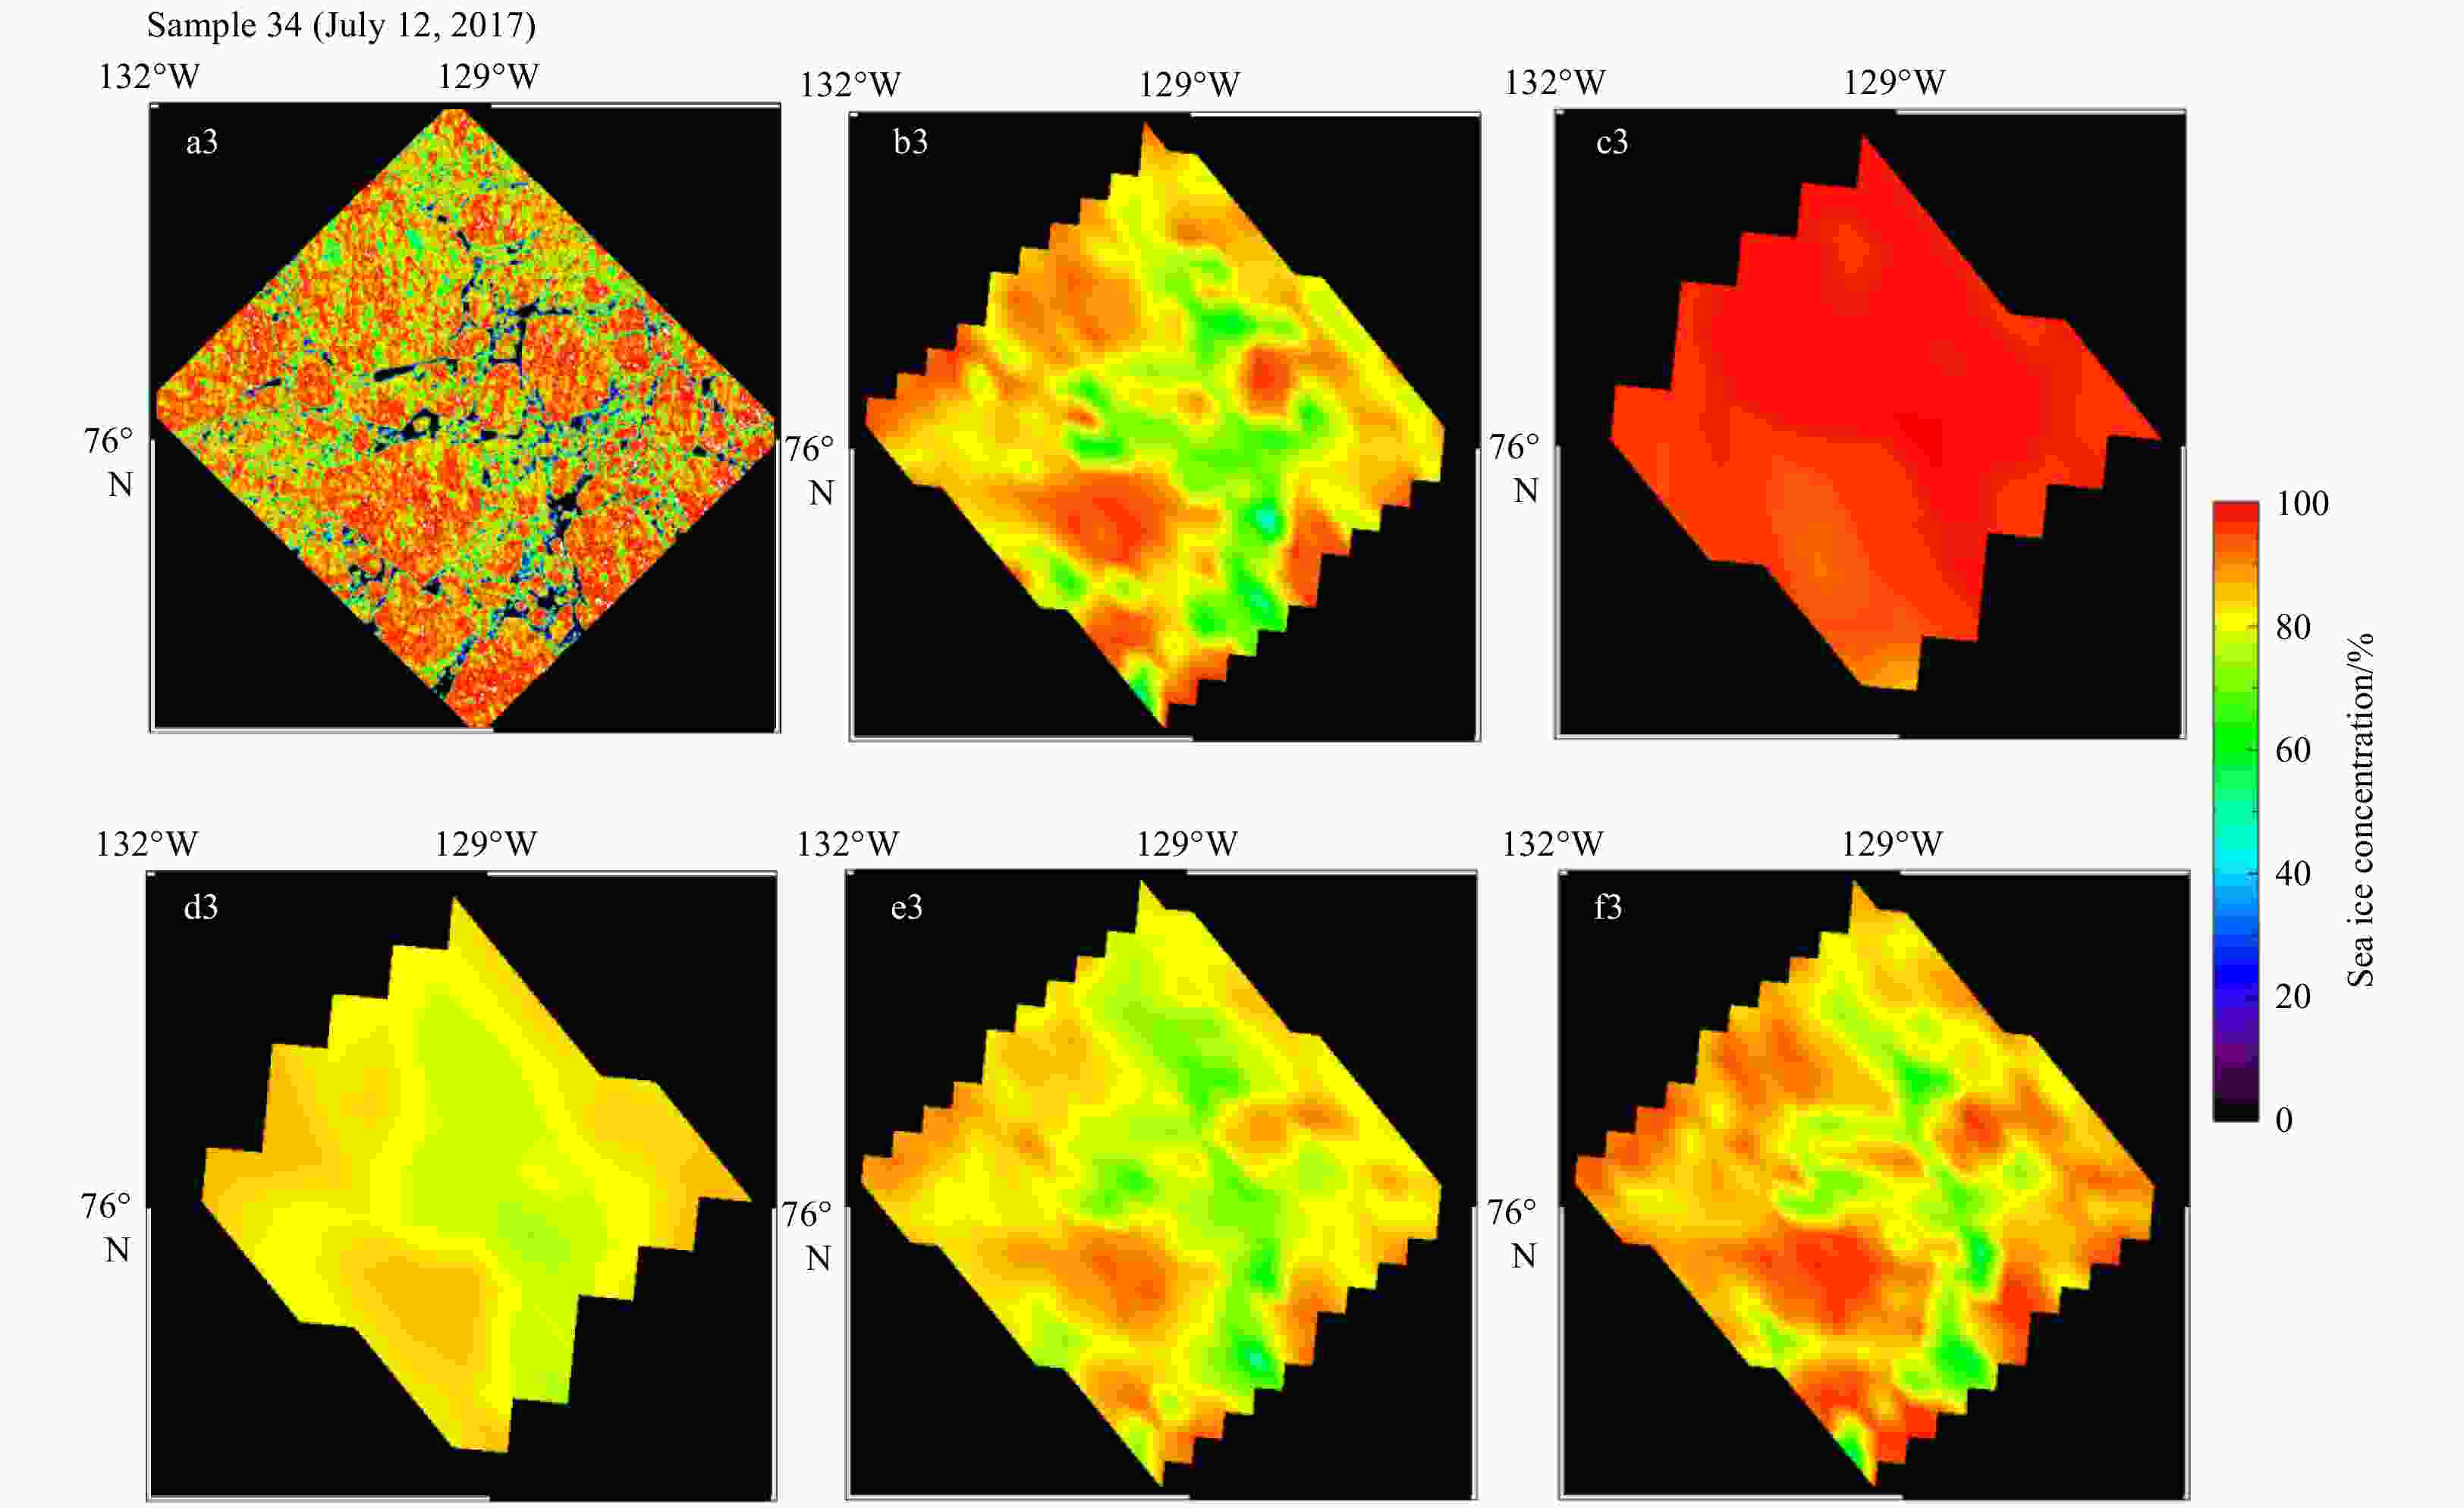
10. Sea ice concentration (SIC) corresponding to the three selected samples. a. MODIS SIC with a resolution of 250 m, b. MODIS SIC with a resolution of 6.25 km, c. FY-3B/NT2 with a resolution of 12.5 km (NSMC), d. FY-3B/DT-ASI with a resolution of 12.5 km, e. AMSR2/DT-ASI with a resolution of 6.25 km, and f. AMSR2/ASI with a resolution of 6.25 km (UB).
Table 1. Algorithms, data sources, resolutions, and time ranges of the main products for Arctic SIC
Algorithm Data source Issued Resolution/km Time range Bootstrap SMMR/SSM/I/SSMIS National Snow and Ice Data Center (NSIDC) 25 1979 to present AMSR-E/AMSR2 University of Bremen (UB) 12.5 2002–2011; 2012 to present Enhance NSAS Team (NT2) AMSR-E National Snow and Ice Data Center (NSIDC) 12.5 2002–2011 MWRI National Satellite Meteorological Center (NSMC) 12.5 2011–2019 AMSR2 Japan Aerospace Exploration Agency (JAXA) 10 2012 to present OSI SAF Hybrid Dynamic
(OSHD)SSMIS European Organisation for the Exploitation of Meteorological Satellites (EUMETSAT) 10 1979 to present AMSR2 10 2012 to present Technical University of Denmark (TUD) AMSR2 European Organisation for the Exploitation of Meteorological Satellites (EUMETSAT) 10 2012 to present Dual-Polarized Ratio (DPR) AMSR-E/AMSR2 Ocean University of China (OUC) 10 2002–2011; 2012 to present ARTSIST Sea Ice (ASI) AMSR-E/AMSR2 University of Bremen (UB) 6.25 2002–2011; 2012 to present Dynamic Tie Point ASI
(DT-ASI)AMSR-E/AMSR2 Ocean University of China (OUC) 6.25 2002–2011; 2012 to present  下载: 导出CSV
Table 2. Statistical differences between the SICs from different data sets with MODIS (%)
FY-3B/DT-ASI FY-3B/NT2 AMSR2/DT-ASI AMSR2/ASI Total MD 0.5 16.5 –0.9 –0.4 MAD 12.7 19.9 11.2 10.8 RMSD 17.2 25.2 14.8 14.7 SIC≥90% MD –6.4 0.78 –8 –4 MAD 10.4 8.8 10.1 7.7 RMSD 12.3 9.6 12.2 9.9 60%≤SIC <90% MD –2.3 10.5 –3.1 0.3 MAD 14 15.3 13.6 12.6 RMSD 17 17.4 16.4 15.7 SIC<60% MD 6.3 33.6 4 1.4 MAD 17.8 34.9 16 15.2 RMSD 21.6 37.6 19.9 19.3
下载: 导出CSV
-
[1] Bjørgo E, Johannessen O M, Miles M W. 1997. Analysis of merged SMMR-SSMI time series of Arctic and Antarctic sea ice parameters 1978–1995. Geophysical Research Letters, 24(4): 413–416. doi: 10.1029/96GL04021 [2] Cao Meisheng, Jin Rui. 2006. Monitoring sea ice concentration using remote sensing technique. Remote Sensing Technology and Application (in Chinese), 21(3): 259–264 [3] Cavalieri D J, Gloersen P, Campbell W J. 1984. Determination of sea ice parameters with the Nimbus 7 SMMR. Journal of Geophysical Research: Atmospheres, 89(D4): 5355–5369. doi: 10.1029/JD089iD04p05355 [4] Cavalieri D J, Gloersen P, Parkinson C L, et al. 1997. Observed hemispheric asymmetry in global sea ice changes. Science, 278(5340): 1104–1106. doi: 10.1126/science.278.5340.1104 [5] Cavalieri D J, Markus T, Hall D K, et al. 2010. Assessment of AMSR-E Antarctic winter sea-ice concentrations using Aqua MODIS. IEEE Transactions on Geoscience and Remote Sensing, 48(9): 3331–3339. doi: 10.1109/TGRS.2010.2046495 [6] Cavalieri D J, Parkinson C L, Gloersen P, et al. 1999. Deriving long-term time series of sea ice cover from satellite passive-microwave multisensor data sets. Journal of Geophysical Research: Oceans, 104(C7): 15803–15814. doi: 10.1029/1999JC900081 [7] Chen Haihua, Li Lele, Guan Lei. 2021. Cross-calibration of brightness temperature obtained by FY-3B/MWRI using Aqua/AMSR-E data for snow depth retrieval in the Arctic. Acta Oceanologica Sinica, 40(1): 43–53. doi: 10.1007/s13131-021-1717-2 [8] Comiso J C. 1995. SSM/I sea ice concentrations using the bootstrap algorithm. Washington, DC: National Aeronautics and Space Administration, 40 [9] Comiso J C, Cavalieri D J, Markus T. 2003. Sea ice concentration, ice temperature, and snow depth using AMSR-E data. IEEE Transactions on Geoscience and Remote Sensing, 41(2): 243–252. doi: 10.1109/TGRS.2002.808317 [10] Comiso J C, Kwok R. 1996. Surface and radiative characteristics of the summer Arctic sea ice cover from multisensor satellite observations. Journal of Geophysical Research: Oceans, 101(C12): 28397–28416. doi: 10.1029/96JC02816 [11] Comiso J C, Meier W N, Gersten R. 2017. Variability and trends in the Arctic Sea ice cover: results from different techniques. Journal of Geophysical Research: Oceans, 122(8): 6883–6900. doi: 10.1002/2017JC012768 [12] Cvijanovic I, Caldeira K, MacMartin D G. 2015. Impacts of ocean albedo alteration on Arctic sea ice restoration and Northern Hemisphere climate. Environmental Research Letters, 10(4): 044020. doi: 10.1088/1748-9326/10/4/044020 [13] Gloersen P, Cavalieri D J. 1986. Reduction of weather effects in the calculation of sea ice concentration from microwave radiances. Journal of Geophysical Research: Oceans, 91(C3): 3913–3919. doi: 10.1029/JC091iC03p03913 [14] Hall D K, Key J R, Casey K A, et al. 2004. Sea ice surface temperature product from MODIS. IEEE Transactions on Geoscience and Remote Sensing, 42(5): 1076–1087. doi: 10.1109/TGRS.2004.825587 [15] Hao Guanghua, Su Jie. 2015. A study on the dynamic tie points ASI algorithm in the Arctic Ocean. Acta Oceanologica Sinica, 34(11): 126–135. doi: 10.1007/s13131-015-0659-y [16] Kaleschke L, Lüpkes C, Vihma T, et al. 2001. SSM/I sea ice remote sensing for mesoscale ocean-atmosphere interaction analysis. Canadian Journal of Remote Sensing, 27(5): 526–537. doi: 10.1080/07038992.2001.10854892 [17] Lavelle J, Tonboe R, Tian T, et al. 2016. Product user manual for the OSI SAF AMSR-2 global sea ice concentration. Product OSI-408. Copenhagen, Denmark: Danish Meteorological Institute [18] Li Xinqing, Cheng Xiao, Hui Fengming, et al. 2016. Analysis of sea ice conditions in the Arctic northeast passage in summer 2014. Chinese Journal of Polar Research (in Chinese), 28(1): 87–94 [19] Liu Sen, Zou Bin, Shi Lijian, et al. 2020. Polar sea ice concentration retrieval based on FY-3C microwave radiation imager data. Haiyang Xuebao (in Chinese), 42(1): 113–122 [20] Markus T, Cavalieri D J. 2000. An enhancement of the NASA Team sea ice algorithm. IEEE Transactions on Geoscience and Remote Sensing, 38(3): 1387–1398. doi: 10.1109/36.843033 [21] Markus T, Cavalieri D J. 2009. The AMSR-E NT2 Sea Ice Concentration Algorithm : its Basis and Implementation. The Remote Sensing Society of Japan, 29(1): 216–225 [22] Meier W N, Fetterer F, Stewart J S, et al. 2015. How do sea-ice concentrations from operational data compare with passive microwave estimates? Implications for improved model evaluations and forecasting. Annals of Glaciology, 56(69): 332–340. doi: 10.3189/2015AoG69A694 [23] Parkinson C L. 1987. Arctic Sea Ice, 1973−1976: Satellite Passive-Microwave Observations. Washington, DC: Scientific and Technical Information Branch, NASA [24] Perovich D K, Nghiem S V, Markus T, et al. 2007. Seasonal evolution and interannual variability of the local solar energy absorbed by the Arctic Sea ice-ocean system. Journal of Geophysical Research: Oceans, 112(C3): C03005 [25] Smith D M. 1996. Extraction of winter total sea-ice concentration in the Greenland and Barents Seas from SSM/I data. International Journal of Remote Sensing, 17(13): 2625–2646. doi: 10.1080/01431169608949096 [26] Spreen G, Kaleschke L, Heygster G. 2008. Sea ice remote sensing using AMSR-E 89-GHz channels. Journal of Geophysical Research: Oceans, 113(C2): C02S03 [27] Steffen K, Schweiger A. 1991. NASA team algorithm for sea ice concentration retrieval from Defense Meteorological Satellite Program special sensor microwave imager: comparison with Landsat satellite imagery. Journal of Geophysical Research: Oceans, 96(C12): 21971–21987. doi: 10.1029/91JC02334 [28] Tang Xiaotong, Chen Haihua, Guan Lei, et al. 2020. Intercalibration of FY-3B/MWRI and GCOM-W1/AMSR-2 brightness temperature over the Arctic. Journal of Remote Sensing (Chinese), 24(8): 1032–1044 [29] Tonboe R, Lavelle J, Pfeiffer R H, et al. 2016. Product user manual for OSI SAF global sea ice concentration. Product OSI-401-b. Copenhagen, Denmark: Danish Meteorological Institute [30] Wang Xiaoyu, Guan Lei, Li Lele. 2018. Comparison and validation of sea ice concentration from FY-3B/MWRI and Aqua/AMSR-E observations. Journal of Remote Sensing (in Chinese), 22(5): 723–736 [31] Wiebe H, Heygster G, Markus T. 2009. Comparison of the ASI ice concentration algorithm with Landsat-7 ETM+ and SAR imagery. IEEE Transactions on Geoscience and Remote Sensing, 47(9): 3008–3015. doi: 10.1109/TGRS.2009.2026367 [32] Wu Zhankai, Wang Xingdong, Wang Xuemei. 2019. An improved ARTSIST sea ice algorithm based on 19 GHz modified 91 GHz. Acta Oceanologica Sinica, 38(10): 93–99. doi: 10.1007/s13131-019-1482-7 [33] Wu Zhankai, Wang Xingdong, Wang Feng. 2020. Study on Arctic sea ice concentration based on FY-3 MWRI data. Journal of Glaciology and Geocryology (in Chinese), 42(4): 1135–1144 [34] Yang Hu, Zou Xiaolei, Li Xiaoqing, et al. 2012. Environmental data records from FengYun-3B microwave radiation imager. IEEE Transactions on Geoscience and Remote Sensing, 50(12): 4986–4993. doi: 10.1109/TGRS.2012.2197003 [35] Ye Xinxin, Su Jie, Wang Yang, et al. 2011. Assessment of AMSR-E sea ice concentration in ice margin zone using MODIS data. In: 2011 International Conference on Remote Sensing, Environment and Transportation Engineering (RSETE). Nanjing, China: IEEE, 3869–3873 [36] Zhai Zhaokun, Lu Shanlong, Wang Ping, et al. 2017. Optimization of FY arctic sea ice dataset based on NSIDC sea ice product. Journal of Geo-information Science (in Chinese), 19(2): 143–151 [37] Zhang Shugang. 2012. Sea ice concentration algorithm and study on the physical process about sea ice and melt-pond change in central Arctic (in Chinese) [dissertation]. Qingdao: Ocean University of China [38] Zhang Shugang, Zhao Jinping, Frey K, et al. 2013. Dual-polarized ratio algorithm for retrieving Arctic sea ice concentration from passive microwave brightness temperature. Journal of Oceanography, 69(2): 215–227. doi: 10.1007/s10872-012-0167-z [39] Zhao Jinping, Ren Jingping. 2000. Study on the method to analyze parameters of Arctic sea ice from airborne digital imagery. Journal of Remote Sensing (in Chinese), 21(4): 271–278 -


 点击查看大图

计量
- 文章访问数: 415
- HTML全文浏览量: 152
- PDF下载量: 21
- 被引次数: 0

