

Recent improvements to the physical model of the Bohai Sea, the Yellow Sea and the East China Sea Operational Oceanography Forecasting System
-
Abstract: In order to satisfy the increasing demand for the marine forecasting capacity, the Bohai Sea, the Yellow Sea and the East China Sea Operational Oceanography Forecasting System (BYEOFS) has been upgraded and improved to Version 2.0. Based on the Regional Ocean Modeling System (ROMS), a series of comparative experiments were conducted during the improvement process, including correcting topography, changing sea surface atmospheric forcing mode, adjusting open boundary conditions, and considering atmospheric pressure correction. (1) After the topography correction, the volume transport and meridional velocity maximum of Yellow Sea Warm Current increase obviously and the unreasonable bending of its axis around 36.1°N, 123.5°E disappears. (2) After the change of sea surface forcing mode, an effective negative feedback mechanism is formed between predicted sea surface temperature (SST) by the ocean model and sea surface radiation fluxes fields. The simulation errors of SST decreased significantly, and the annual average of root-mean-square error (RMSE) decreased by about 18%. (3) The change of the eastern lateral boundary condition of baroclinic velocity from mixed Radiation-Nudging to Clamped makes the unreasonable westward current in Tsushima Strait disappear. (4) The adding of mean sea level pressure correction option which forms the mean sea level gradient from the Bohai Sea and the Yellow Sea to the western Pacific in winter and autumn is helpful to increasing the fluctuation of SLA and outflow of the Yellow Sea when the cold high air pressure system controls the Yellow Sea area.
-

Figure 2. Topography (solid line) and velocity field at 50 m (bule vector) in YS before (a) and after (b) topography revised.

Figure 3. Meridional (a, b) and zonal (c, d) velocity across and along 36.15°N section before (a, c) and after (b, d) topography revised.

Figure 4. Yellow Sea Warm Current VT (blue) and maximum velocity (red) of 35°N section in winter before (solid line) and after (dash line) topography revised.

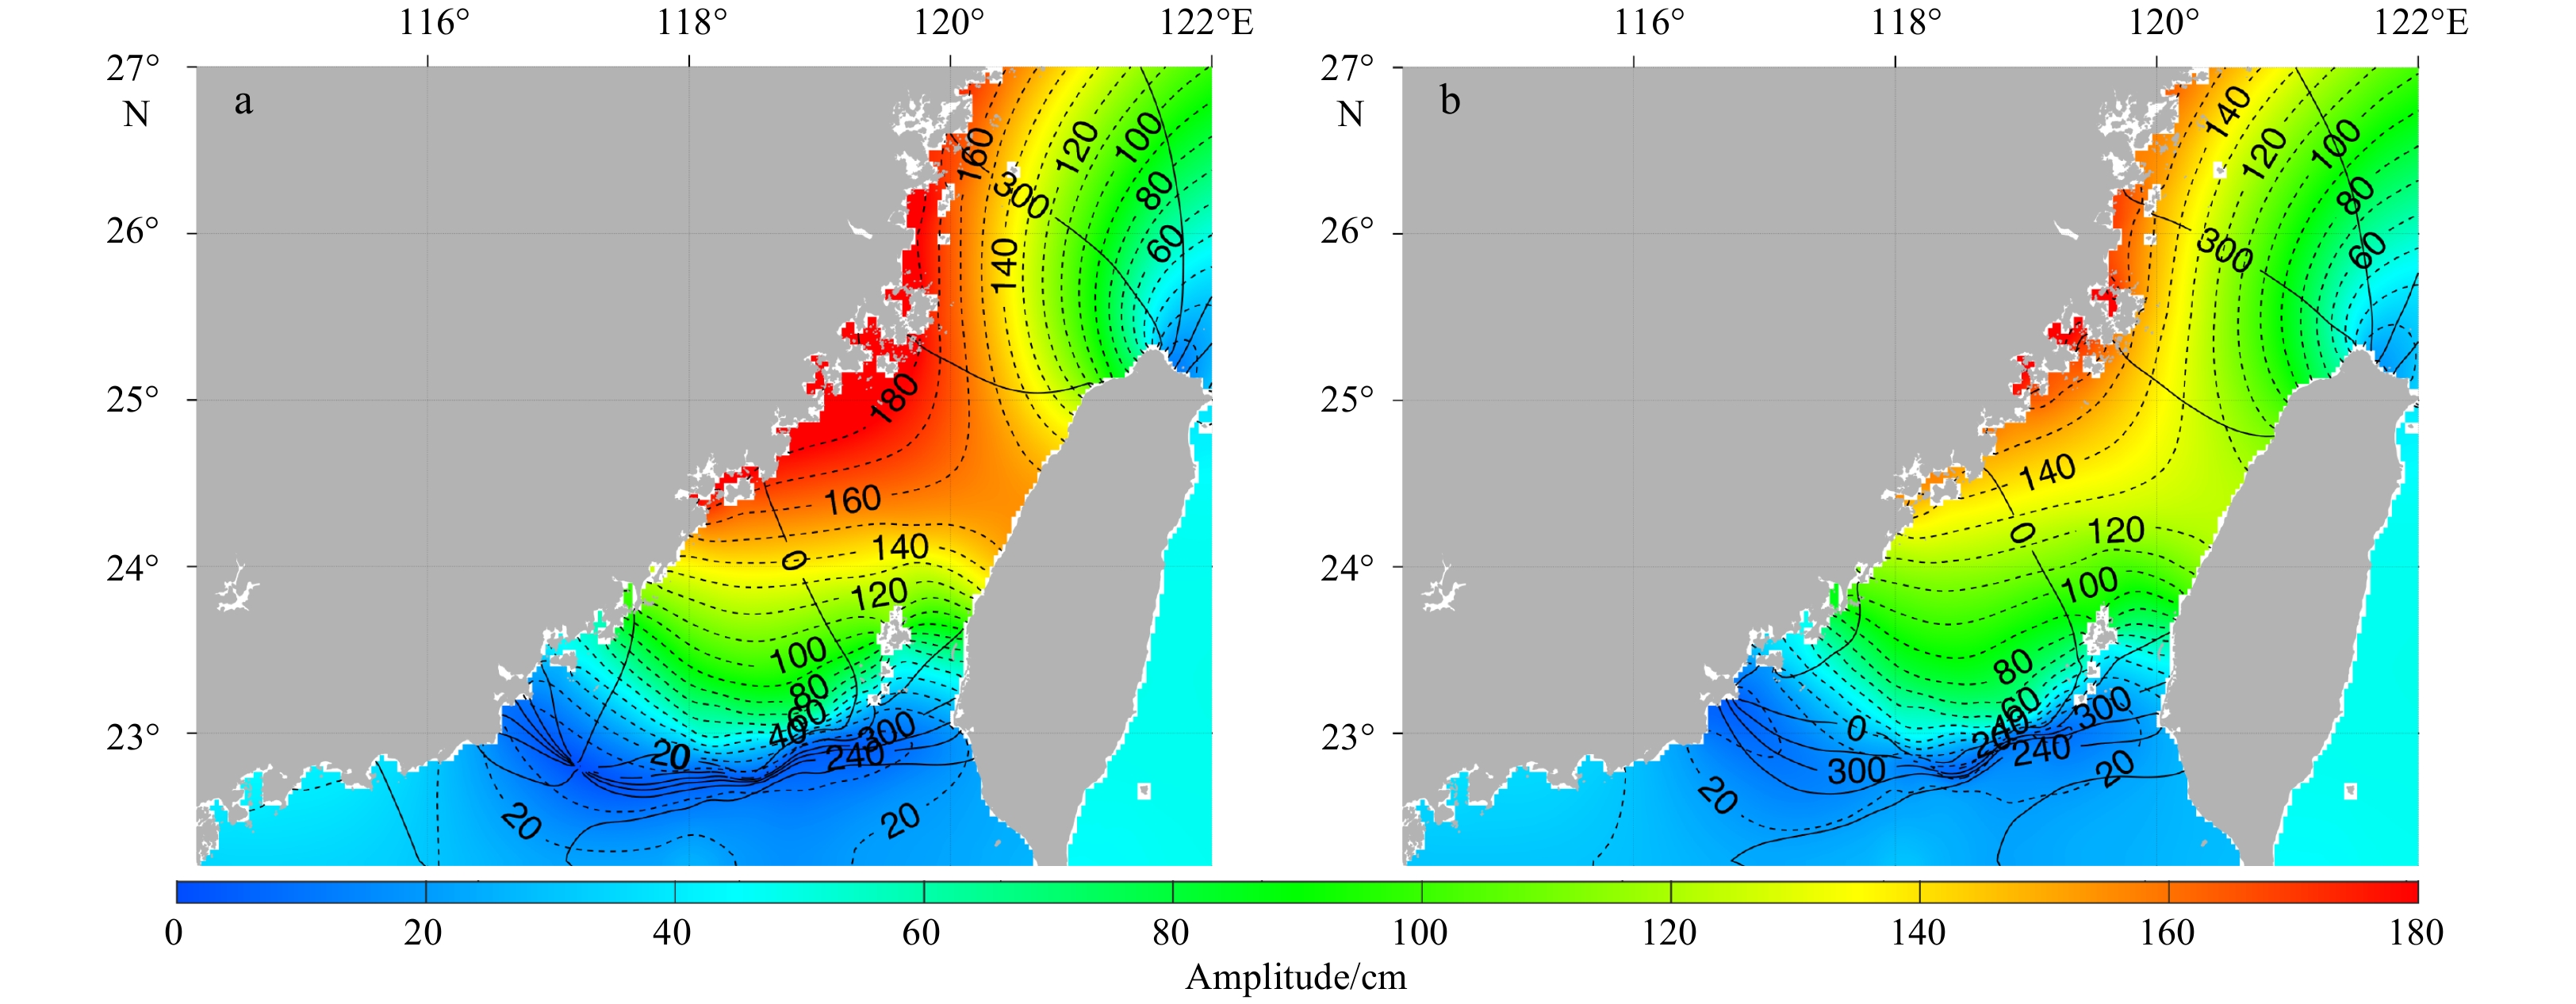
Figure 5. Co-tidal charts (both dash lines and color filled for amplitude in cm, solid lines for phase in (°) and referred to 120°E) in and around the Taiwan Strait for M2 constituent before (a) and after (b) the BFC adjustment.

Figure 7. Simulation SST error in January (a, b), April (c, d), July (e, f) and October (g, h) of 2011 using direct forcing (left) and bulk_flux (right) modes.

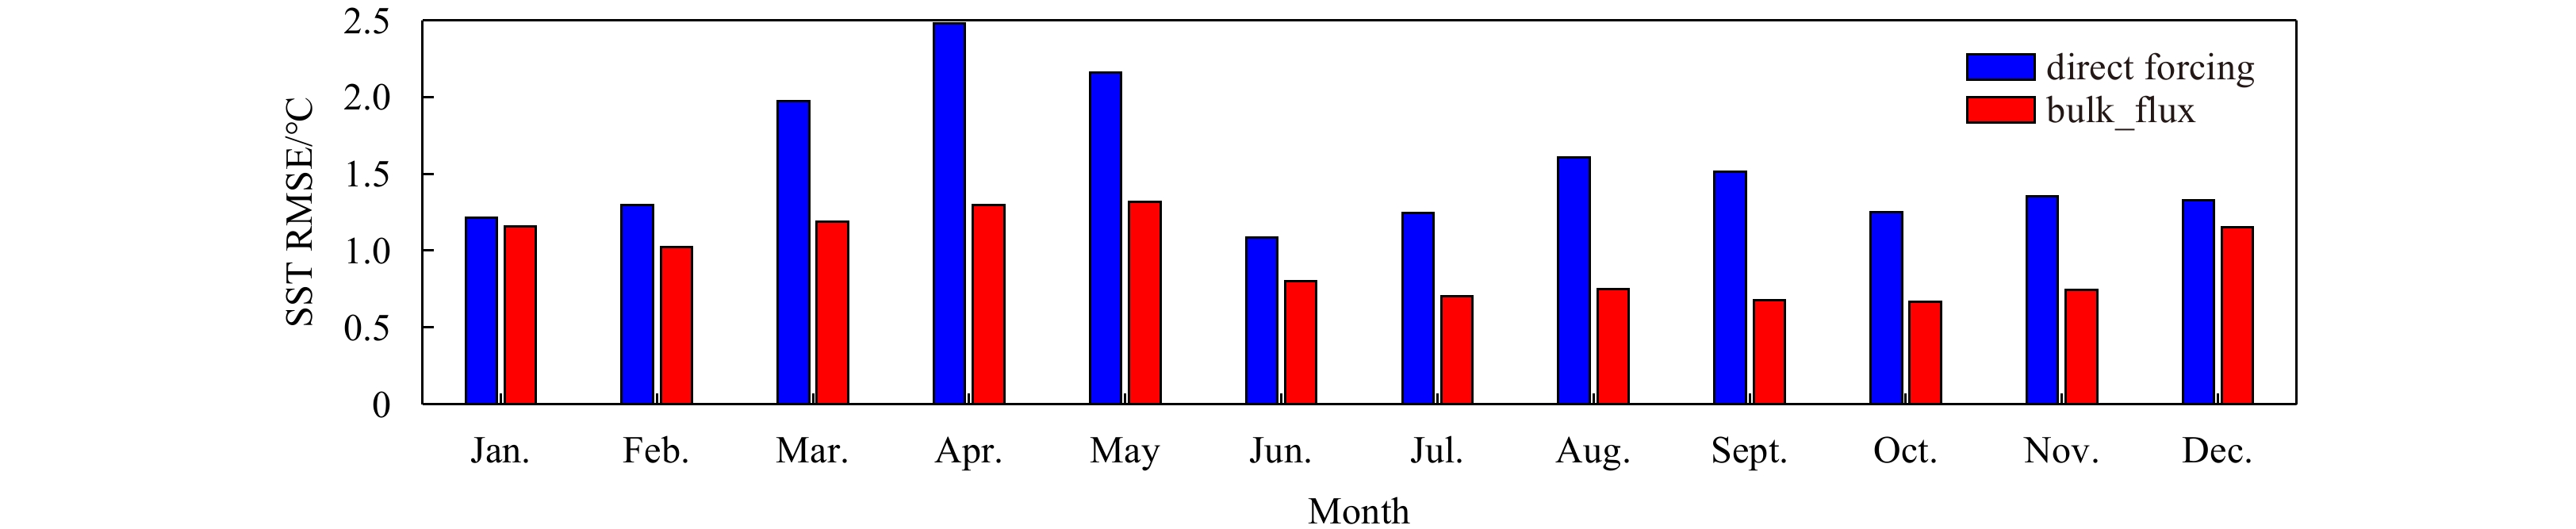
Figure 8. The daily mean (solid lines) and yearly mean (dash lines) time series of domain averaged SST RMSE of each test in 2011.

Figure 9. Velocity field in the day abnormal outflow appeared used Rad-Nud (left) and Clamped (right) boundary option.

Figure 10. Minimum of monthly normal velocity of Tsushima Strait section (34.2°N, 129.48°E–34°N, 129.63°E) using Rad-Nud (red) and Clamped (blue) in eastern boundary condition.

Figure 11. Climatology monthly mean VT through TUS using Rad-Nud condition (red), Clamped condition (blue), calculated results using SLA (black; Takikawa and Yoon, 2005), model results (green) of Zheng et al. (2008) and observations using ADCP (cyan) from Takikawa et al. (2005).

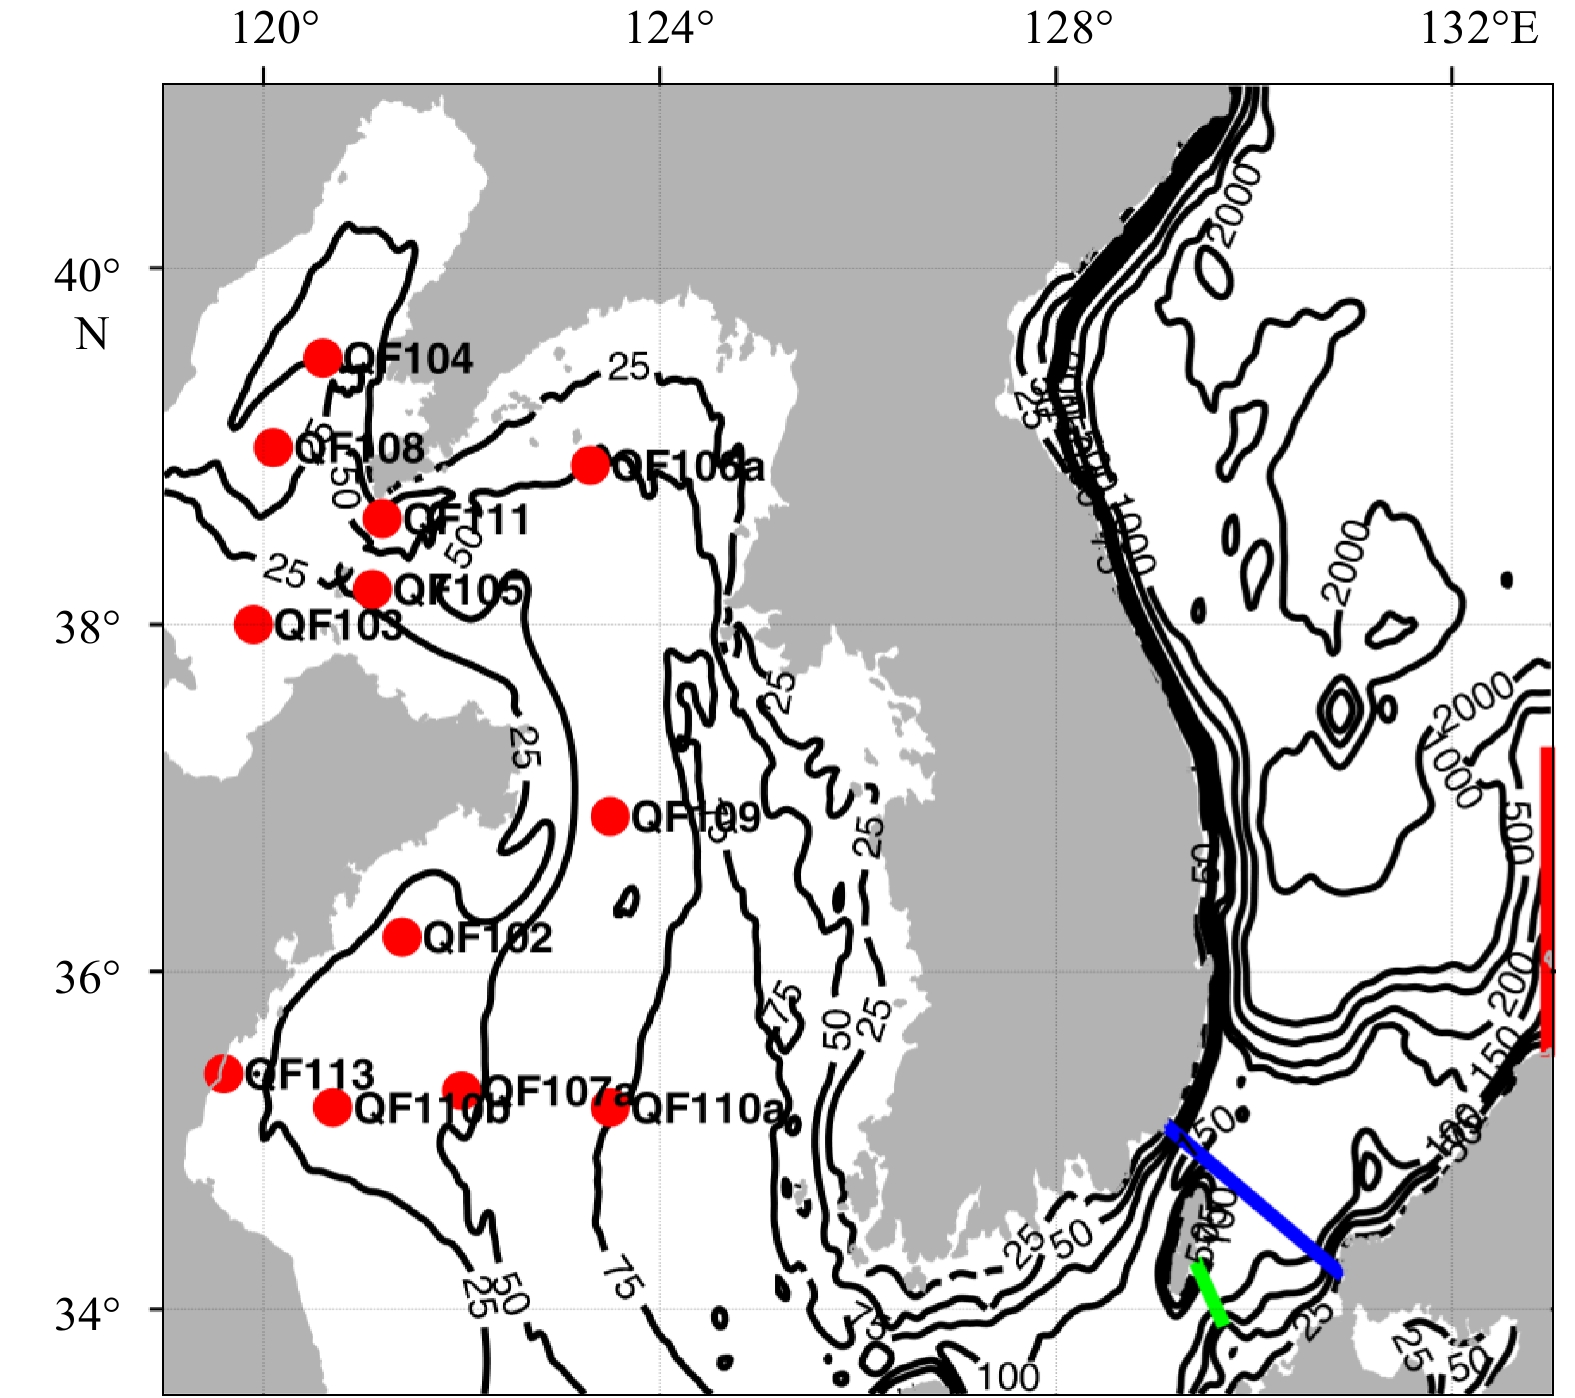
Figure 13. Positions of three sections, the TUS (blue line), eastern channel of the TUS (green line), the eastern lateral boundary (red line), 12 buoy observation stations (red circles) and bathymetry (black lines, m) in the BS, the YS, the TUS and southern Japan Sea.

Figure 14. Monthly mean VT time series through the TUS (a), eastern channel of the TUS (b), and the eastern lateral boundary (c).

Figure 15. Normal velocity across the TUS (a, b), eastern channel of the TUS (c, d) and eastern lateral boundary (e, f) in December, 1985 using Rad-Nud (a, c, e) and Clamped (b, d, f) condition at eastern open boundary.

Figure 16. Simulated SLA with (left) and without (right) air pressure correction in January (a, b), April (c, d), July (e, f) and October (g, h).

Figure 17. Monthly mean air pressure differences between the air pressure at sea surface and the standard air pressure (1013.25 hPa) in January (a), April (b), July (c) and October (d) of 2017.

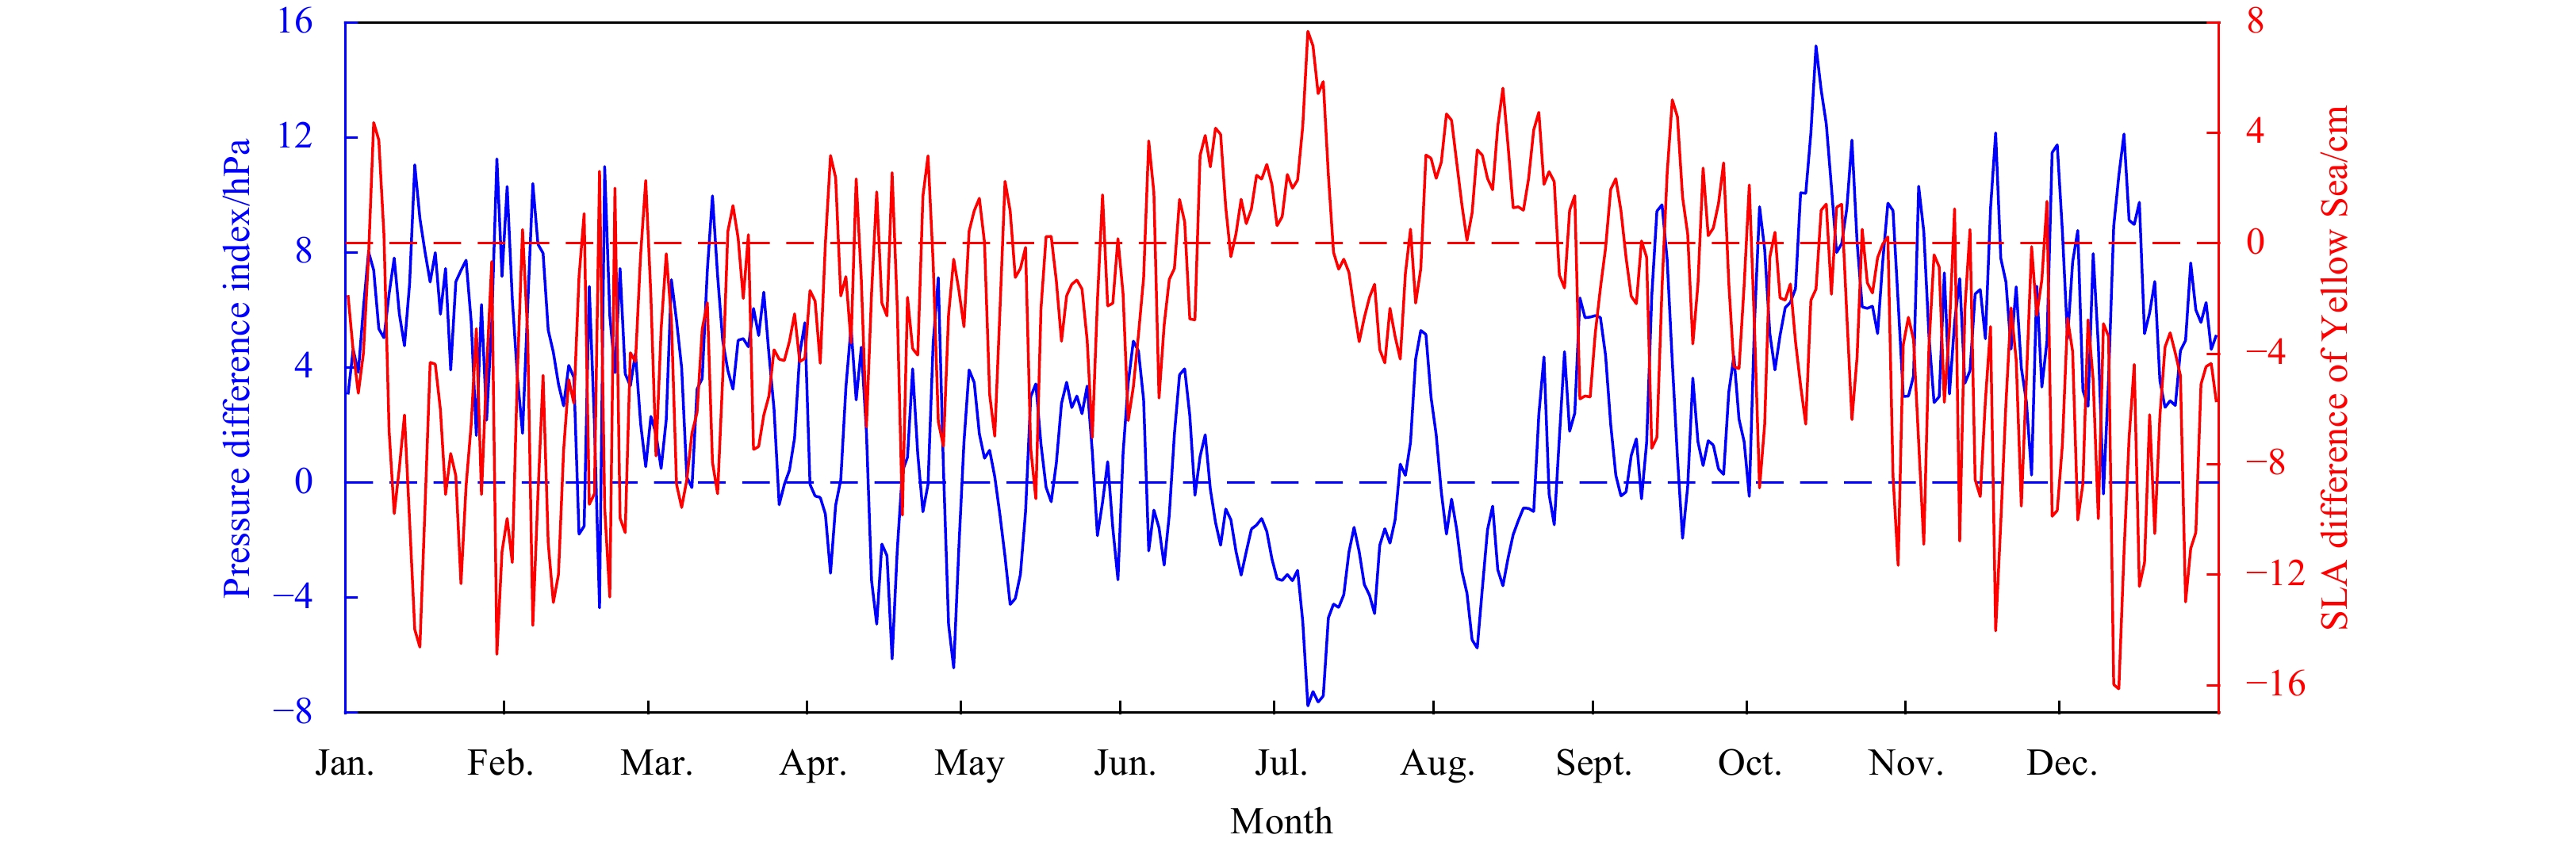
Figure 18. Daily air pressure difference index between the YS and area out of YS (blue), and SLA difference of YS area between before and after air pressure correction considered (red) in 2017.

Figure 19. Daily mean VT difference of through 34.5°N section in 2017 between experiments with and without atmospheric pressure correction.

Figure 20. The time series of domain averaged RMSE of forecasting SST in the 1st to 5th day (black, red, blue, green and cyan, respectively) before (circles) and after (asterisks) system improvement in 2017.
Table 1. Absolute mean errors of amplitude (cm) and phase (°) between measured data and simulated results for both before and after model improvements
Tidal components Harmonic constants Absolute mean error Before After M2 Amp/cm 11.0 11.2 Pha/(°) 9.8 7.3 S2 Amp/cm 4.4 4.9 Pha/(°) 8.9 7.9 K1 Amp/cm 3.6 2.5 Pha/(°) 8.6 6.3 O1 Amp/cm 2.4 1.8 Pha/(°) 6.5 6.3  下载: 导出CSV
Table 2. Experiment configurations and annual mean RMSE of SST
Test Forcing mode Correction EnOI Annual mean RMSE/°C 1 Direct forcing × × 1.75 2 Direct forcing √ × 1.30 3 Direct forcing × √ 1.16 4 Direct forcing √ √ 0.98 5 Bulk_flux √ × 1.06
下载: 导出CSV
Table 3. RMSE of monthly mean VT through TUS by comparing Clamped and Rad-Nud boundary conditions with different observed data
Observation type Observations using ADCP/Sv Calculated results using SLA/Sv Model results of Zheng et al. (2008)/Sv Clamped 0.55 0.47 0.27 Rad-Nud 0.82 0.73 0.72
下载: 导出CSV
Table 4. The annual mean RMSE (℃) of forecasting SST at each buoy position before and after system improvement in 5 d
1st day 2nd day 3rd day 4th day 5th day Before After Before After Before After Before After Before After QF102 1.30 0.99 1.35 0.94 1.38 0.93 1.37 0.92 1.41 0.98 QF103 0.88 0.66 0.91 0.69 0.95 0.69 0.91 0.72 0.90 0.72 QF104 0.91 0.78 0.94 0.79 0.91 0.74 0.95 0.79 0.89 0.82 QF105 0.90 0.73 0.89 0.73 0.92 0.72 0.97 0.84 0.97 0.86 QF106a 1.21 1.13 1.27 1.24 1.22 1.09 1.18 1.28 1.22 1.37 QF107a 1.40 0.85 1.32 0.85 1.26 0.85 1.29 0.80 1.45 0.89 QF108 1.10 0.58 1.13 0.64 1.20 0.67 1.13 0.70 1.13 0.74 QF109 1.13 0.66 1.08 0.67 1.09 0.70 1.01 0.76 1.09 0.82 QF110a 1.19 0.65 1.20 0.73 1.27 0.68 1.24 0.71 1.20 0.71 QF110b 1.13 0.52 1.12 0.51 1.15 0.54 1.19 0.51 1.20 0.47 QF111 1.01 0.63 1.04 0.68 1.09 0.67 1.09 0.65 1.12 0.80 QF113 1.10 1.14 1.20 1.14 1.18 1.18 1.25 1.18 1.12 1.18 Average 1.01 0.78 1.12 0.80 1.14 0.79 1.13 0.82 1.14 0.86
下载: 导出CSV
Table 5. The annual mean RMSE (°C) of forecasting SST before and after system improvement in 5 d
Forecast day 1st day 2nd day 3rd day 4th day 5th day Before 1.24 1.25 1.28 1.30 1.29 After 1.00 1.03 1.08 1.11 1.12
下载: 导出CSV
-
[1] Bell M J, Schiller A, Le Traon P Y, et al. 2015. An introduction to GODAE OceanView. Journal of Operational Oceanography, 8(S1): s2–s11. doi: 10.1080/1755876X.2015.1022041 [2] Chen Changsheng, Beardsley R C, Cowles G, et al. 2013. An Unstructured Grid, Finite-Volume Community Ocean Model FVCOM User Manual. 3rd ed. New Bedford: University of Massachusetts Dartmouth [3] Drévillon M, Greiner E, Paradis D, et al. 2013. A strategy for producing refined currents in the Equatorial Atlantic in the context of the search of the AF447 wreckage. Ocean Dynamics, 63(1): 63–82. doi: 10.1007/s10236-012-0580-2 [4] Egbert G D, Erofeeva S Y. 2002. Efficient inverse modeling of barotropic ocean tides. Journal of Atmospheric and Oceanic Technology, 19(2): 183–204. doi: 10.1175/1520-0426(2002)019<0183:EIMOBO>2.0.CO;2 [5] Evensen G. 2003. The Ensemble Kalman Filter: theoretical formulation and practical implementation. Ocean Dynamics, 53(4): 343–367. doi: 10.1007/s10236-003-0036-9 [6] Fairall C W, Bradley E F, Hare J E, et al. 2003. Bulk parameterization of air-sea fluxes: updates and verification for the COARE algorithm. Journal of Climate, 16(4): 571–591. doi: 10.1175/1520-0442(2003)016<0571:BPOASF>2.0.CO;2 [7] Fang Guohong, Zhao Baoren, Zhu Yaohua. 1991. Water volume transport through the taiwan strait and the continental skelf of the east china sea measured with current meters. Elsevier Oceanography Series, 54: 345–358. doi: 10.1016/S0422-9894(08)70107-7 [8] Fang Guohong, Zheng Wenzhen, Chen Zongyong, et al. 1986. Analysis and Forecasting of Tides and Tidal Currents (in Chinese). Beijing: China Ocean Press [9] Graham R J, Gordon M, Mclean P J, et al. 2005. A performance comparison of coupled and uncoupled versions of the Met Office seasonal prediction general circulation model. Tellus A: Dynamic Meteorology and Oceanography, 57(3): 320–339. doi: 10.3402/tellusa.v57i3.14666 [10] Guan Bingxian. 1994. Patters and structures of the currents in Bohai, Huanghai and East China Seas. In: Oceanology of China Seas. Kluwer Academic Publishers, 17–26 [11] Guan Bingxian. 2002. Winter Counter-wind Current off the Southeastern China Coast (in Chinese). Qingdao: China Ocean University Press [12] Hellerman S, Rosenstein M. 1983. Normal monthly wind stress over the world ocean with error estimates. Journal of Physical Oceanography, 13(7): 1093–1104. doi: 10.1175/1520-0485(1983)013<1093:NMWSOT>2.0.CO;2 [13] Hsueh Y, Wang J, Chern C S. 1992. The intrusion of the Kuroshio across the continental shelf northeast of Taiwan. Journal of Geophysical Research, 97(C9): 14323–14330. doi: 10.1029/92JC01401 [14] Hu Dunxin, Ding Zongxin, Xiong Qingcheng. 1980. A preliminary investigation of cyclonic eddy in North East China Sea in summer. Chinese Science Bulletin, 25(1–2): 57–60 [15] Isobe A. 1994. Seasonal variability of the barotropic and baroclinic motion in the Tsushima-Korea Strait. Journal of Oceanography, 50(2): 223–238. doi: 10.1007/BF02253481 [16] Ji Qiyan, Zhu Xueming, Wang Hui, et al. 2015. Assimilating operational SST and sea ice analysis data into an operational circulation model for the coastal seas of China. Acta Oceanologica Sinica, 34(7): 54–64. doi: 10.1007/s13131-015-0691-y [17] Katoh O. 1994. Structure of the tsushima current in the southwestern Japan Sea. Journal of Oceanography, 50(3): 317–338. doi: 10.1007/–BF02239520 [18] Kourafalou V H, De Mey P, Le Hénaff M, et al. 2015. Coastal Ocean Forecasting: system integration and evaluation. Journal of Operational Oceanography, 8(S1): s127–s146. doi: 10.1080/1755876X.2015.1022336 [19] Le Kentang. 1984. A preliminary study of the path of the Changjiang dluted water: I. Model. Oceanologia et Limnologia Sinica (in Chinese), 15(2): 157–166 [20] Le Kentang. 1989. A preliminary study of the path of the changjiang dluted water: II. The effect of local wind on the path. Oceanologia et Limnologia Sinica (in Chinese), 20(2): 139–148 [21] Lea D, Mirouze I, King R, et al. 2015. The met office coupled atmosphere/land/ocean/sea-ice data assimilation system. In: EGU General Assembly 2015. Vienna, Austria: EGU [22] Li Ang, Zhang Miaoyin, Zhu Xueming, et al. 2019. A research on the optimal approach of CFSR surface flux data correction based on different surface forcing modes. Haiyang Xuebao (in Chinese), 41(11): 51–63 [23] Lima J A M, Martins R P, Tanajura C A S, et al. 2013. Design and implementation of the Oceanographic Modeling and Observation Network (REMO) for operational oceanography and ocean forecasting. Revista Brasileira de Geofísica, 31(2): 209–228. doi: 10.22564/rbgf.v31i2.290 [24] Lin Xiaopei, Yang Jiayan. 2011. An asymmetric upwind flow, Yellow Sea Warm Current: 2. Arrested topographic waves in response to the northwesterly wind. Journal of Geophysical Research, 116(C4): C04027. doi: 10.1029/2010JC006514 [25] Lin Xiaopei, Yang Jiayan, Guo Jingsong, et al. 2011. An asymmetric upwind flow, Yellow Sea Warm Current: 1. New observations in the western Yellow Sea. Journal of Geophysical Research, 116(C4): C04026. doi: 10.1029/2010JC006513 [26] Lü Xingang, Qiao Fangli, Xia Changshui, et al. 2010. Upwelling and surface cold patches in the Yellow Sea in summer: effects of tidal mixing on the vertical circulation. Continental Shelf Research, 30(6): 620–632. doi: 10.1016/j.csr.2009.09.002 [27] Marchesiello P, McWilliams J C, Shchepetkin A. 2001. Open boundary conditions for long-term integration of regional oceanic models. Ocean Modelling, 3(1–2): 1–20. doi: 10.1016/S1463-5003(00)00013-5 [28] Martin M J, Hines A, Bell M J. 2007. Data assimilation in the FOAM operational short-range ocean forecasting system: a description of the scheme and its impact. Quarterly Journal of the Royal Meteorological Society, 133(625): 981–995. doi: 10.1002/qj.74 [29] Mehra A, Rivin I. 2010. A real time ocean forecast system for the North Atlantic Ocean. Terrestrial, Atmospheric and Oceanic Sciences, 21(1): 211–228. doi: 10.3319/tao.2009.04.16.01(iwnop) [30] Mo Dongxue, Hou Yijun, Li Jian, et al. 2016. Study on the storm surges induced by cold waves in the Northern East China Sea. Journal of Marine Systems, 160: 26–39. doi: 10.1016/j.jmarsys.2016.04.002 [31] Oddo P, Adani M, Pinardi N, et al. 2009. A nested atlantic-mediterranean sea general circulation model for operational forecasting. Ocean Science, 5(4): 461–473. doi: 10.5194/os-5-461-2009 [32] Reynolds R W, Smith T M, Liu Chunying, et al. 2007. Daily high-resolution-blended analyses for sea surface temperature. Journal of Climate, 20(22): 5473–5496. doi: 10.1175/2007JCLI1824.1 [33] Saha S, Moorthi S, Pan Hualu, et al. 2010. The NCEP climate forecast system reanalysis. Bulletin of the American Meteorological Society, 91(8): 1015–1057. doi: 10.1175/2010BAMS3001.1 [34] Shchepetkin A F, McWilliams J C. 2003. A method for computing horizontal pressure-gradient force in an oceanic model with a nonaligned vertical coordinate. Journal of Geophysical Research, 108(C3): 3090. doi: 10.1029/2001JC001047 [35] Shchepetkin A F, McWilliams J C. 2005. The Regional Oceanic Modeling System (ROMS): A split-explicit, free-surface, topography-following-coordinate oceanic model. Ocean Modelling, 9(4): 347–404. doi: 10.1016/j.ocemod.2004.08.002 [36] Shi Zhen, Li Xiang, Liu Na. 2016. Effects of different temporal resolution of wind and thermal forcing on simulated global ocean temperature. Marine Forecasts (in Chinese), 33(6): 1–9. doi: 10.11737/j.issn.1003-0239.2016.06.001 [37] Storkey D, Blockley E W, Furner R, et al. 2010. Forecasting the ocean state using NEMO: The new FOAM system. Journal of Operational Oceanography, 3(1): 3–15. doi: 10.1080/1755876X.2010.11020109 [38] Sun Xiangping, Xiu Shumeng. 1997. Analysis on the cold eddies in the sea area northeast of Taiwan. Marine Science Bulletin (in Chinese), 16(2): 1–10 [39] Takikawa T, Yoon J H. 2005. Volume transport through the tsushima straits estimated from sea level difference. Journal of Oceanography, 61(4): 699–708. doi: 10.1007/s10872-005-0077-4 [40] Takikawa T, Yoon J H, Cho K D. 2005. The tsushima warm current through Tsushima Straits estimated from ferryboat ADCP Data. Journal of Physical Oceanography, 35(6): 1154–1168. doi: 10.1175/jpo2742.1 [41] Tang Yuxiang, Zou Emei, Lie H J, et al. 2000. Some features of circulation in the southern Huanghai Sea. Haiyang Xuebao (in Chinese), 22(1): 1–16. doi: 10.3321/j.issn:0253-4193.2000.01.001 [42] Tang Yuxiang, Zou Emei, Lie H J. 2001. On the origin and path of the Huanghai Warm Current during winter and early spring. Haiyang Xuebao (in Chinese), 23(1): 1–12. doi: 10.3321/j.issn:0253-4193.2001.01.001 [43] Teague W J, Jacobs G A, Perkins H T, et al. 2002. Low-frequency current observations in the Korea/Tsushima Strait. Journal of Physical Oceanography, 32(6): 1621–1641. doi: 10.1175/1520-0485(2002)032<1621:LFCOIT>2.0.CO;2 [44] Tonani M, Balmaseda M, Bertino L, et al. 2015. Status and future of global and regional ocean prediction systems. Journal of Operational Oceanography, 8(S2): s201–s220. doi: 10.1080/1755876X.2015.1049892 [45] Usui N, Ishizaki S, Fujii Y, et al. 2006. Meteorological Research Institute multivariate ocean variational estimation (MOVE) system: Some early results. Advances in Space Research, 37(4): 806–822. doi: 10.1016/j.asr.2005.09.022 [46] Usui N, Wakamatsu T, Tanaka Y, et al. 2017. Four-dimensional variational ocean reanalysis: a 30-year high-resolution dataset in the western North Pacific (FORA-WNP30). Journal of Oceanography, 73(2): 205–233. doi: 10.1007/s10872-016-0398-5 [47] Xu Dongyu, Liu Xiqing, Zhang Xunhua, et al. 1997. Geology of China Seas (in Chinese). Beijing: Geology Press [48] Xu Yi, Yu Fei, Zhang Zhixin, et al. 2005. Diagnostic computation of the Yellow Sea Warm Current in winter. Advances in Marine Science (in Chinese), 23(4): 398–407. doi: 10.3969/j.issn.1671-6647.2005.04.002 [49] Yang Dezhou, Yin Baoshu, Liu Zhiliang, et al. 2012. Numerical study on the pattern and origins of Kuroshio branches in the bottom water of southern East China Sea in summer. Journal of Geophysical Research, 117(C2): C02014. doi: 10.1029/2011JC007528 [50] Yang Dezhou, Yin Baoshu, Sun Junchuan, et al. 2013. Numerical study on the origins and the forcing mechanism of the phosphate in upwelling areas off the coast of Zhejiang province, China in summer. Journal of Marine Systems, 123–124: 1–18. doi: 10.1016/j.jmarsys.2013.04.002 [51] Yu Fei, Zhang Zhixin, Diao Xinyuan, et al. 2010. Observational evidence of the Yellow Sea warm current. Chinese Journal of Oceanology and Limnology, 28(3): 677–683. doi: 10.1007/s00343-010-0006-2 [52] Zhang Shuwen, Wang Qingye, Lü Yanhui, et al. 2008. Observation of the seasonal evolution of the Yellow Sea Cold Water Mass in 1996–1998. Continental Shelf Research, 28(3): 442–457. doi: 10.1016/j.csr.2007.10.002 [53] Zheng Peinan, Wu Dexing, Lin Xiaopei. 2008. Simulation and analysis of shelf circulation and its seasonal variability in the tsushima strait. Periodical of Ocean University of China (in Chinese), 38(1): 7–16 [54] Zheng Peinan, Bai Zhipeng, Wu Dexing, et al. 2009. The remote connection of the Taiwan and Tsushima warm currents. Haiyang Xuebao (in Chinese), 31(1): 1–9. doi: 10.3321/j.issn:0253-4193.2009.01.001 [55] Zhu Xueming, Liu Guimei. 2012. Numerical study on the tidal currents, tidal energy fluxes and dissipation in the China Seas. Oceanologia et Limnologia Sinica (in Chinese), 43(3): 669–677 -


 点击查看大图

计量
- 文章访问数: 834
- HTML全文浏览量: 297
- PDF下载量: 36
- 被引次数: 0

