

Radial velocity of ocean surface current estimated from SAR Doppler frequency measurements—a case study of Kuroshio in the East China Sea
-
Abstract: Ocean currents are a key element in ocean processes and in meteorology, affecting material transport and modulating climate change patterns. The Doppler frequency shift information of the synthetic aperture radar (SAR) echo signal can reflect the dynamic characteristics of the sea surface, and has become an essential sea surface dynamic remote sensing parameter. Studies have verified that the instantaneous Doppler frequency shift can realize the SAR detection of the sea surface current. However, the validation of SAR-derived ocean current data and a thorough analysis of the errors associated with them remain lacking. In this study, we derive high spatial resolution flow measurements for the Kuroshio in the East China Sea from SAR data using a theoretical model of shifts in Doppler frequency driven by ocean surface current. Global ocean multi observation (MOB) products and global surface Lagrangian drifter (GLD) data are used to validate the Kuroshio flow retrieved from the SAR data. Results show that the central flow velocity for the Kuroshio derived from the SAR is 0.4–1.5 m/s. The error distribution between SAR ocean currents and MOB products is an approximate standard normal distribution, with the 90% confidence interval concentrated between –0.1 m/s and 0.1 m/s. Comparative analysis of SAR ocean current and GLD products, the correlation coefficient is 0.803, which shows to be significant at a confidence level of 99%. The cross-validation of different ocean current dataset illustrate that the SAR radial current captures the positions and dynamics of the Kuroshio central flow and the Kuroshio Counter Current, and has the capability to monitor current velocity over a wide range of values.
-
Key words:
- Doppler frequency /
- radial velocity /
- ocean current /
- SAR /
- Kuroshio
-
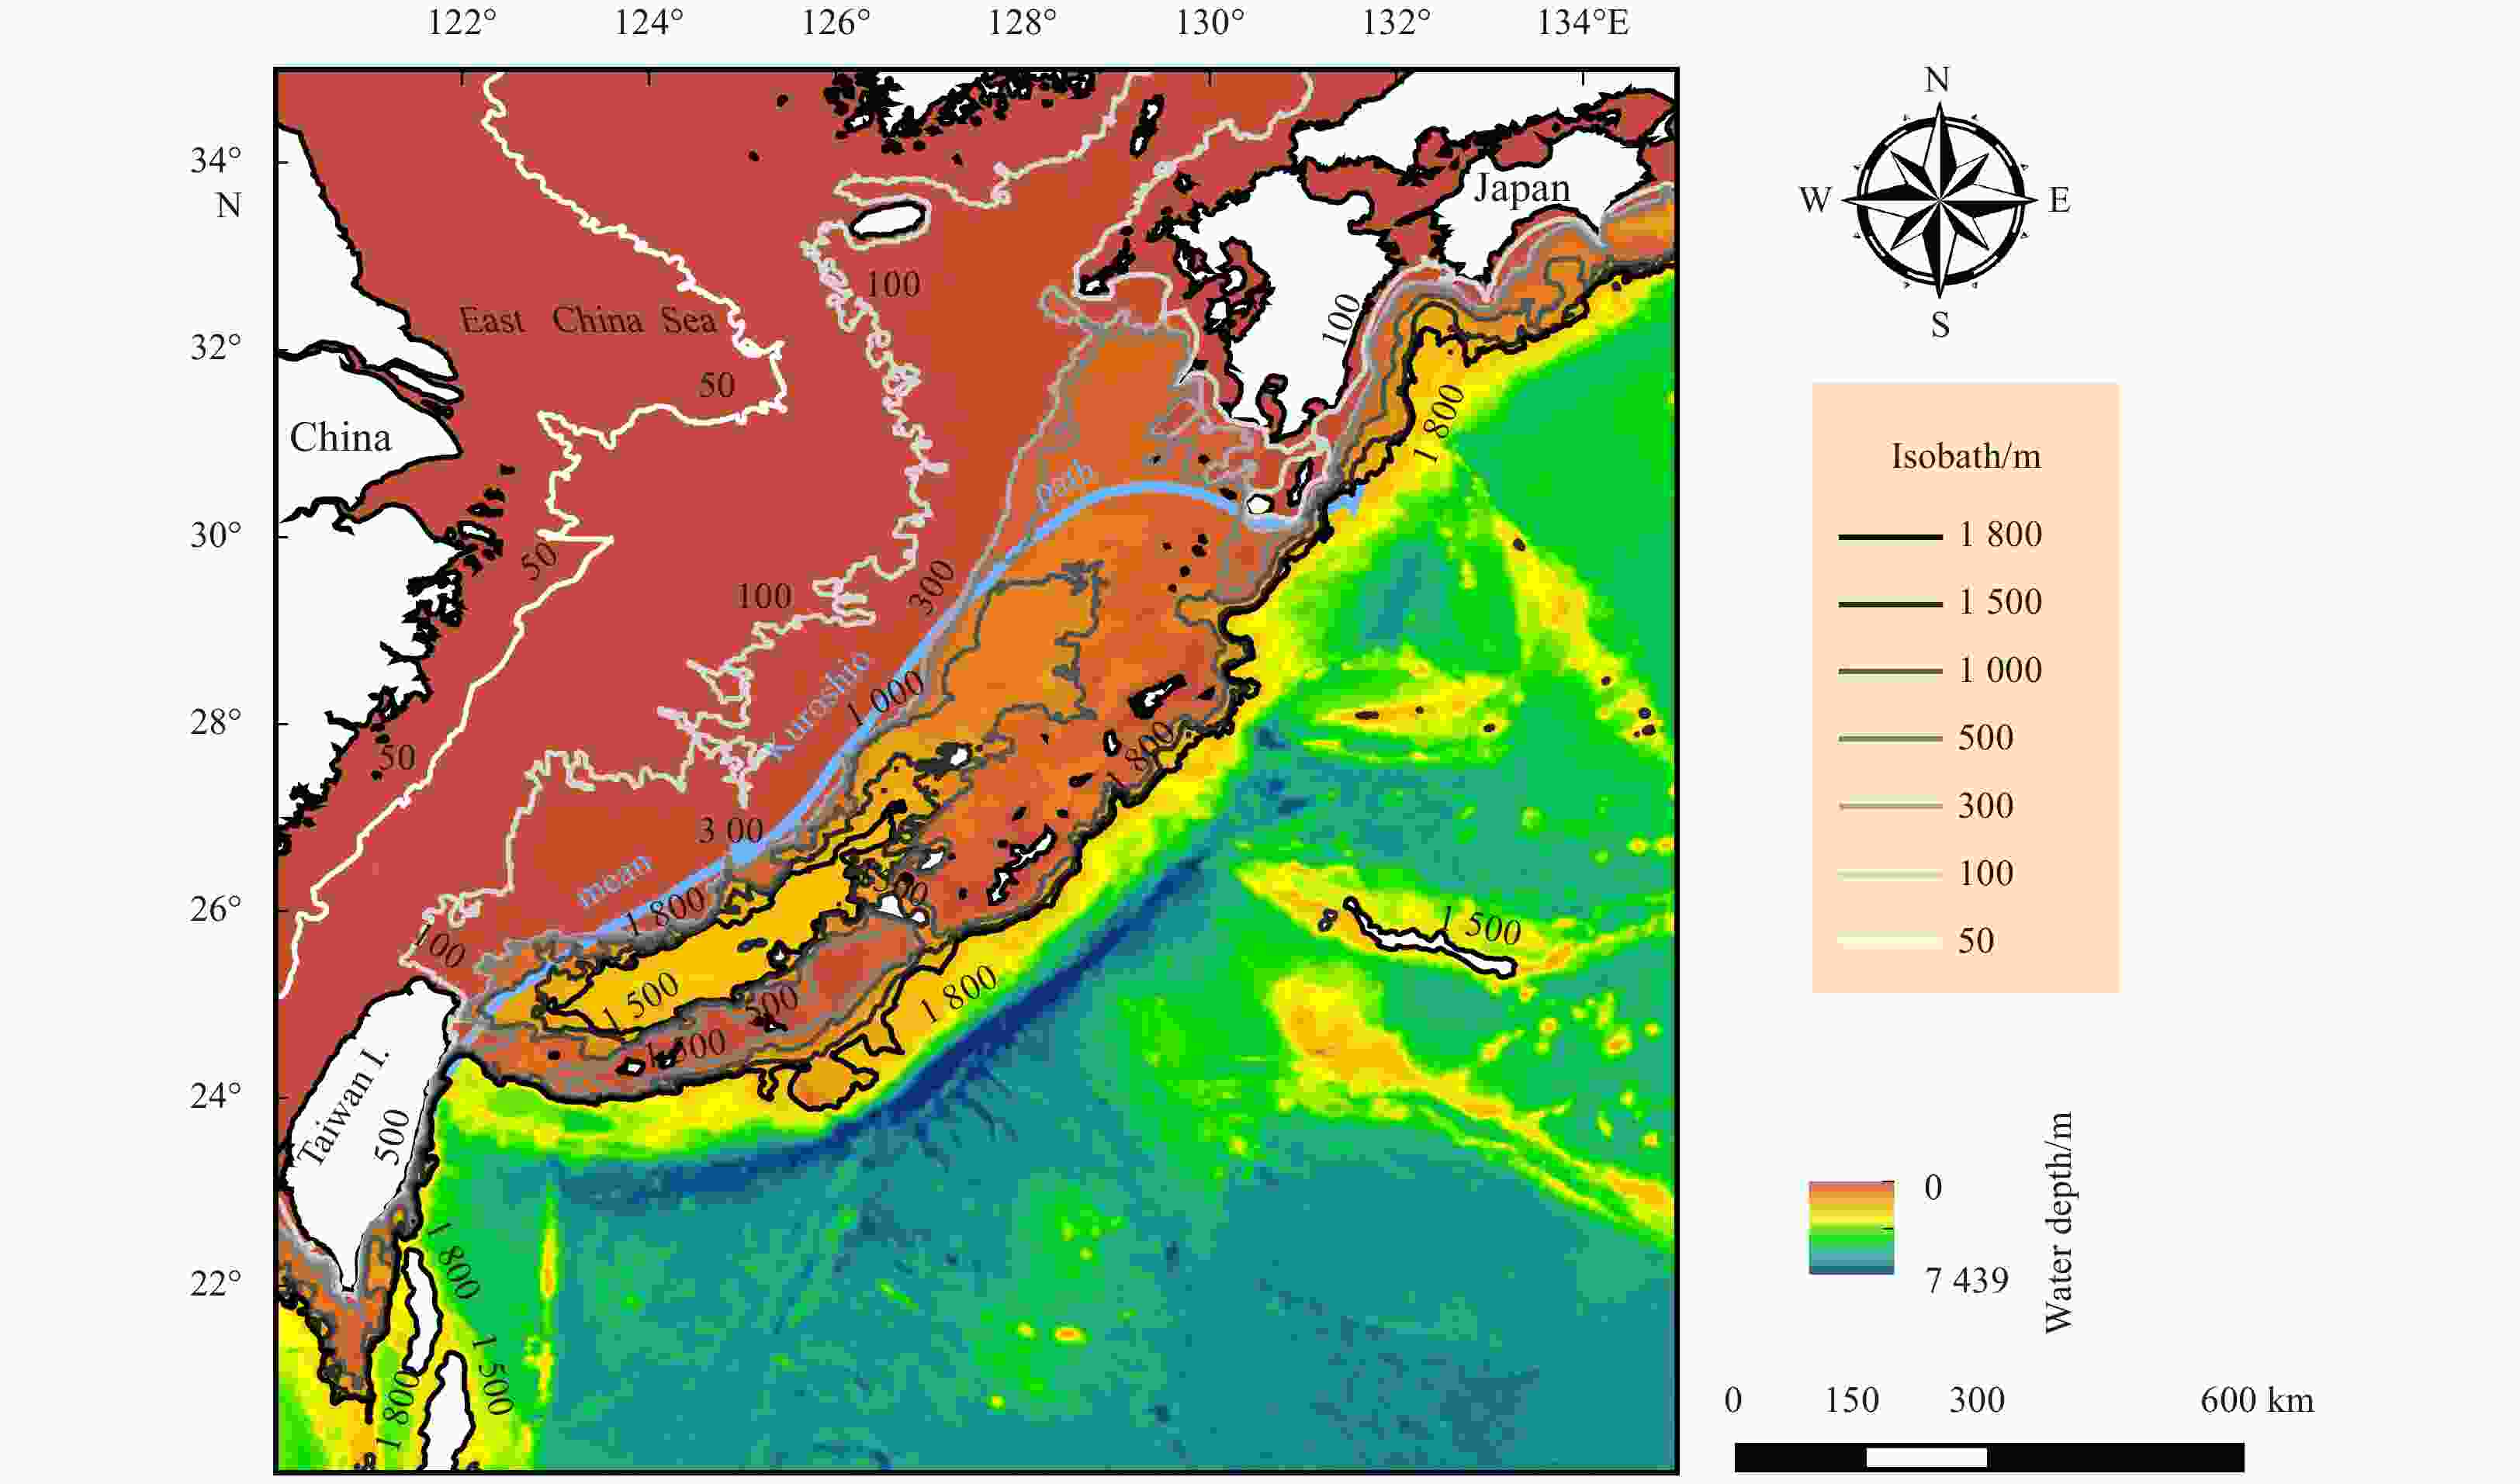
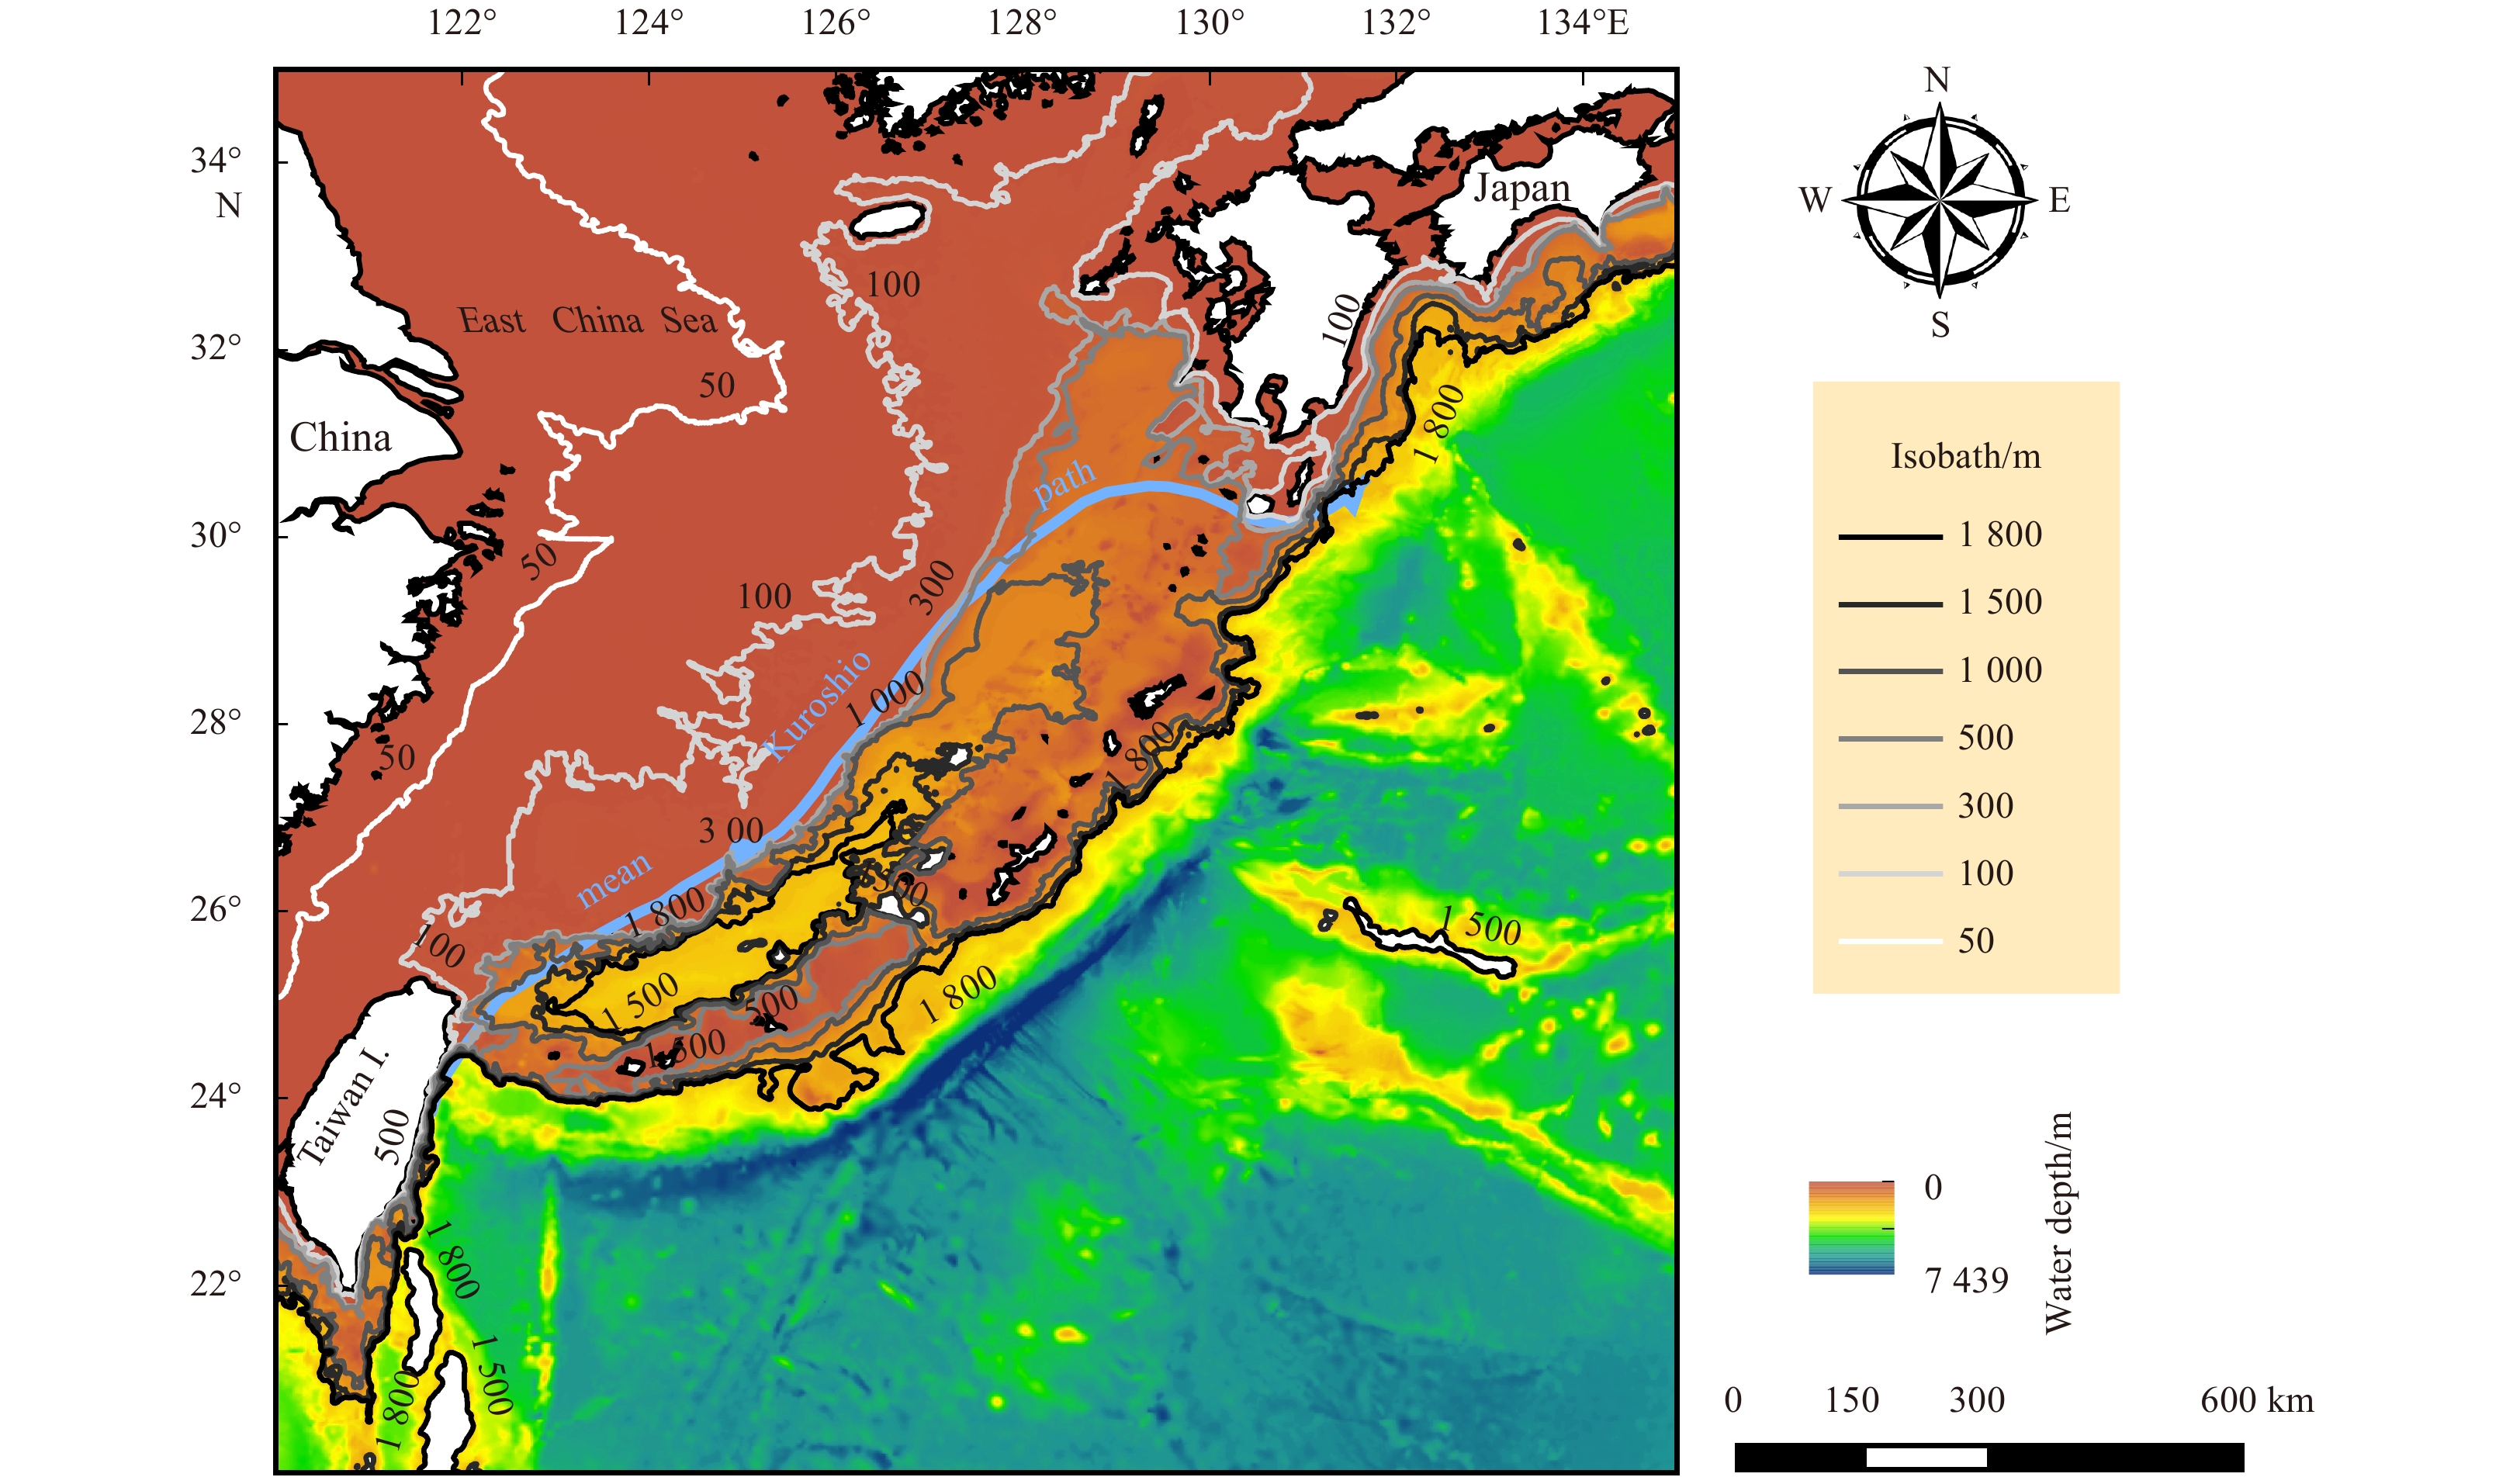
Figure 1. Bathymetry of the East China Sea. The blue line is a schematic representation of the mean path of the Kuroshio, according to Ma et al. (2009), Qiu and Lukas (1996), and Zhuang et al. (2020).
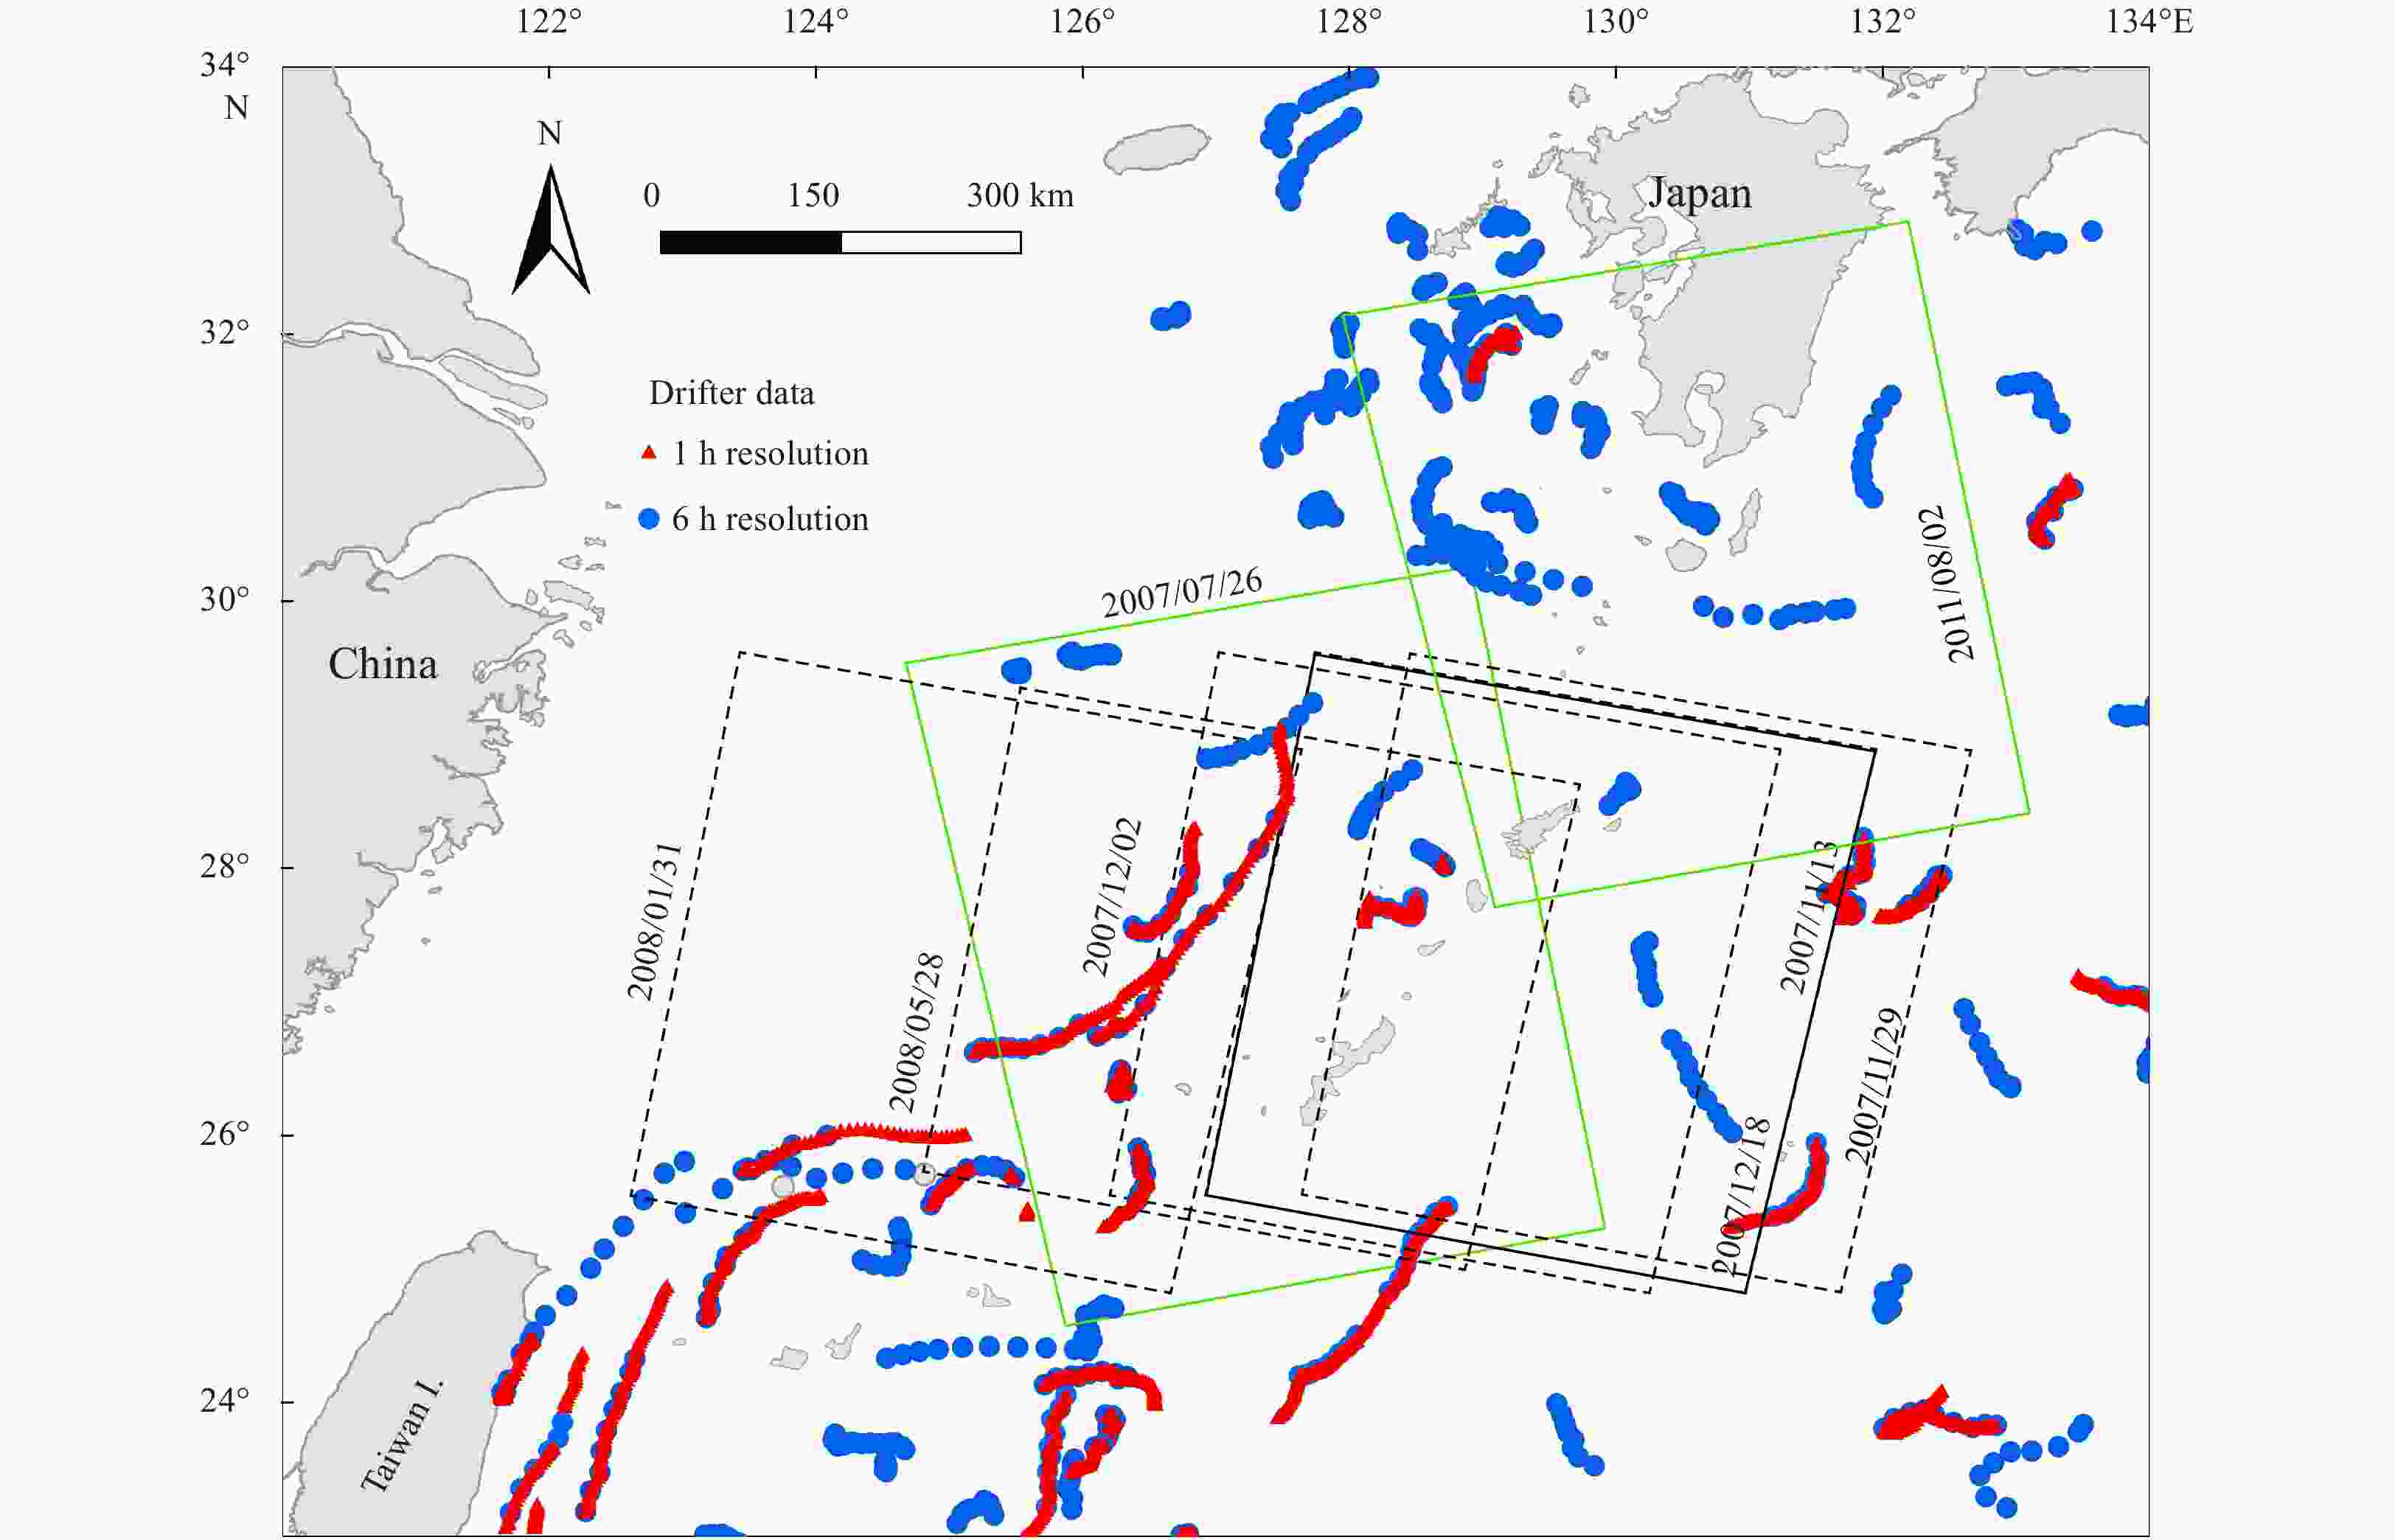
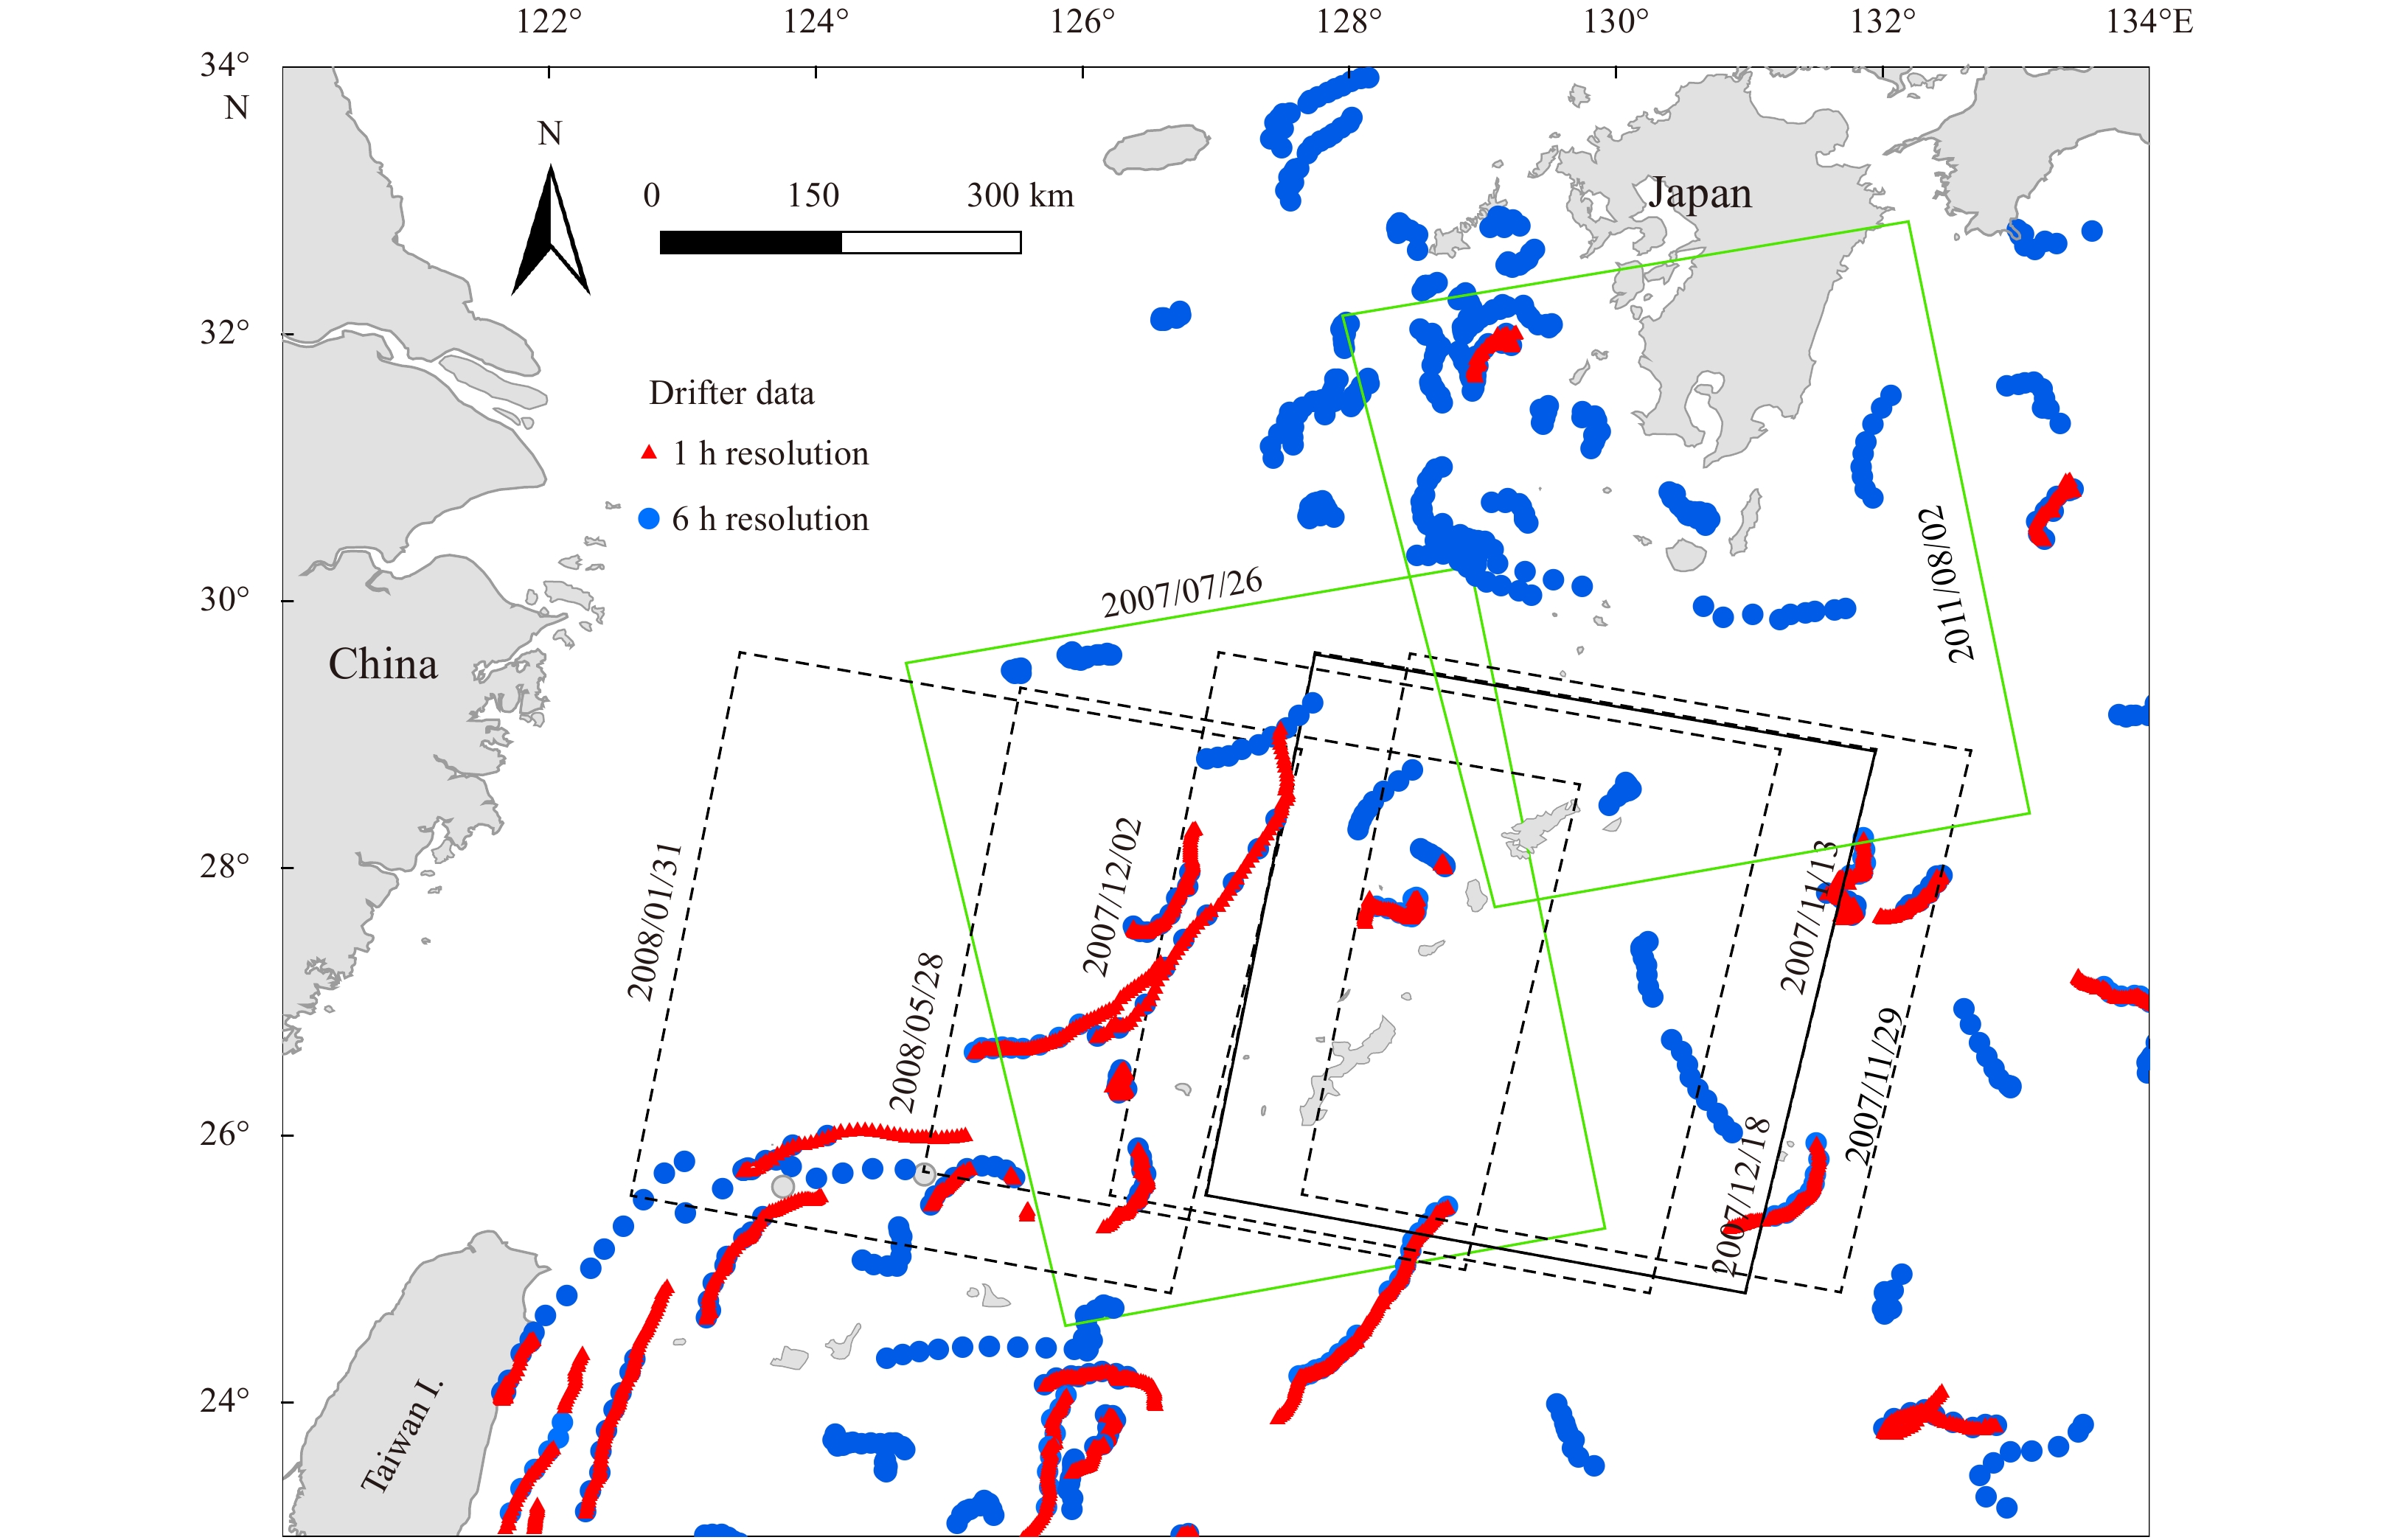
Figure 2. Location of advanced synthetic aperture radar (ASAR) images and surface drifter data. The rectangles show the areas covered by the ASAR images: green and black denote images from ascending and descending orbits, respectively. The dots represent drifter data: red and blue denote data 1-h and 6-h resolutions, respectively.
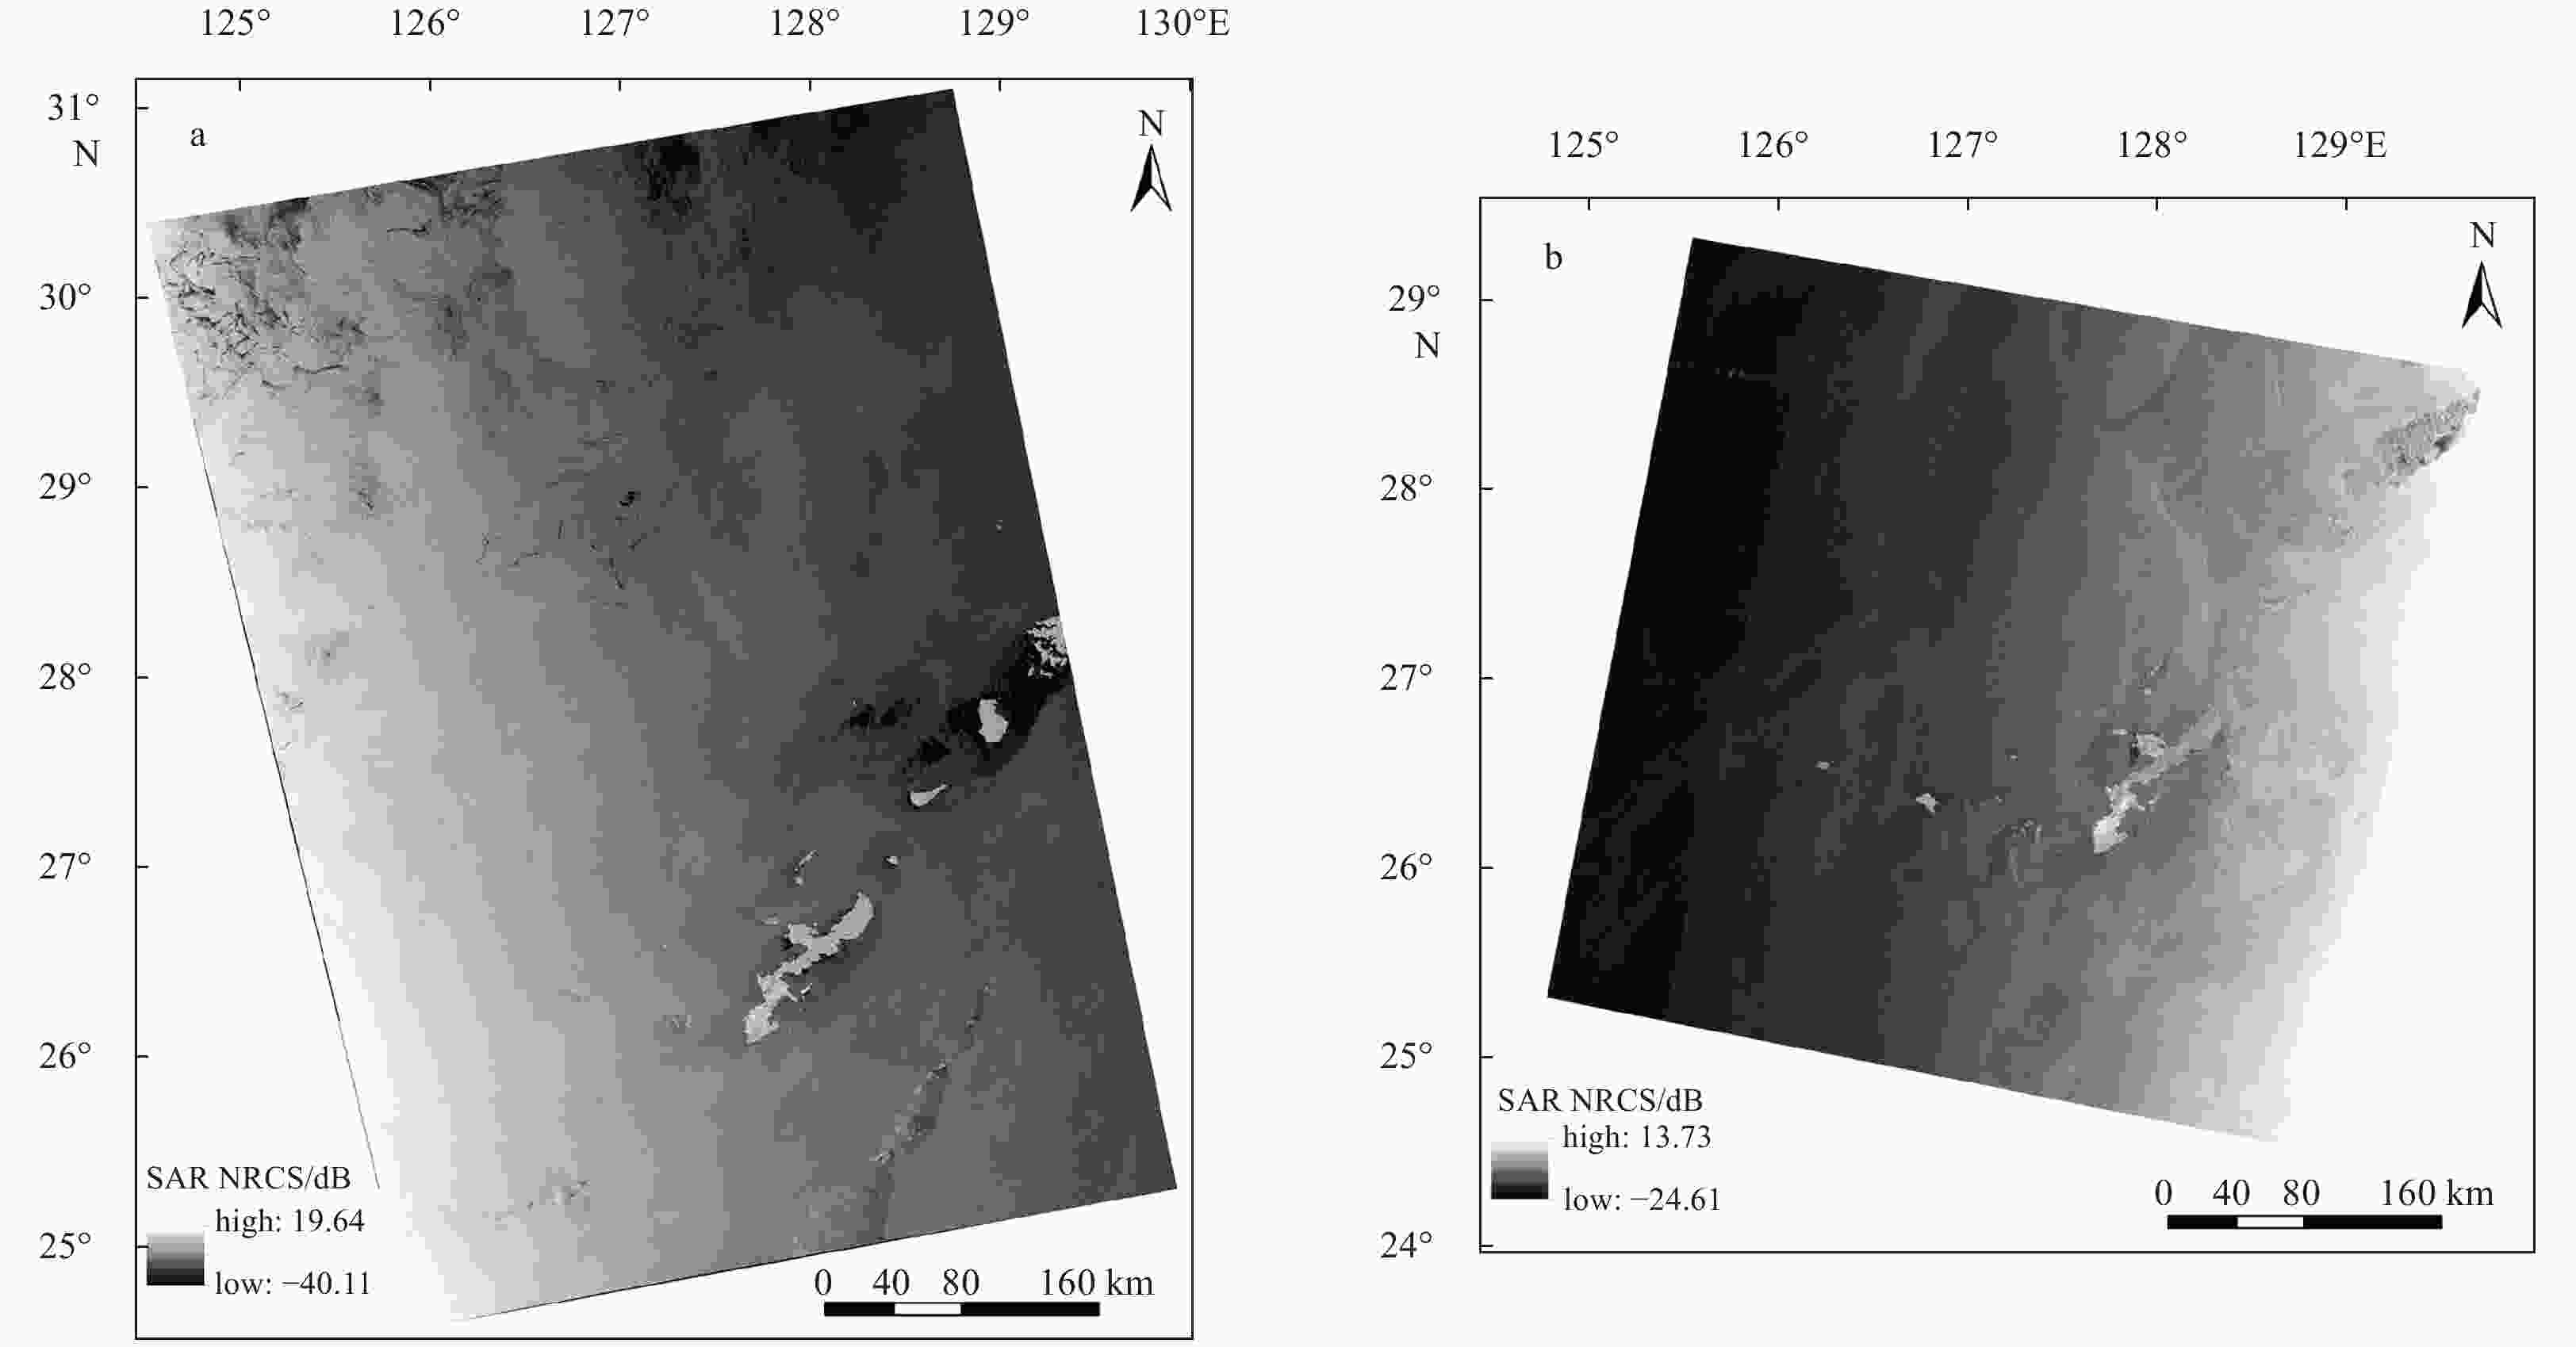
Figure 3. The synthetic aperture radar (SAR) normalized radarcross section (NRCS) image on July 26, 2007 (a), and May 28, 2008 (b).
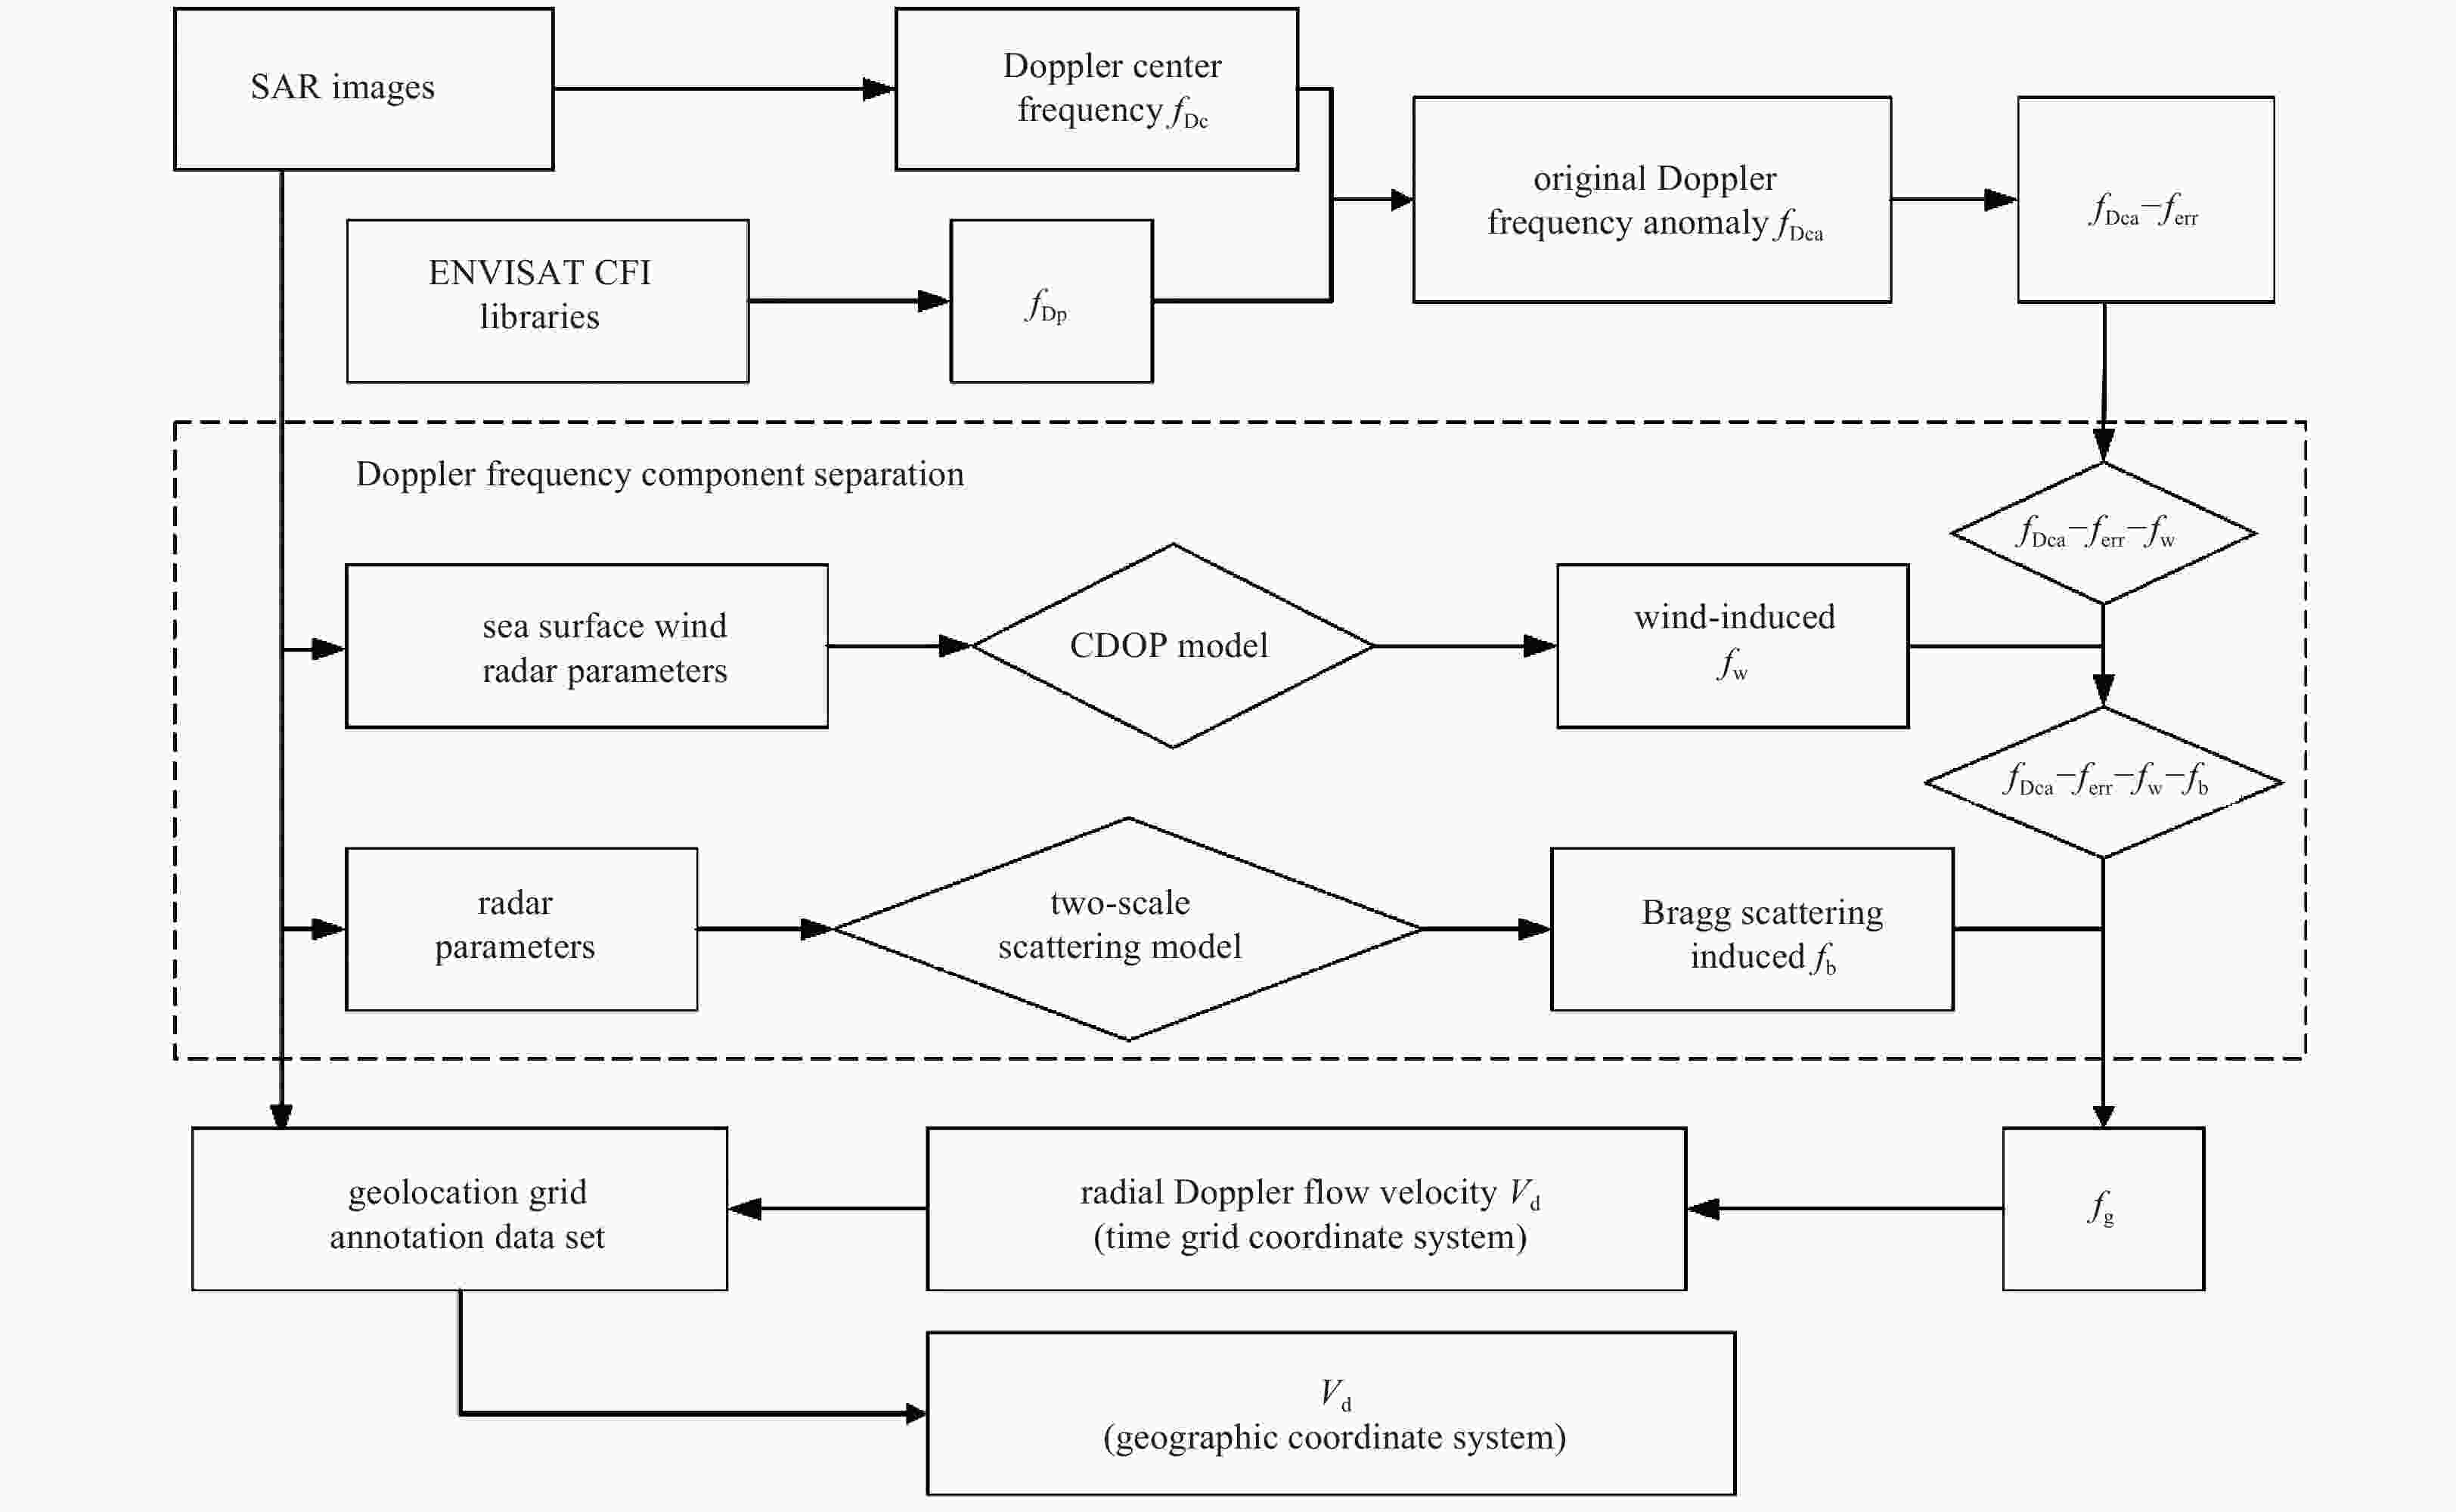
Figure 4. Flow chart of the inversion method for calculating ocean current from synthetic aperture radar (SAR) data based on Doppler frequency theory.
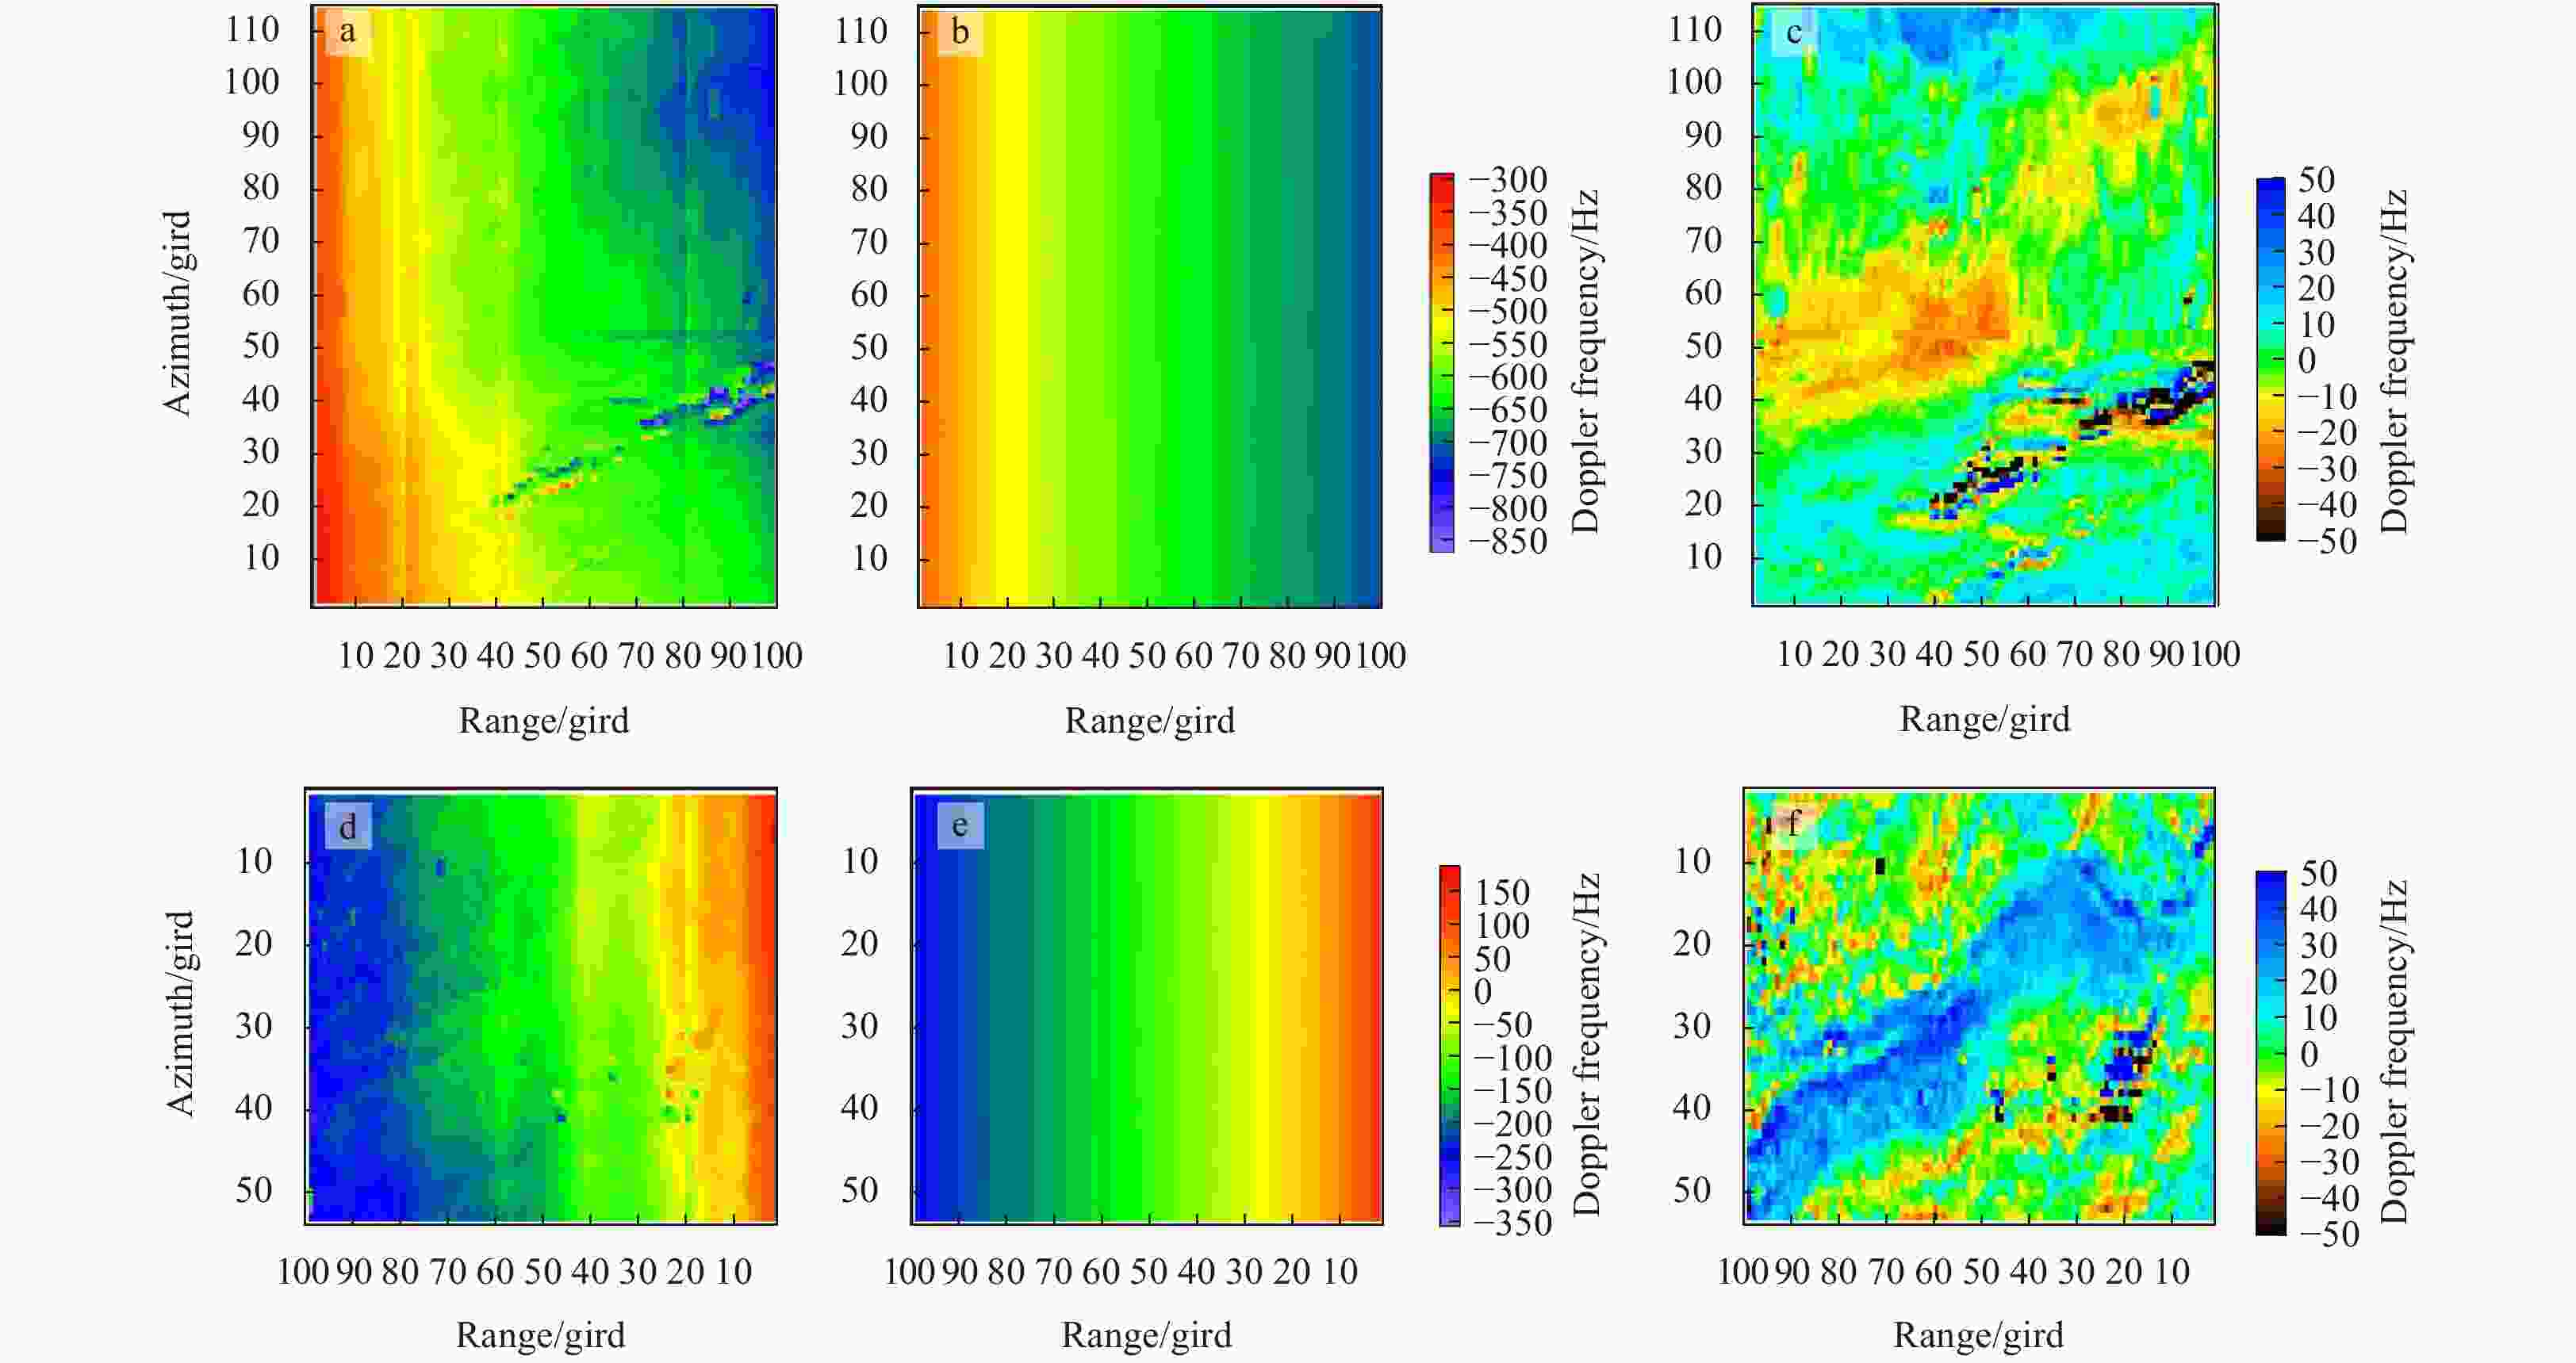
Figure 5. The Doppler centroid grid fDc (a), fDp (b) and fDca (c) from ascending SAR scene on July 26, 2007; and fDc (d), fDp (e) and fDca (f) from SAR descending scene on May 28, 2008.
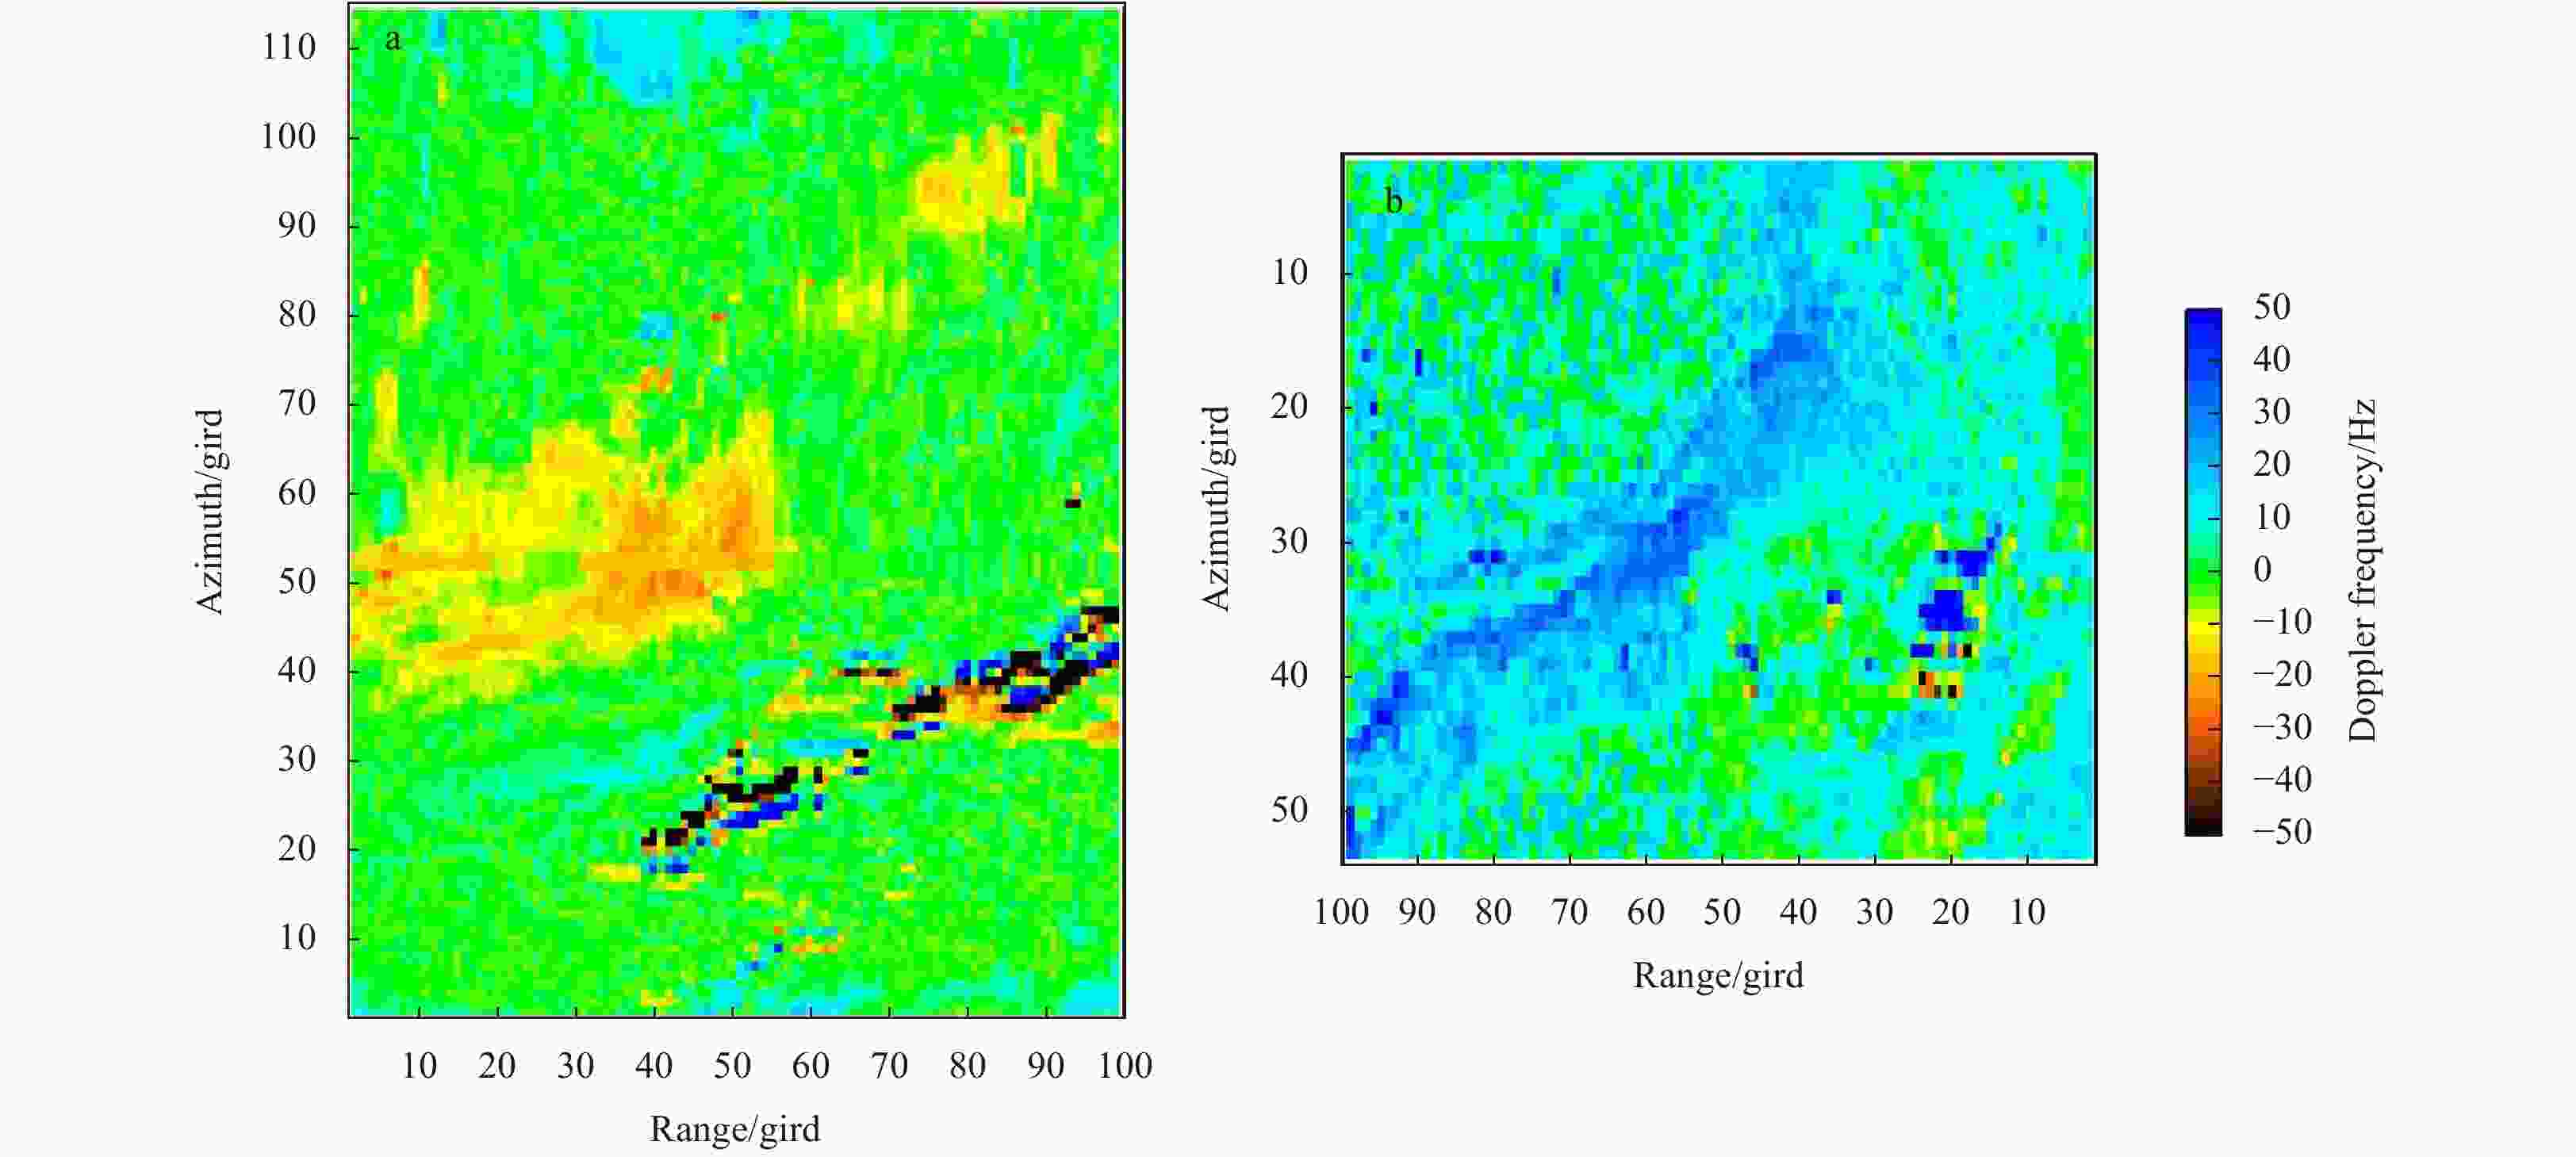
Figure 6. The geophysical Doppler frequency anomaly fg on July 26, 2007 (a), and on May 28, 2008 (b).
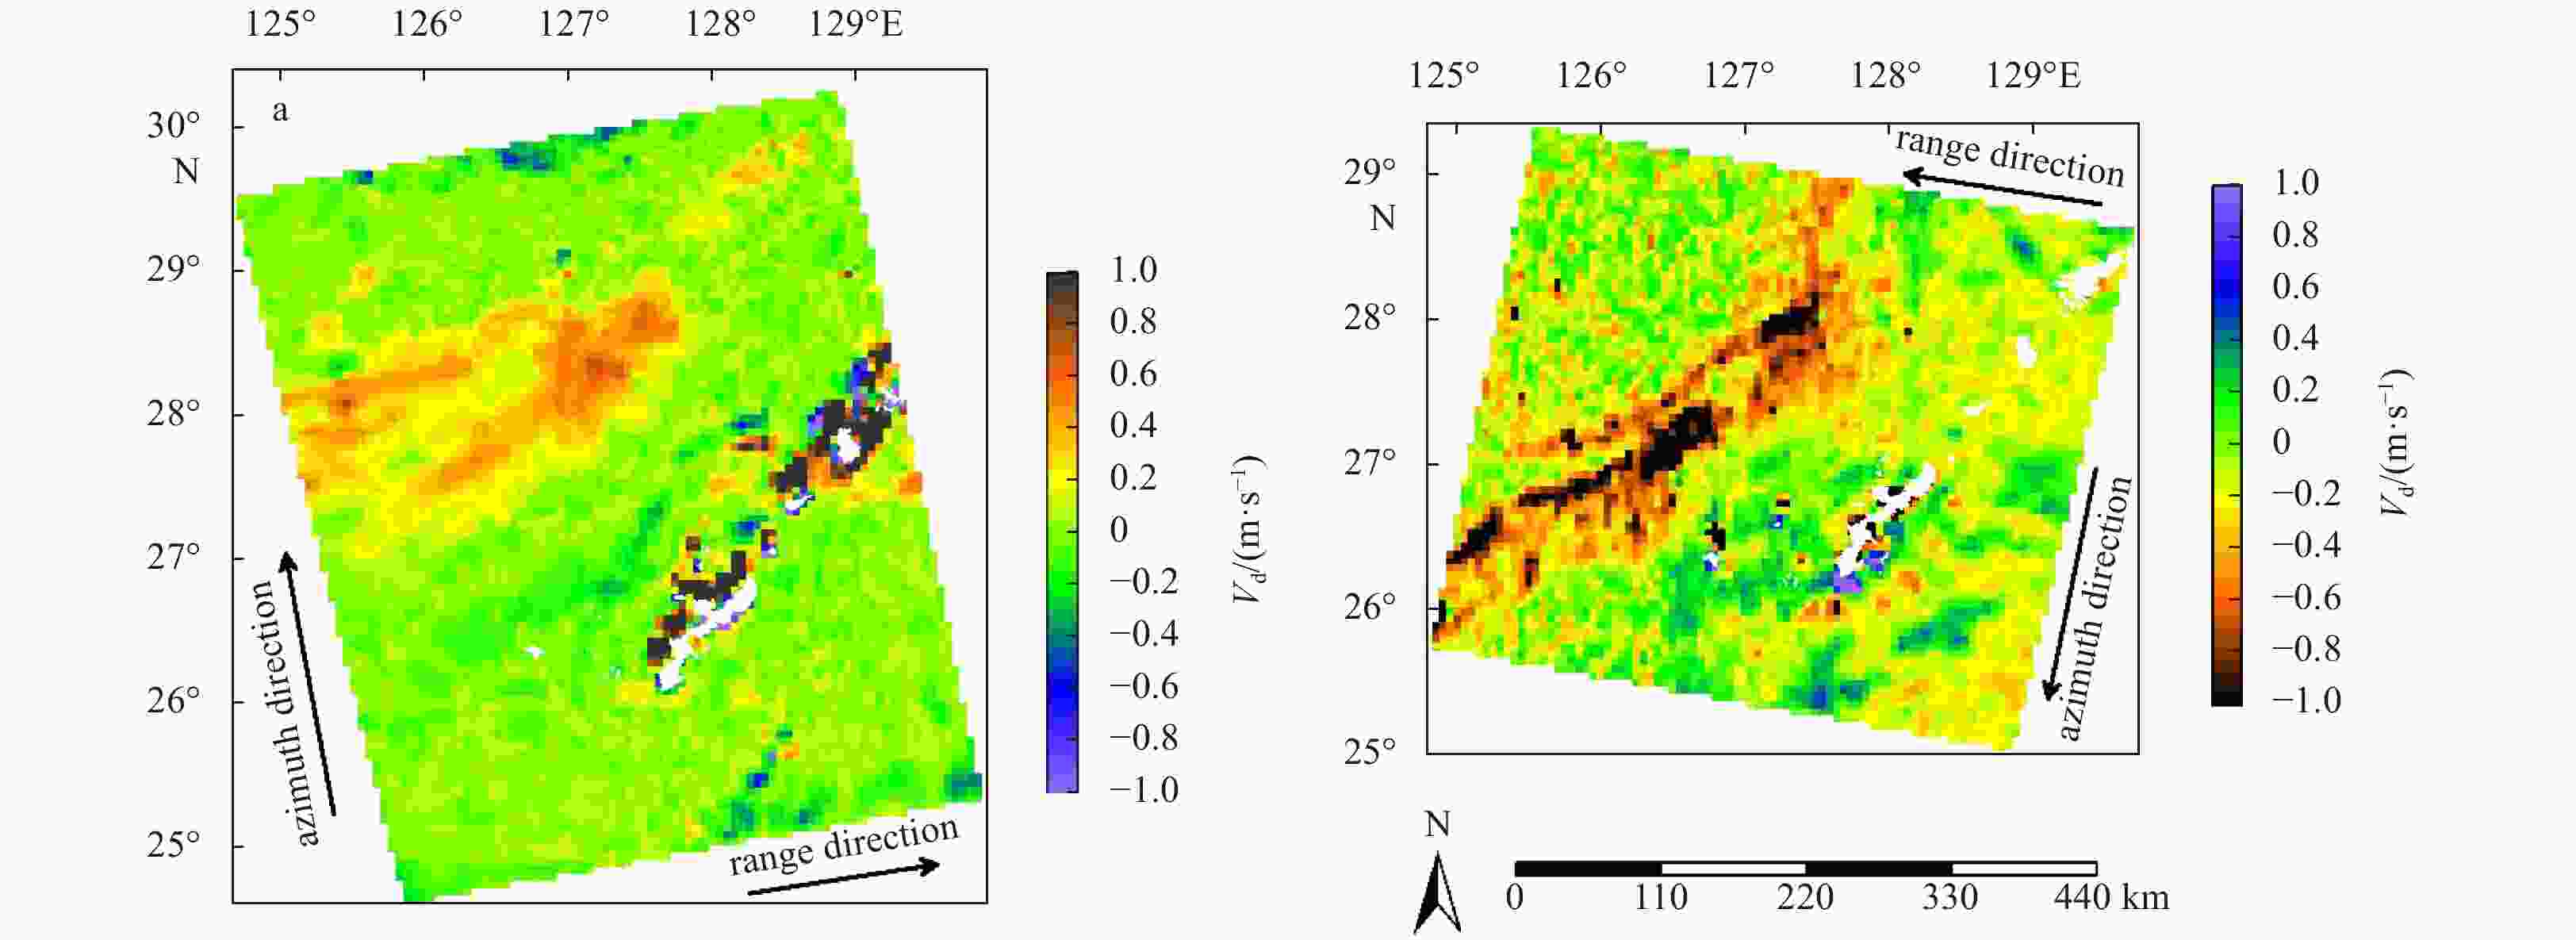
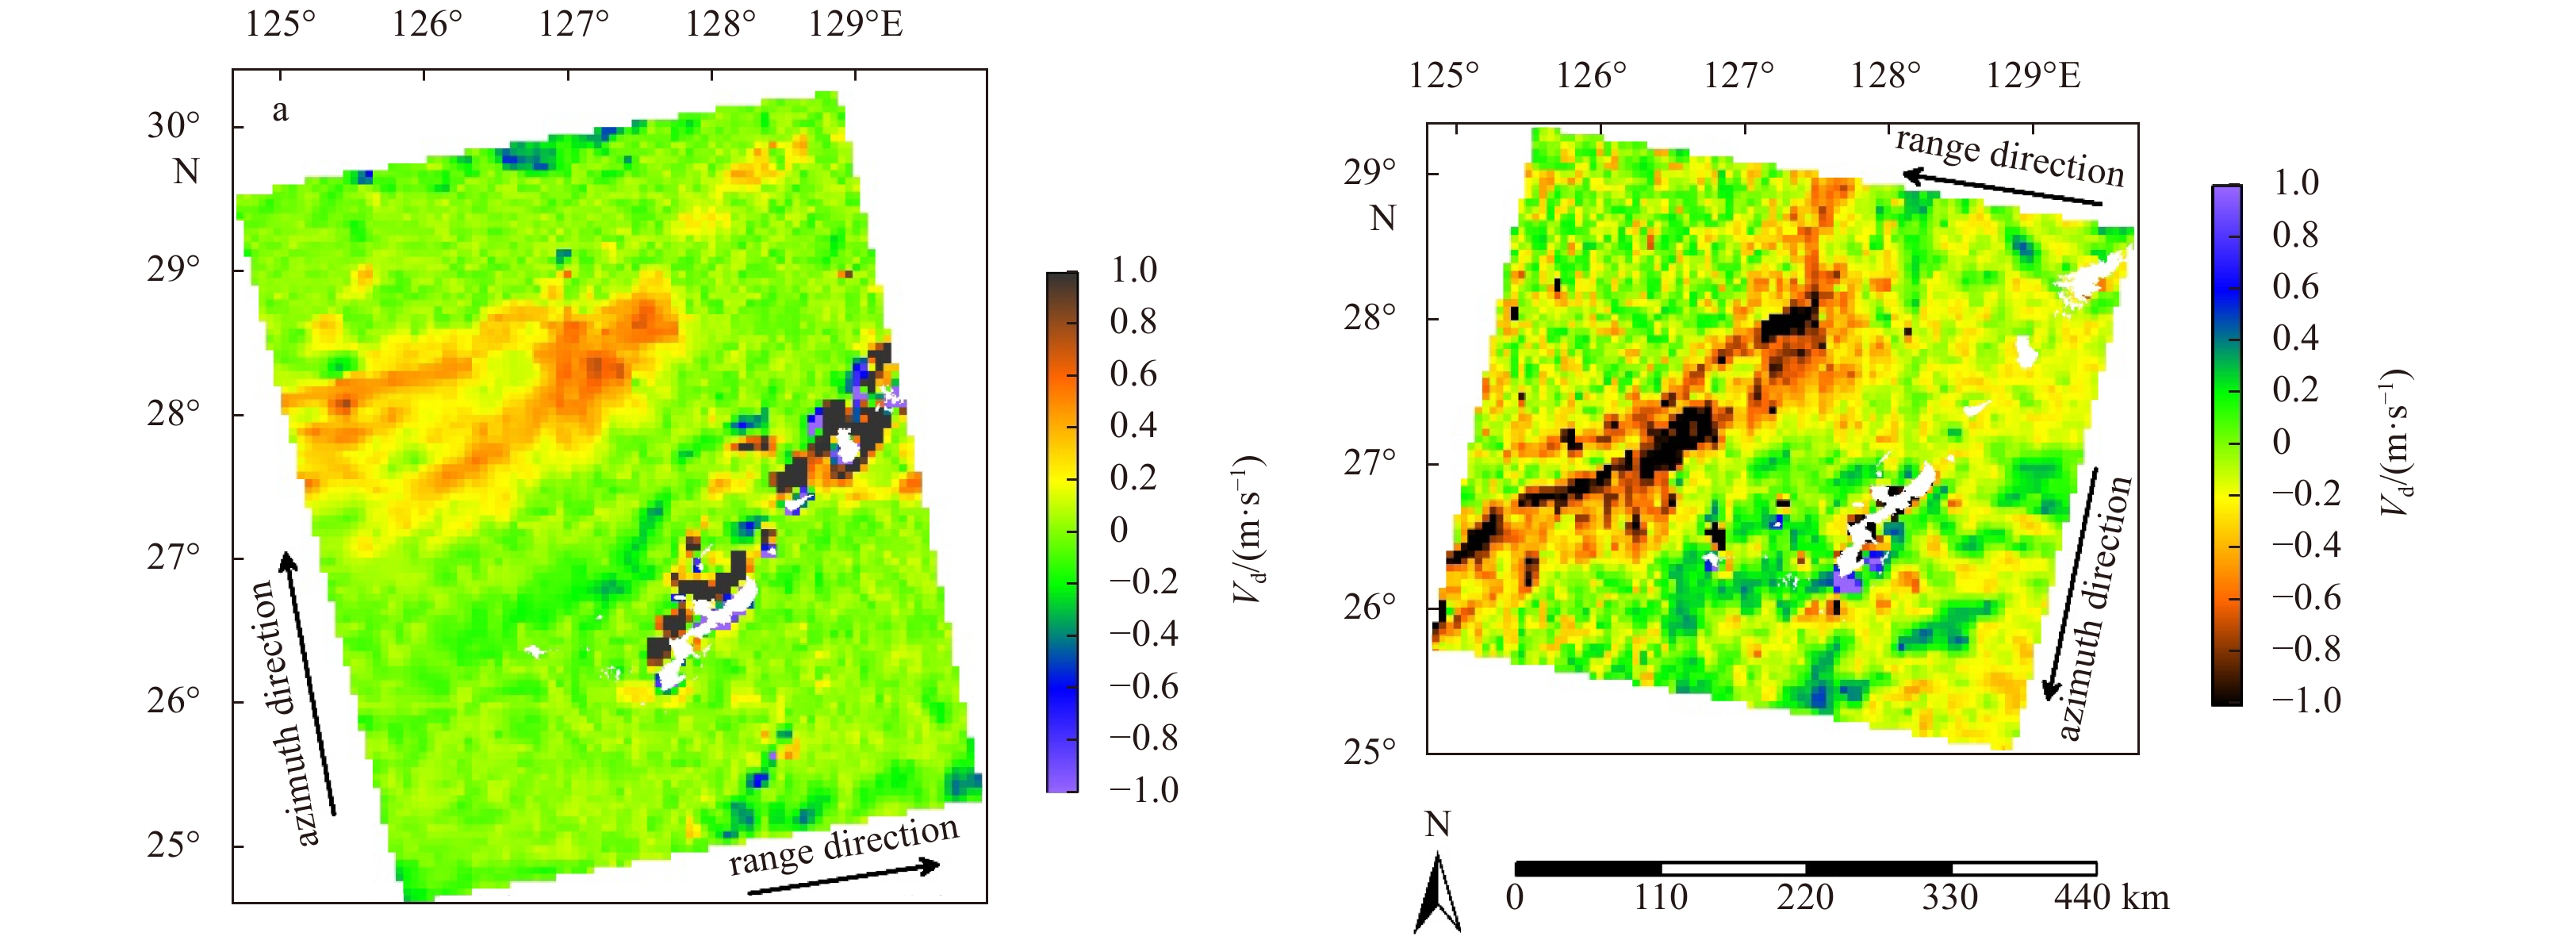
Figure 7. The radial Doppler velocities derived from ASAR scenes on July 26, 2007 (a), and on May 28, 2008 (b). Land is shown in white.

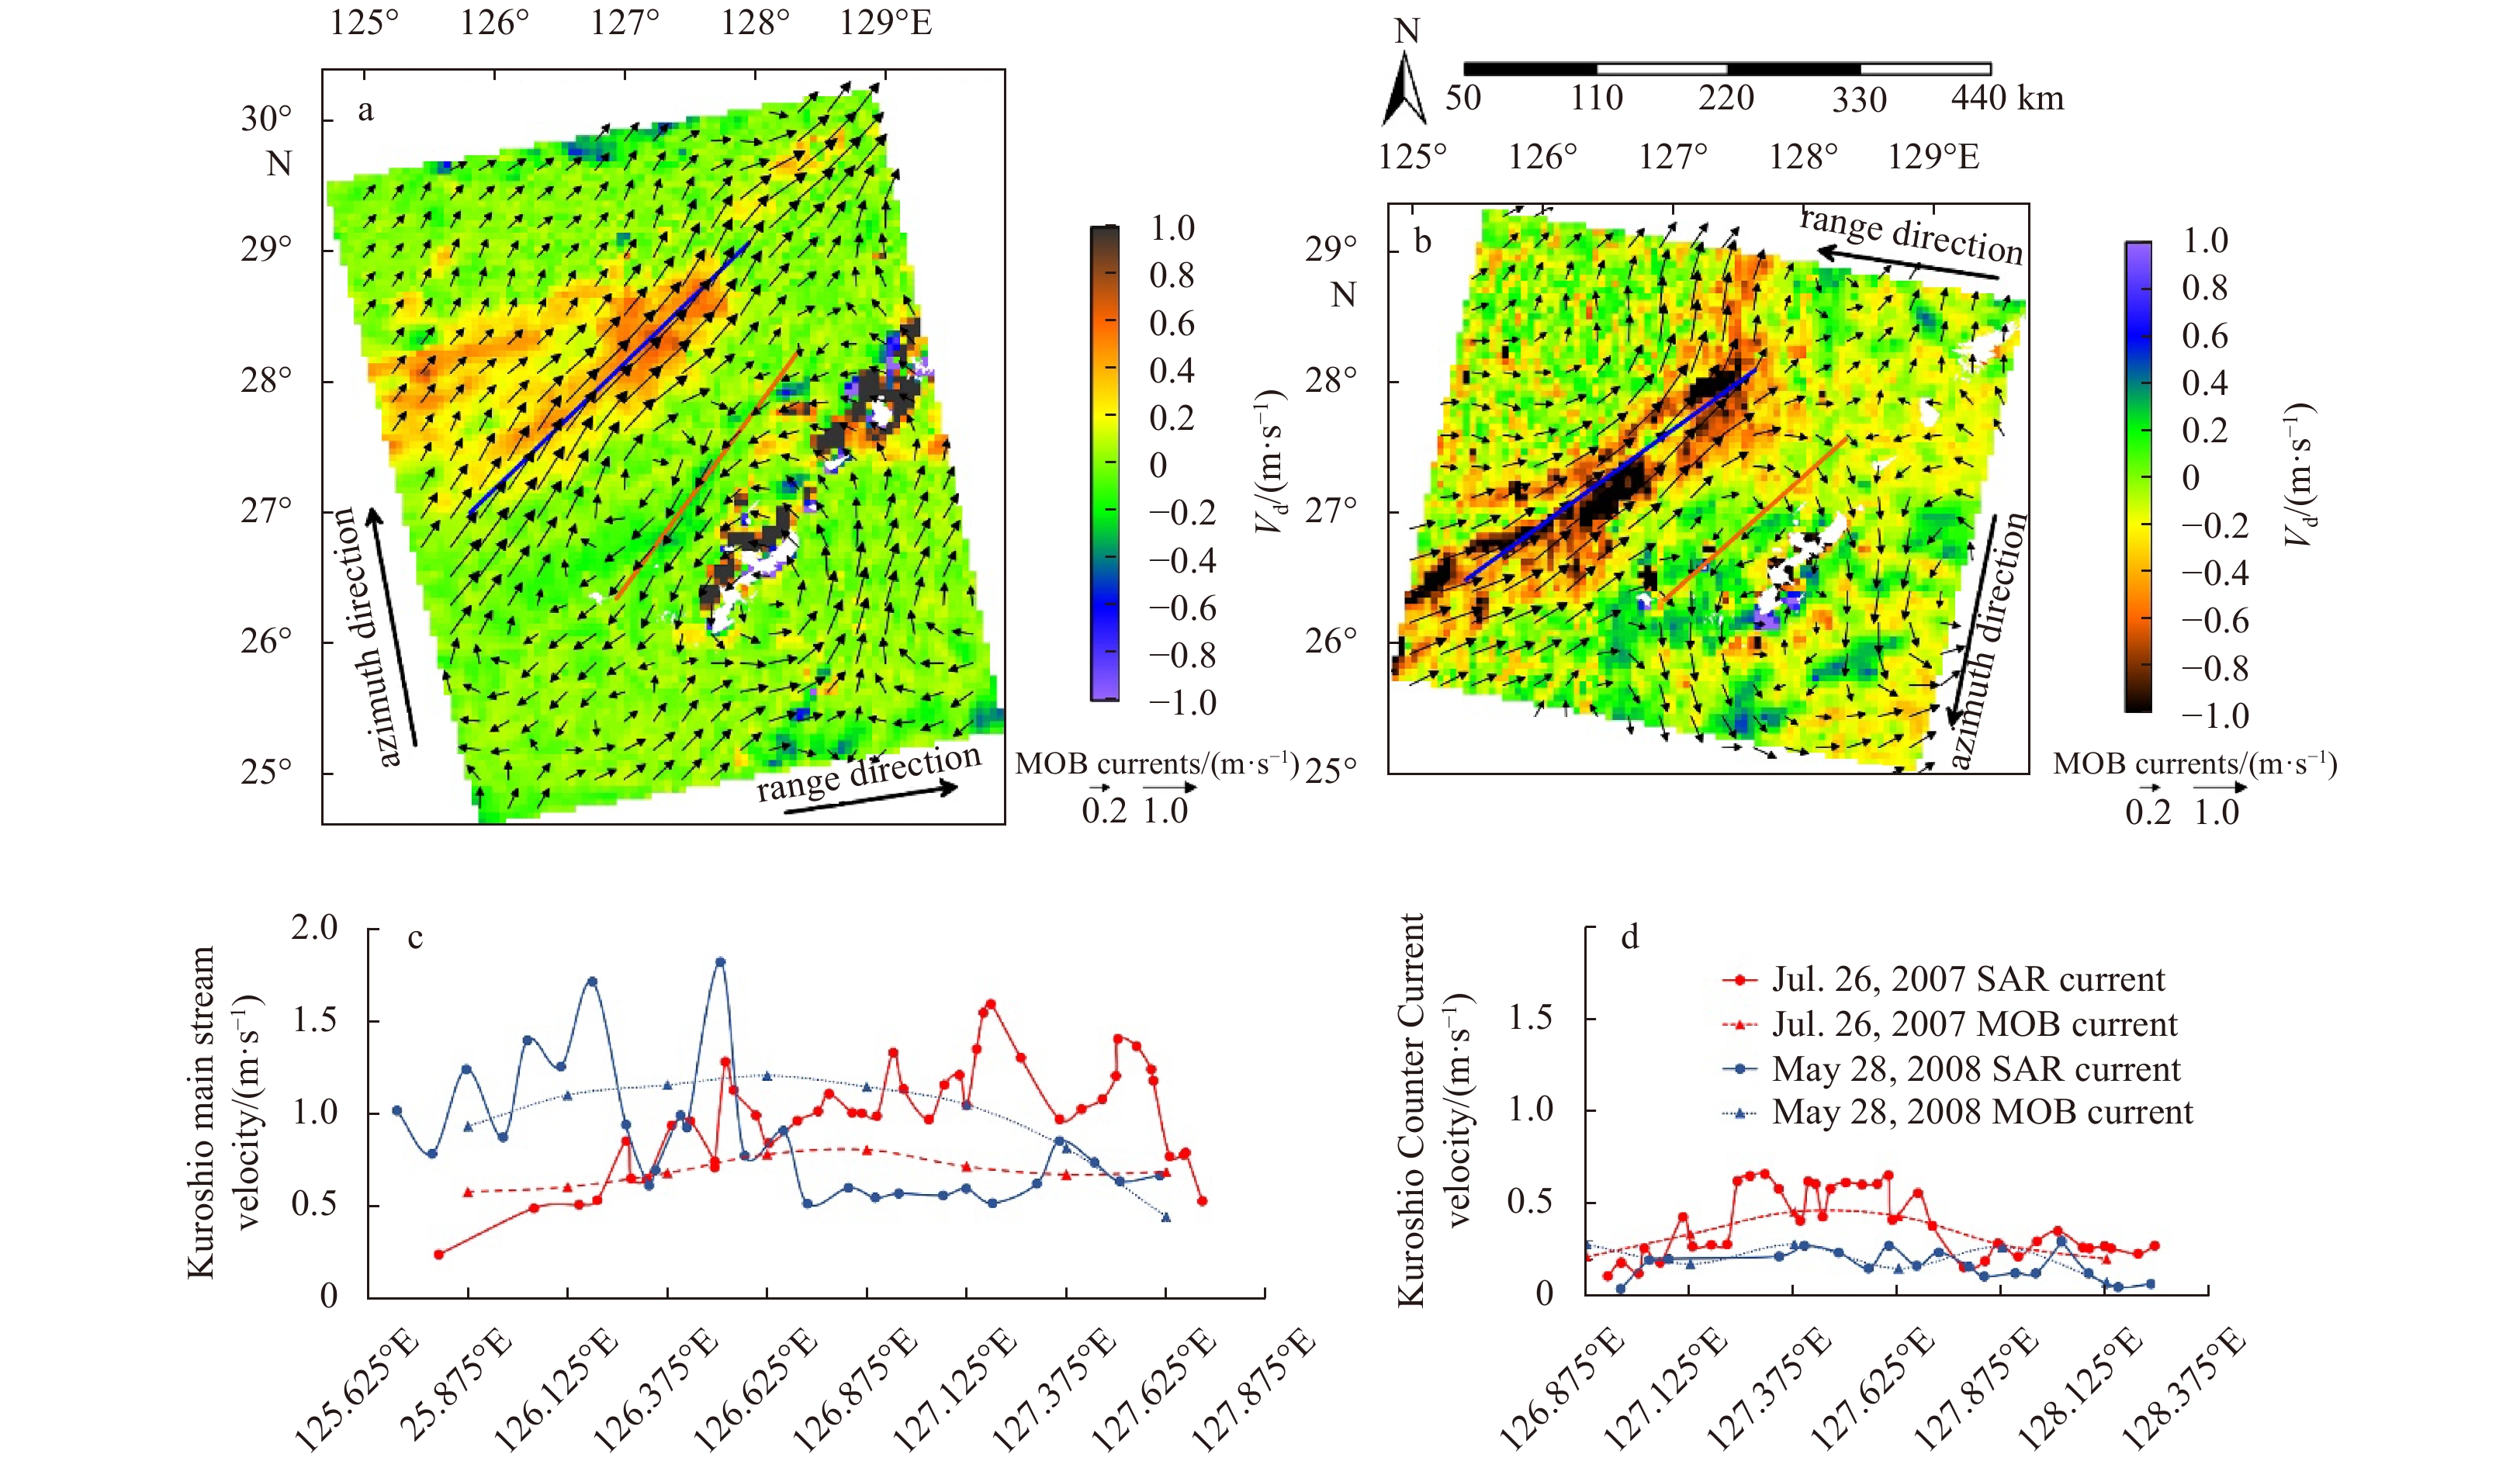
Figure 8. The radial Doppler velocities from the SAR scenes on July 26, 2007 (a), and on May 28, 2008 (b) with the corresponding multi observation (MOB) products superimposed as arrows (arrow length indicates strength); and transects of SAR range velocity and MOB velocity on July 26, 2007 and May 28, 2008 for the Kuroshio central flow (c), and for the Kuroshio Counter Current (d).
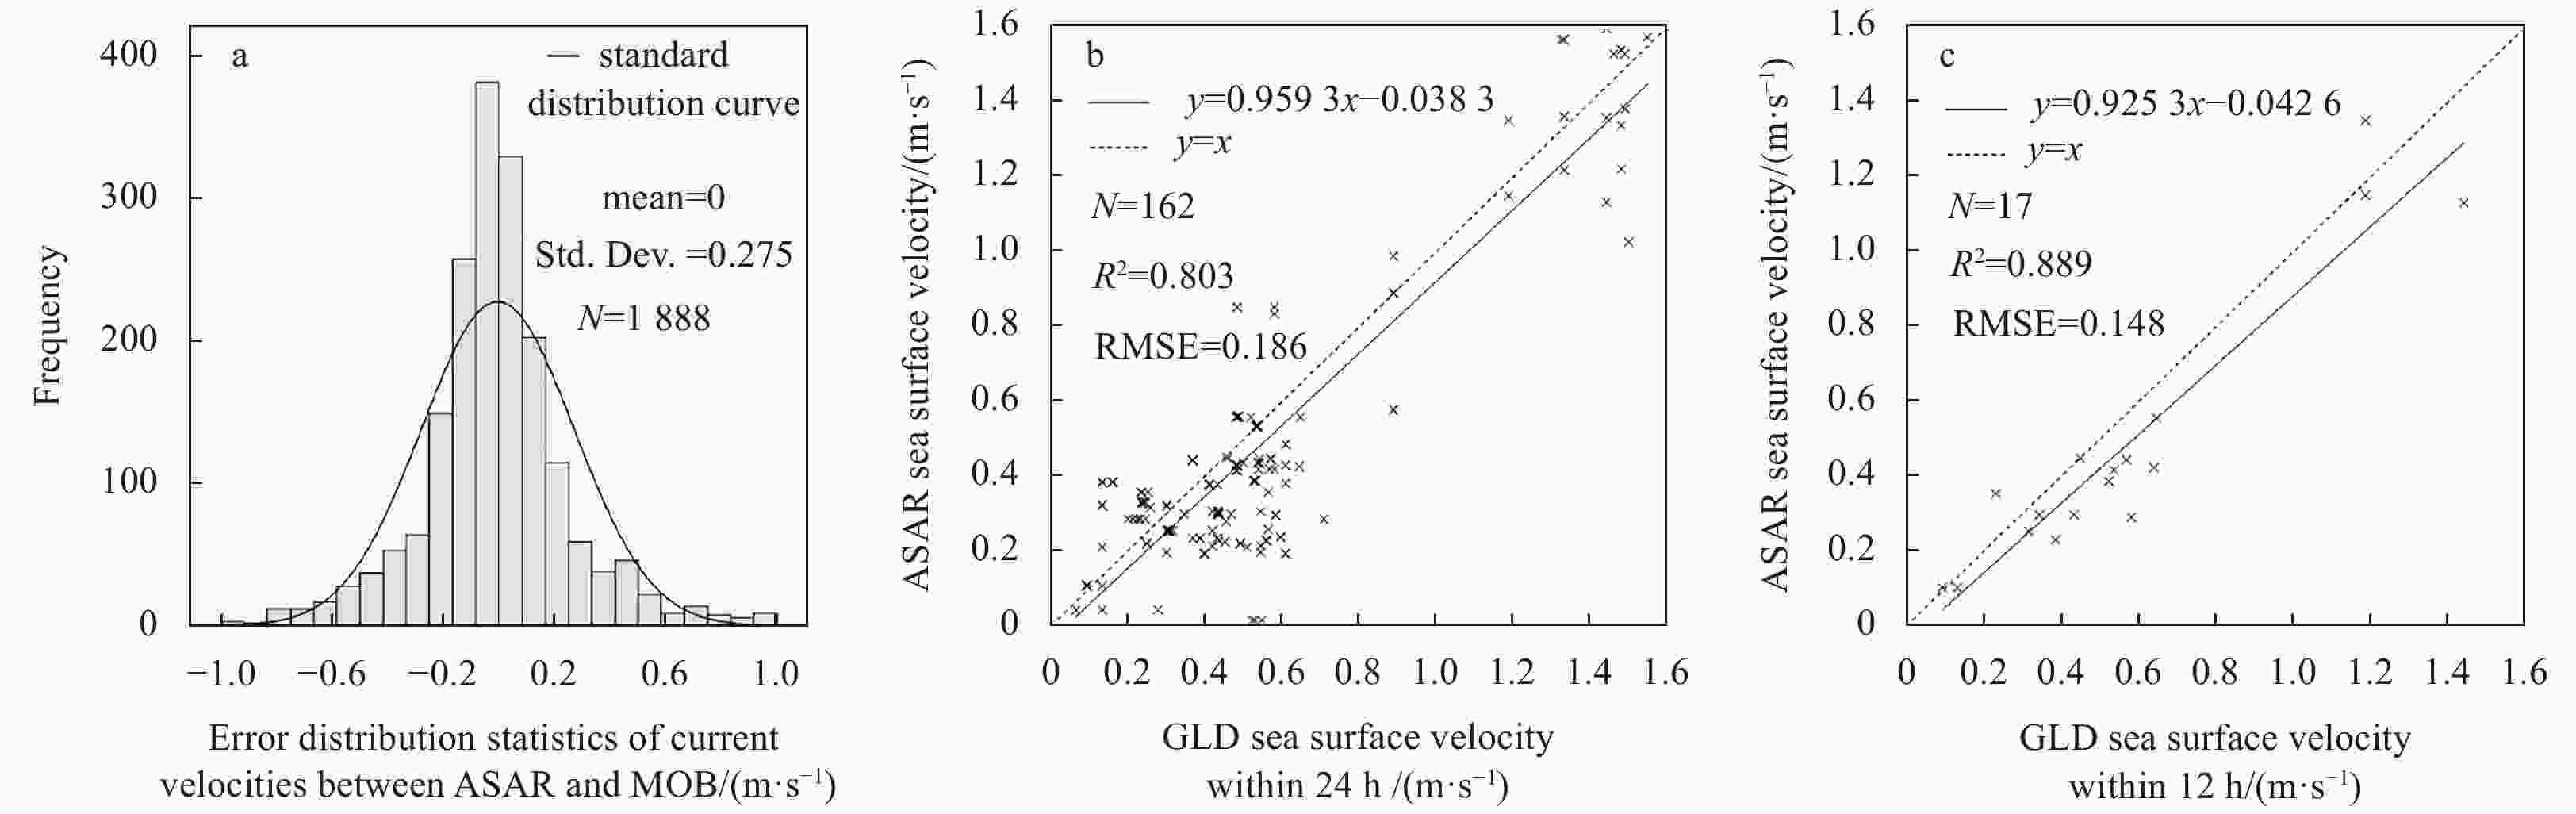
Figure 9. Error analysis of the radial velocities. a. Comparing SAR-derived data with the multi observation (MOB) products. b and c. Comparing SAR-derived data with the global surface Lagrangian drifter (GLD) data with the time window of 24 h (b) and 12 h (c).

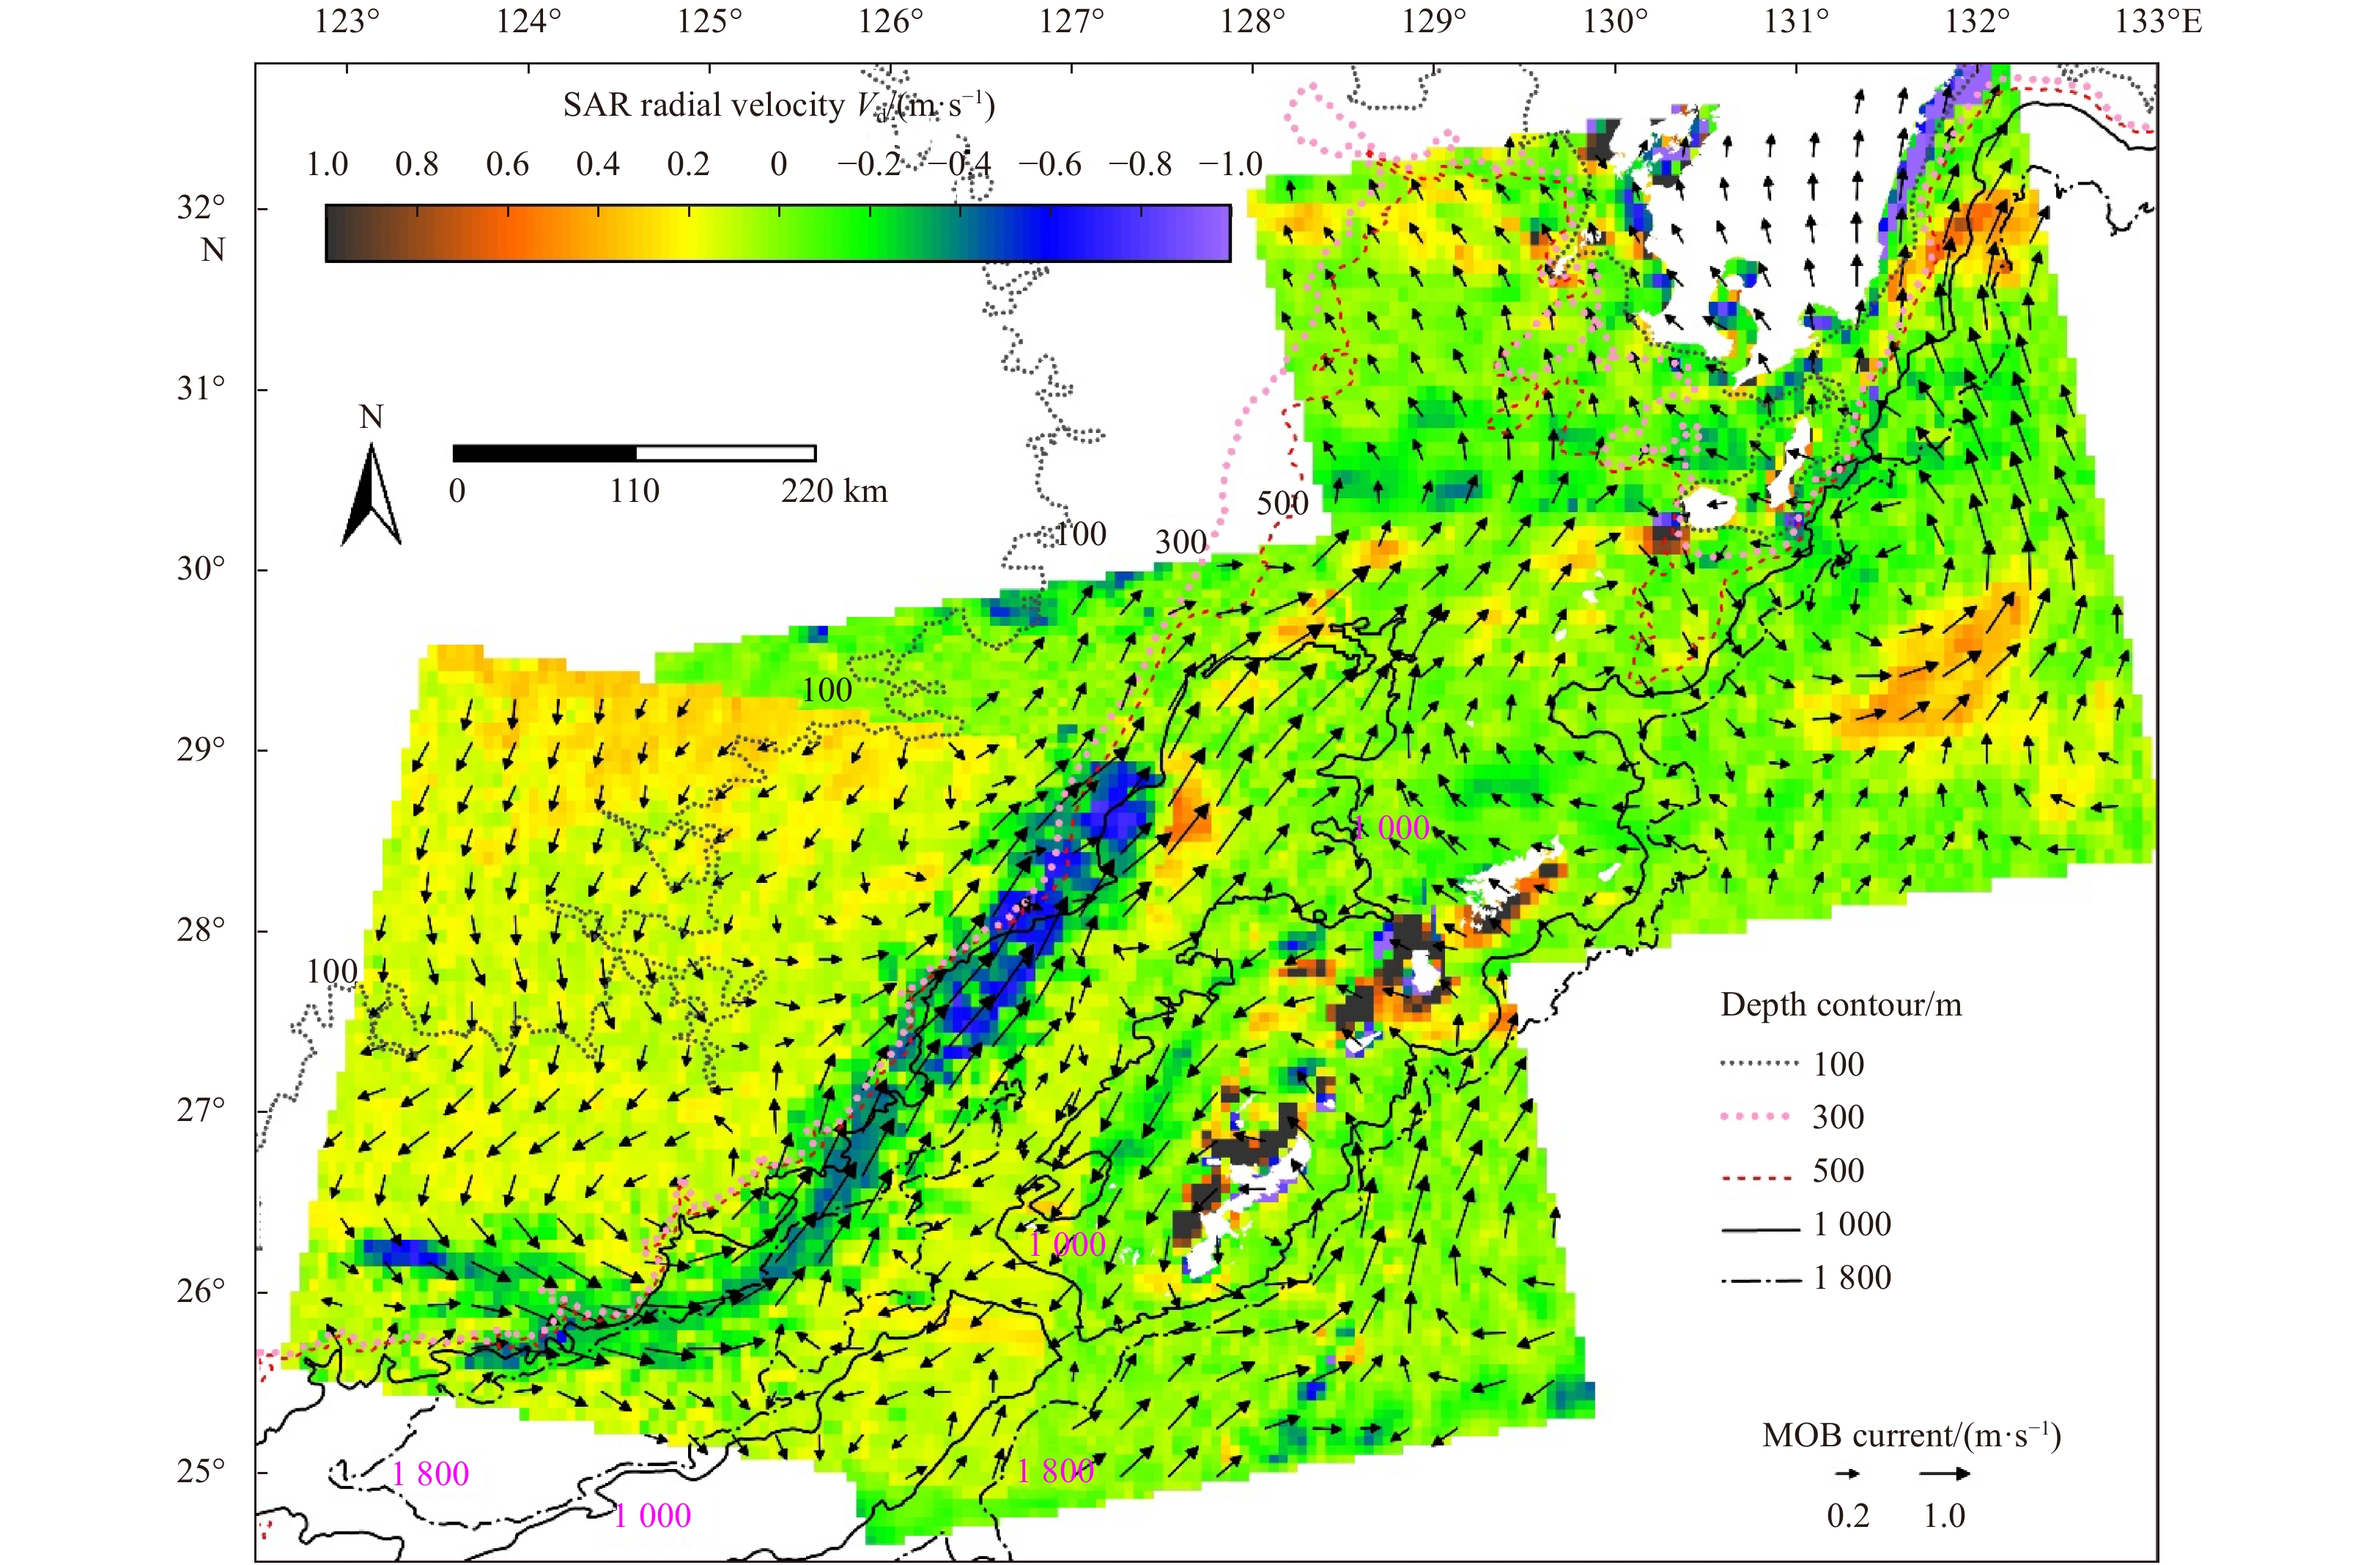
Figure 10. Composite of SAR radial velocities derived from an ascending scene acquired on 26 July 2007 (middle), an ascending scene acquired on 2 August 2011 (upper right), and a descending scene acquired on 28 May 2008 (lower left).
Table 1. ENVISAT advanced synthetic aperture radar (ASAR) wide swath mode (WSM) products description
Acquisition time (UTC) Polarization Doppler centroid numbers (range by azimuth) Orbit Track Pass 2007-07-26 13:29:03 VV 100×115 28249 139 ascending 2007-11-13 01:22:38 VV 100×70 29816 203 descending 2007-11-29 01:19:42 VV 100×70 30045 432 descending 2007-12-02 01:25:27 VV 100×70 30088 475 descending 2007-12-18 01:22:36 VV 100×70 30317 203 descending 2008-01-31 01:39:52 VV 100×70 30947 332 descending 2008-05-28 01:31:19 HH 100×54 32636 017 descending 2011-08-02 13:19:29 VV 100×67 49277 125 ascending  下载: 导出CSV
Table 2. The RMS variation of Doppler frequency
Acquisition date for SAR scene fDc RMS for the Doppler frequency anomaly/Hz fDca fDca–fw–ferr fg Jul. 26, 2007 97.56 17.70 16.42 14.32 Nov. 13, 2007 109.55 15.80 14.80 13.65 Nov. 29, 2007 104.56 10.72 10.12 9.26 Dec. 2, 2007 110.13 15.53 14.49 13.41 Dec. 18, 2007 113.64 16.27 14.97 13.03 Jan. 31, 2008 112.58 9.22 8.51 5.91 May 28, 2008 101.89 12.25 11.80 10.82 Aug. 2, 2011 89.44 18.42 16.48 14.22
下载: 导出CSV
-
[1] Ambe D, Imawaki S, Uchida H, et al. 2004. Estimating the Kuroshio axis south of Japan using combination of satellite altimetry and drifting buoys. Journal of Oceanography, 60(2): 375–382. doi: 10.1023/B:JOCE.0000038343.31468.fe [2] Chapron B, Collard F, Ardhuin F. 2005. Direct measurements of ocean surface velocity from space: Interpretation and validation. Journal of Geophysical Research: Oceans, 110(C7): C07008 [3] Chapron B, Collard F, Kerbaol V. 2004. Satellite synthetic aperture radar sea surface Doppler measurements. In: Proceedings of the 2nd Workshop on Coastal and Marine Applications of SAR. Svalbard, Norway: ESA Special Publication [4] Deng Lijing, Wei Hao, Wang Jianing. 2015. Vertical distribution of the Kuroshio velocity in the Pollution Nagasaki section and its formative mechanism. Marine Science Bulletin, 17(1): 26–39 [5] Essen H H, Gurgel K W, Schlick T. 2000. On the accuracy of current measurements by means of HF radar. IEEE Journal of Oceanic Engineering, 25(4): 472–480. doi: 10.1109/48.895354 [6] European Space Agency. 2007. Envisat ASAR Product Handbook. European Space Agency. Issue 2.2. 218–559 https://earth.esa.int/eogateway/search?text=&category=Document%20library&filter=envisat&subFilter=product%20handbook [2007-02-27/2021-04-08] [7] Goldstein R M, Zebker H A, Barnett T P. 1989. Remote sensing of ocean currents. Science, 246(4935): 1282–1285. doi: 10.1126/science.246.4935.1282 [8] Graber H C, Thompson D R, Carande R E. 1996. Ocean surface features and currents measured with synthetic aperture radar interferometry and HF radar. Journal of Geophysical Research: Oceans, 101(C11): 25813–25832. doi: 10.1029/96JC02241 [9] Guan Bingxian. 1979. Some results from the study of the variation of the Kuroshio in the East China Sea. Oceanologia et Limnologia Sinica (in Chinese), 10(4): 297–306 [10] Guo Xinyu, Miyazawa Y, Yamagata T. 2006. The Kuroshio onshore intrusion along the shelf break of the East China Sea: The origin of the Tsushima Warm Current. Journal of Physical Oceanography, 36(12): 2205–2231. doi: 10.1175/JPO2976.1 [11] Han Shuzong, Yang Hua, Xue Wenhu, et al. 2017. The study of single station inverting the sea surface current by HF ground wave radar based on adjoint assimilation technology. Journal of Ocean University of China, 16(3): 383–388. doi: 10.1007/s11802-017-3189-8 [12] Hansen M W, Collard F, Dagestad K F, et al. 2011a. Retrieval of sea surface range velocities from Envisat ASAR Doppler centroid measurements. IEEE Transactions on Geoscience and Remote Sensing, 49(10): 3582–3592. doi: 10.1109/TGRS.2011.2153864 [13] Hansen M W, Johannessen J A, Dagestad K F, et al. 2011b. Monitoring the surface inflow of Atlantic Water to the Norwegian Sea using Envisat ASAR. Journal of Geophysical Research: Oceans, 116(C12): C12008. doi: 10.1029/2011JC007375 [14] He Yijun. 2000. Ocean wave imaging mechanism by imaging radar. Science in China Series D: Earth Sciences, 43(6): 587–595. doi: 10.1007/BF02879502 [15] He Yijun, Yang Xiaobo, Yi Na, et al. 2020. Progress in sea surface current retrieval from spaceborne SAR measurements. Journal of Nanjing University of Information Science and Technology (in Chinese), 12(2): 181–190 [16] Jia Yongjun, Zhang Youguang, Lin Mingsen. 2013. The numerical simulation of the Kuroshio frontal eddies in the East China Sea using a hybrid coordinate ocean mode. Acta Oceanologica Sinica, 32(5): 31–41. doi: 10.1007/s13131-013-0311-7 [17] Johannessen J A, Chapron B, Collard F, et al. 2008. Direct ocean surface velocity measurements from space: Improved quantitative interpretation of Envisat ASAR observations. Geophysical Research Letters, 35(22): L22608. doi: 10.1029/2008GL035709 [18] Johannessen J A, Shuchman R A, Digranes G, et al. 1996. Coastal ocean fronts and eddies imaged with ERS 1 synthetic aperture radar. Journal of Geophysical Research: Oceans, 101(C3): 6651–6667. doi: 10.1029/95JC02962 [19] Klemas V. 2012. Remote sensing of coastal and ocean currents: An overview. Journal of Coastal Research, 28(3): 576–586. doi: 10.2112/JCOASTRES-D-11-00197.1 [20] Lehner S, Hoja D, Schulz-Stellenfleth J. 2002. Marine parameters from synergy of optical and radar satellite data. Advances in Space Research, 29(1): 23–32. doi: 10.1016/S0273-1177(01)00623-8 [21] Li Shuiqing, Liu Baochang, Shen Hui, et al. 2020. Wind wave effects on remote sensing of sea surface currents from SAR. Journal of Geophysical Research: Oceans, 125(7): e2020JC016166 [22] Lin Hui, Xu Qing, Zheng Quan’an. 2008. An overview on SAR measurements of sea surface wind. Progress in Natural Science, 18(8): 913–919. doi: 10.1016/j.pnsc.2008.03.008 [23] Liu Baochang, He Yijun, Li Yongkang, et al. 2019. A new azimuth ambiguity suppression algorithm for surface current measurement in coastal waters and rivers with along-track InSAR. IEEE Transactions on Geoscience and Remote Sensing, 57(6): 3148–3165. doi: 10.1109/TGRS.2018.2881958 [24] Ma Chao, Wu Dexing, Lin Xiaopei. 2009. Variability of surface velocity in the Kuroshio Current and adjacent waters derived from Argos drifter buoys and satellite altimeter data. Chinese Journal of Oceanology and Limnology, 27(2): 208–217. doi: 10.1007/s00343-009-9260-6 [25] Moiseev A, Johnsen H, Hansen M W, et al. 2020. Evaluation of radial ocean surface currents derived from Sentinel-1 IW Doppler shift using coastal radar and Lagrangian surface drifter observations. Journal of Geophysical Research: Oceans, 125(4): e2019JC015743 [26] Mouche A A, Collard F, Chapron B, et al. 2012. On the use of Doppler shift for sea surface wind retrieval from SAR. IEEE Transactions on Geoscience and Remote Sensing, 50(7): 2901–2909. doi: 10.1109/TGRS.2011.2174998 [27] Qiu Bo, Chen Shuiming, Klein P, et al. 2020. Reconstructing upper-ocean vertical velocity field from sea surface height in the presence of unbalanced motion. Journal of Physical Oceanography, 50(1): 55–79. doi: 10.1175/JPO-D-19-0172.1 [28] Qiu Bo, Lukas R. 1996. Seasonal and interannual variability of the North Equatorial Current, the Mindanao Current, and the Kuroshio along the Pacific western boundary. Journal of Geophysical Research: Oceans, 101(C5): 12315–12330. doi: 10.1029/95JC03204 [29] Quilfen Y, Chapron B. 2019. Ocean surface wave-current signatures from satellite altimeter measurements. Geophysical Research Letters, 46(1): 253–261. doi: 10.1029/2018GL081029 [30] Rio M H, Mulet S, Picot N. 2014. Beyond GOCE for the ocean circulation estimate: Synergetic use of altimetry, gravimetry, and in situ data provides new insight into geostrophic and Ekman currents. Geophysical Research Letters, 41(24): 8918–8925. doi: 10.1002/2014GL061773 [31] Romeiser R. 2005. Current measurements by airborne along-track InSAR: Measuring technique and experimental results. IEEE Journal of Oceanic Engineering, 30(3): 552–569. doi: 10.1109/JOE.2005.857508 [32] Romeiser R, Suchandt S, Runge H, et al. 2010. First analysis of TerraSAR-X along-track InSAR-Derived current fields. IEEE Transactions on Geoscience and Remote Sensing, 48(2): 820–829. doi: 10.1109/TGRS.2009.2030885 [33] Romeiser R, Thompson D R. 2000. Numerical study on the along-track interferometric radar imaging mechanism of oceanic surface currents. IEEE Transactions on Geoscience and Remote Sensing, 38(1): 446–458. doi: 10.1109/36.823940 [34] Krug M, Mouche A, Collard F, et al. 2010. Mapping the Agulhas Current from space: An assessment of ASAR surface current velocities. Journal of Geophysical Research: Oceans, 115(C10): C10026 [35] Toporkov J V, Brown G S. 2000. Numerical simulations of scattering from time-varying, randomly rough surfaces. IEEE Transactions on Geoscience and Remote Sensing, 38(4): 1616–1625. doi: 10.1109/36.851961 [36] Wang Lihua, Zhou Yunxuan, Ge Jianzhong, et al. 2014a. Mapping sea surface velocities in the Changjiang coastal zone with advanced synthetic aperture radar. Acta Oceanologica Sinica, 33(11): 141–149. doi: 10.1007/s13131-014-0563-x [37] Wang Lihua, Zhou Yunxuan, Zhu Jianrong, et al. 2014b. Deriving Changjiang coastal zone wind from C-band SAR and its application to salinity simulation. Chinese Journal of Oceanology and Limnology, 32(4): 946–957. doi: 10.1007/s00343-014-3253-9 [38] Yoshida T, Rheem C K. 2015. Time-domain simulation of along-track interferometric SAR for moving ocean surfaces. Sensors, 15(6): 13644–13659. doi: 10.3390/s150613644 [39] Zhang Canying, Feng Zhigang, Zhang Xiaokun, et al. 2017. Analysis on research progress of Kuroshio. World Sci-Tech R&D (in Chinese), 39(3): 239–249 [40] Zhuang Zhanpeng, Hui Zhenli, Yang Guangbing, et al. 2020. Principal-component estimates of the Kuroshio Current axis and path based on the mathematical verification between satellite altimeter and drifting buoy data. Acta Oceanologica Sinica, 39(1): 14–24. doi: 10.1007/s13131-019-1523-2 -


 点击查看大图
计量
- 文章访问数: 621
- HTML全文浏览量: 226
- PDF下载量: 38
- 被引次数: 0

