2021 Vol. 40, No. 5

Cover
2021, 40(5): .
Abstract:
2021-5 Contents
2021, (5): 1-2.
Abstract:
Physical Oceanography, Marine Meteorology and Marine Physics
Three-dimensional structure of an observed cyclonic mesoscale eddy in the Northwest Pacific and its assimilation experiment
Jun Dai, Huizan Wang, Weimin Zhang, Pinqiang Wang, Tengling Luo
2021, 40(5): 1-19. doi: 10.1007/s13131-021-1810-6
Abstract:
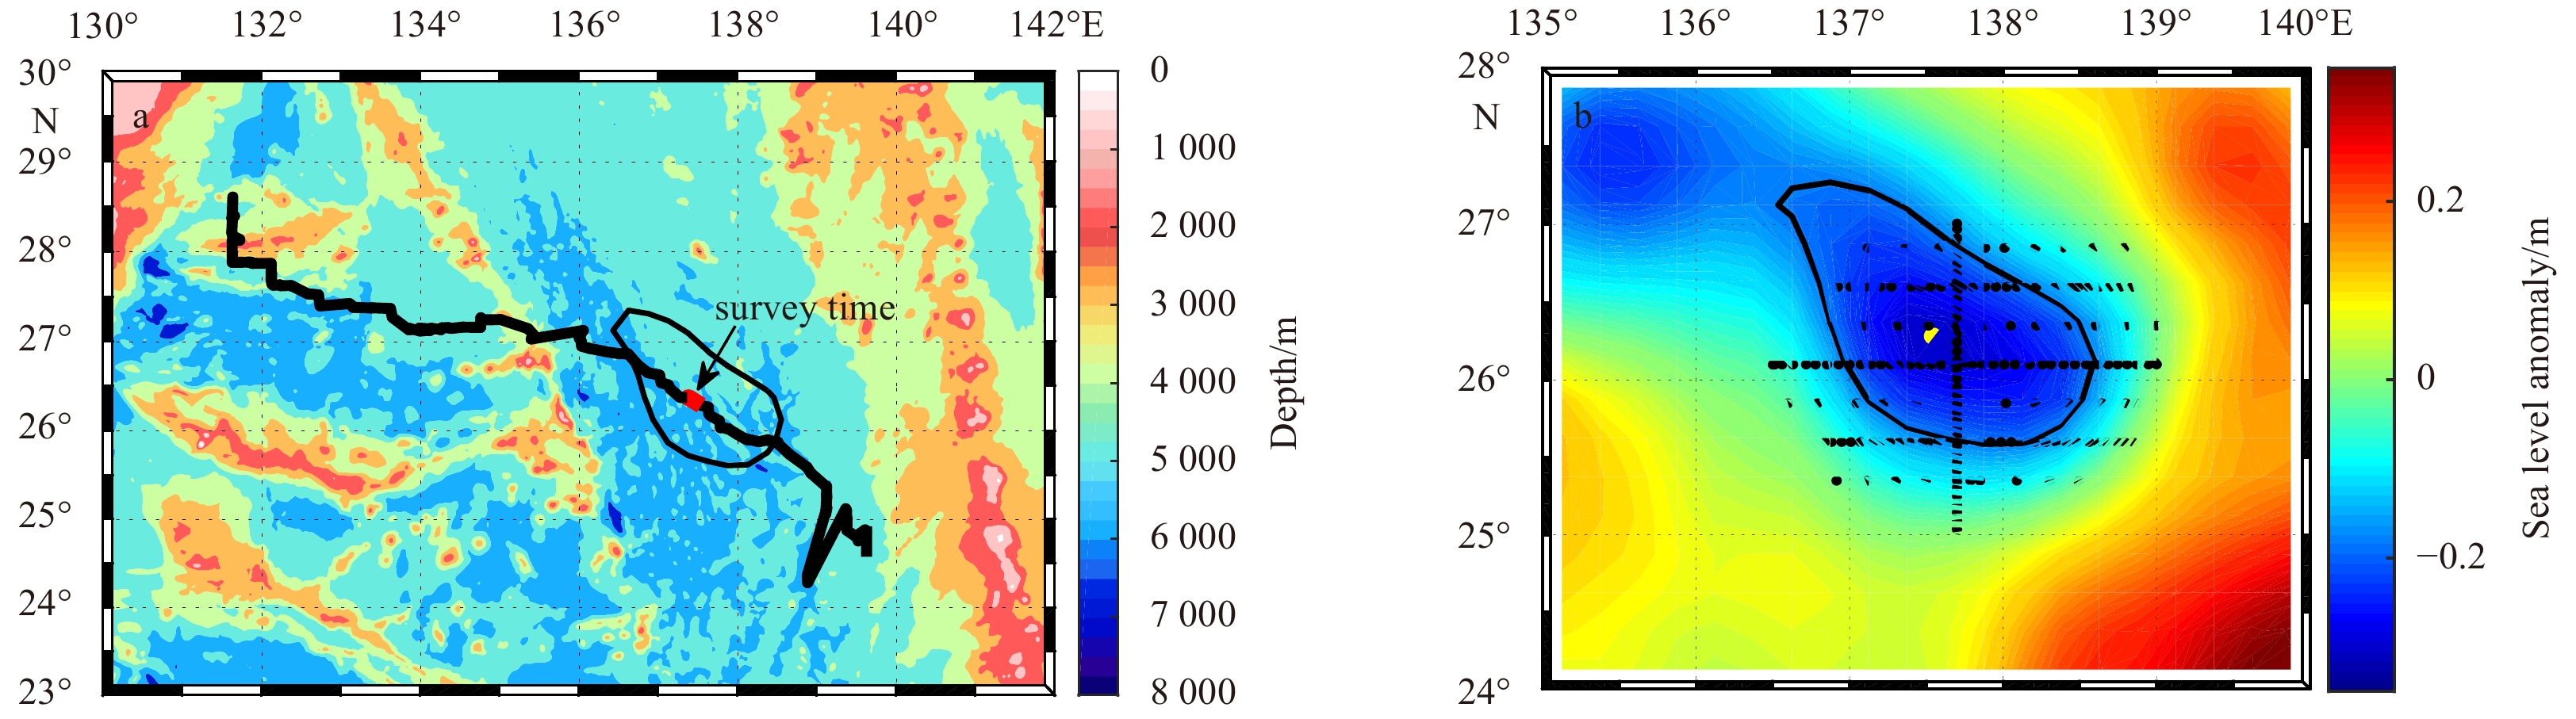
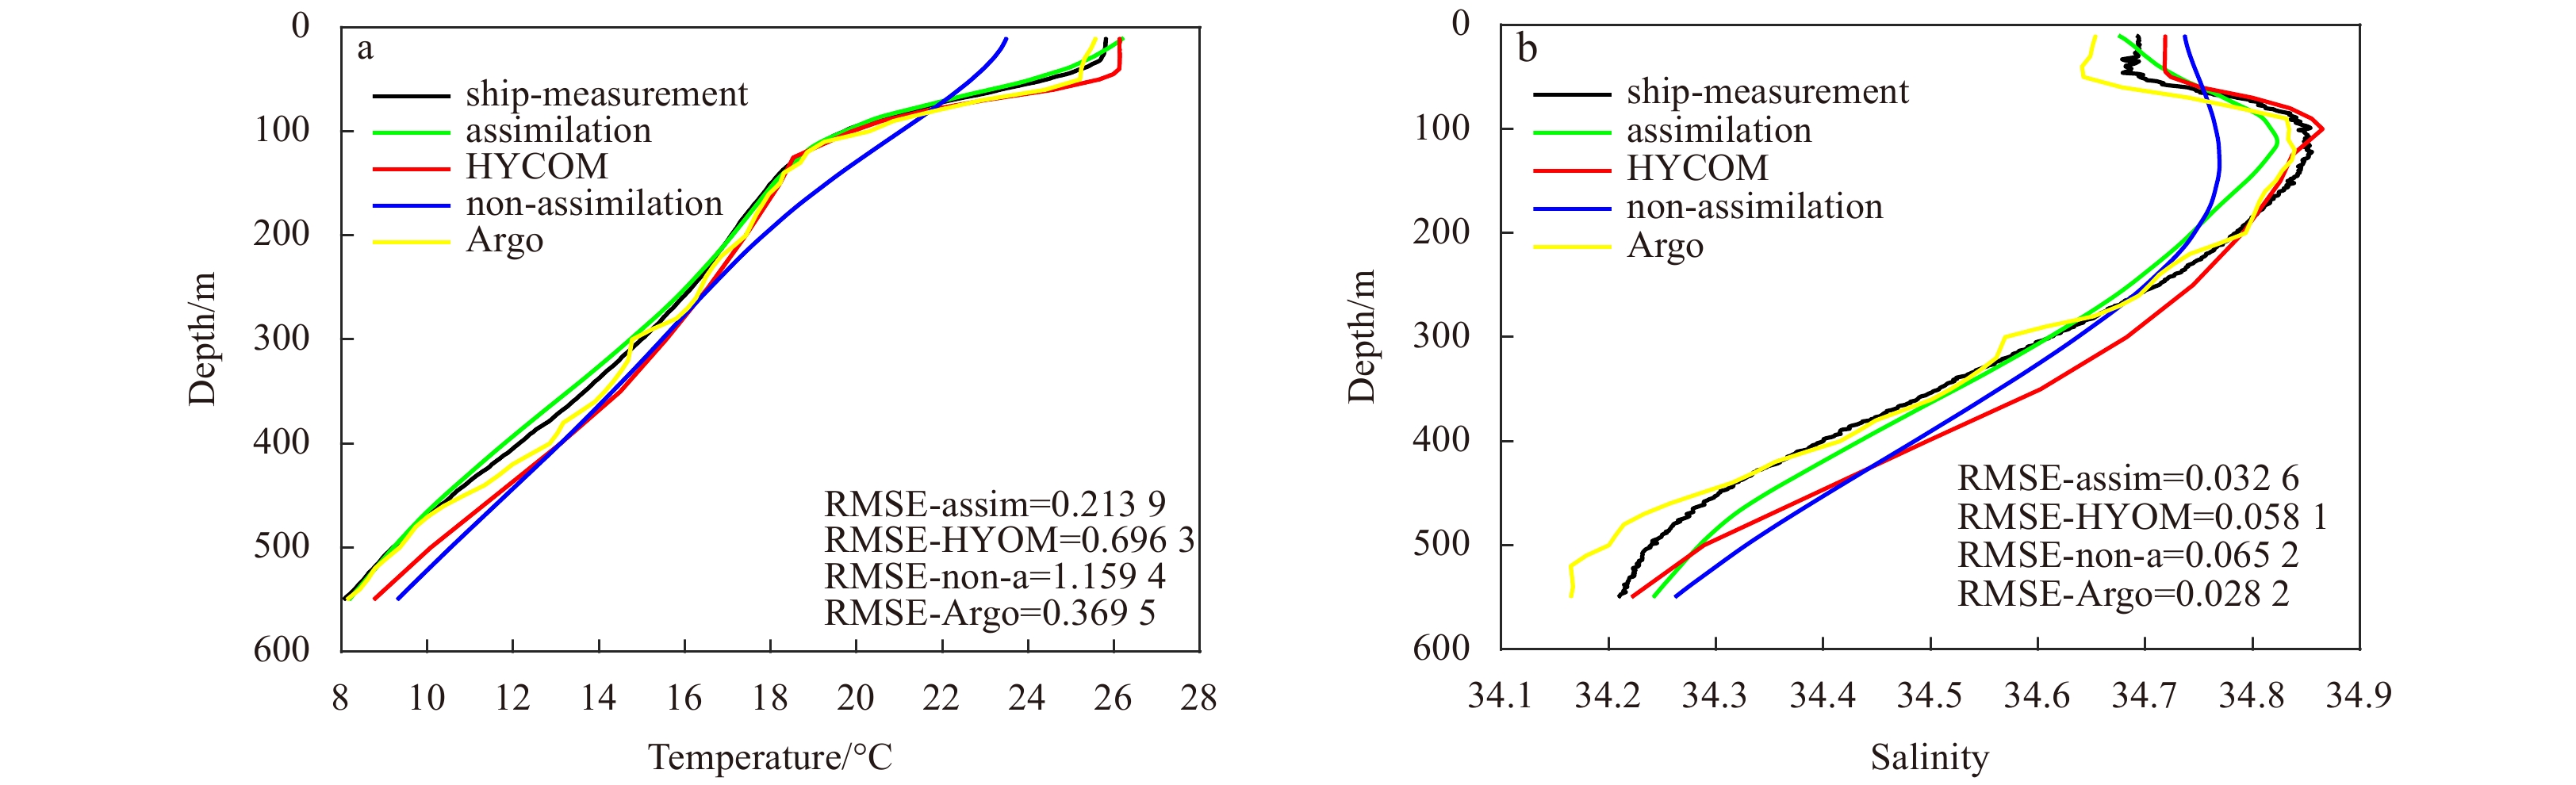
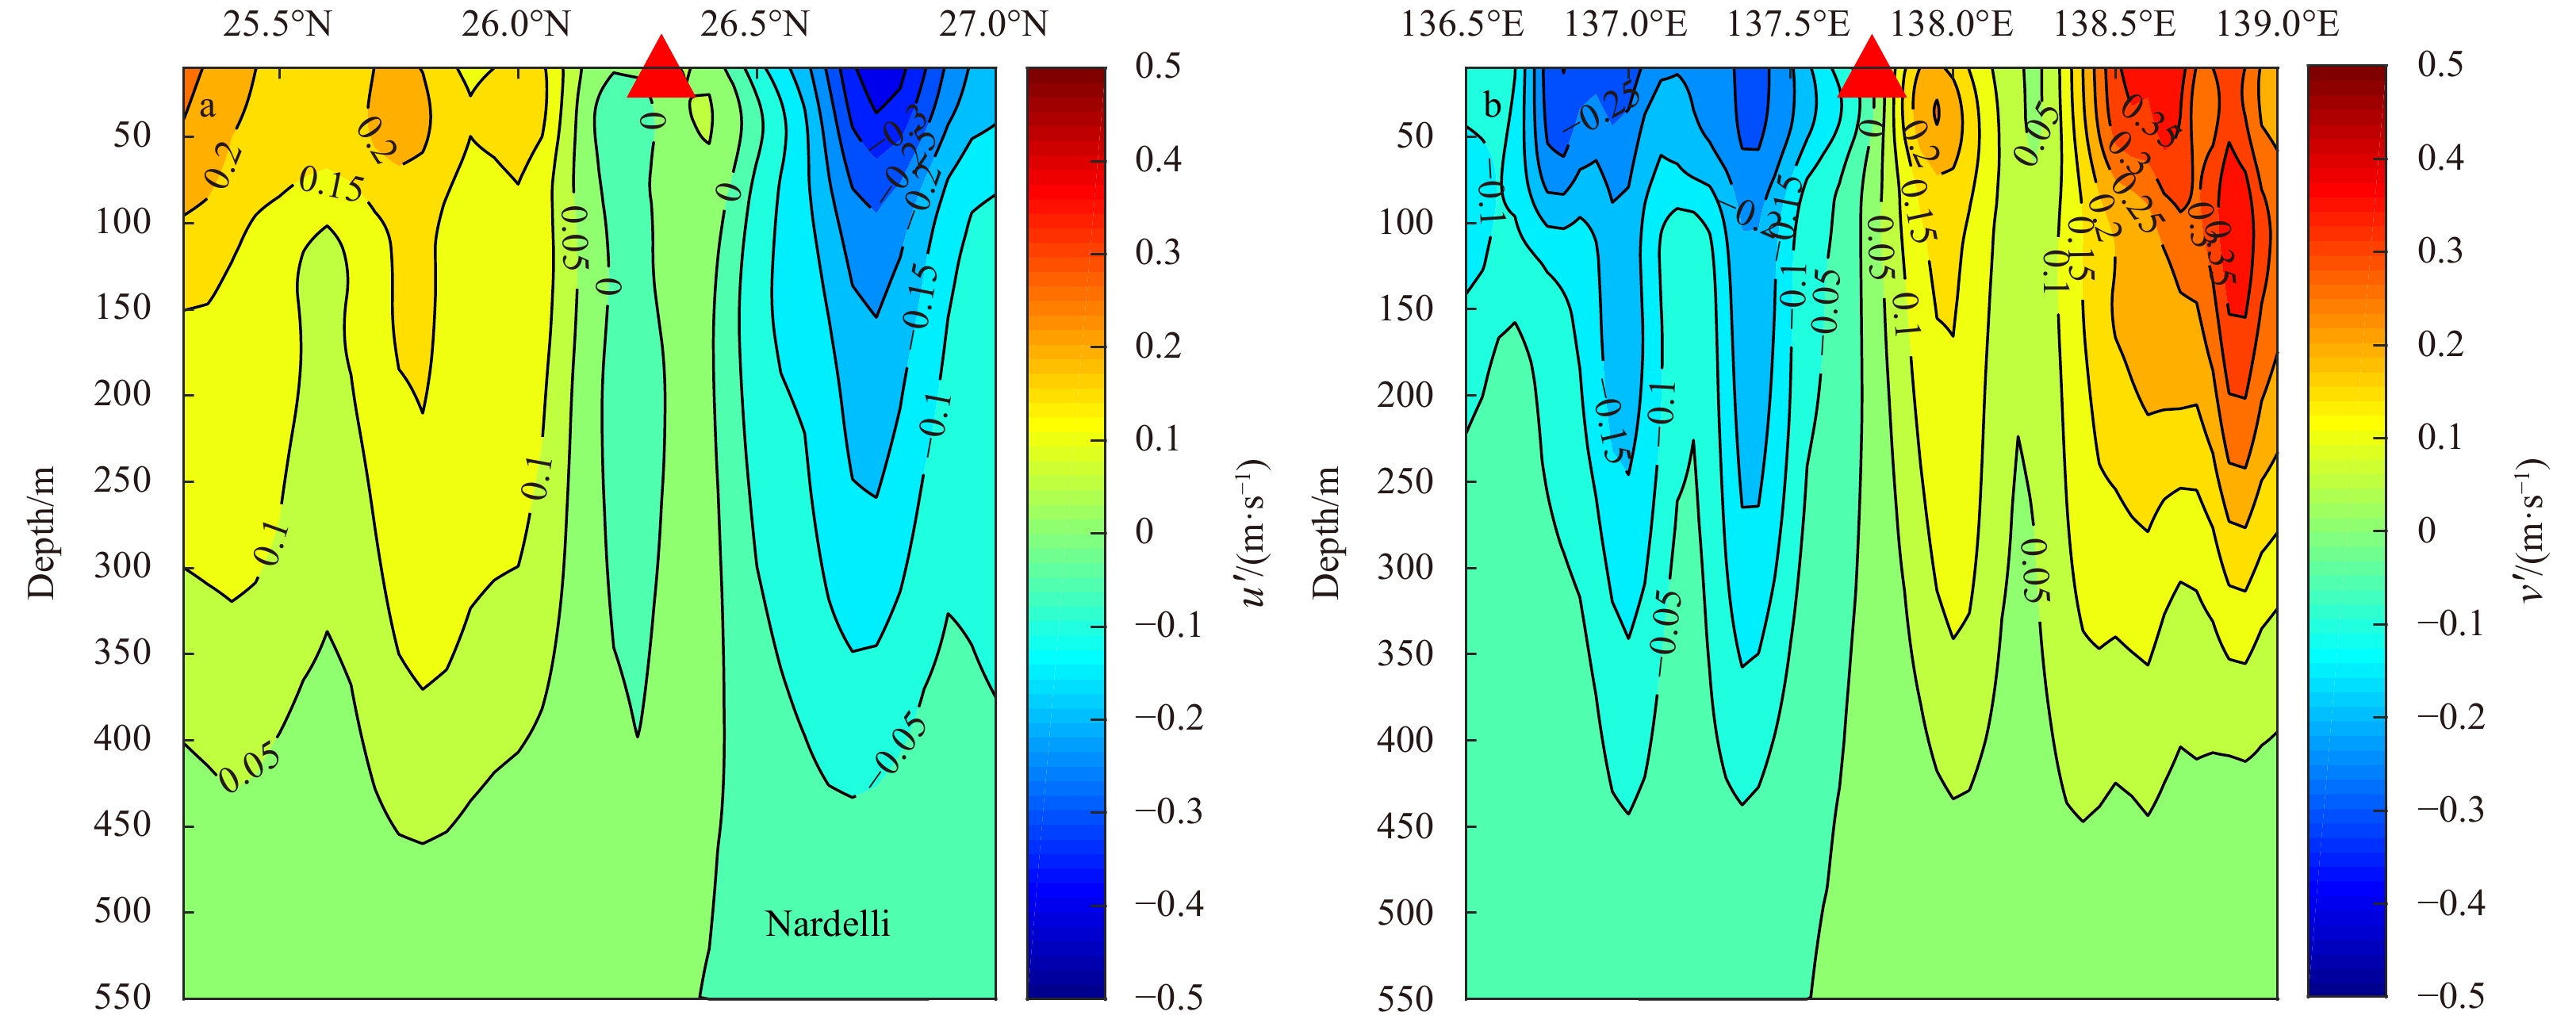
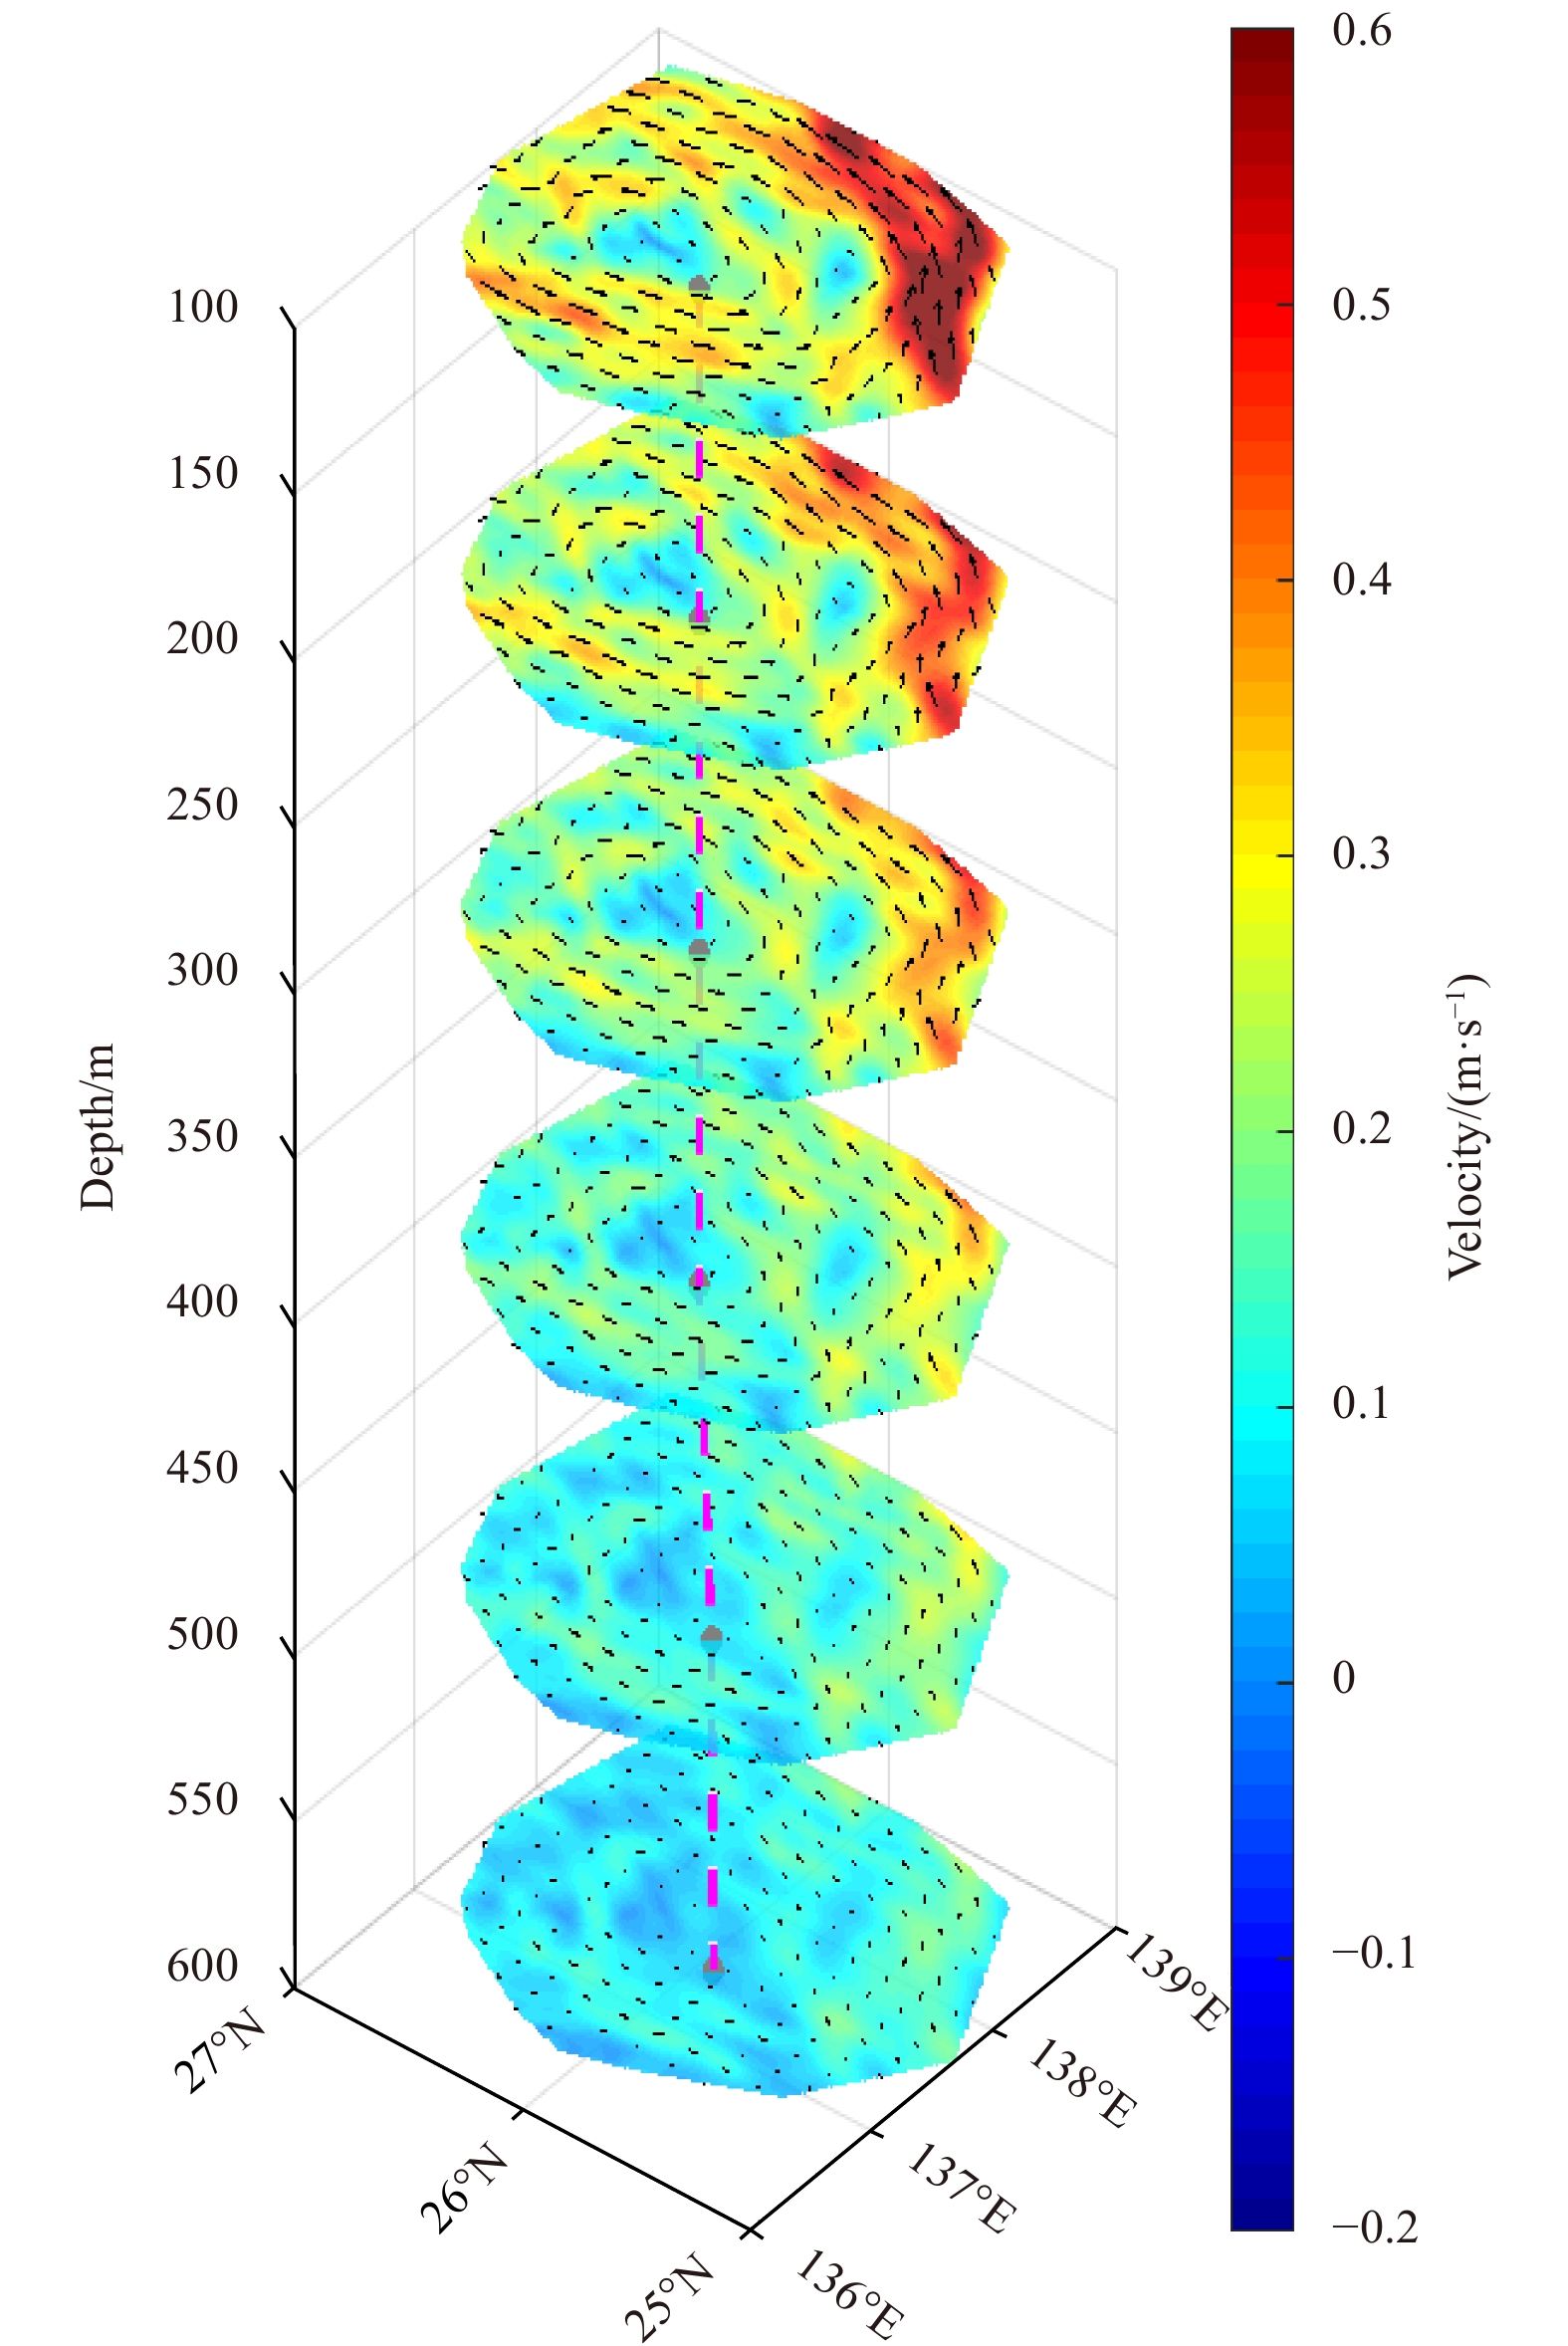
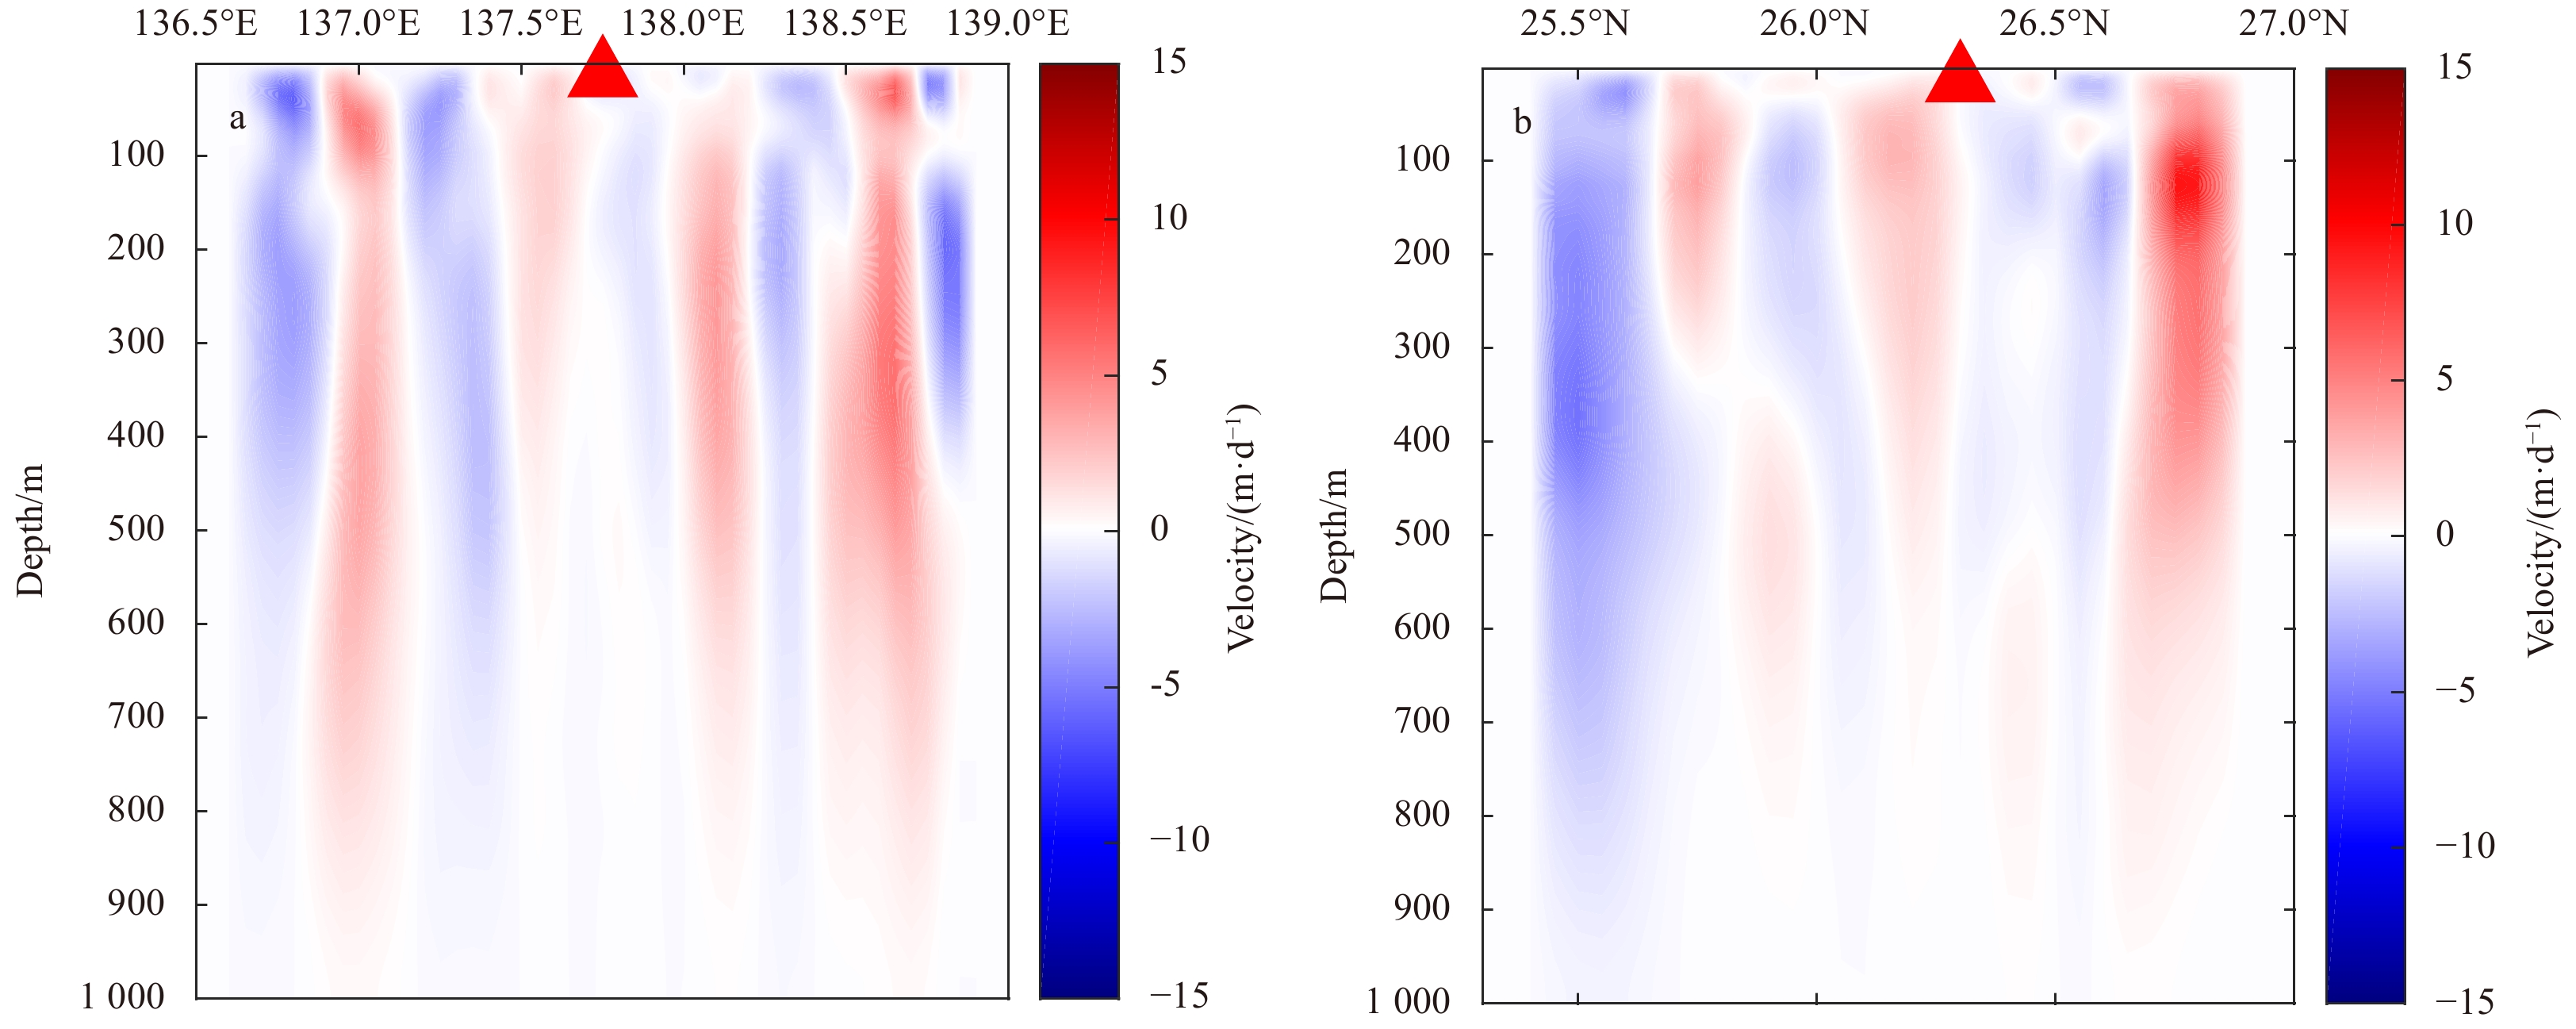
Mesoscale eddies play an important role in modulating the ocean circulation. Many previous studies on the three-dimensional structure of mesoscale eddies were mainly based on composite analysis, and there are few targeted observations for individual eddies. A cyclonic eddy surveyed during an oceanographic cruise in the Northwest Pacific Ocean is investigated in this study. The three-dimensional structure of this cyclonic eddy is revealed by observations and simulated by the four-dimensional variational data assimilation (4DVAR) system combined with the Regional Ocean Modeling System. The observation and assimilation results together present the characteristics of the cyclonic eddy. The cold eddy has an obvious dual-core structure of temperature anomaly. One core is at 50–150 m and another is at 300–550 m, which both have the average temperature anomaly of approximately −3.5°C. The salinity anomaly core is between 250 m and 500 m, which is approximately −0.3. The horizontal velocity structure is axis-asymmetric and it is enhanced on the eastern side of the cold eddy. In the assimilation experiment, sea level anomaly, sea surface temperature, and in situ measurements are assimilated into the system, and the results of assimilation are close to the observations. Based on the high-resolution assimilation output results, the study also diagnoses the vertical velocity in the mesoscale eddy, which reaches the maximum of approximately 10 m/d. The larger vertical velocity is found to be distributed in the range of 0.5 to 1 time of the normalized radius of the eddy. The validation of the simulation result shows that the 4DVAR method is effective to reconstruct the three-dimensional structure of mesoscale eddy and the research is an application to study the mesoscale eddy in the Northwest Pacific by combining observation and assimilation methods.
Effects of westward shoaling pycnocline on characteristics and energetics of internal solitary wave in the Luzon Strait by numerical simulations
Haibin Lü, Yujun Liu, Xiaokang Chen, Guozhen Zha, Shuqun Cai
2021, 40(5): 20-29. doi: 10.1007/s13131-021-1808-0
Abstract:
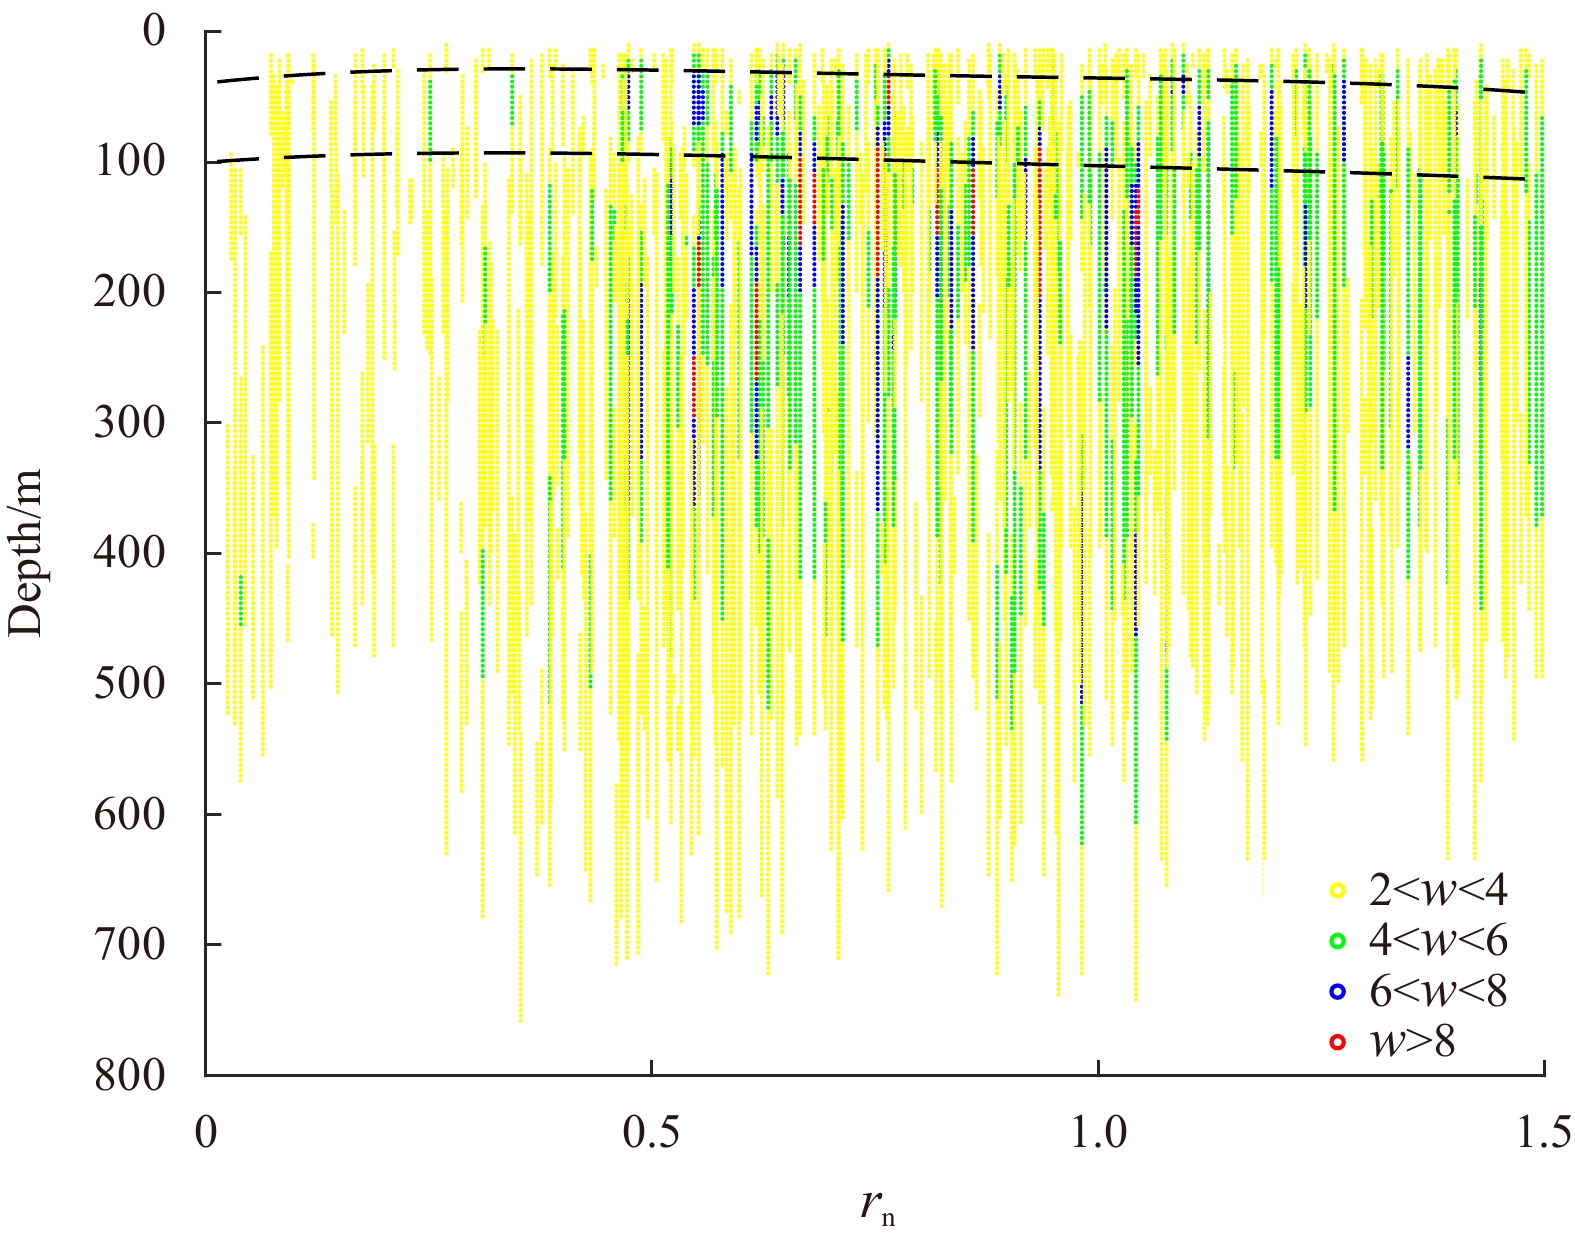
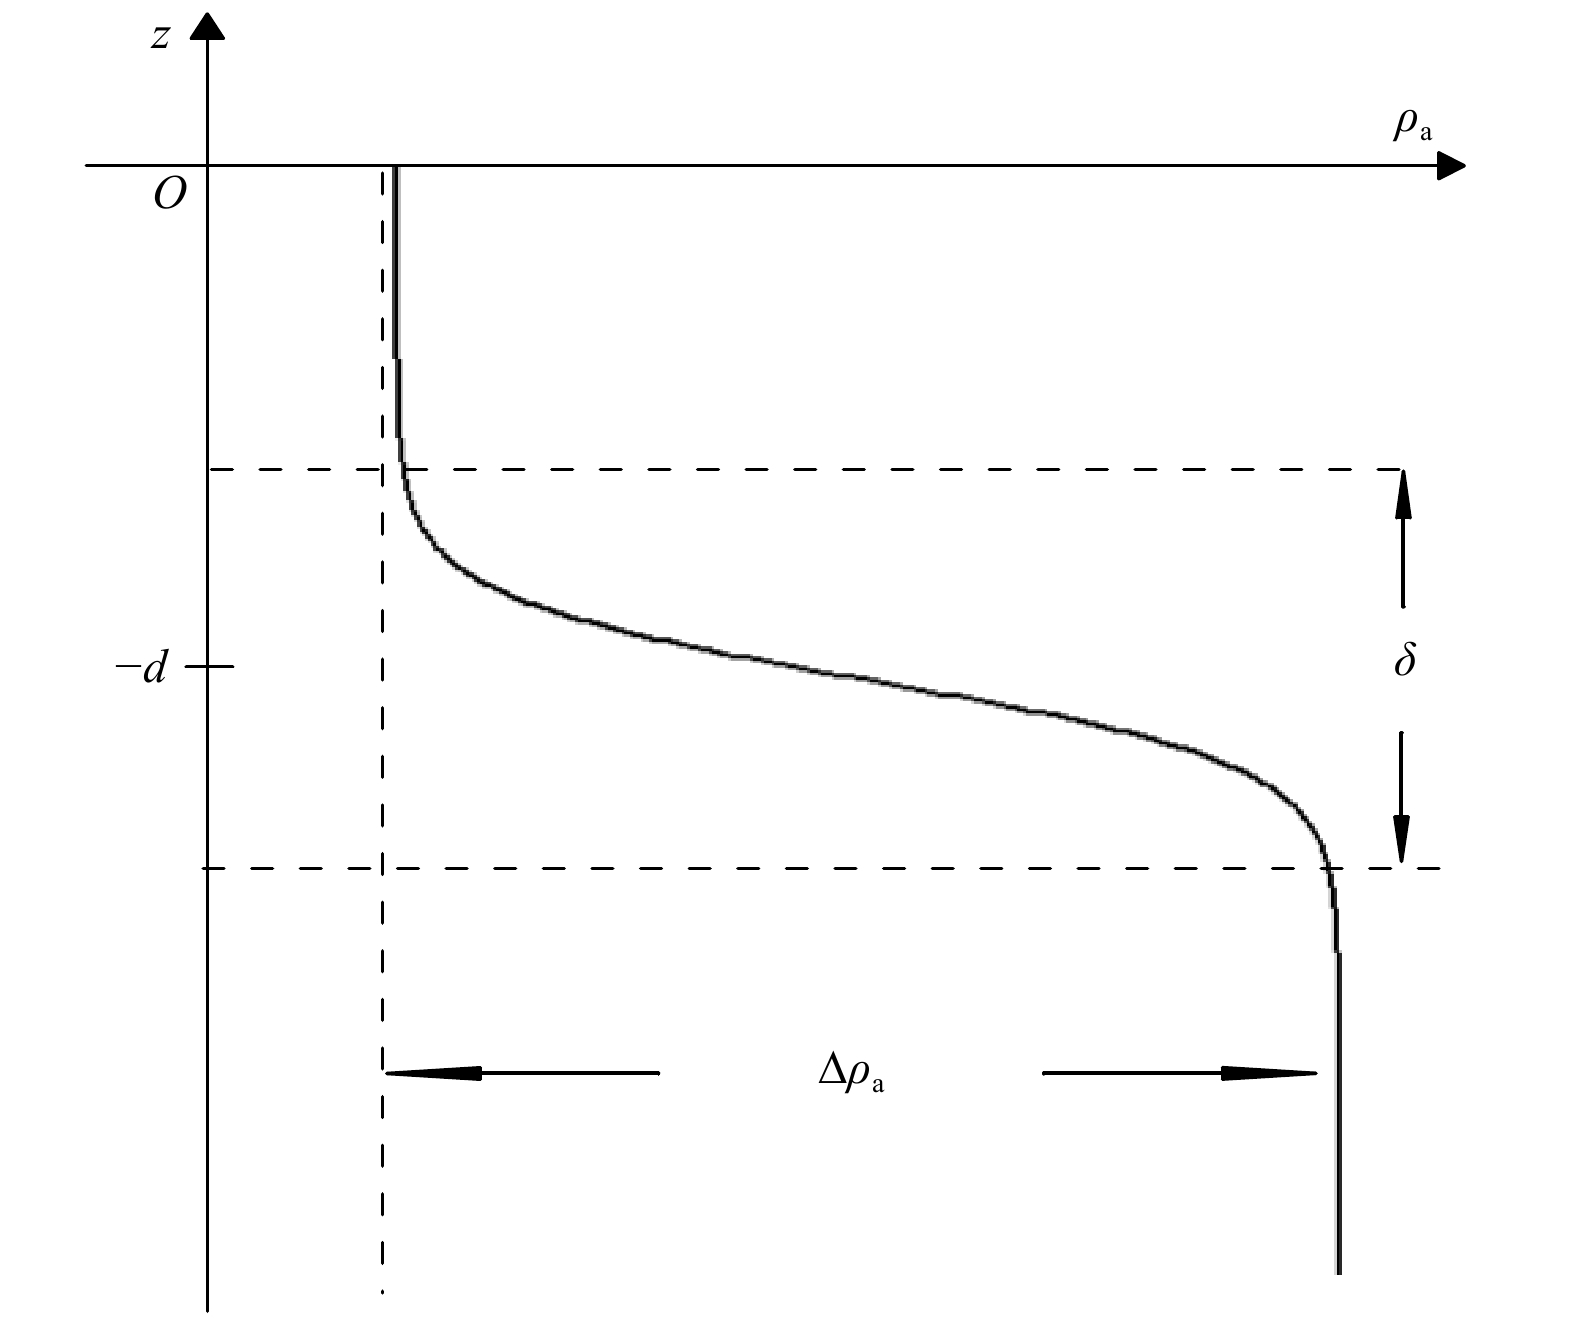
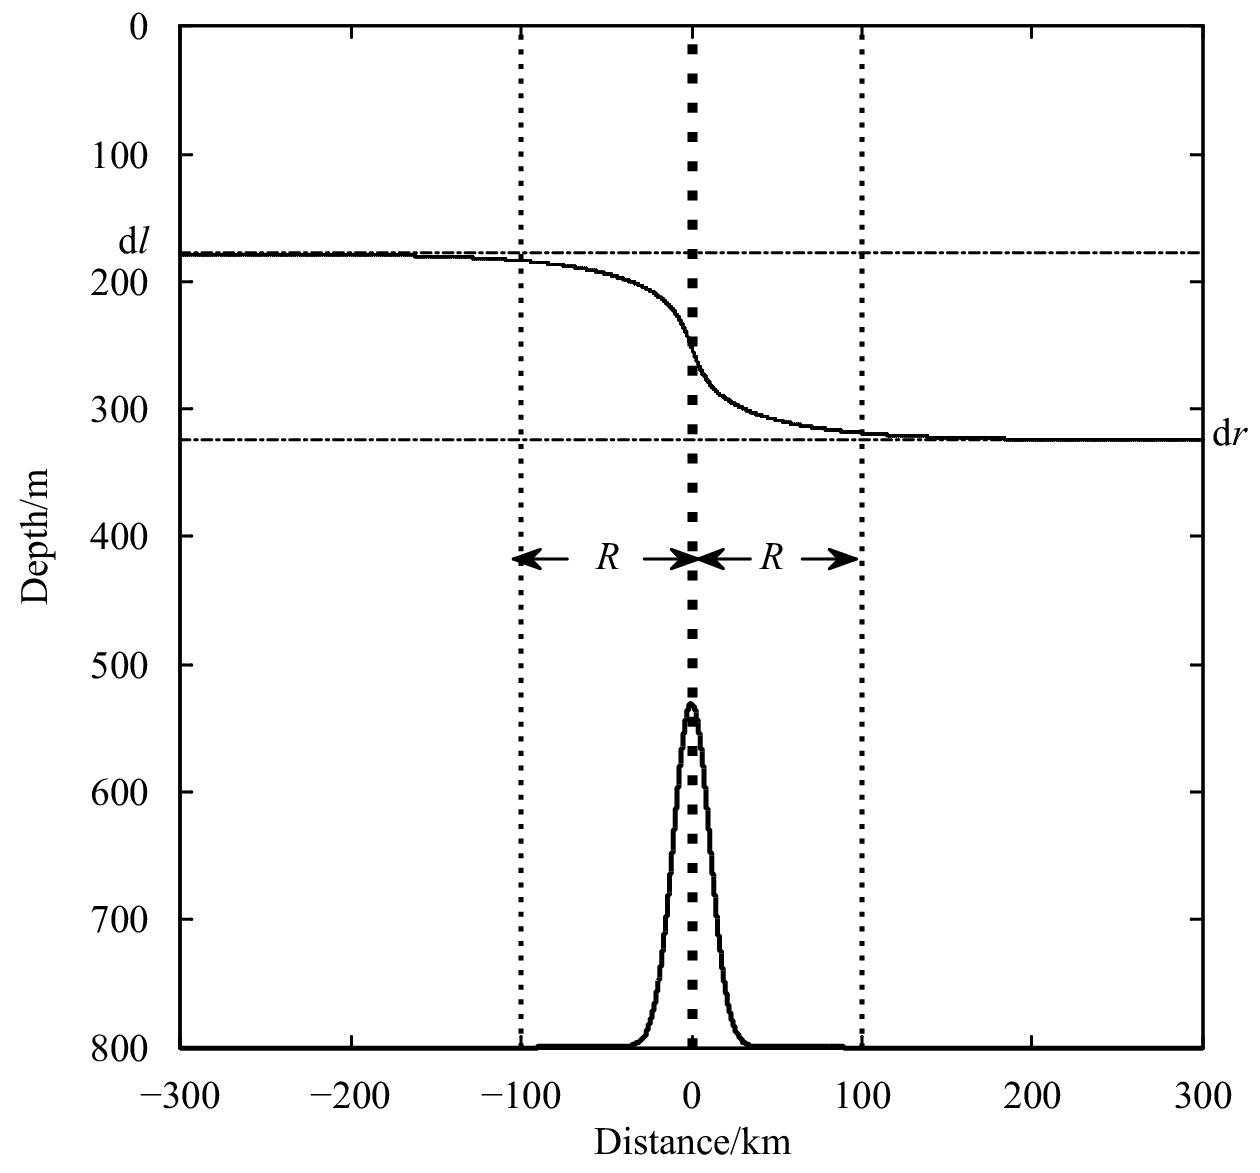
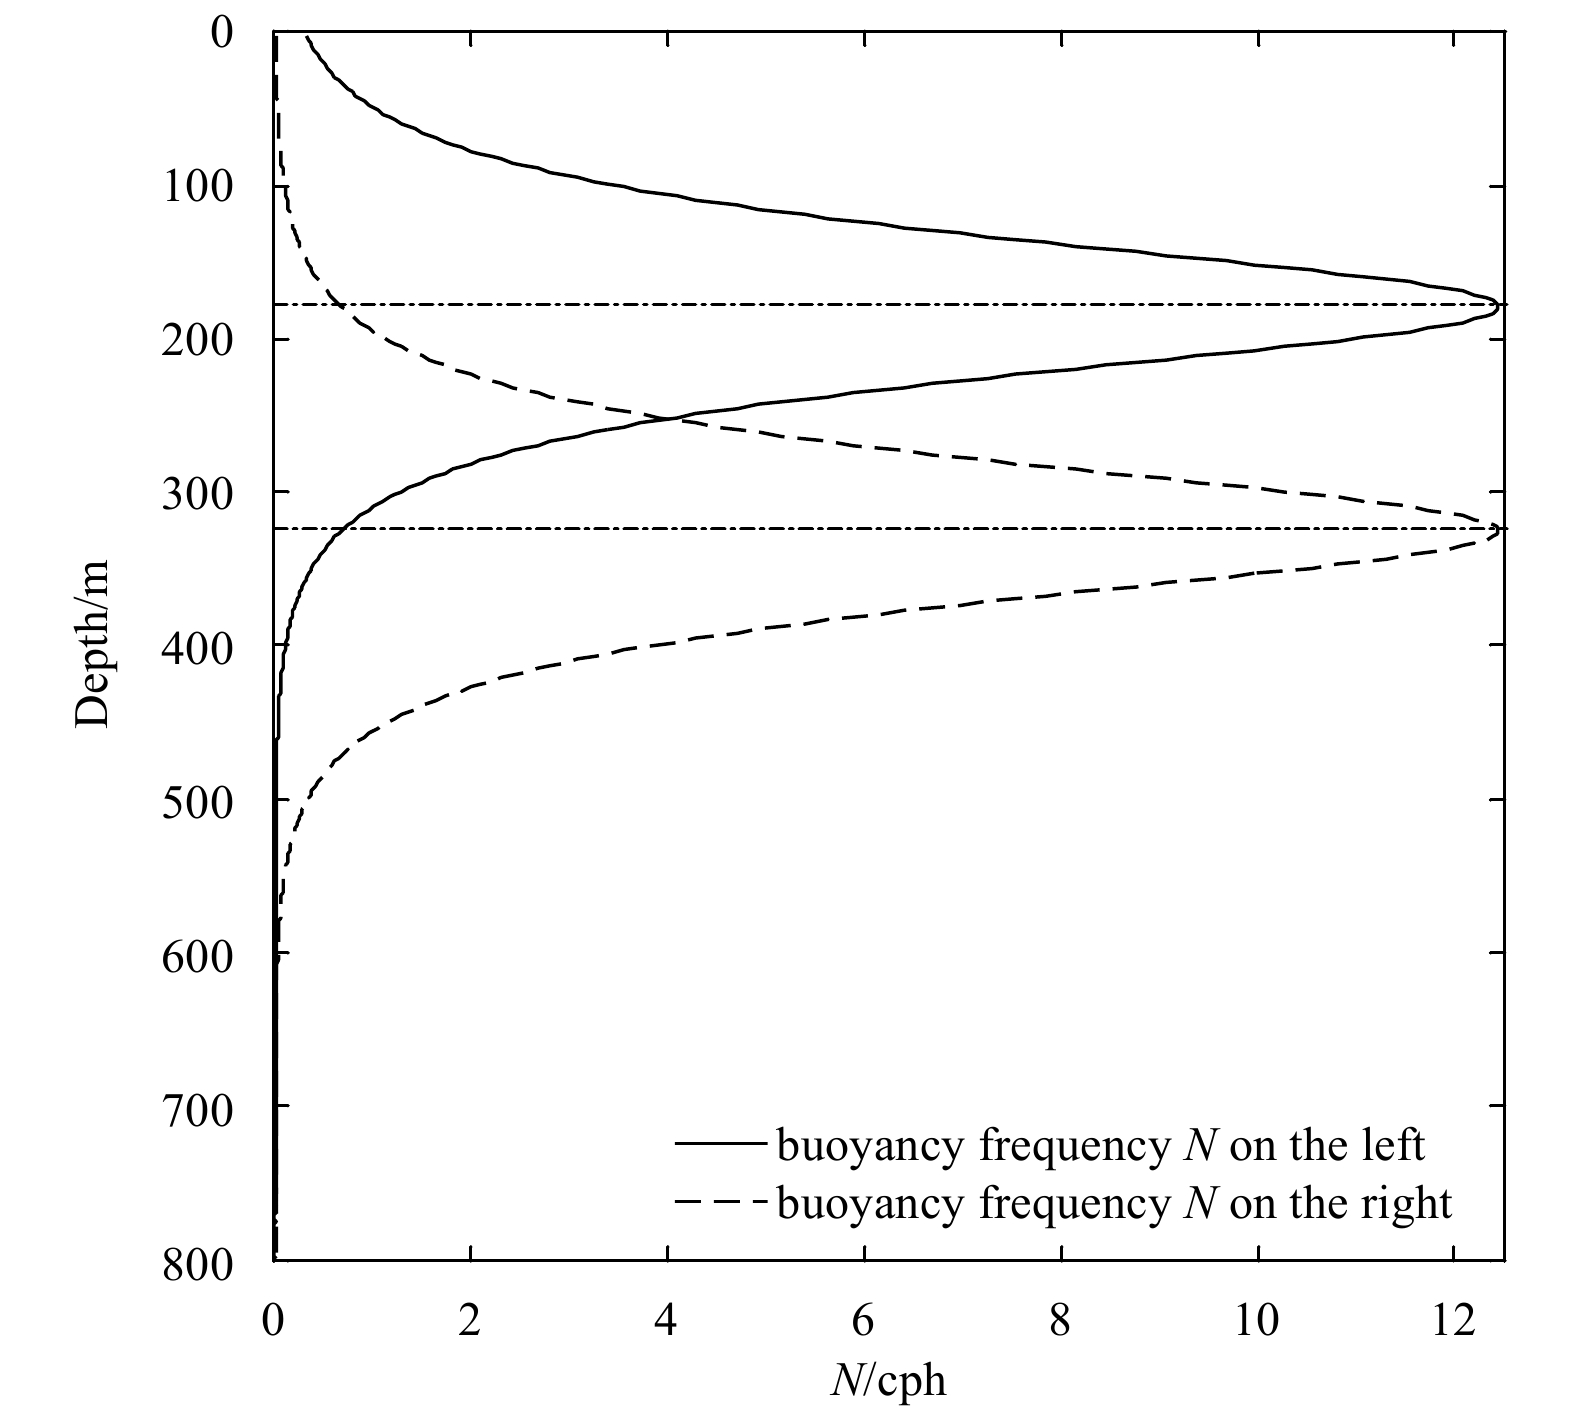
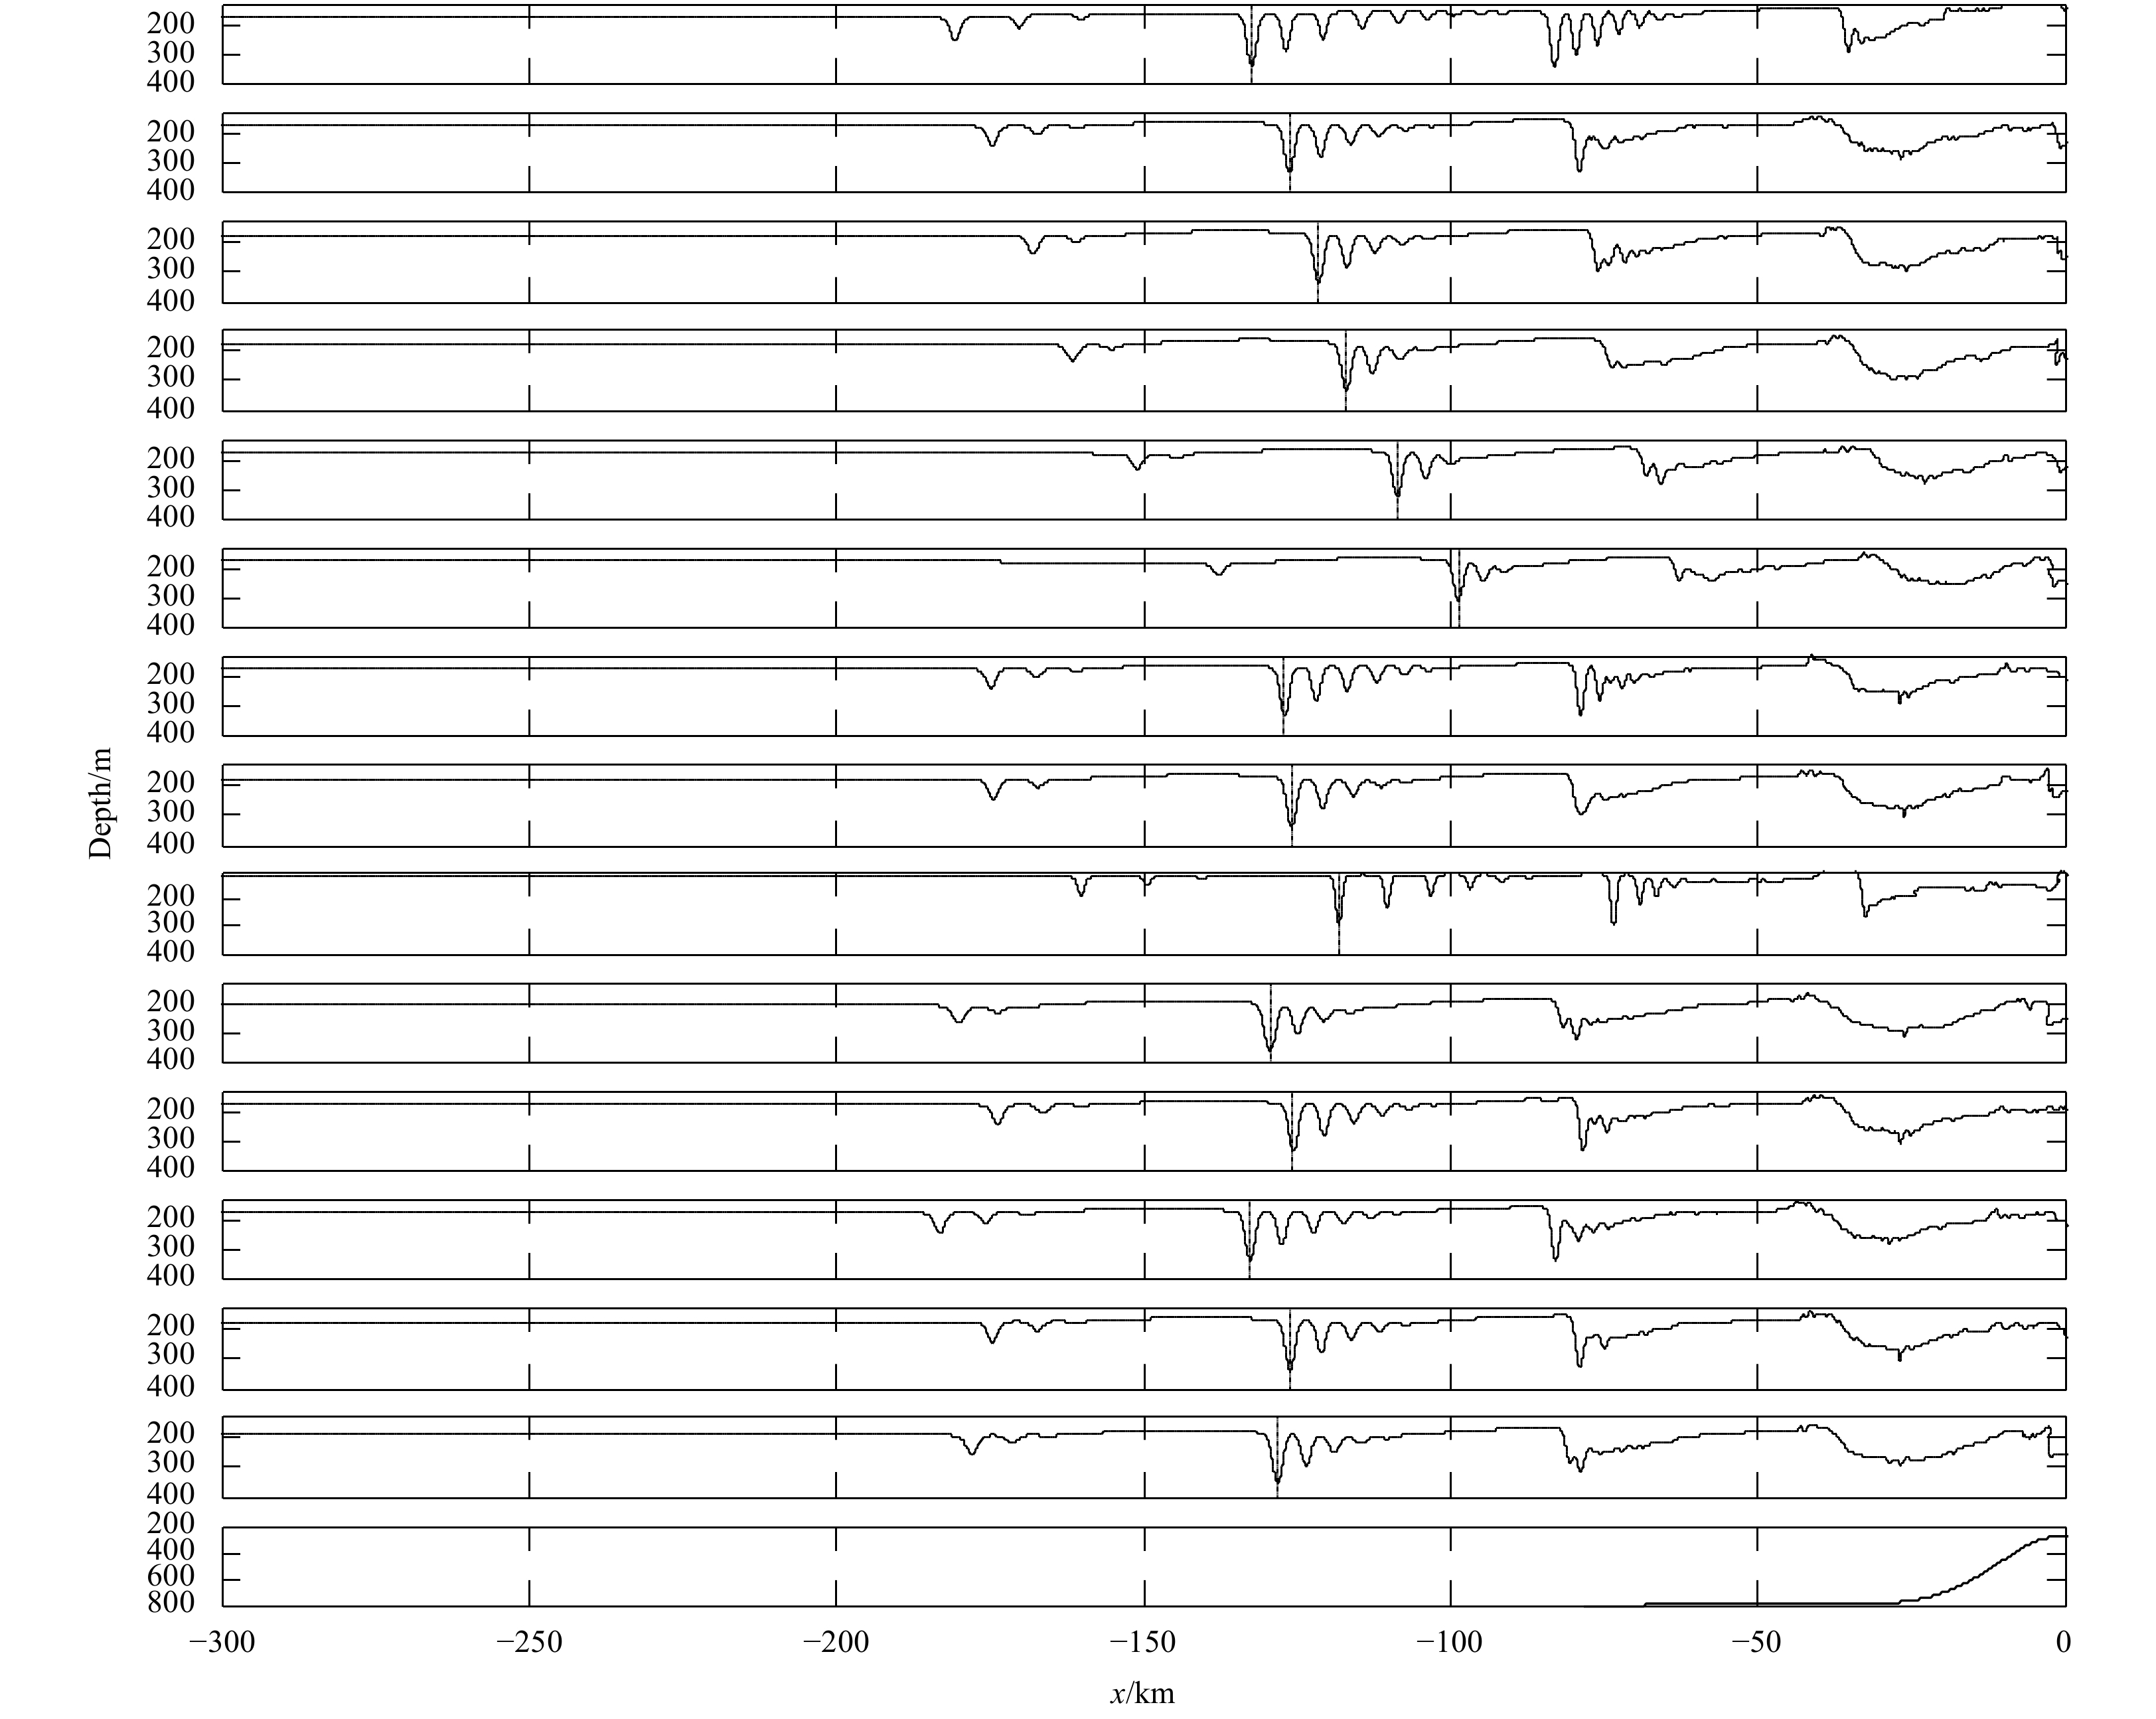
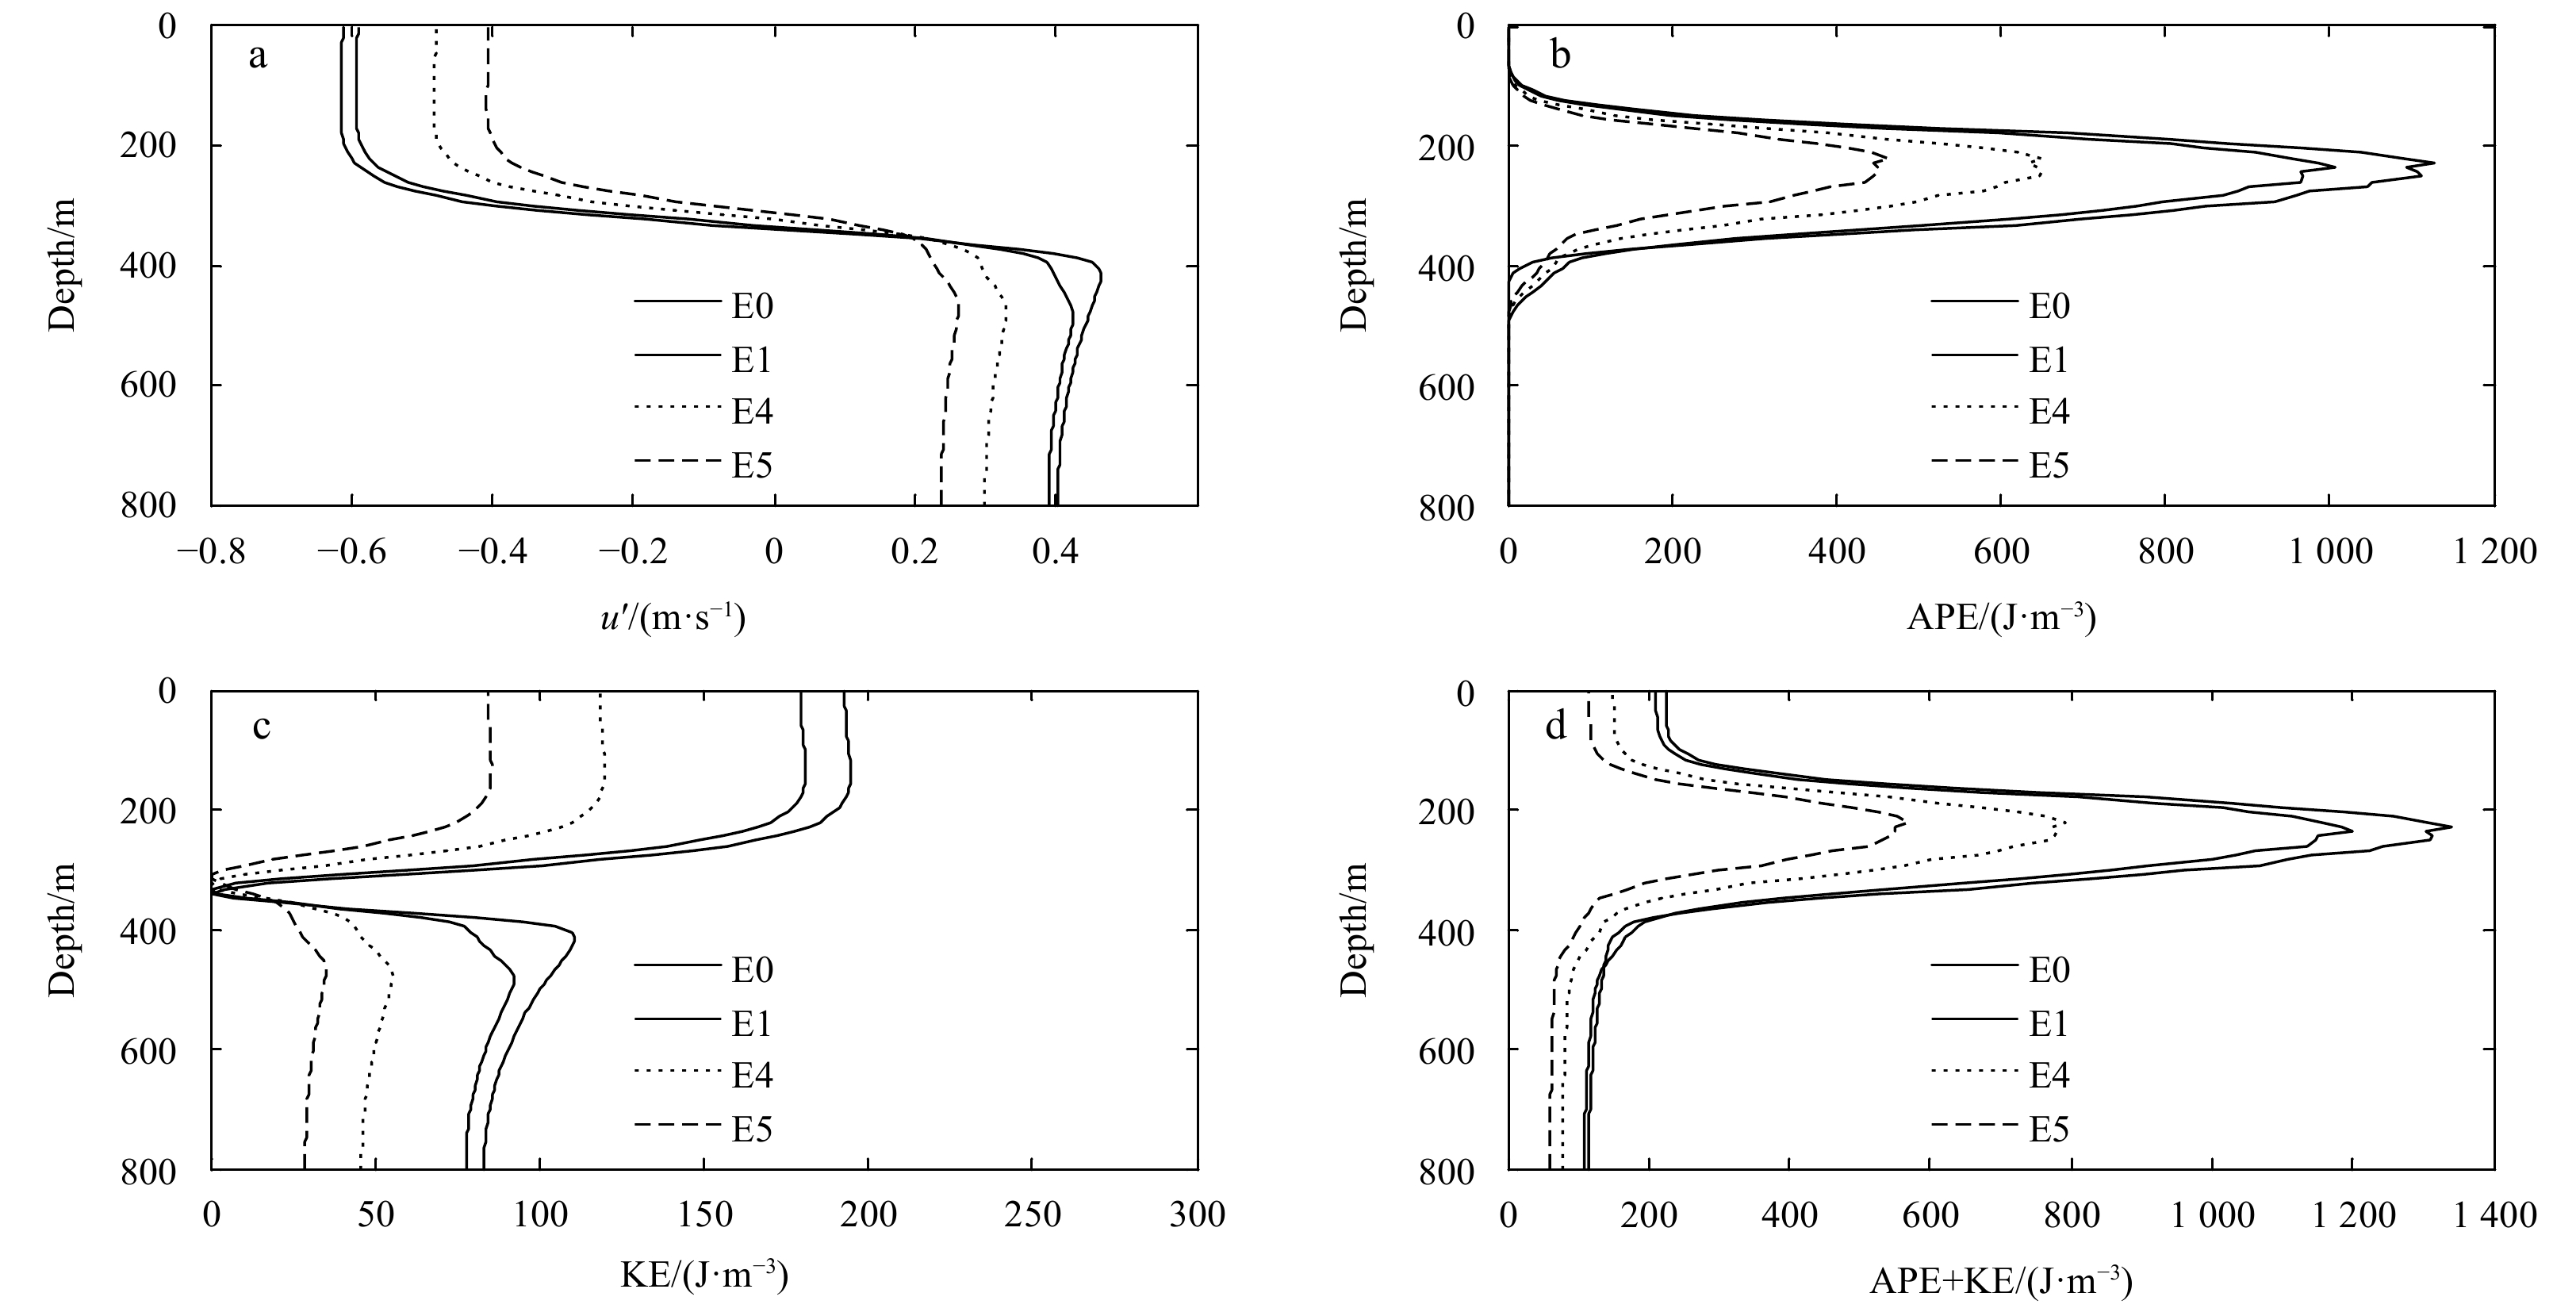
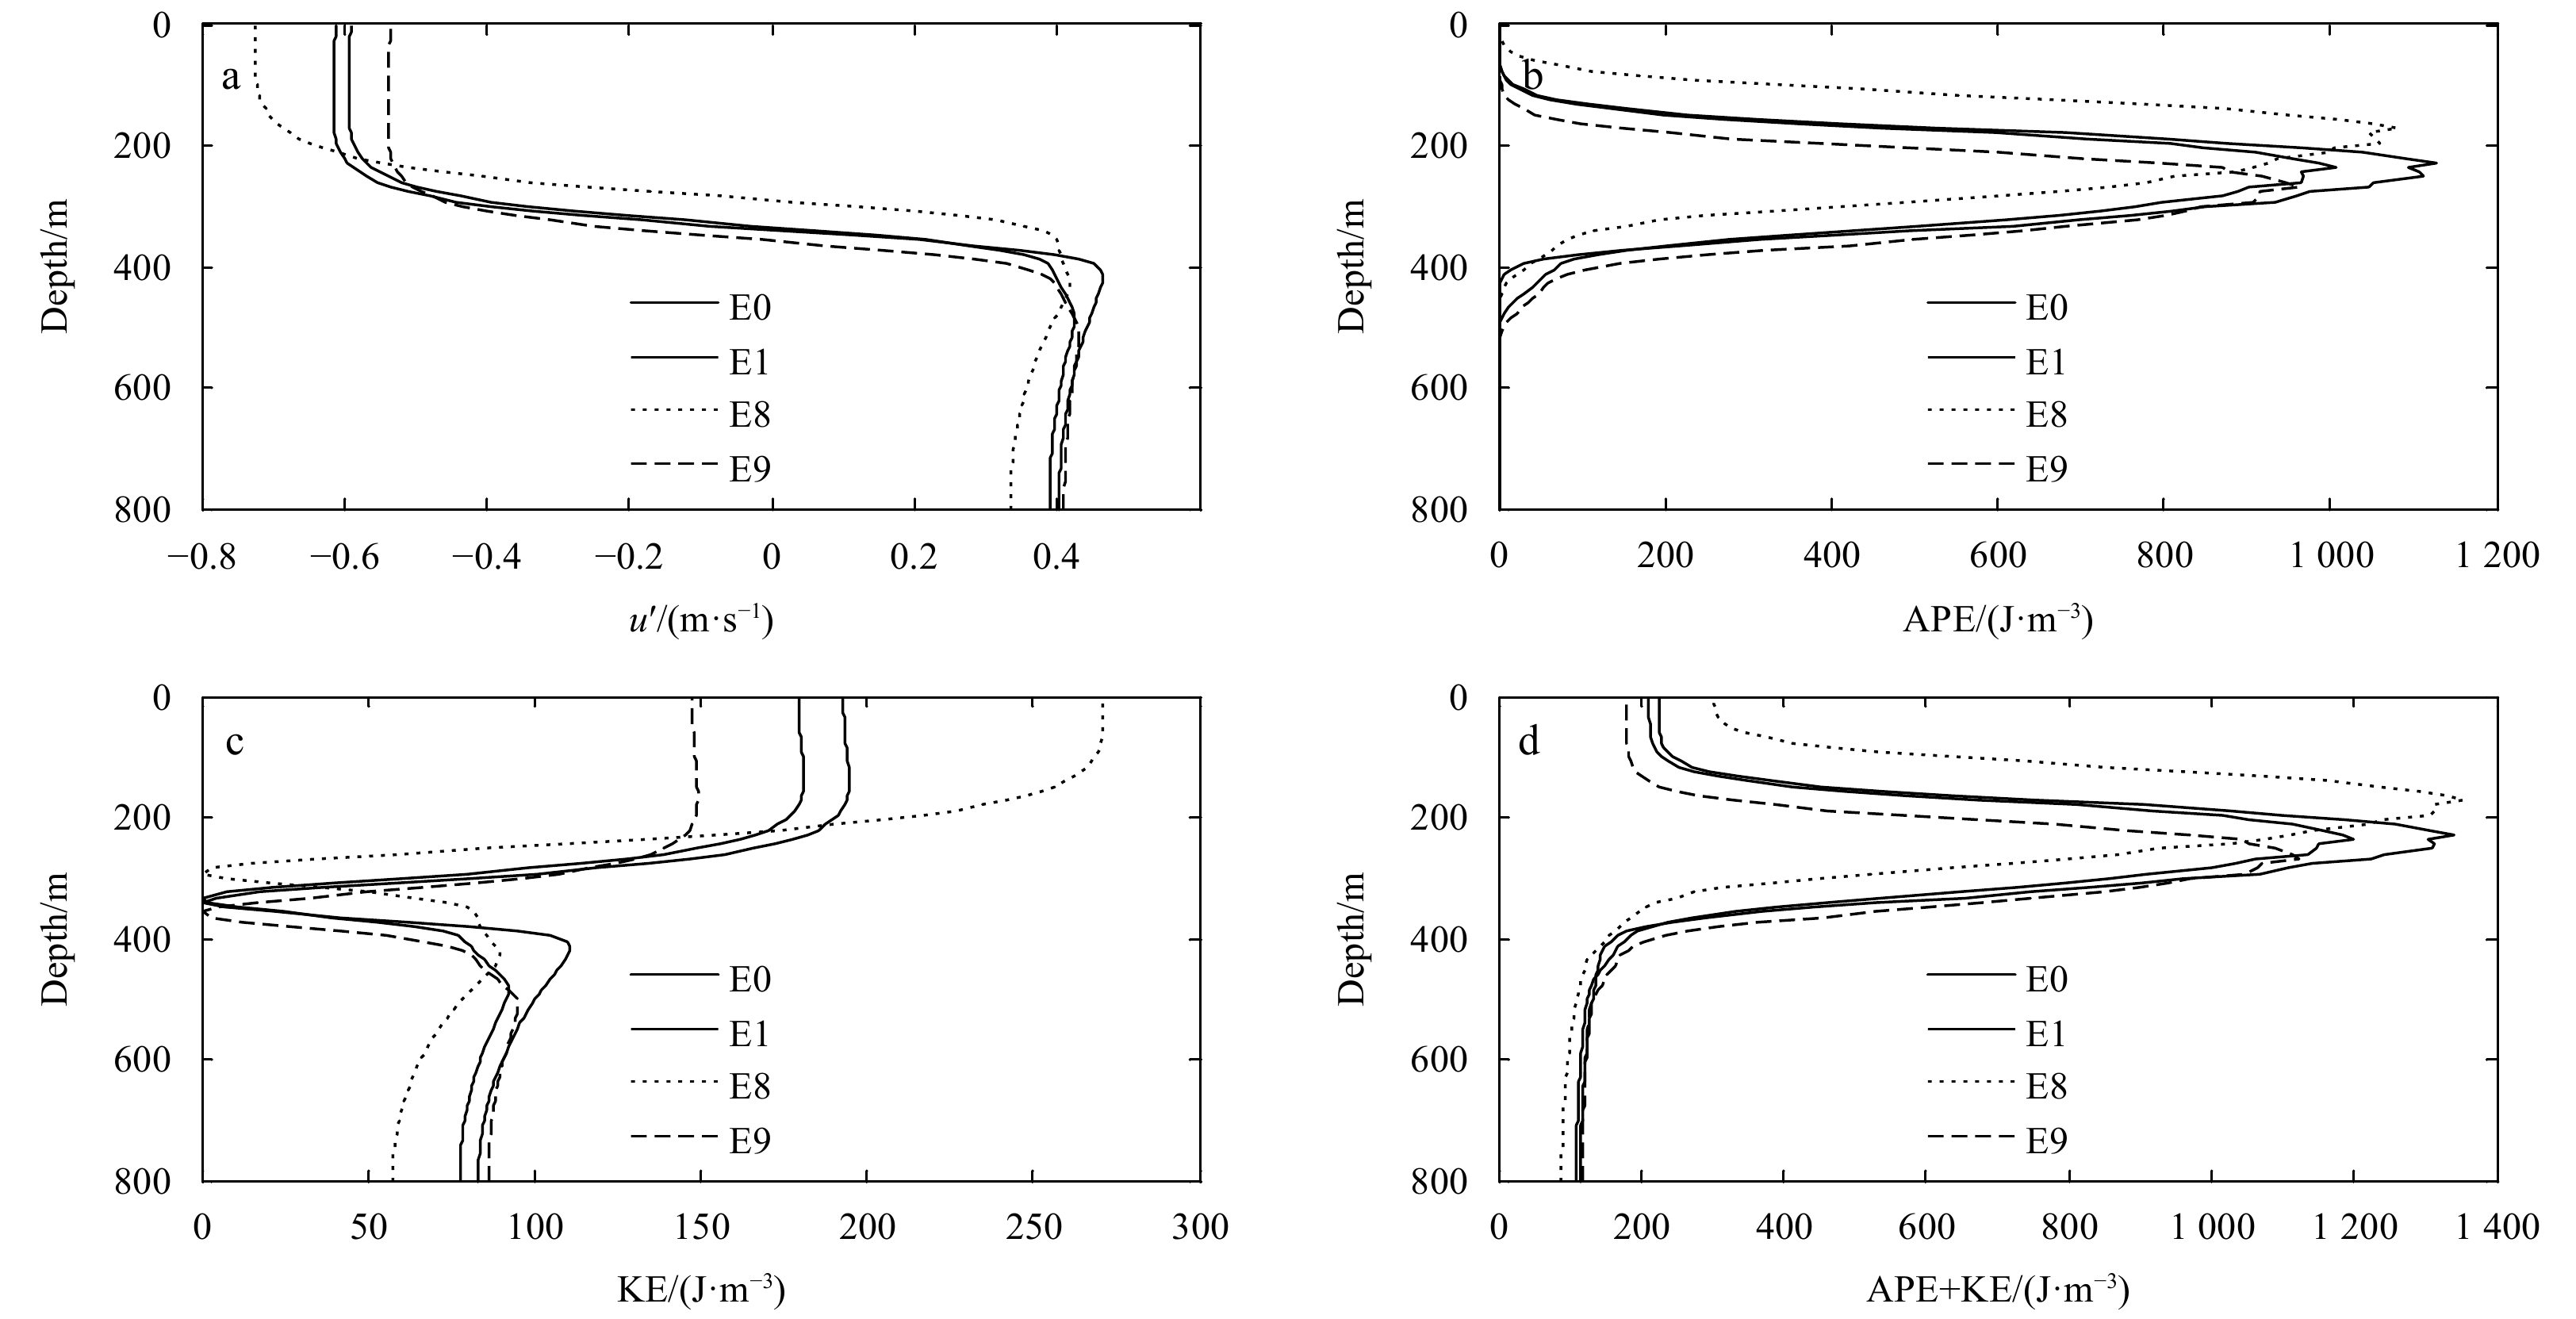
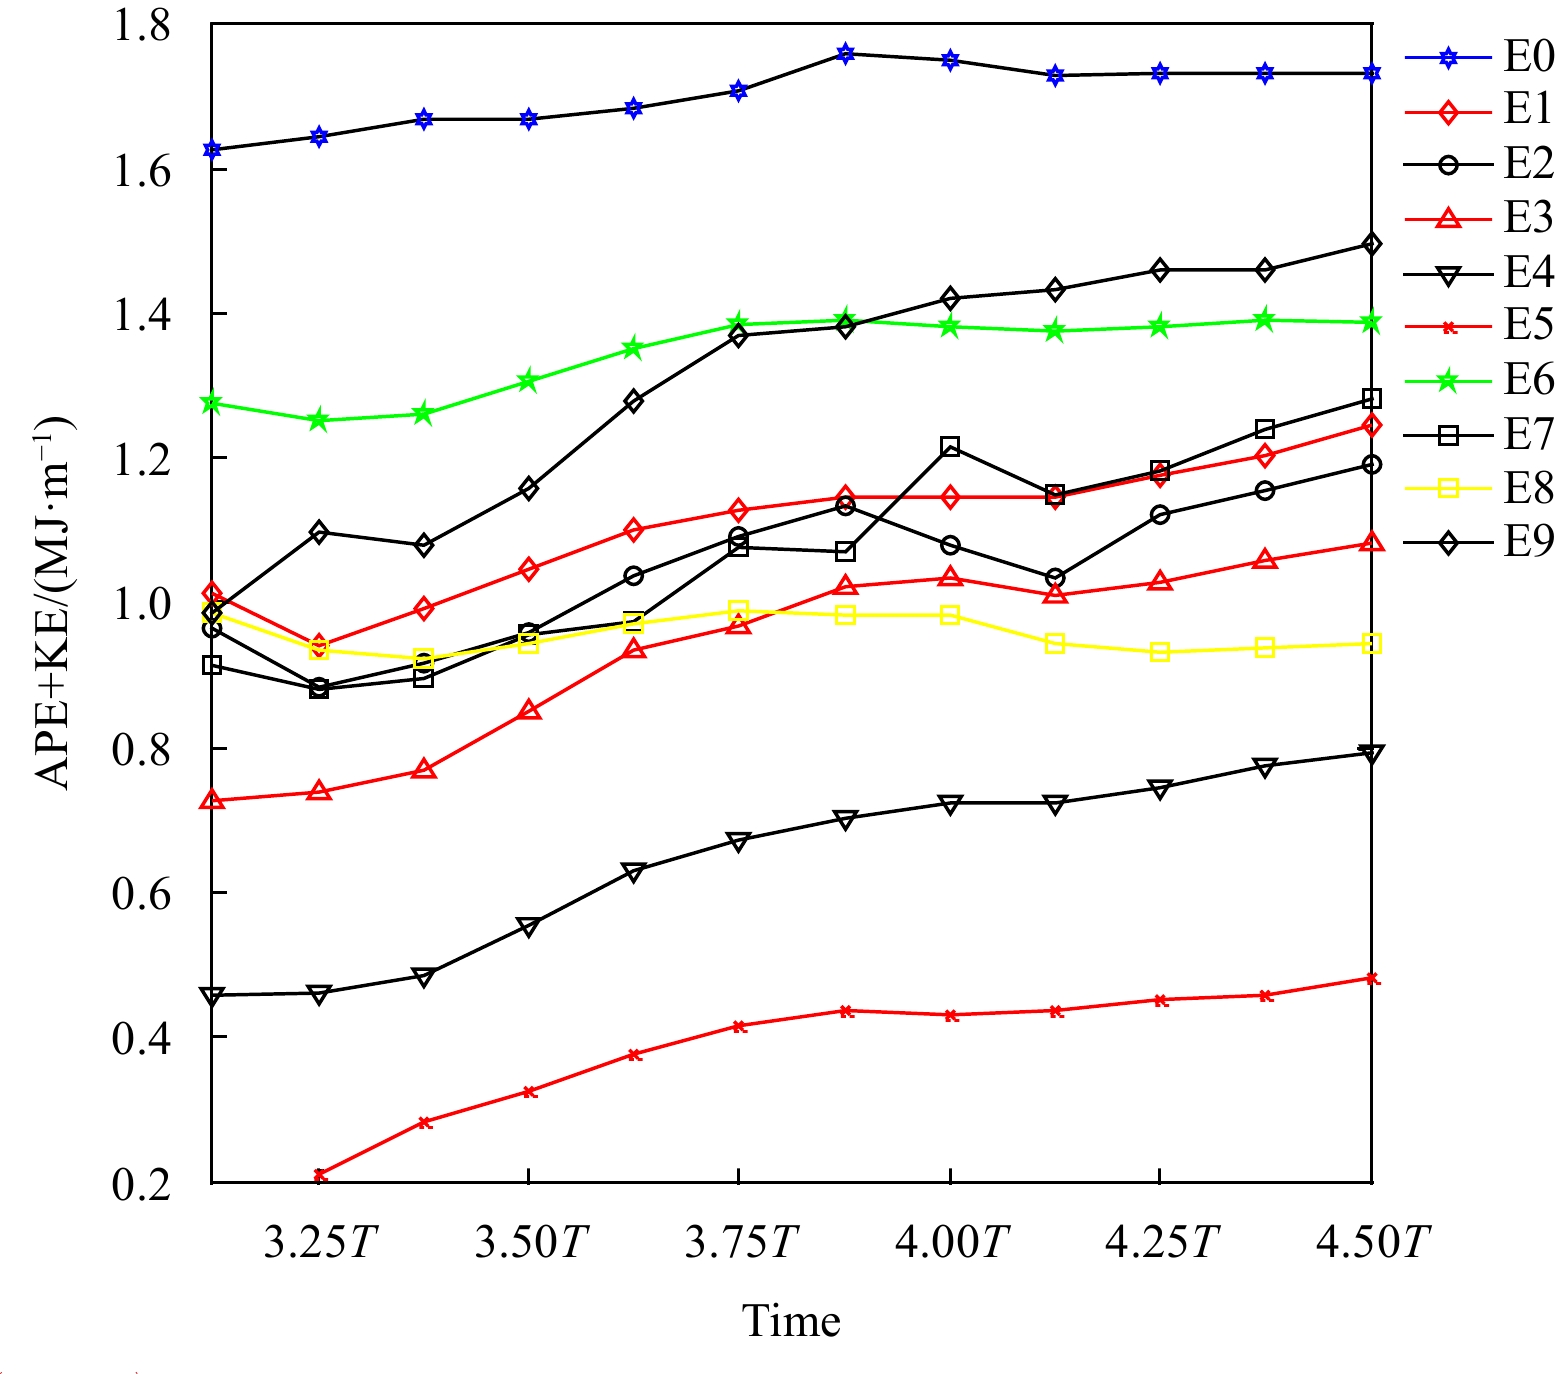
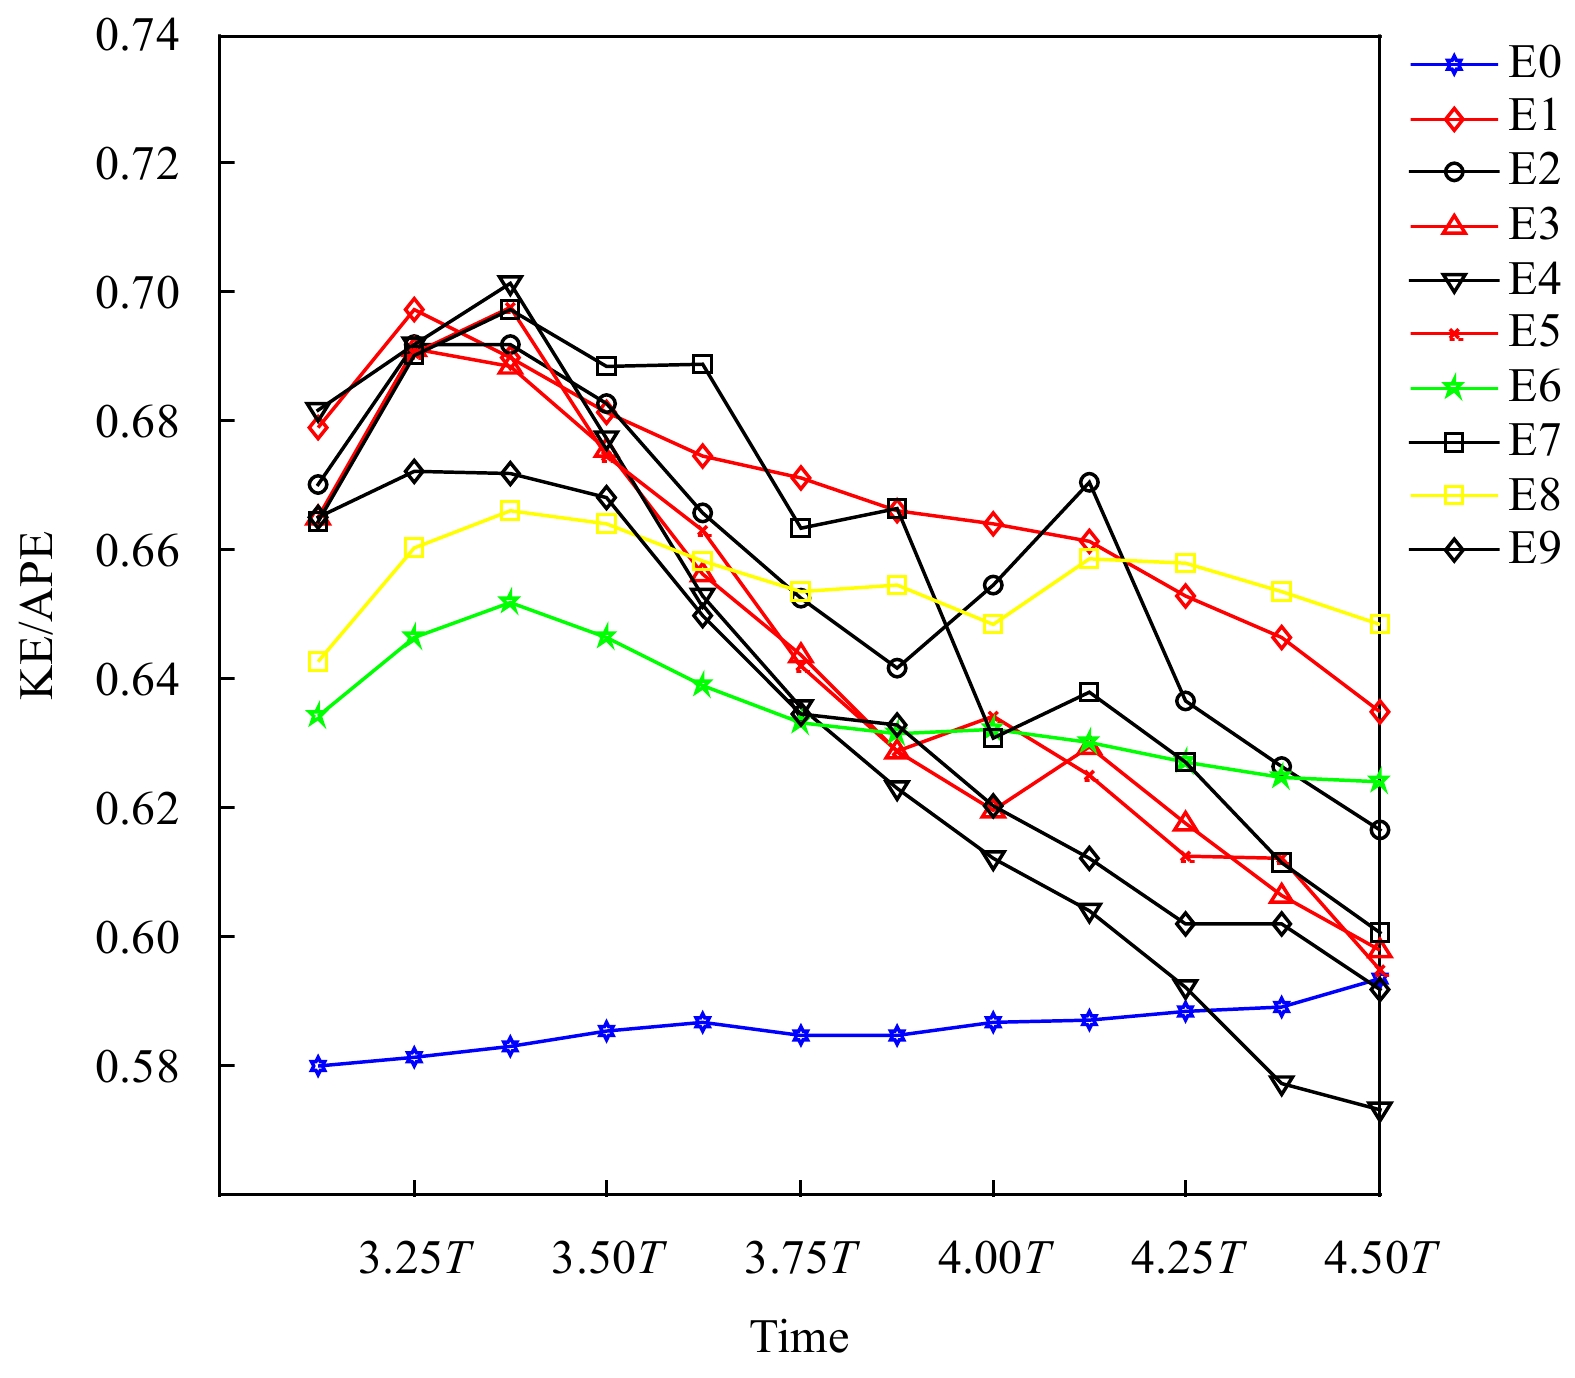
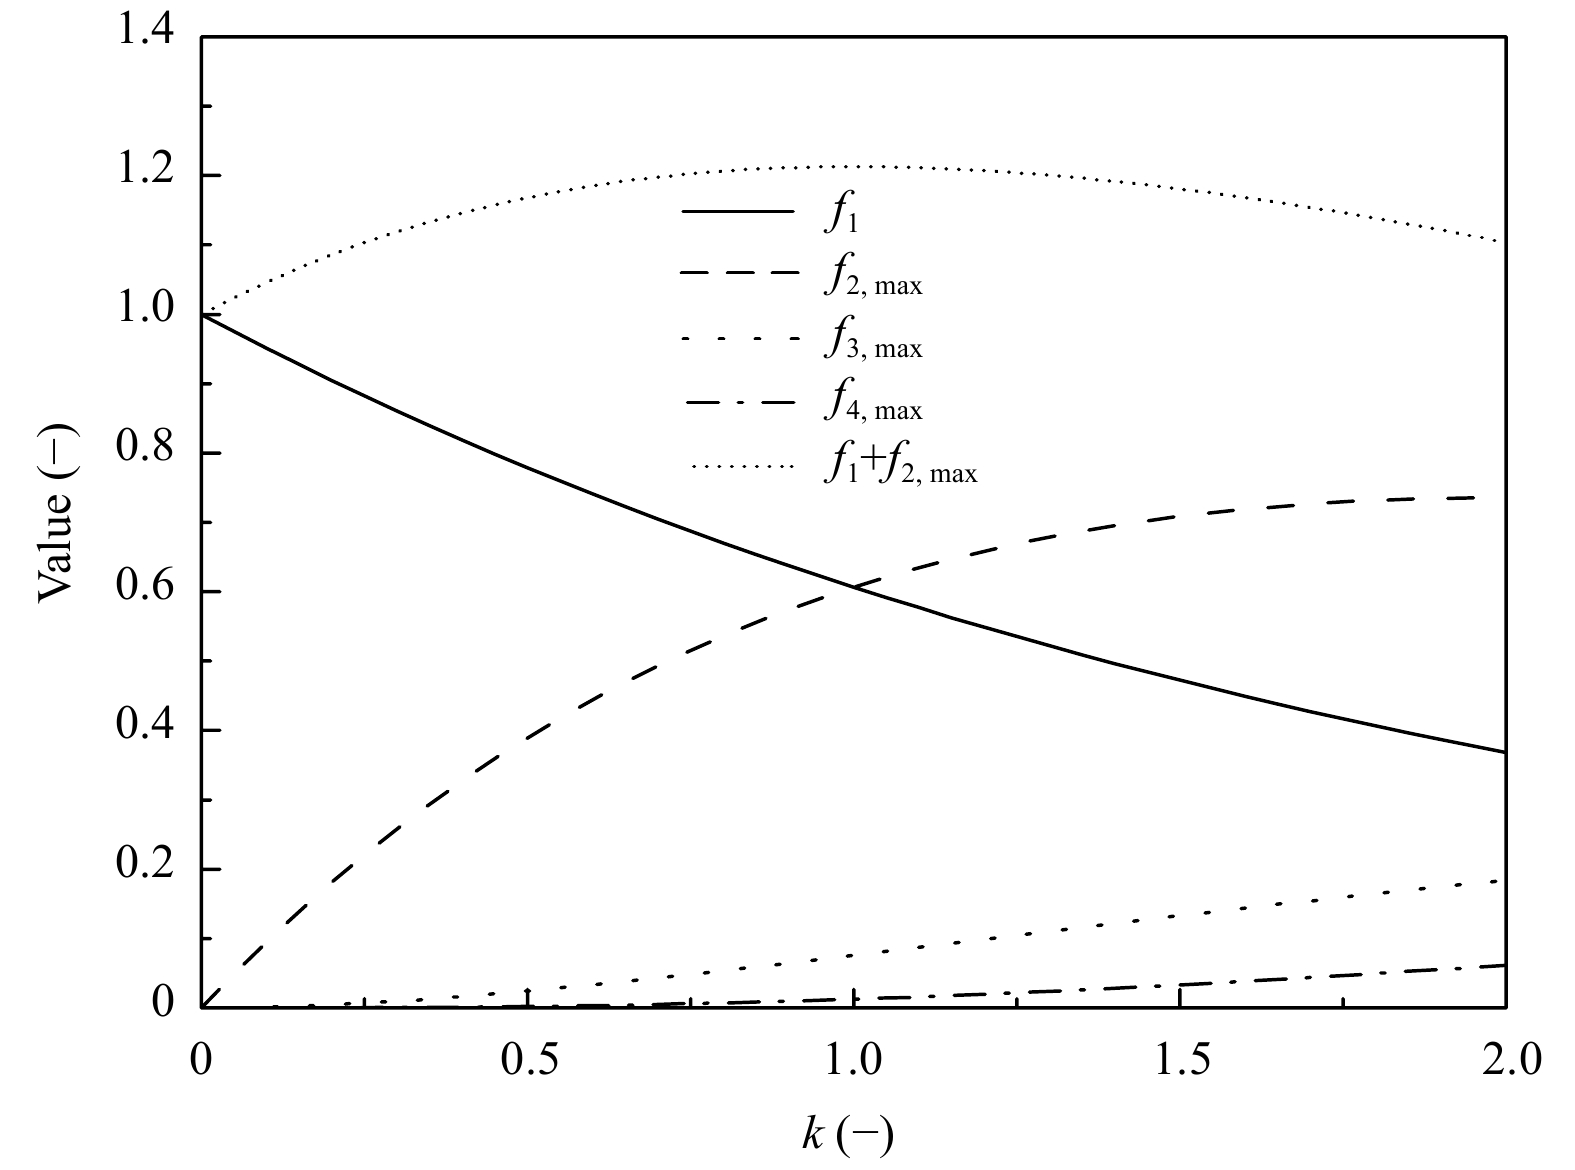
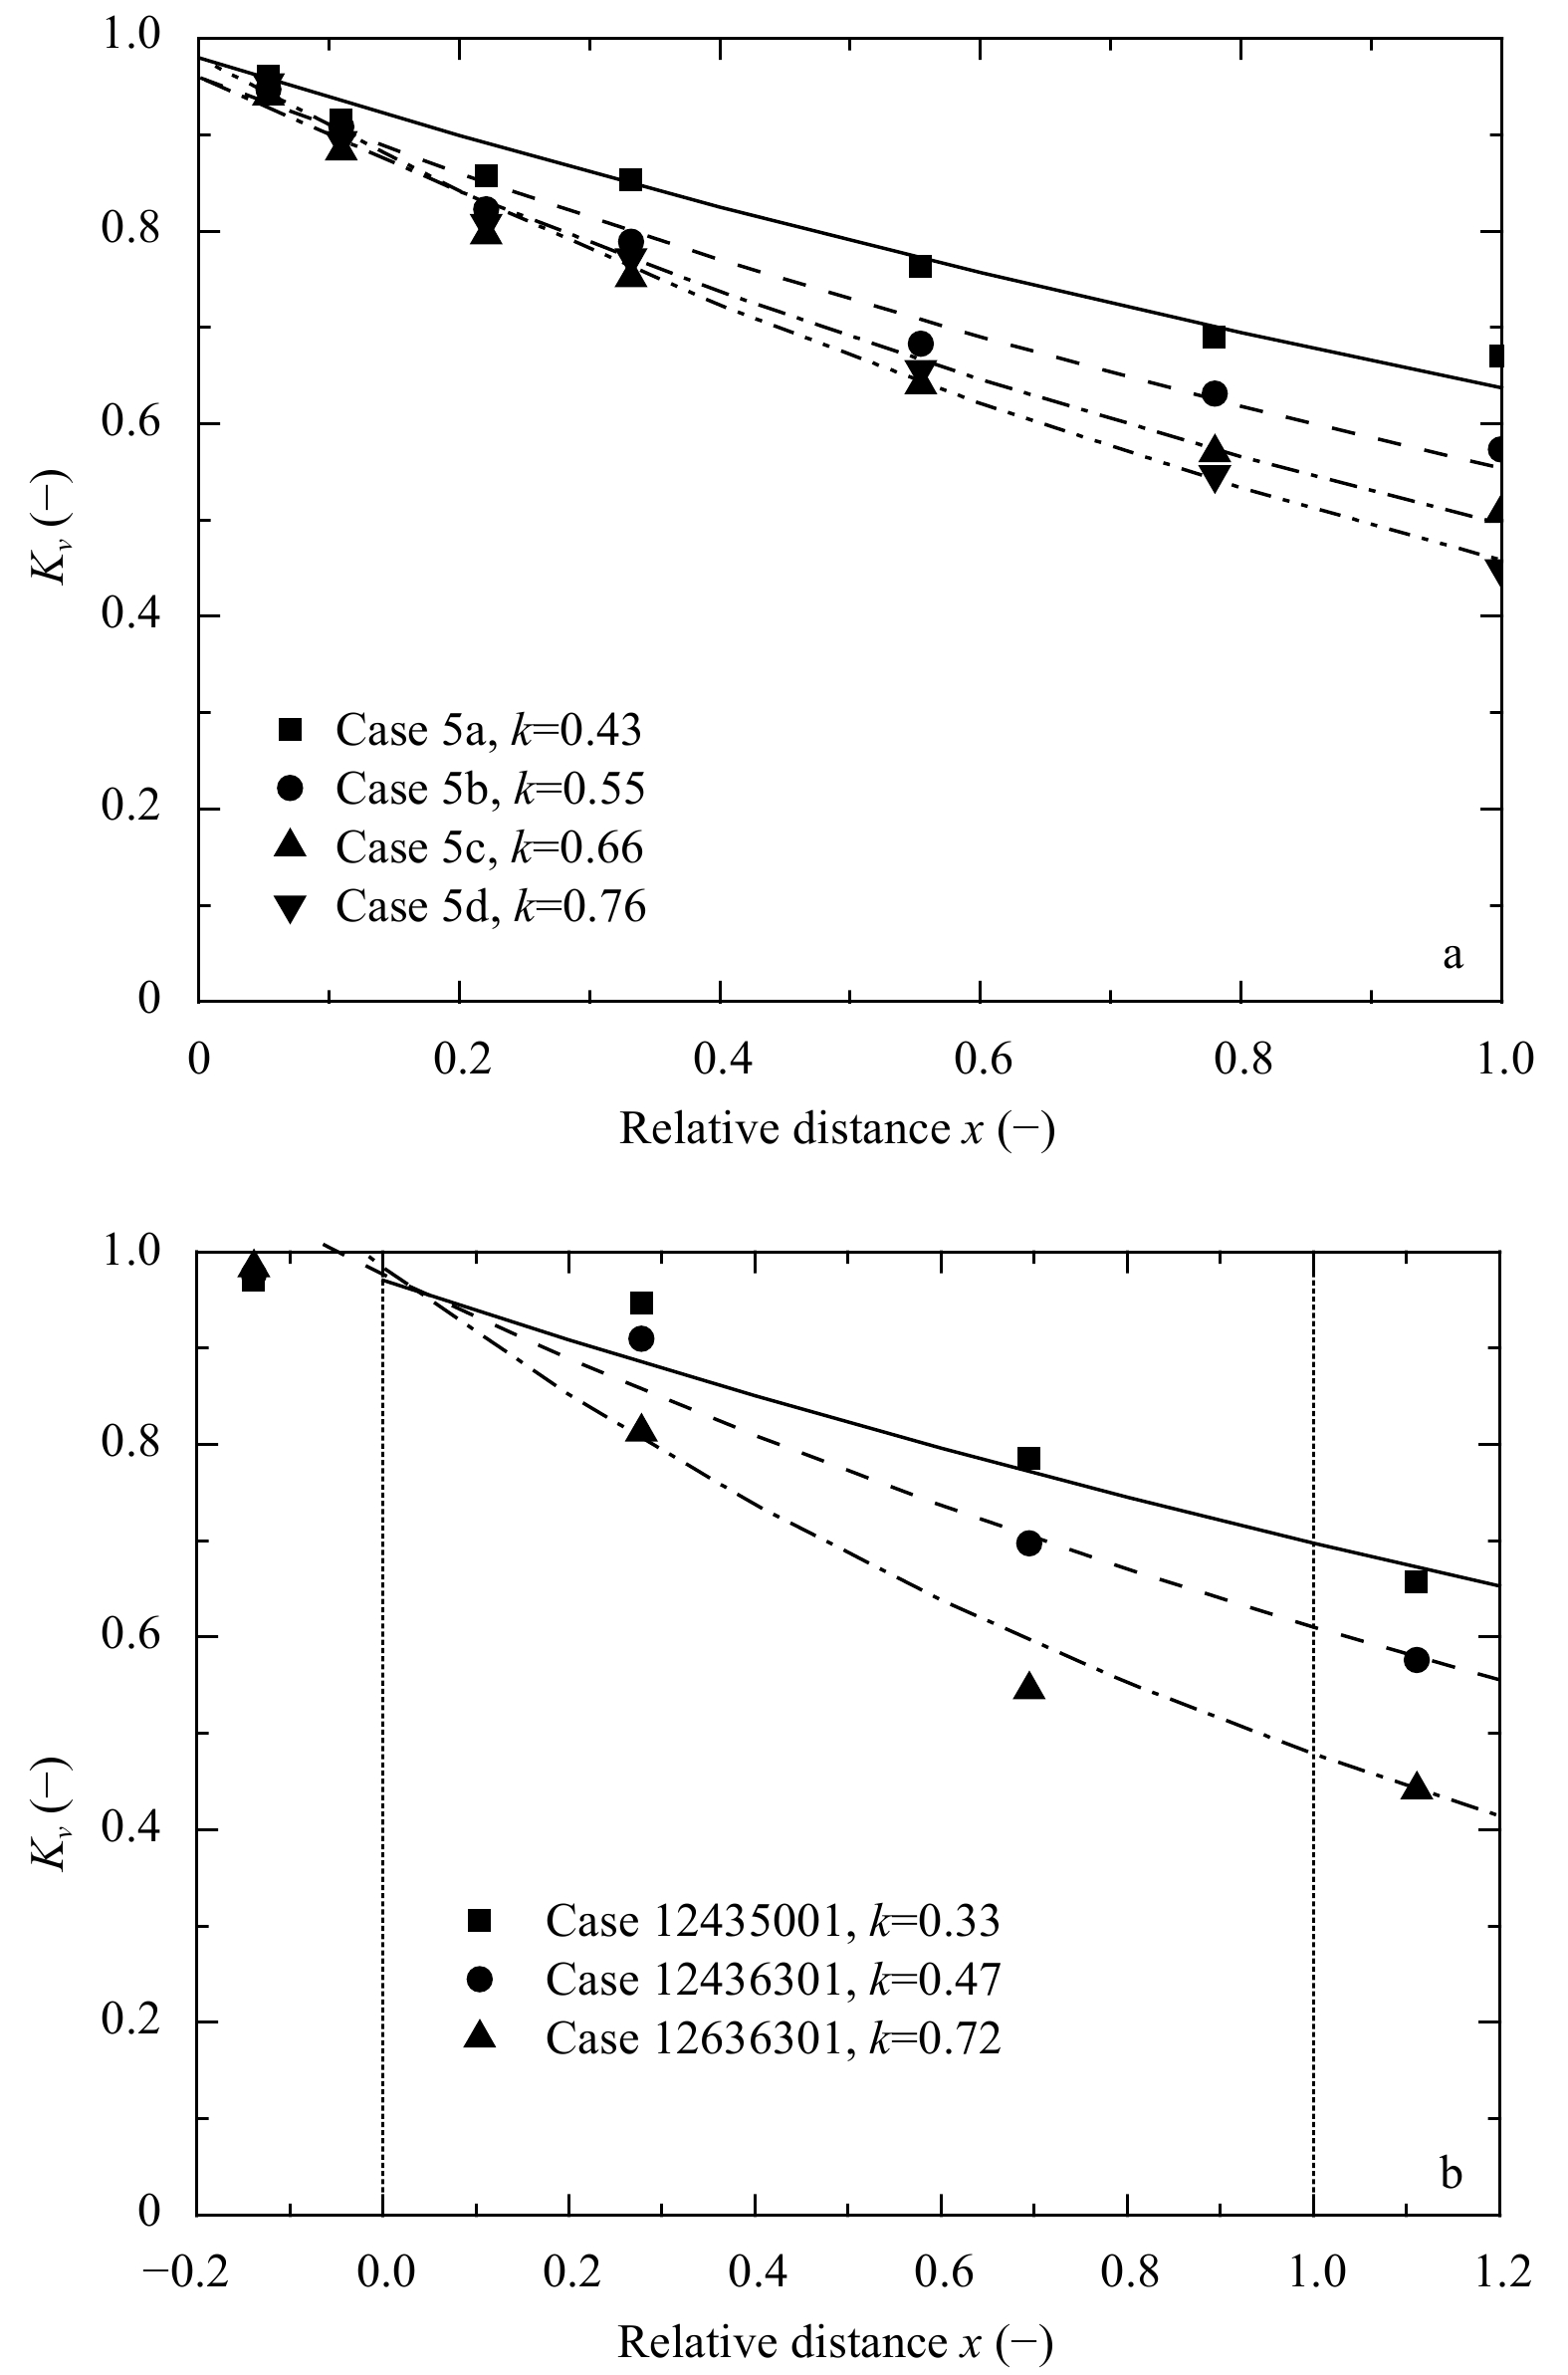
An internal gravity wave model was employed to simulate the generation of internal solitary waves (ISWs) over a sill by tidal flows. A westward shoaling pycnocline parameterization scheme derived from a three-parameter model was adopted, and then 14 numerical experiments were designed to investigate the influence of the pycnocline thickness, density difference across the pycnocline, westward shoaling isopycnal slope angle and pycnocline depth on the ISWs. When the pycnocline thickness on both sides of the sill increases, the total barotropic kinetic energy, total baroclinic energy and ratio of baroclinic kinetic energy (KE) to available potential energy (APE) decrease, whilst the depth of isopycnal undergoing maximum displacement and ratio of baroclinic energy to barotropic energy increase. When the density difference on both sides of the sill decreases synchronously, the total barotropic kinetic energy, ratio of baroclinic energy to barotropic energy and total baroclinic energy decrease, whilst the depth of isopycnal undergoing maximum displacement increases. When the westward shoaling isopycnal slope angle increases, the total baroclinic energy increases whilst the depth of turning point almost remains unchanged. When the depth of westward shoaling pycnocline on both sides of the sill reduces, the ratio of baroclinic energy to barotropic energy and total baroclinic energy decrease, whilst the total barotropic kinetic energy and ratio of KE to APE increase. When one of the above four different influencing factors was increased by 10% while the other factors keep unchanged, the amplitude of the leading soliton in ISW Packet A was decreased by 2.80%, 7.47%, 3.21% and 6.42% respectively. The density difference across the pycnocline and the pycnocline depth are the two most important factors in affecting the characteristics and energetics of ISWs.
A rapid assessment method for calculating the drag coefficient in wave attenuation by vegetation
Zhilin Zhang, Bensheng Huang, Hongxiang Ji, Xin Tian, Jing Qiu, Chao Tan, Xiangju Cheng
2021, 40(5): 30-35. doi: 10.1007/s13131-021-1726-1
Abstract:
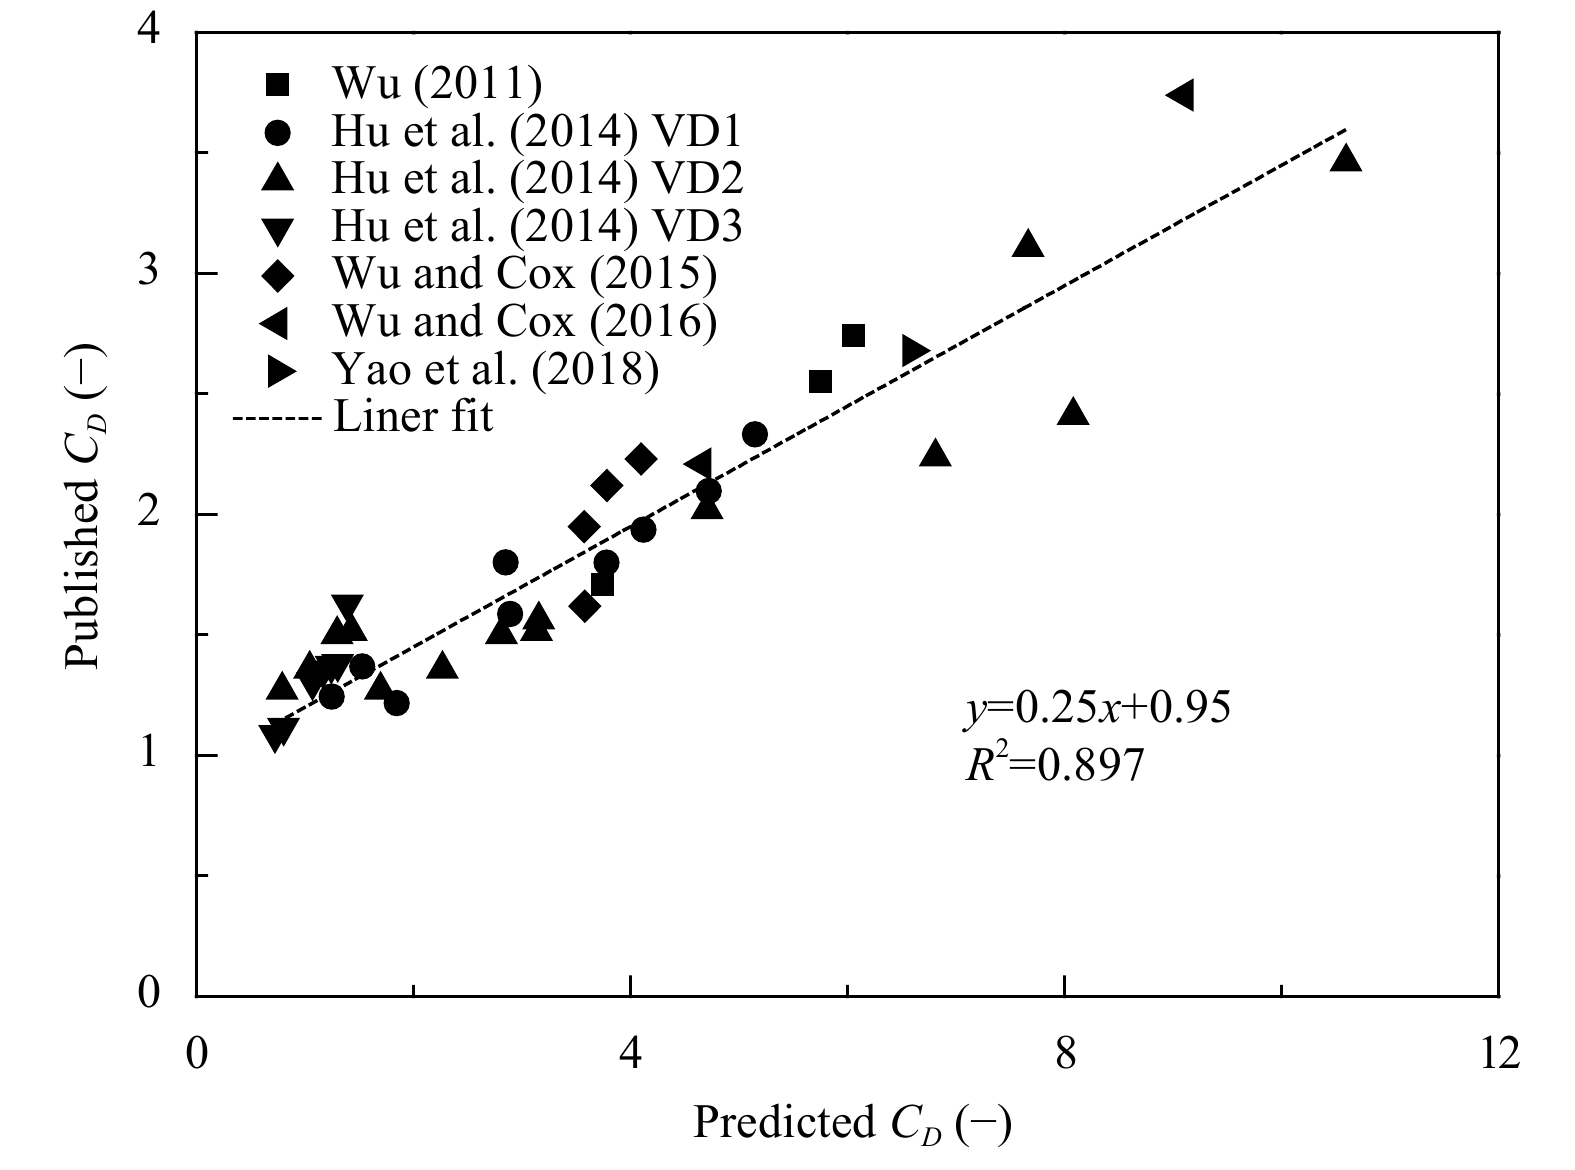
Vegetation in wetlands is a large-scale nature-based resource that can provide multiple benefits to human beings and the environment, such as wave attenuation in coastal zones. Traditionally, there are two main calibration approaches to calculate the attenuation of wave driven by vegetation. The first method is a straightforward one based on the exponential attenuation of wave height in the direction of wave transmission, which, however, overlooks the crucial drag coefficient (CD). The other method is in accordance with more complicate equations for predicting the damping factor, which is regarded as a function of CD. In this study, a new relation, combining these above two conventional approaches, is proposed to predict the CD in an operative approach. Results show that values yielded by the new assessment method perform a strong linear relationship with a collection of historical observations, with a promising R2 value of 0.90. Besides, the linear regression derives a new predictive equation for the bulk drag coefficient. Additionally, a calibrated value of 4 for the empirical plant drag coefficient (CP) is revealed. Overall, this new equation, with the superiority of the convenient exponential regression, is expected to be a rapid assessment method for calculating wave attenuation by vegetation and predicting the drag coefficient.
Homogenization and trend analysis of 1960–2015 in situ sea surface temperature observations along the coast of China
Yan Li, Qingyuan Wang, Guoyu Ren, Guosong Wang, Qingliang Zhou
2021, 40(5): 36-46. doi: 10.1007/s13131-021-1725-2
Abstract:
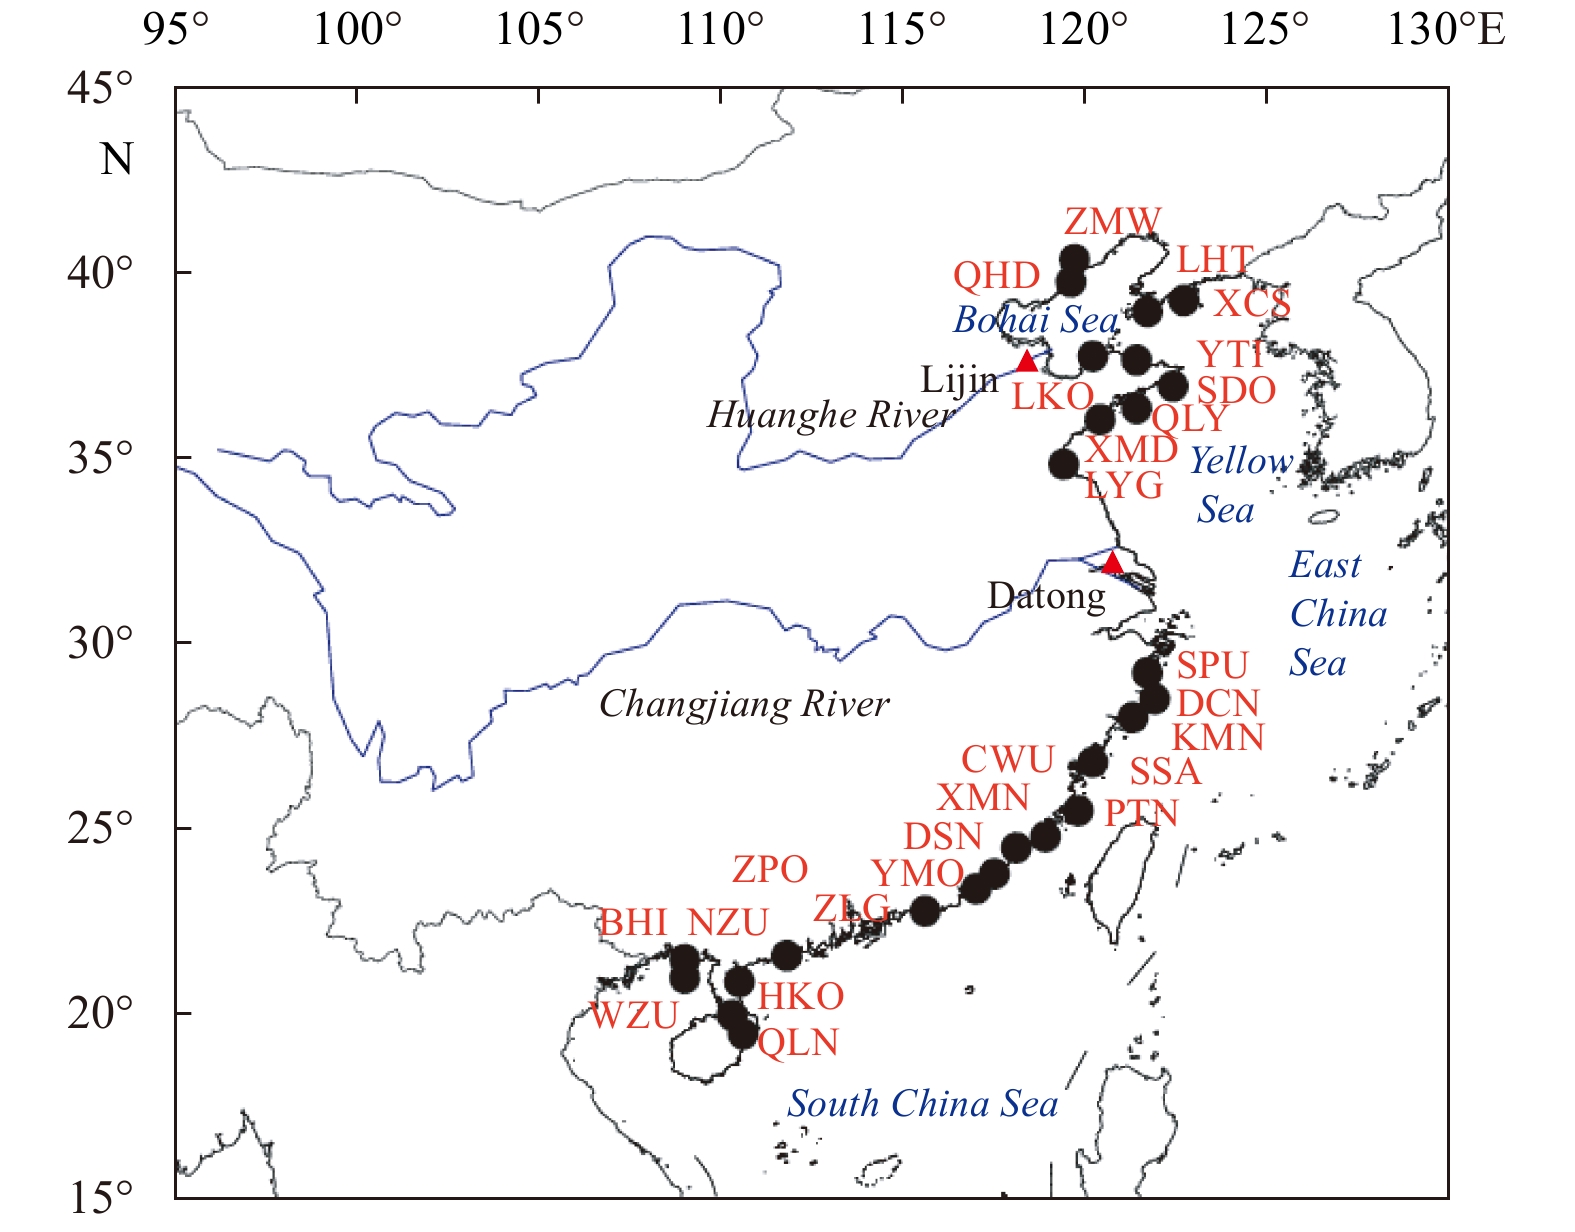
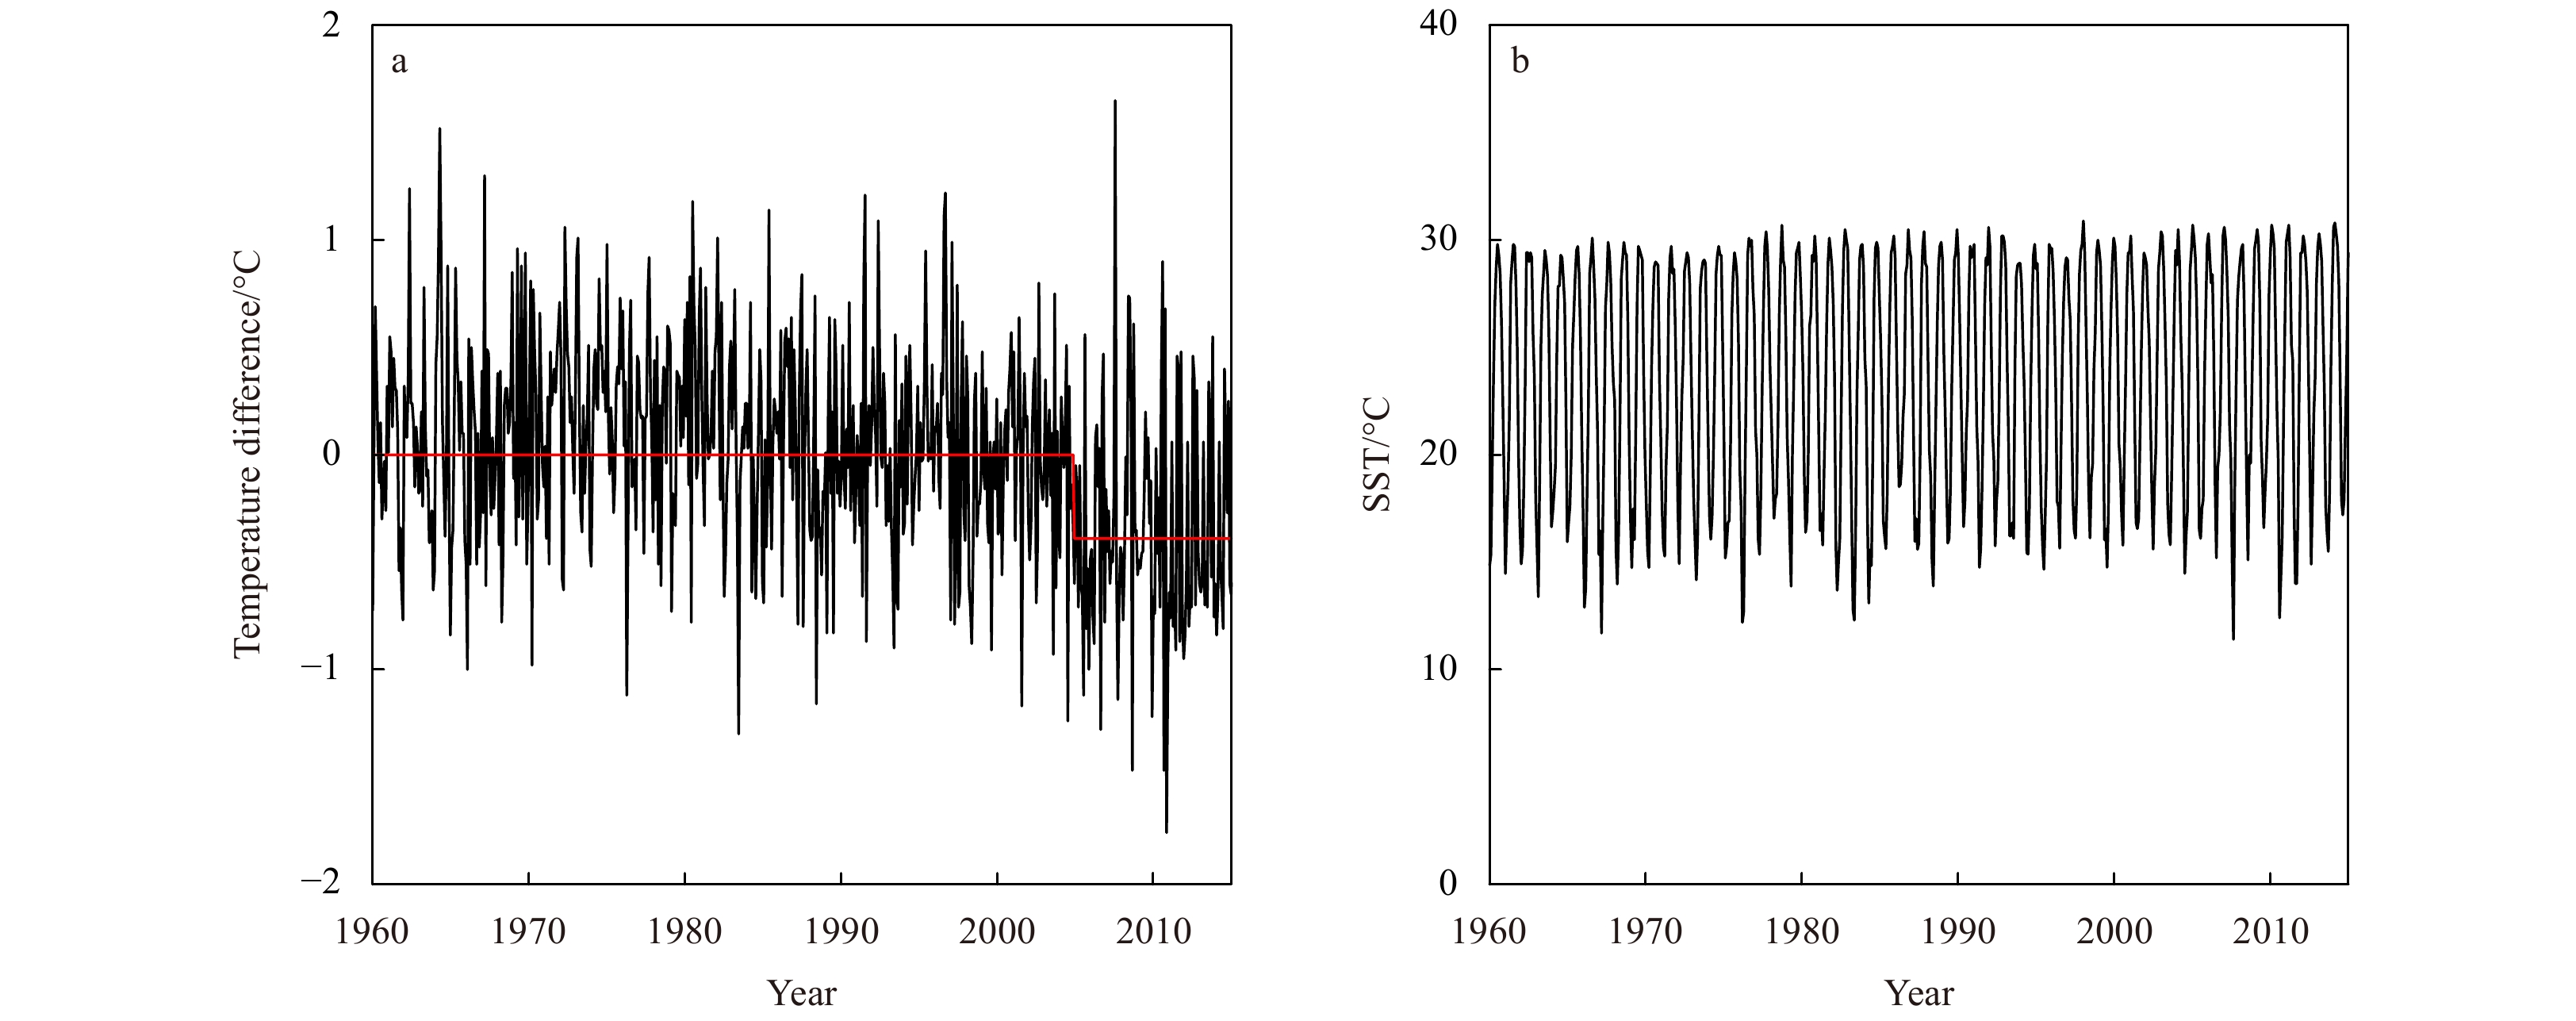
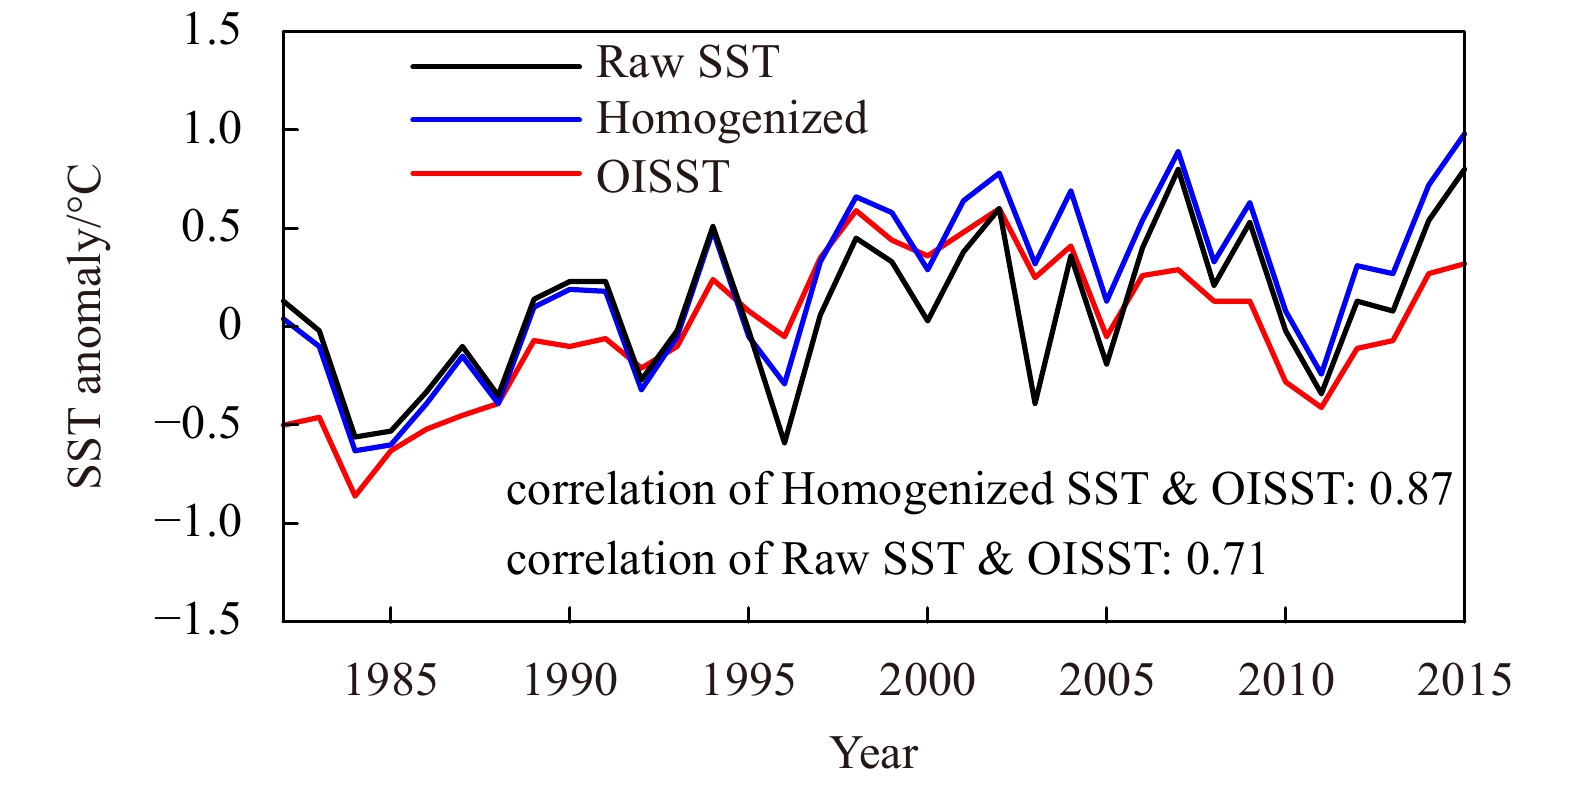
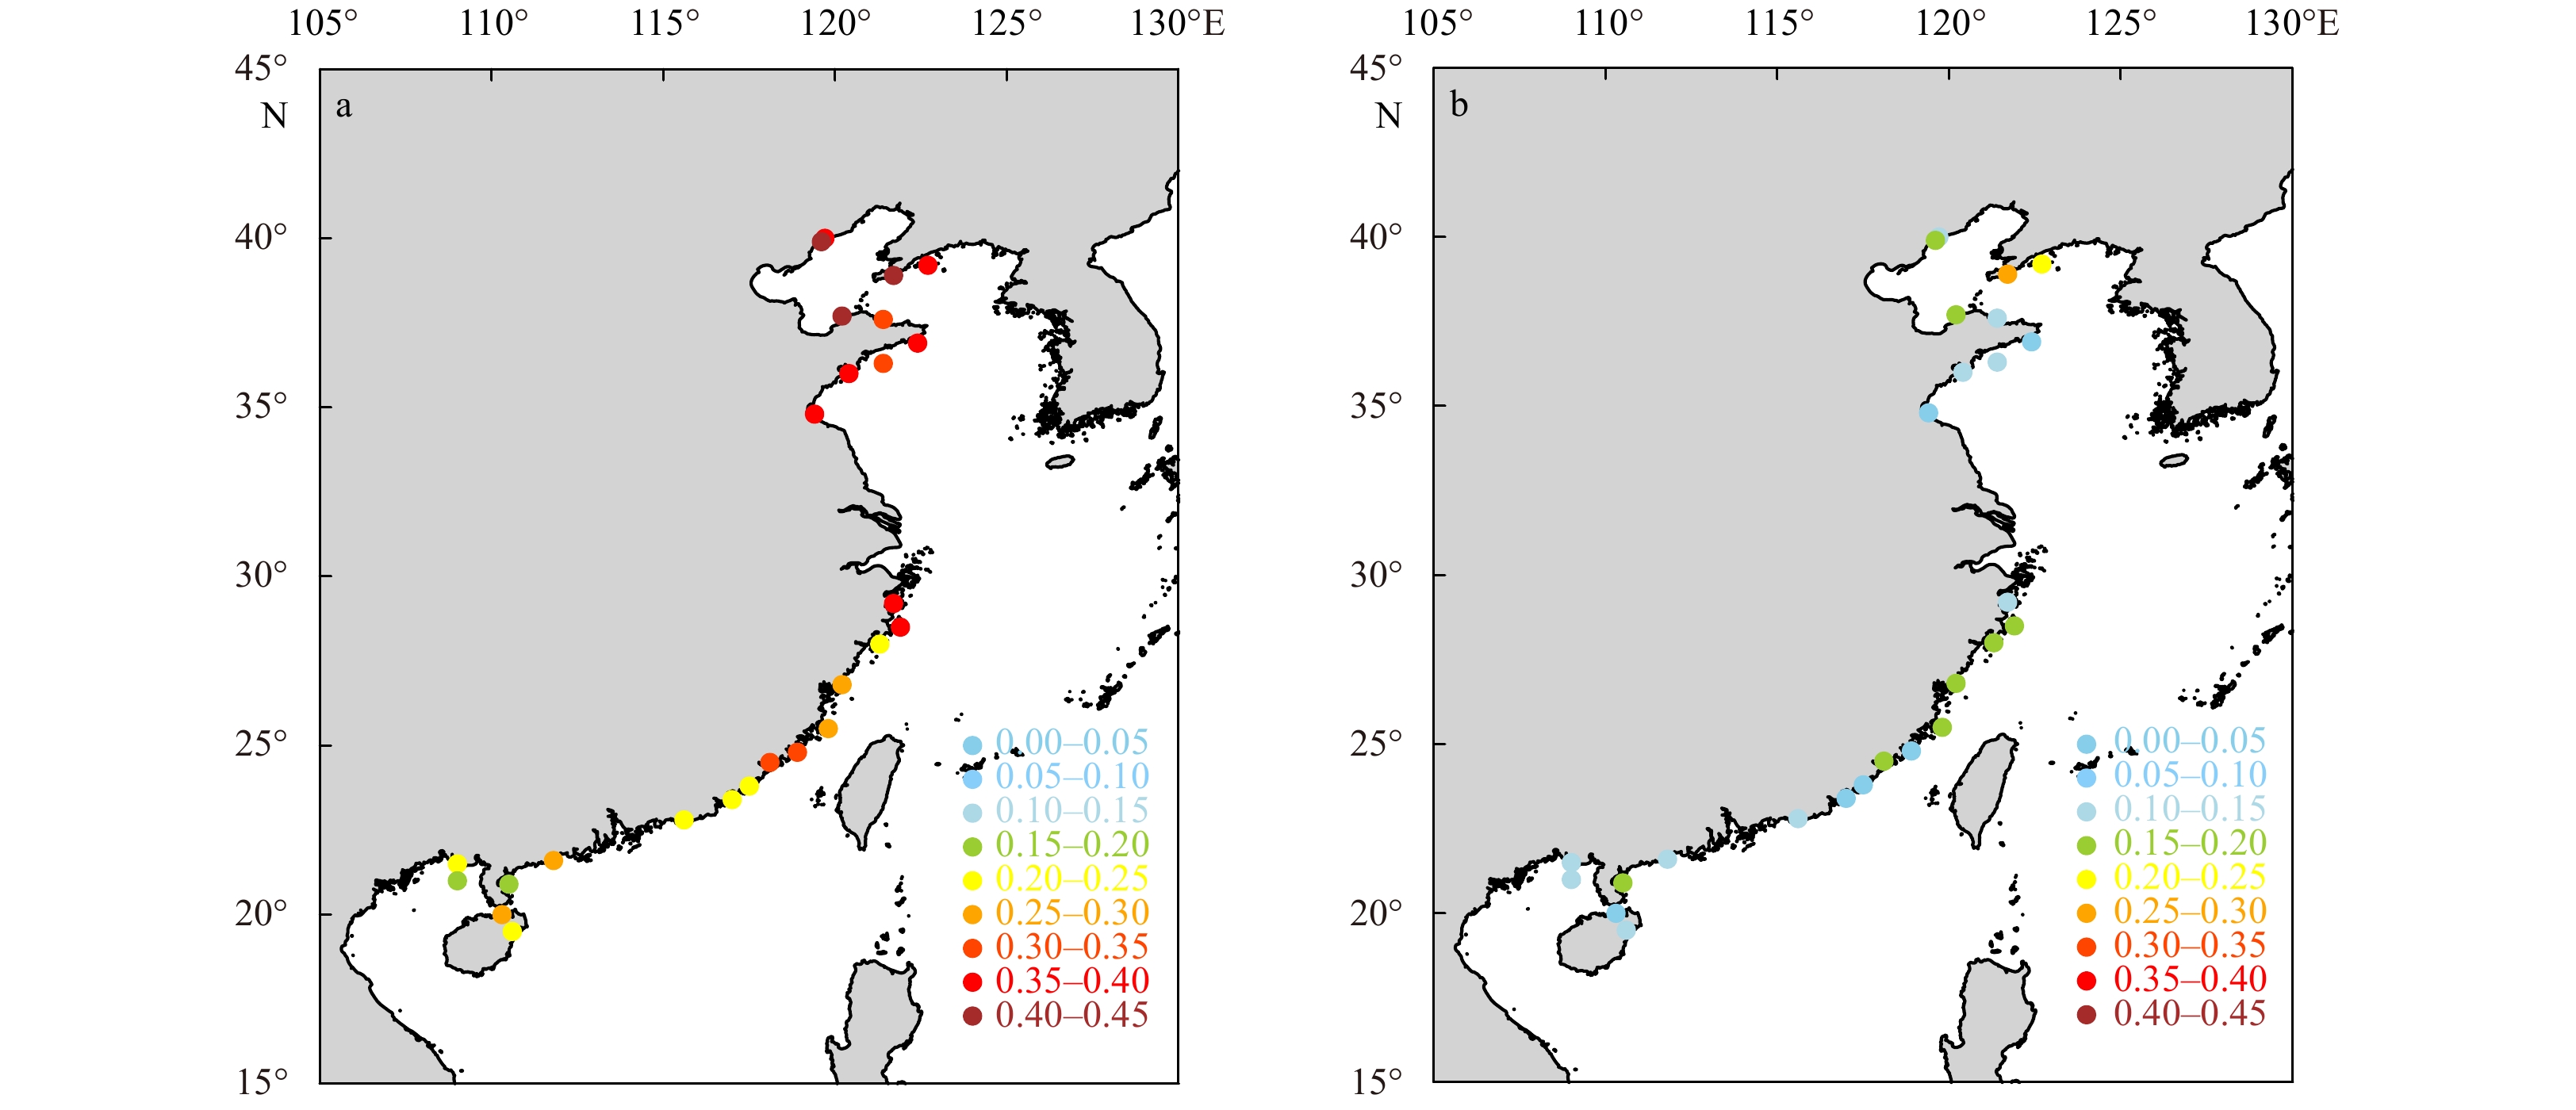
Sea surface temperature (SST) measurements from 26 coastal hydrological stations of China during 1960–2015 were homogenized and analyzed in this study. The homogenous surface air temperature (SAT) series from meteorological stations which were highly correlated to SST series was used to construct the reference series. Monthly mean SST series were then derived and subjected to a statistical homogeneity test, called penalized maximal t test. Homogenized monthly mean SST series were obtained by adjusting all significant change points which were supported by historic metadata information. Results show that the majority of break points are caused by instrument change and station relocation, which accounts for about 61.3% and 24.2% of the total break points, respectively. The regionally averaged annual homogeneous SST series from the 26 stations shows a warming trend (0.19°C per decade). This result is consistent with that based on the homogenized annual mean SAT at the same region (0.22°C per decade), while the regionally averaged mean original SST series from the same stations shows a much weaker warming of 0.09°C per decade for 1960–2015. This finding suggests that the effects of artificial change points on the result of trend analysis are remarkable, and the warming rate from original SST observations since 1960 may be underestimated. Thus a high quality homogenized observation is crucial for robust detection and assessment of regional climate change. Furthermore, the trends of the seasonal mean homogenized SST were also analyzed. This work confirmed that there was an asymmetric seasonal temperature trends in the Chinese coastal water in the past decades, with the largest warming rate occurring in winter. At last, the significant warming in winter and its relationships to the variability of three large-scale atmospheric modes were investigated.
Revisiting ENSO impacts on the Indian Ocean SST based on a combined linear regression method
Lianyi Zhang, Yan Du, Tomoki Tozuka, Shoichiro Kido
2021, 40(5): 47-57. doi: 10.1007/s13131-021-1733-2
Abstract:
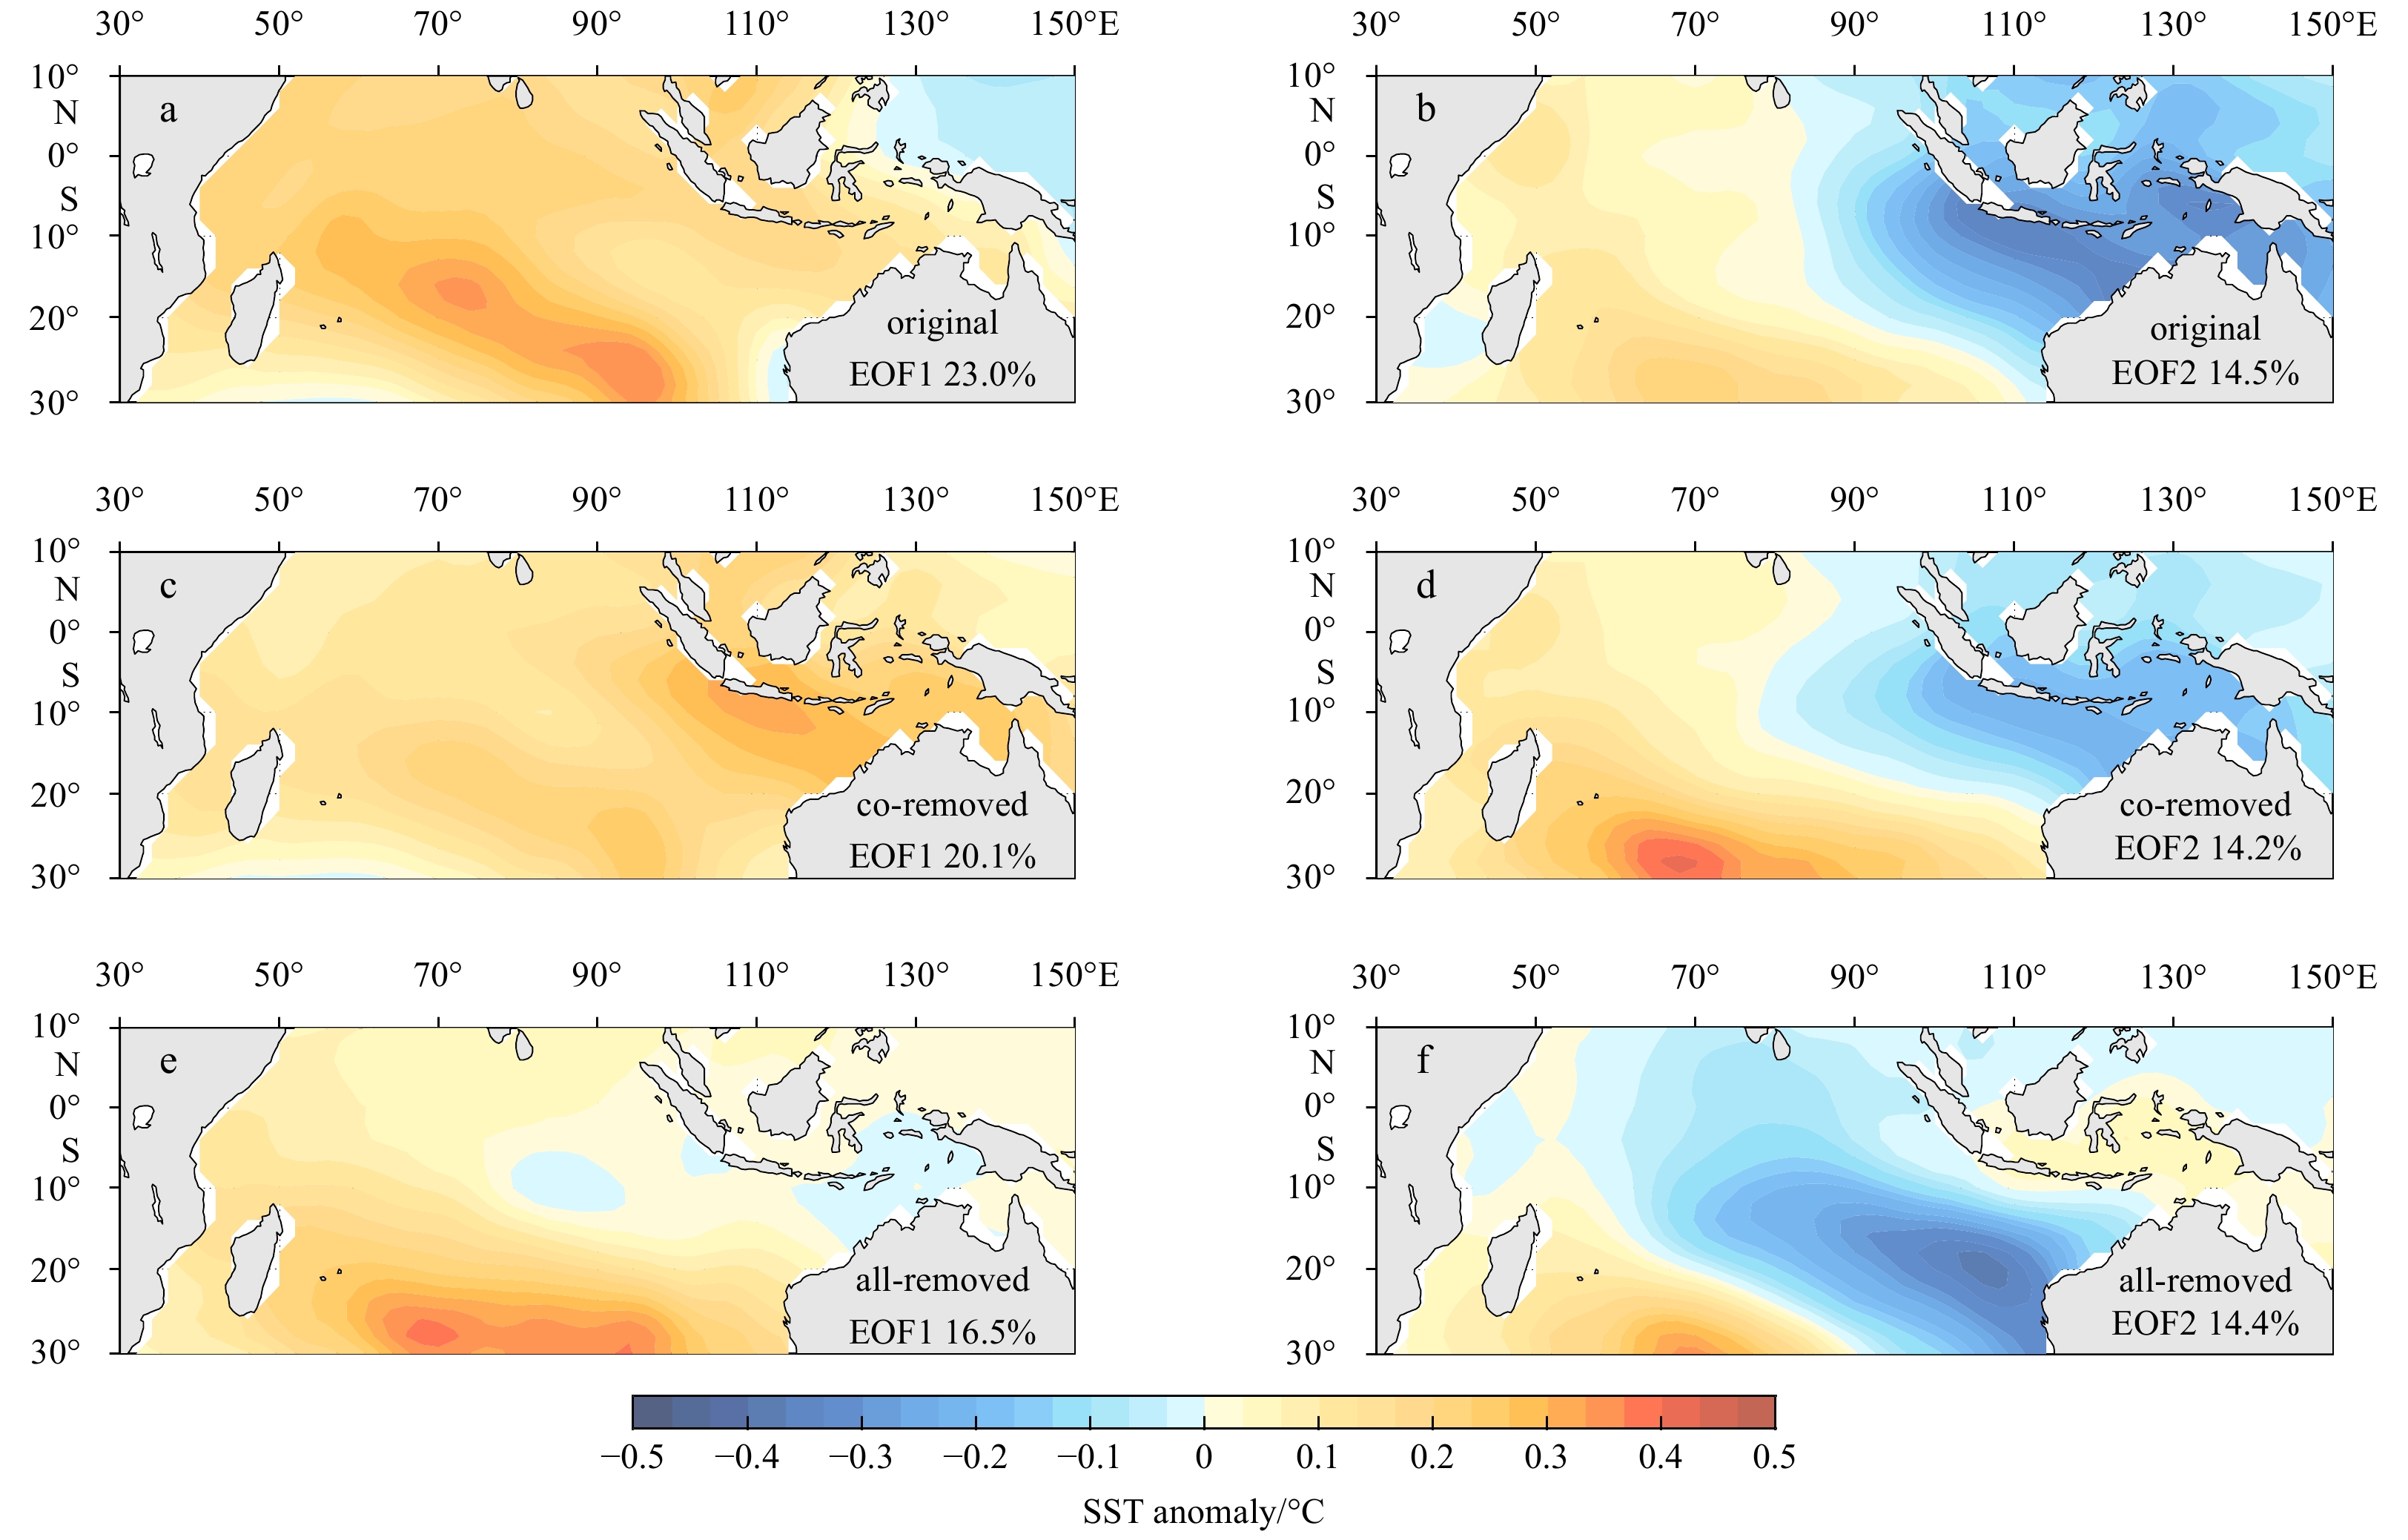
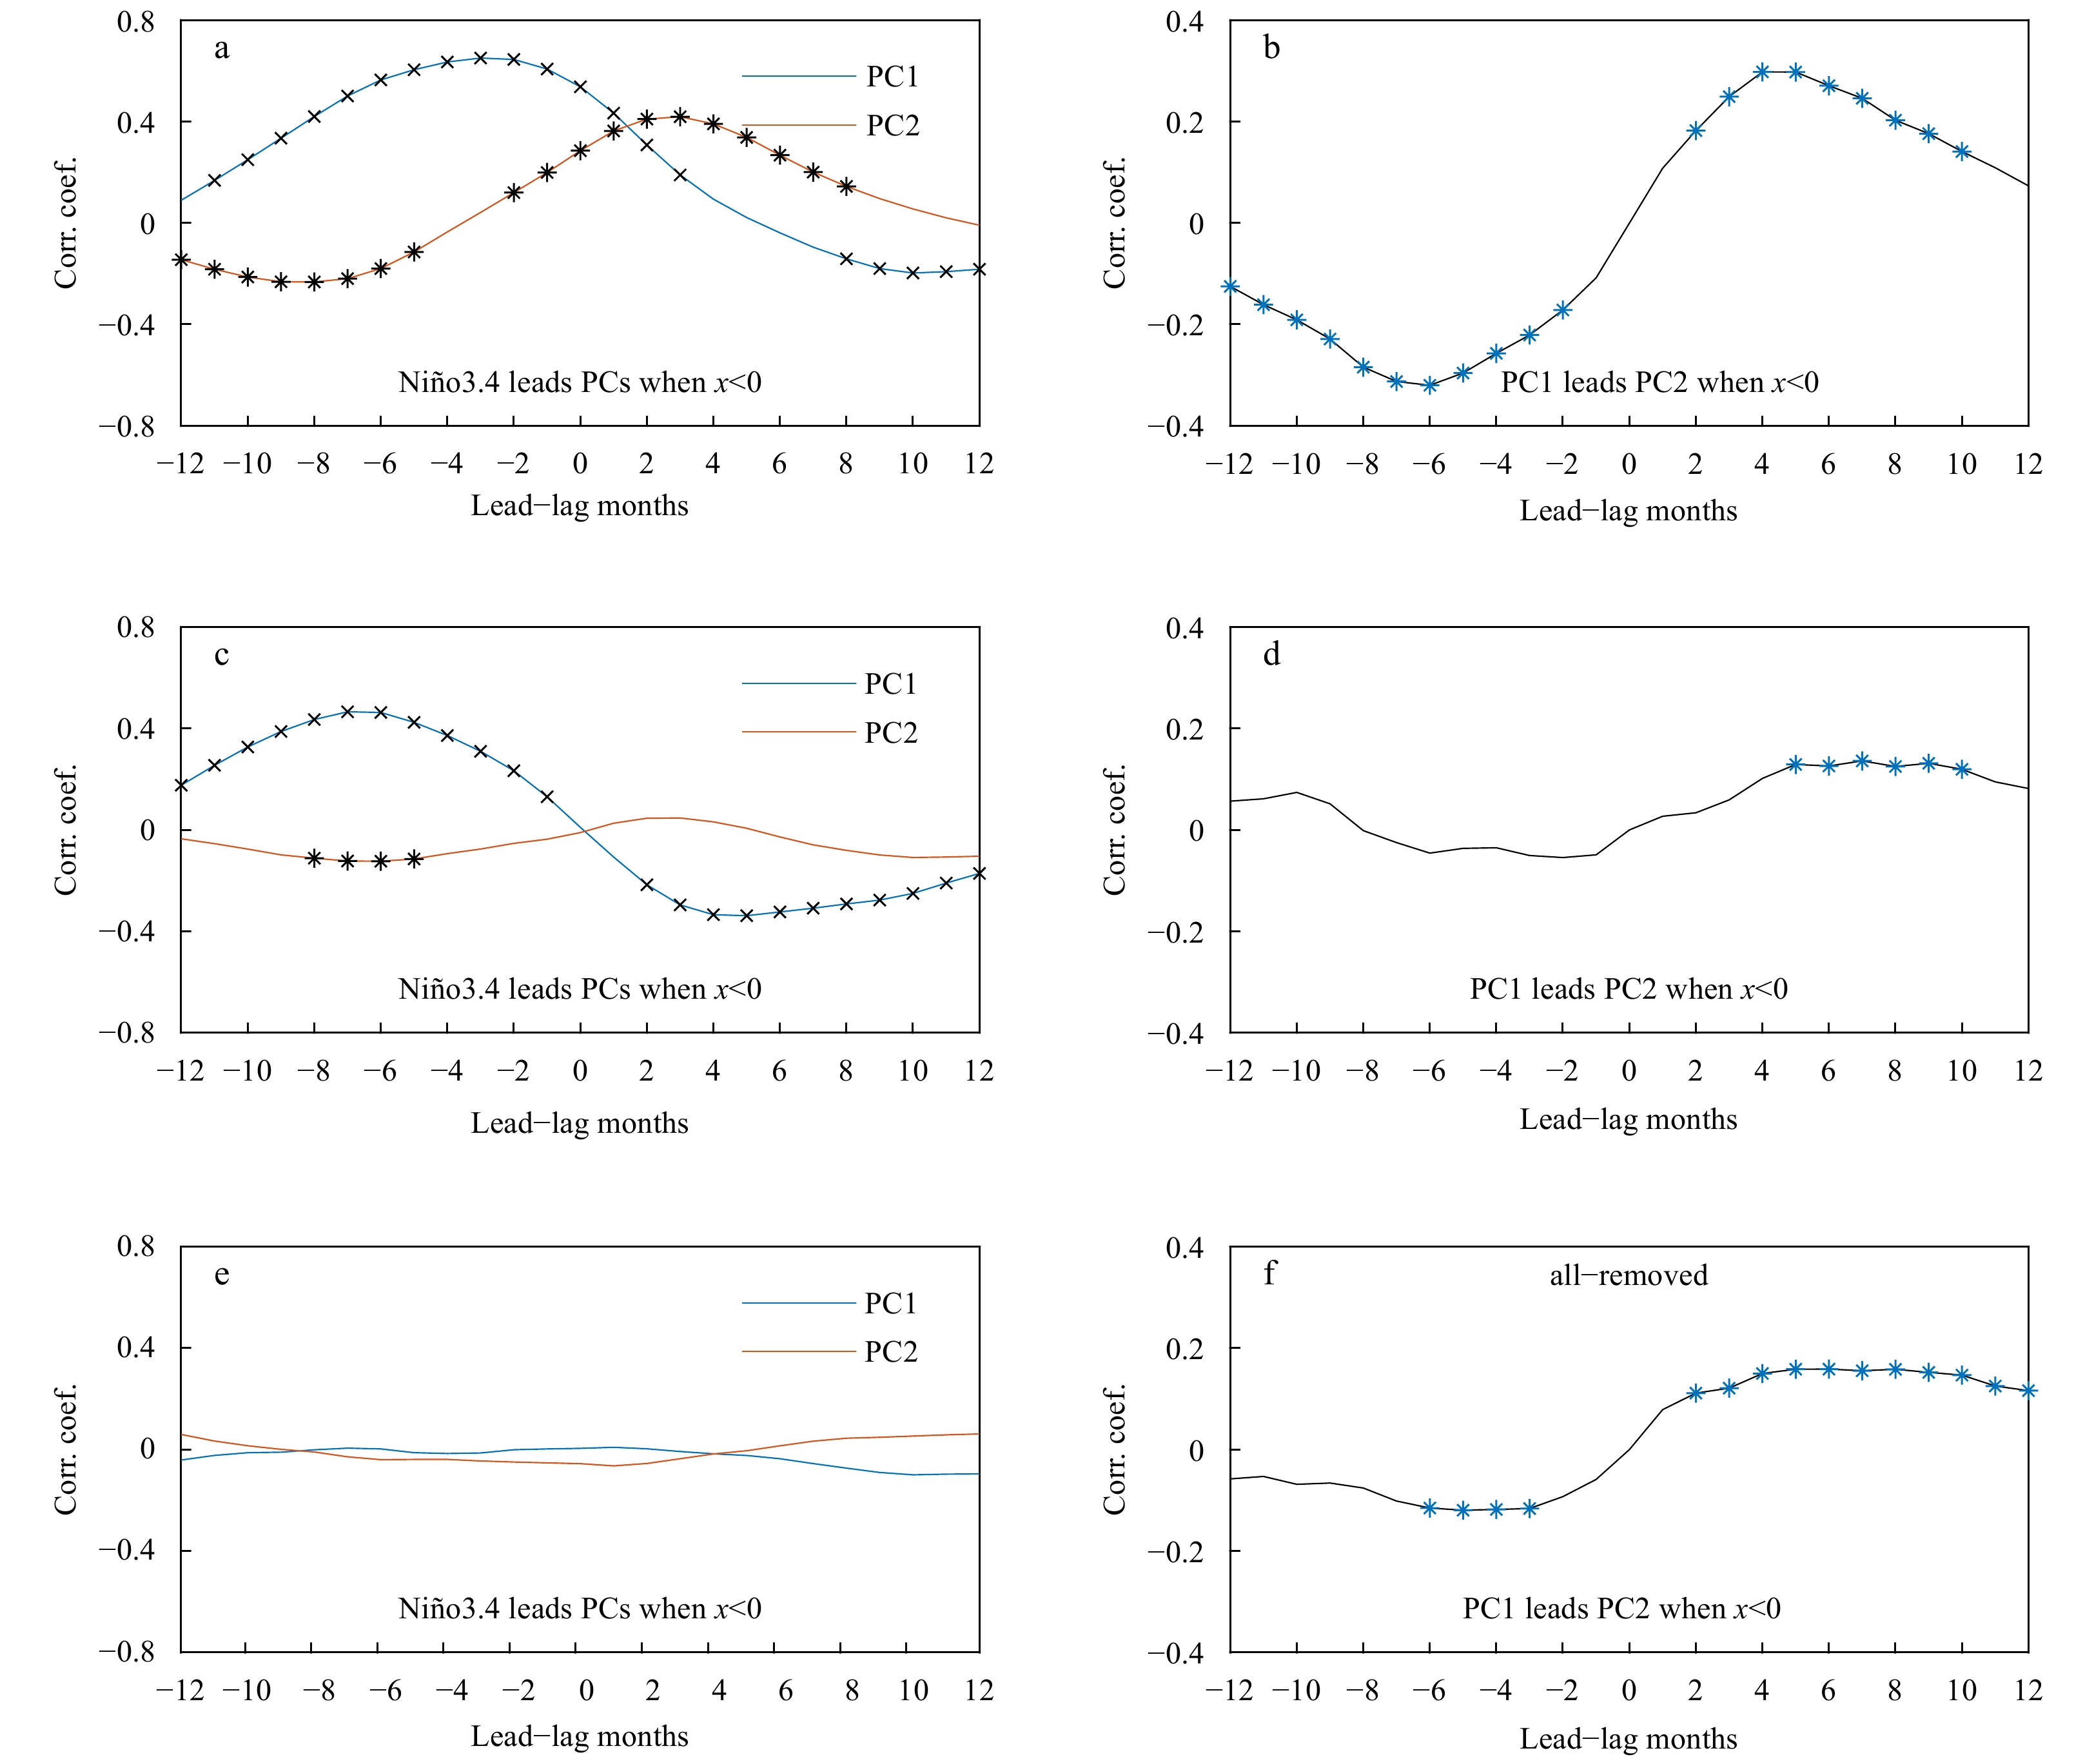
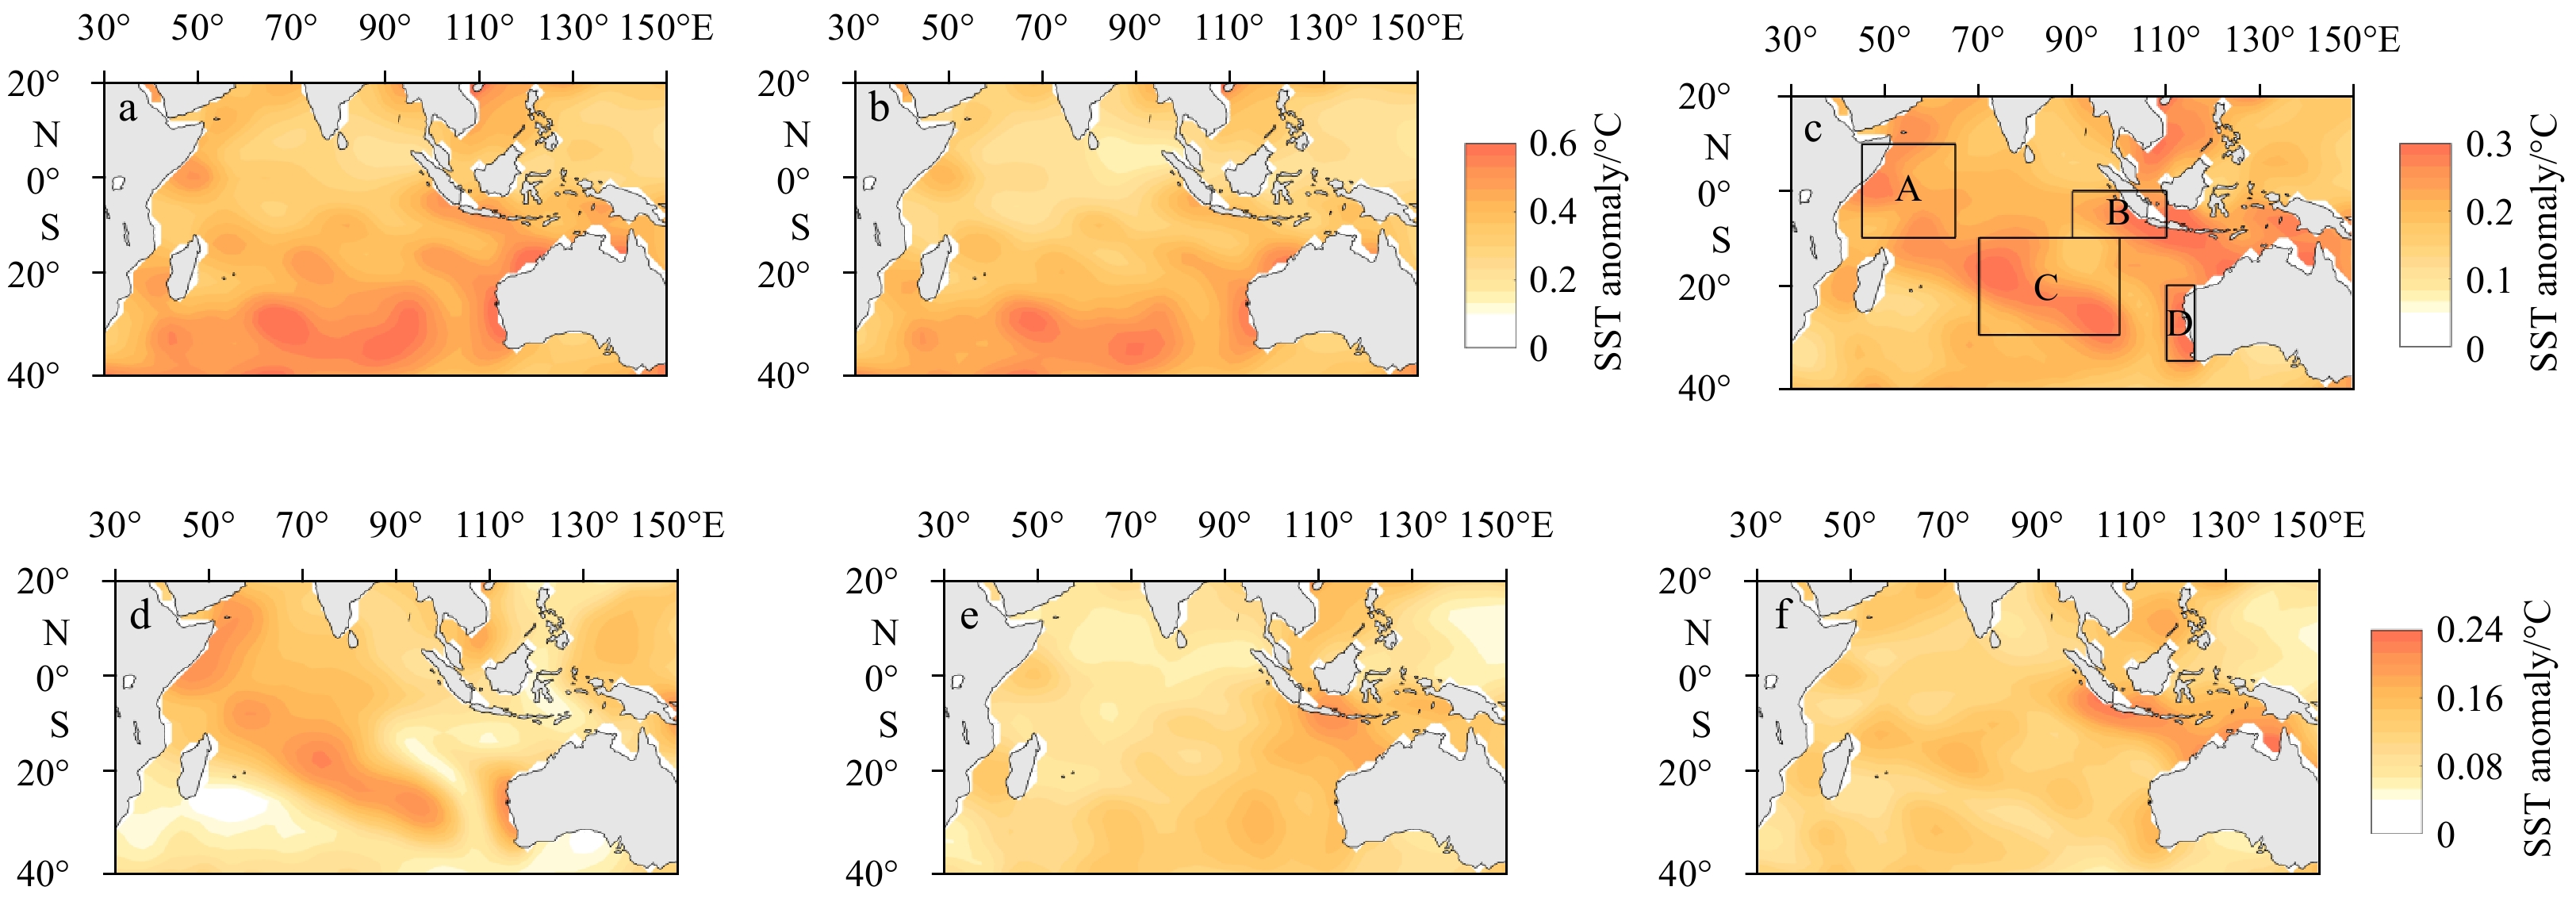
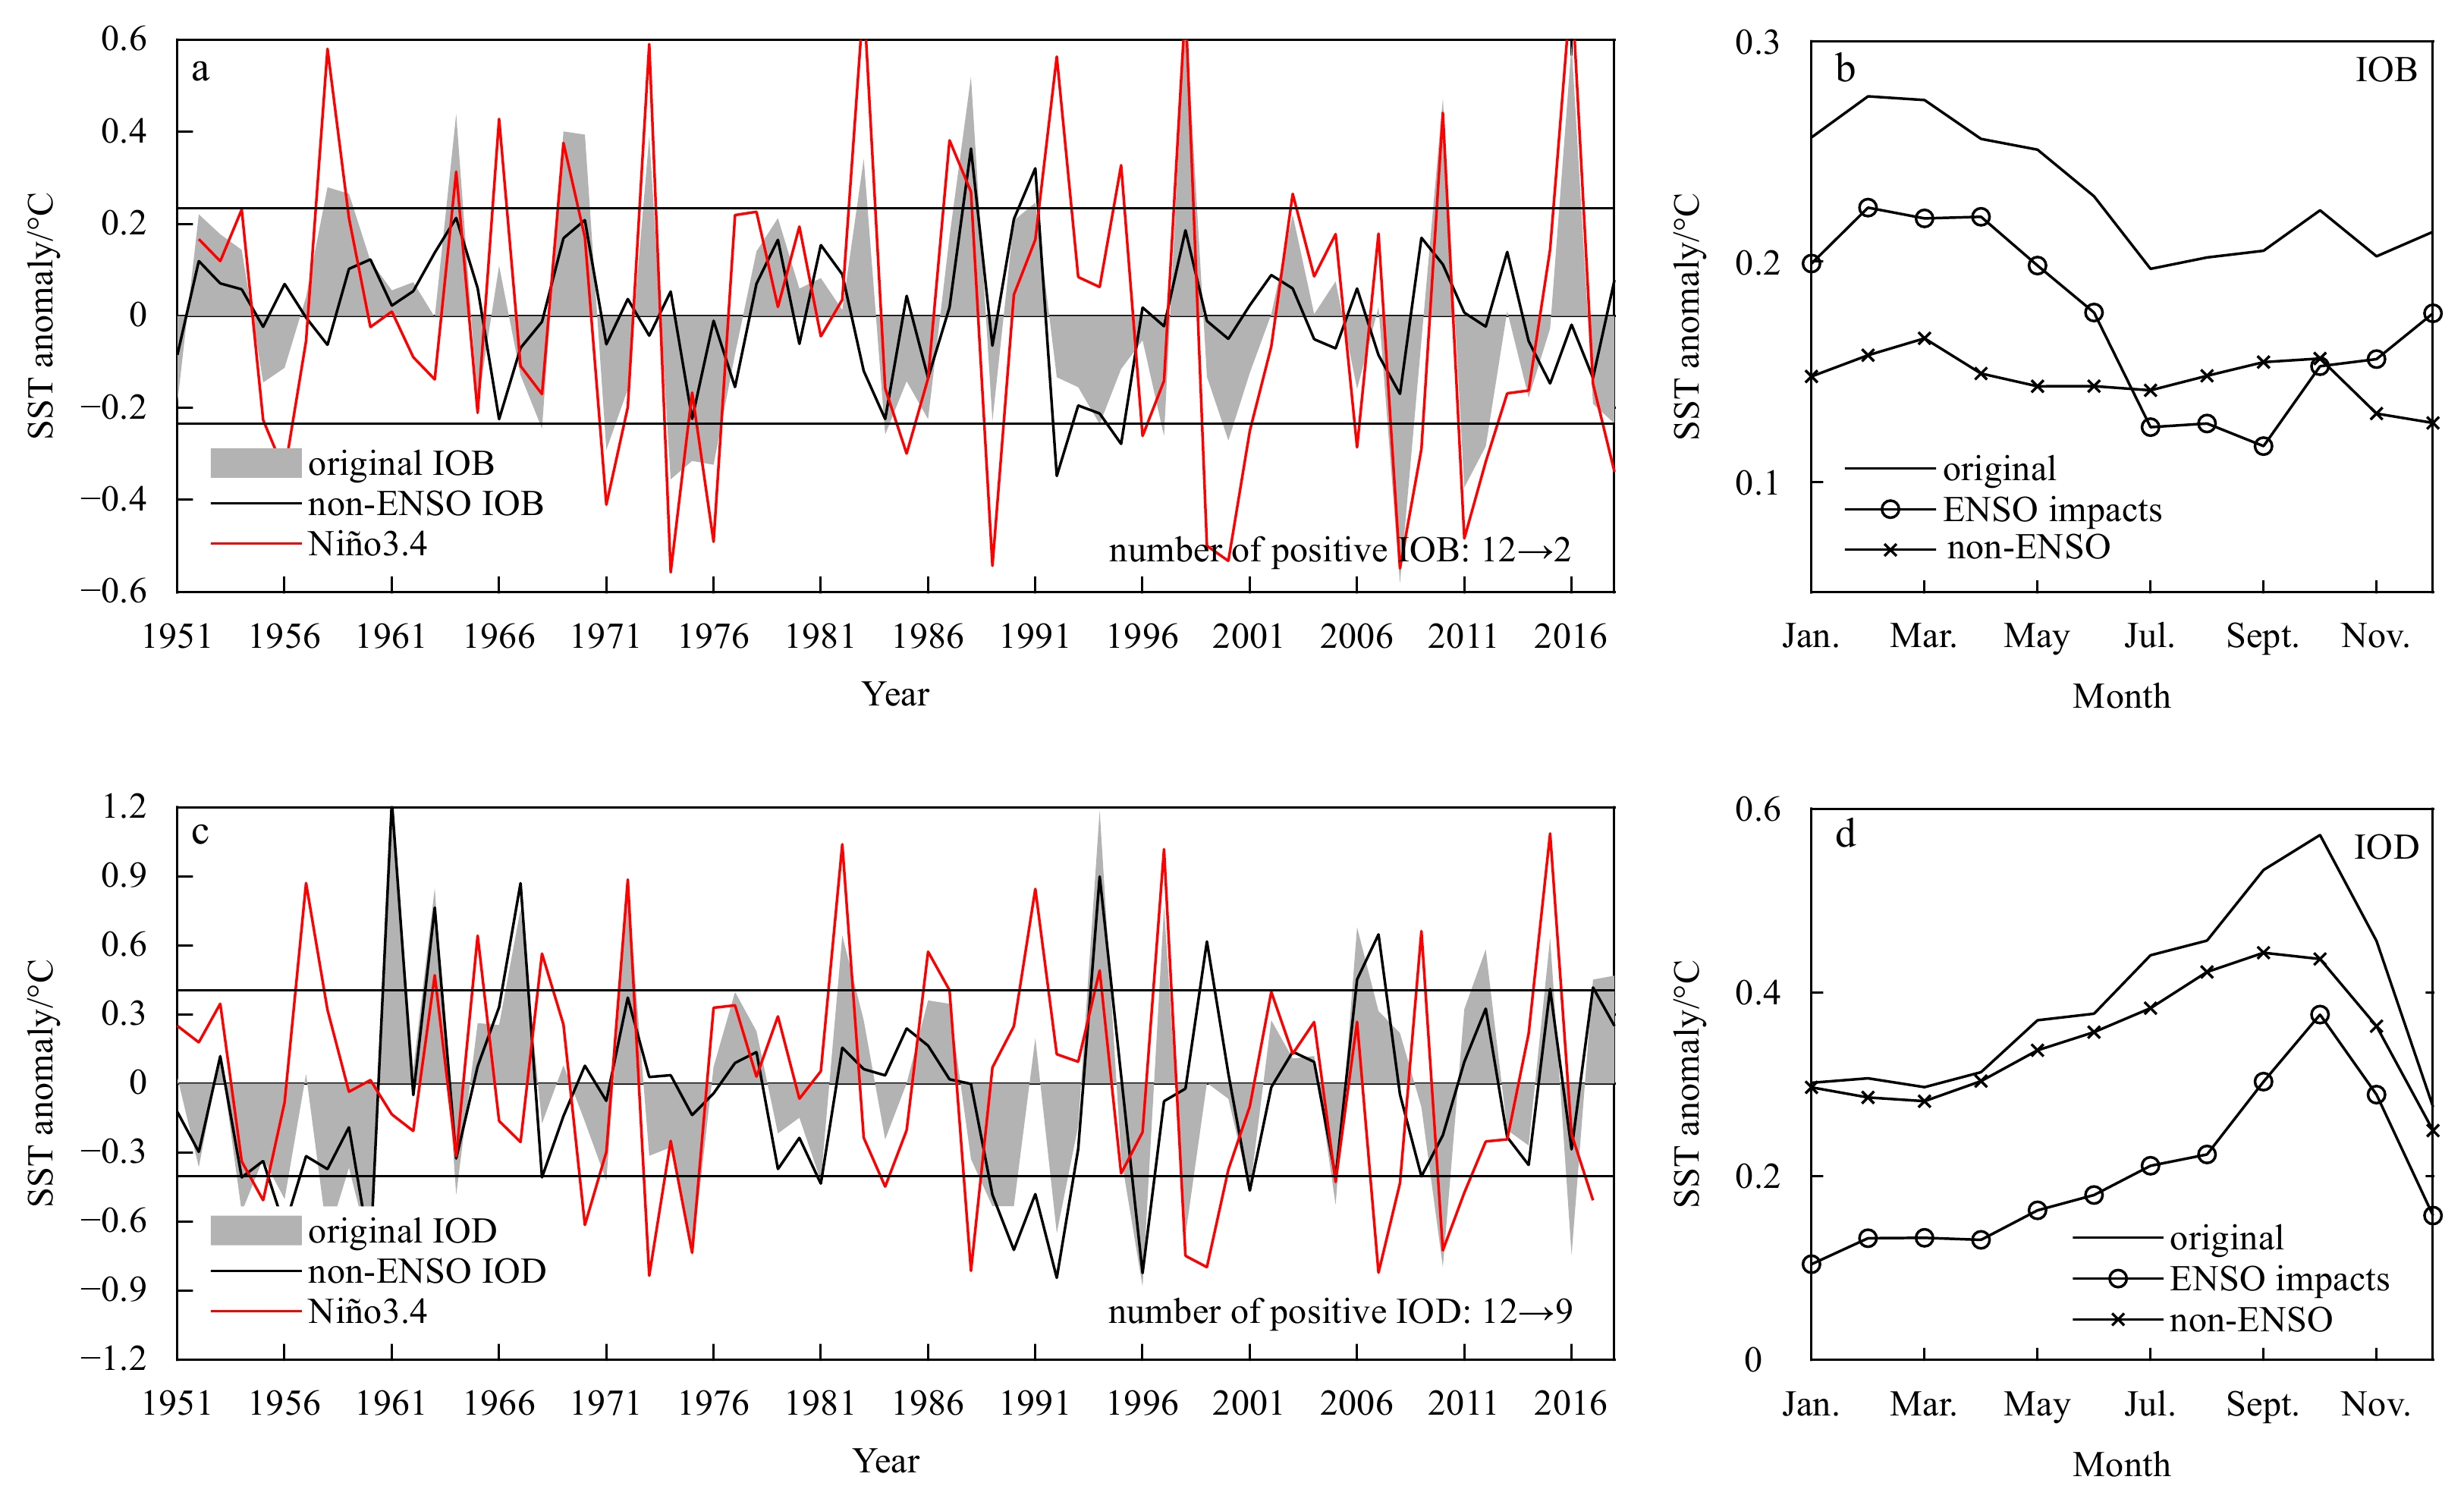
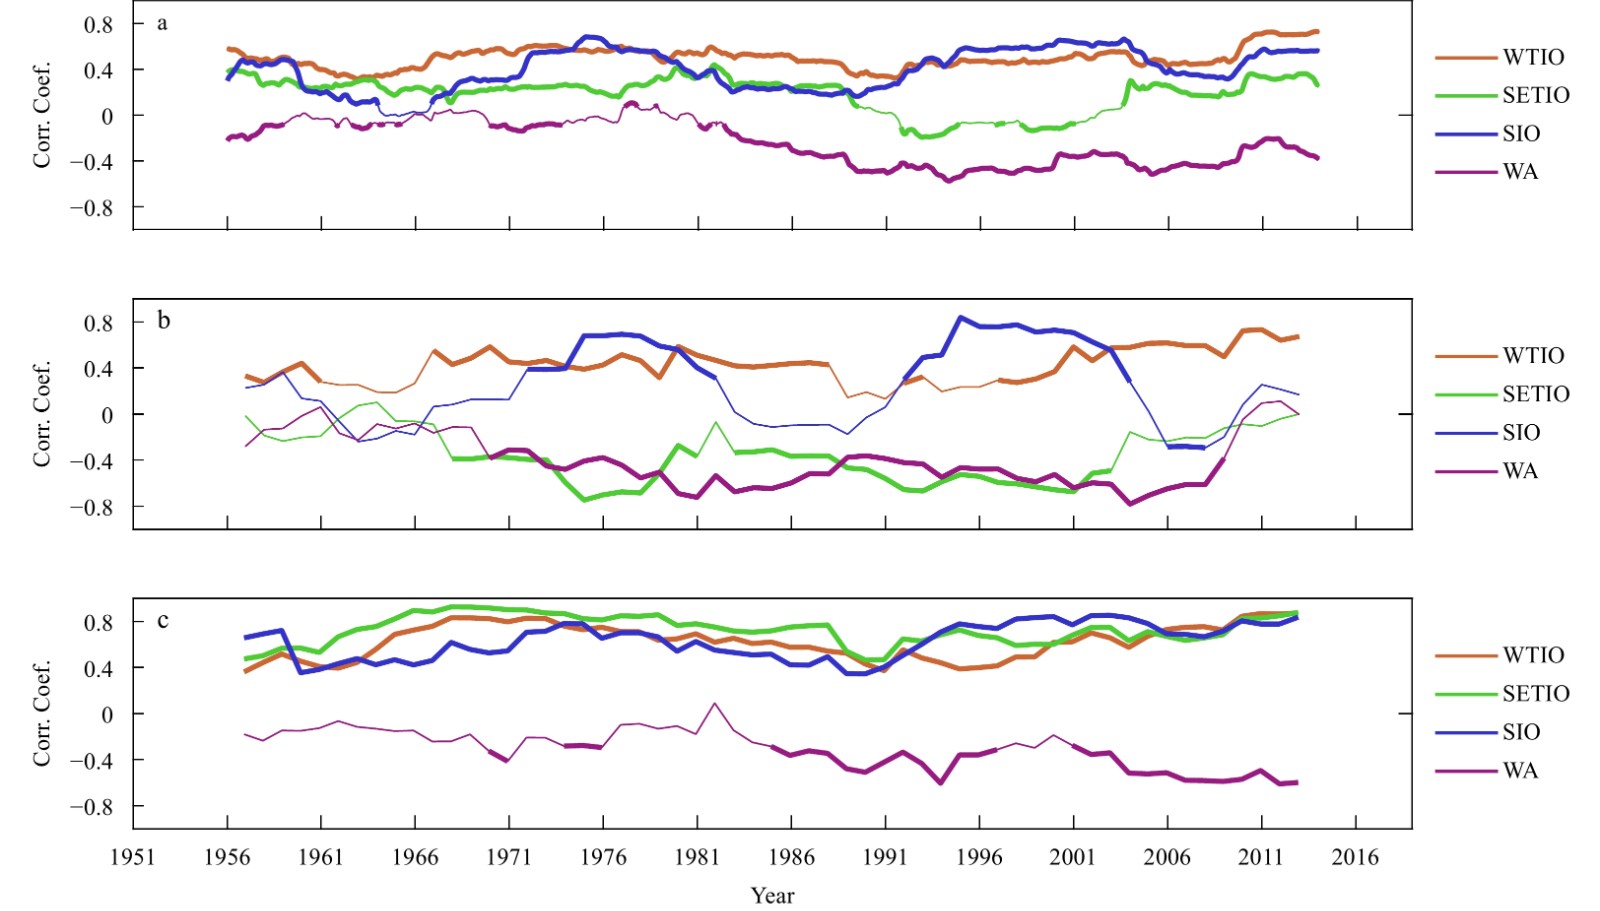
The El Niño-Southern Oscillation (ENSO) has great impacts on the Indian Ocean sea surface temperature (SST). In fact, two major modes of the Indian Ocean SST namely the Indian Ocean Basin (IOB) and the Indian Ocean Dipole (IOD) modes, exerting strong influences on the Indian Ocean rim countries, are both influenced by the ENSO. Based on a combined linear regression method, this study quantifies the ENSO impacts on the IOB and the IOD during ENSO concurrent, developing, and decaying stages. After removing the ENSO impacts, the spring peak of the IOB disappears along with significant decrease in number of events, while the number of events is only slightly reduced and the autumn peak remains for the IOD. By isolating the ENSO impacts during each stage, this study reveals that the leading impacts of ENSO contribute to the IOD development, while the delayed impacts facilitate the IOD phase switch and prompt the IOB development. Besides, the decadal variations of ENSO impacts are various during each stage and over different regions. These imply that merely removing the concurrent ENSO impacts would not be sufficient to investigate intrinsic climate variability of the Indian Ocean, and the present method may be useful to study climate variabilities independent of ENSO.
The impact of ocean data assimilation on seasonal predictions based on the National Climate Center climate system model
Wei Zhou, Jinghui Li, Fanghua Xu, Yeqiang Shu, Yang Feng
2021, 40(5): 58-70. doi: 10.1007/s13131-021-1732-3
Abstract:
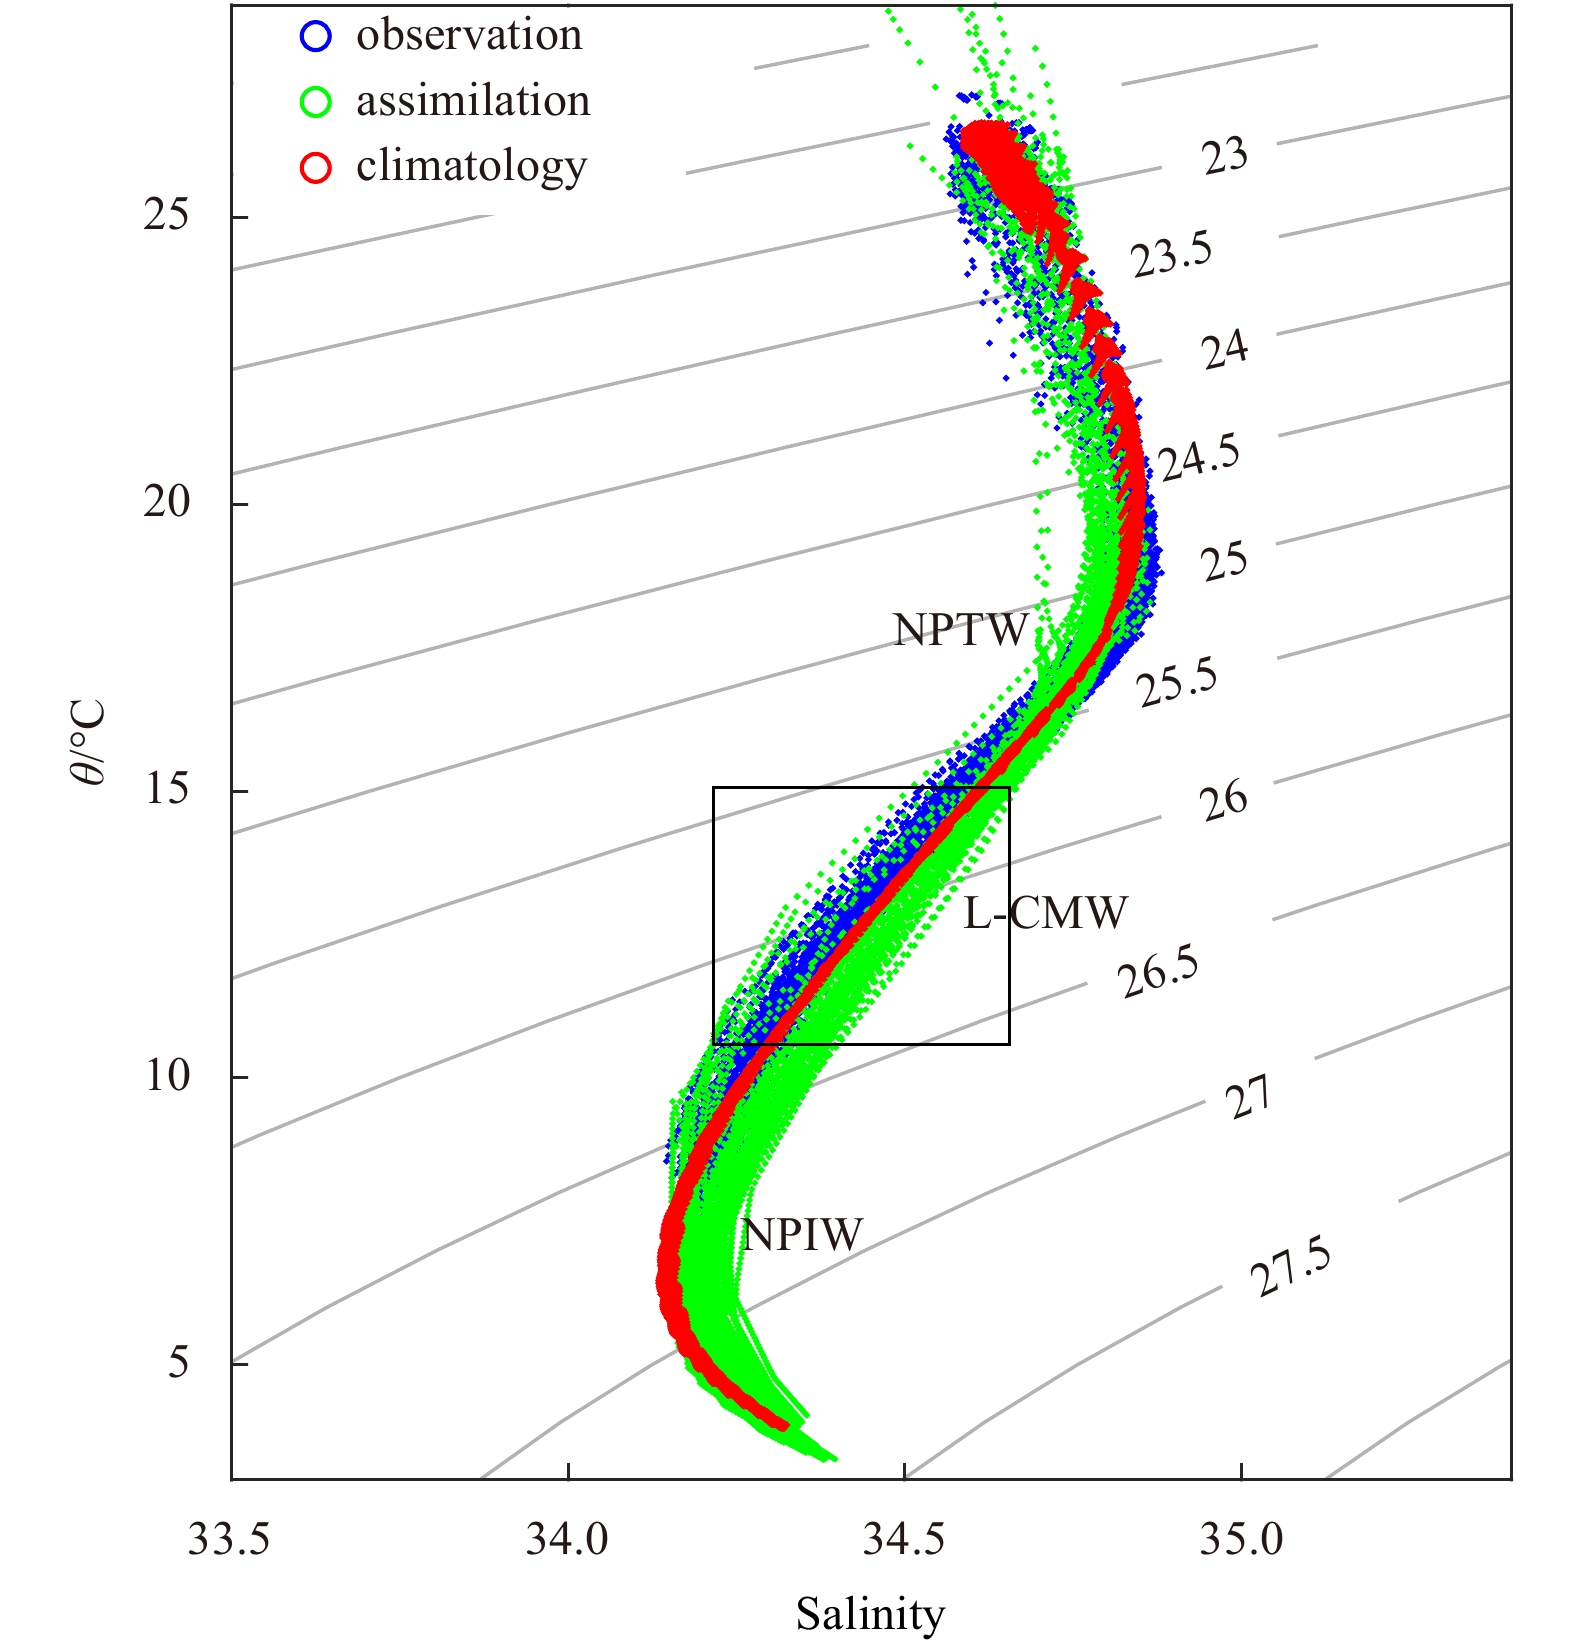
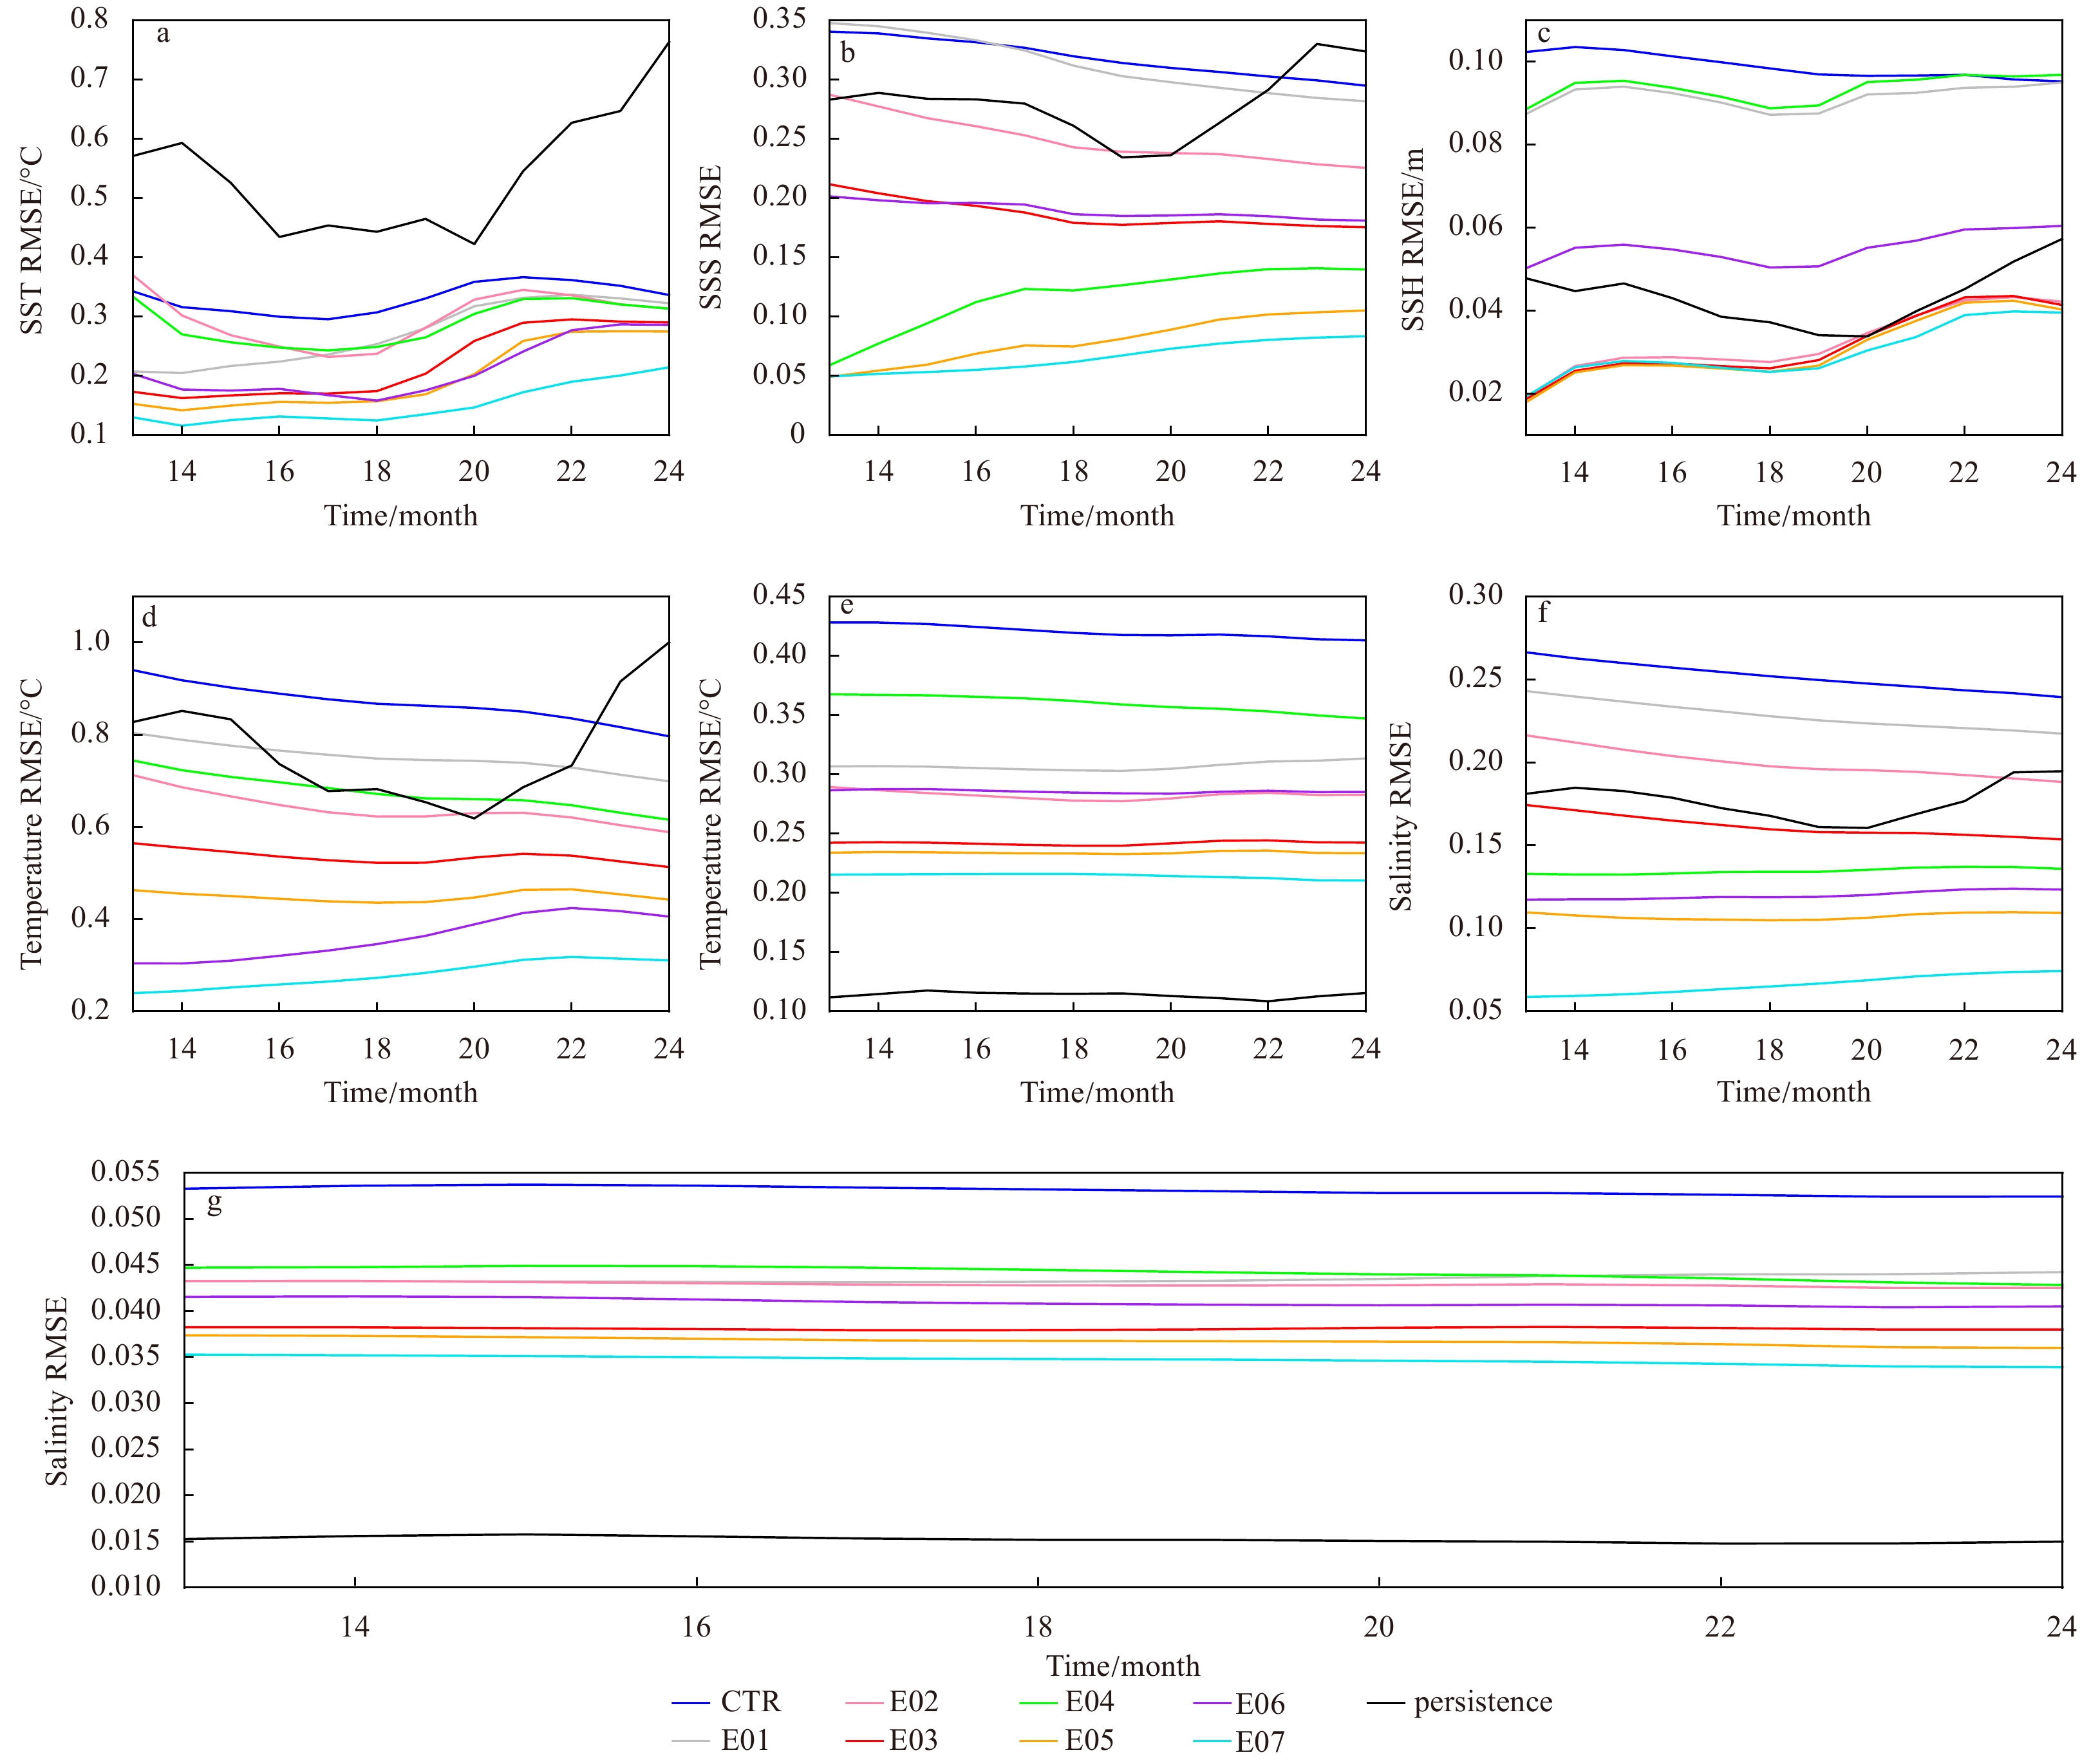
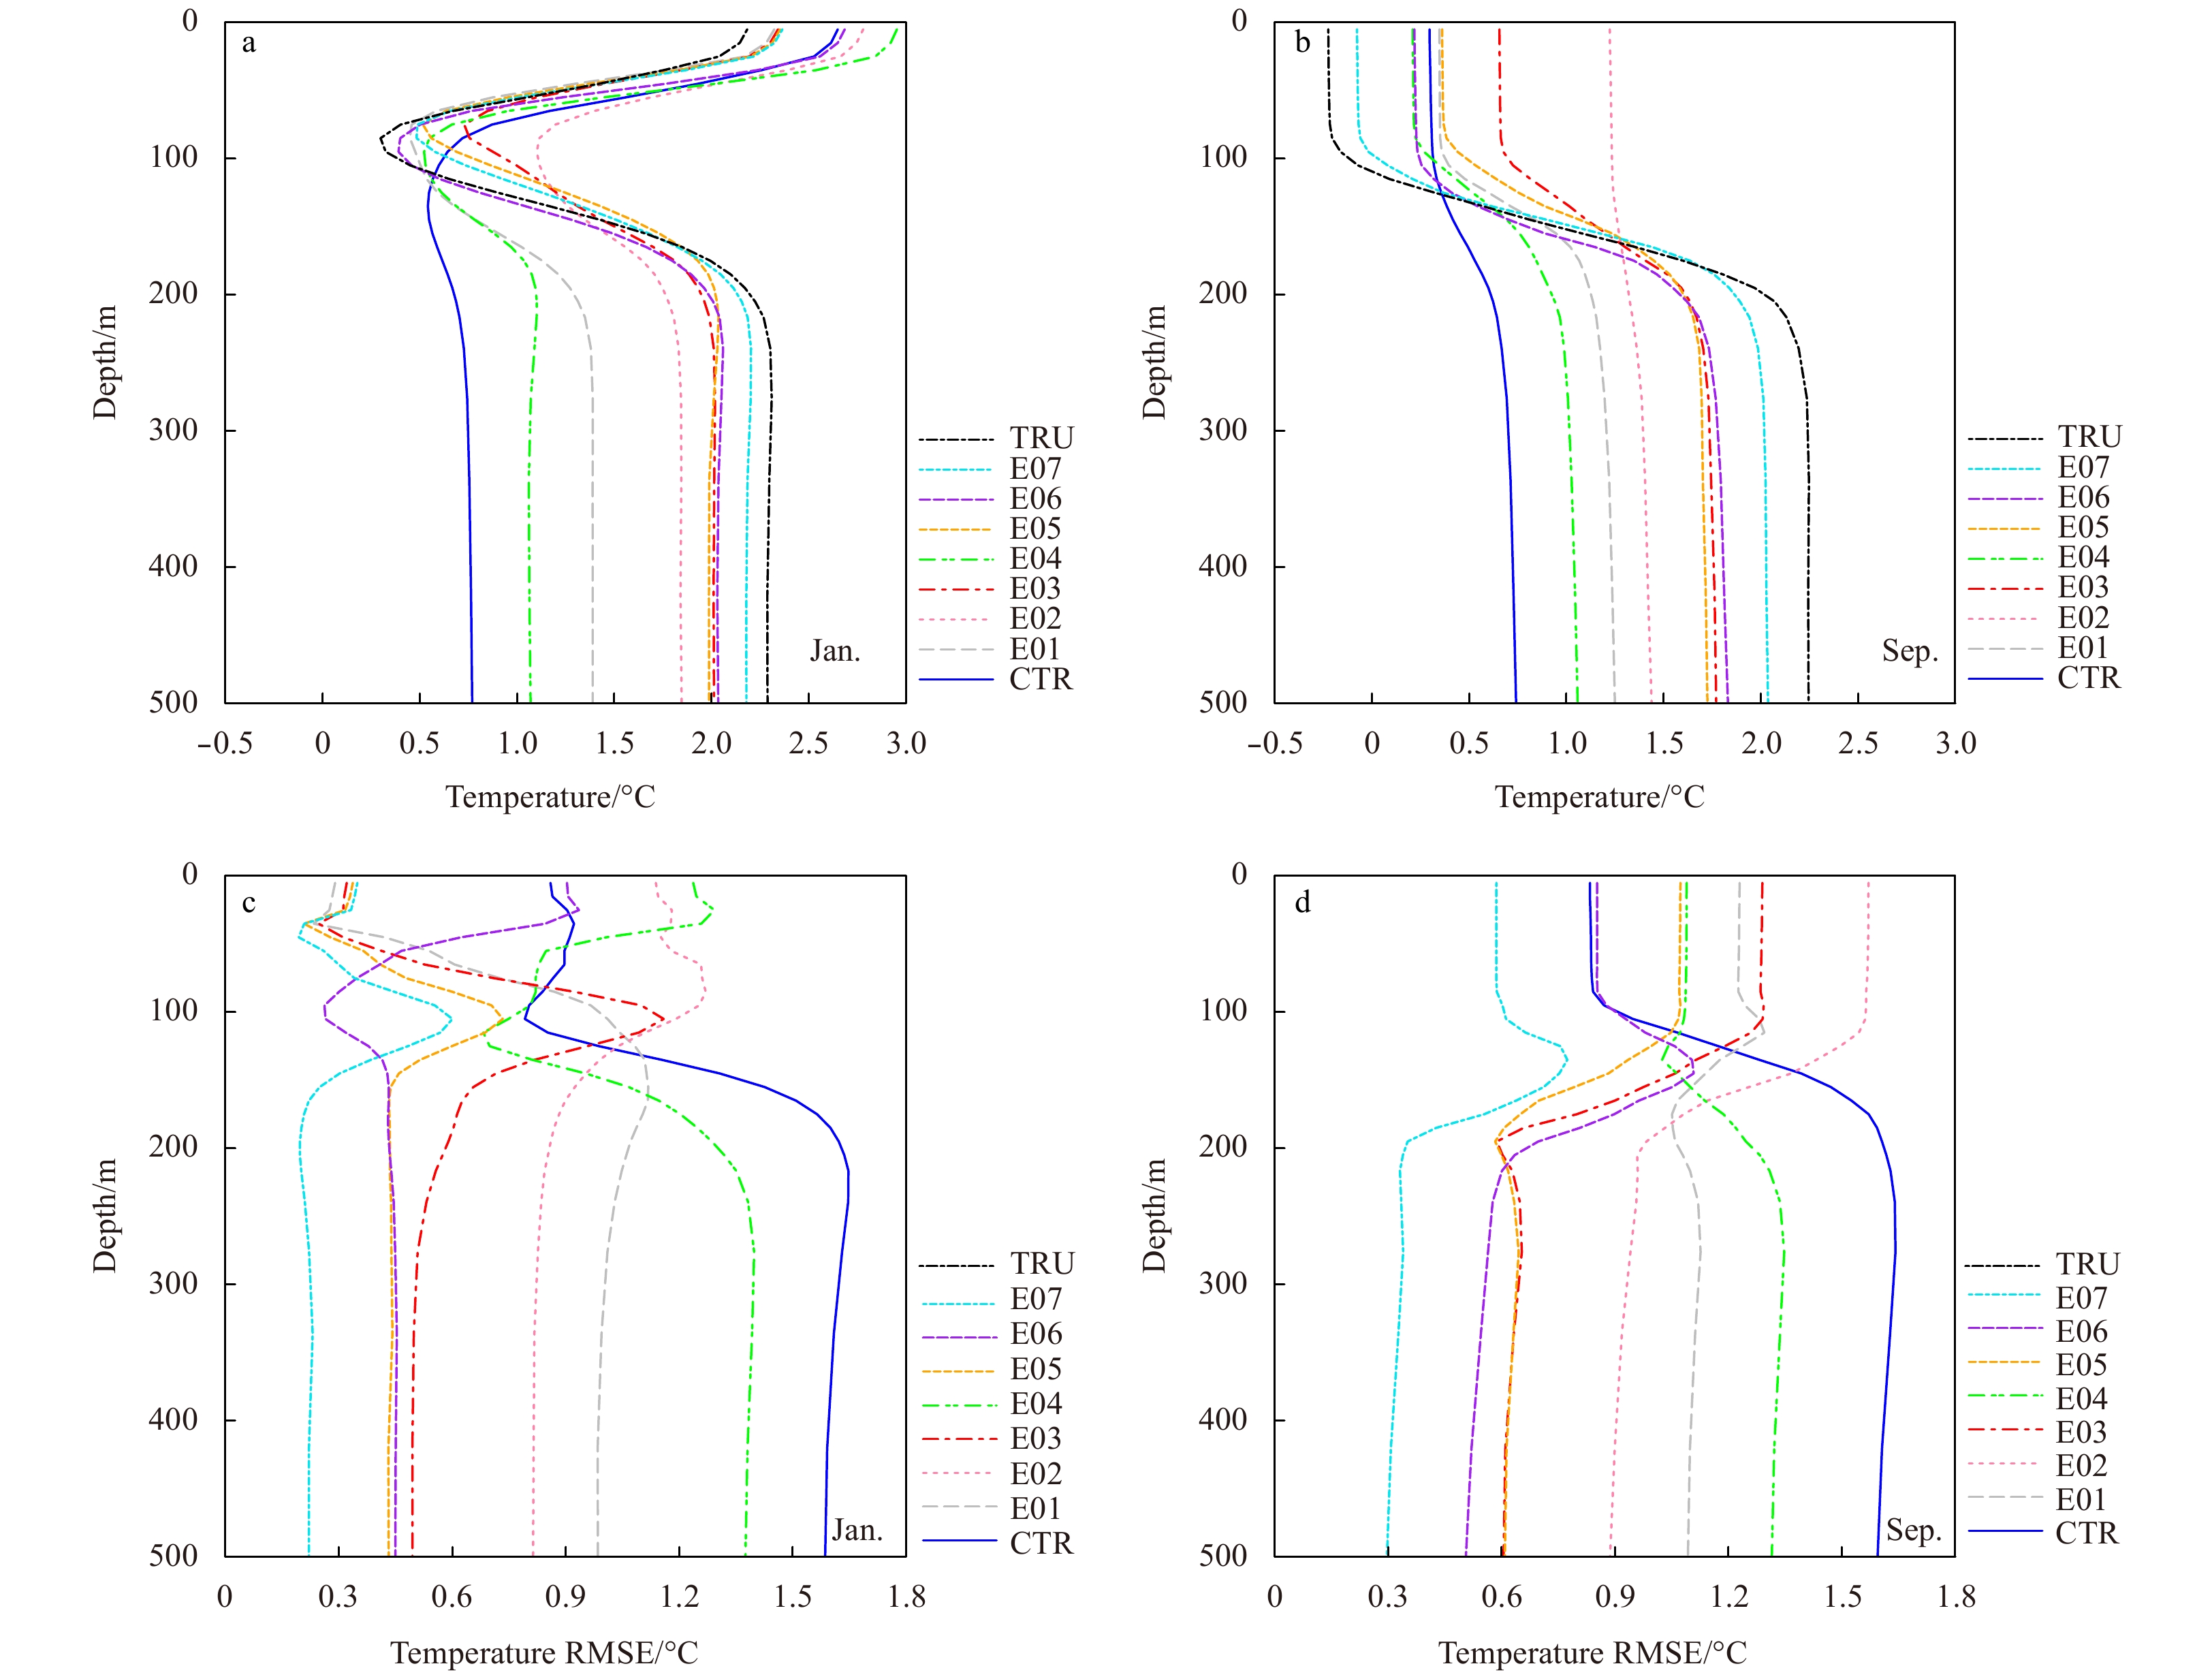
An ensemble optimal interpolation (EnOI) data assimilation method is applied in the BCC_CSM1.1 to investigate the impact of ocean data assimilations on seasonal forecasts in an idealized twin experiment framework. Pseudo-observations of sea surface temperature (SST), sea surface height (SSH), sea surface salinity (SSS), temperature and salinity (T/S) profiles were first generated in a free model run. Then, a series of sensitivity tests initialized with predefined bias were conducted for a one-year period; this involved a free run (CTR) and seven assimilation runs. These tests allowed us to check the analysis field accuracy against the “truth”. As expected, data assimilation improved all investigated quantities; the joint assimilation of all variables gave more improved results than assimilating them separately. One-year predictions initialized from the seven runs and CTR were then conducted and compared. The forecasts initialized from joint assimilation of surface data produced comparable SST root mean square errors to that from assimilation of T/S profiles, but the assimilation of T/S profiles is crucial to reduce subsurface deficiencies. The ocean surface currents in the tropics were better predicted when initial conditions produced by assimilating T/S profiles, while surface data assimilation became more important at higher latitudes, particularly near the western boundary currents. The predictions of ocean heat content and mixed layer depth are significantly improved initialized from the joint assimilation of all the variables. Finally, a central Pacific El Niño was well predicted from the joint assimilation of surface data, indicating the importance of joint assimilation of SST, SSH, and SSS for ENSO predictions.
Analysis and comparison of heat flux of landfast ice during 2016 in the Prydz Bay, Antarctica
Guanghua Hao, Jie Su, Qinghua Yang, Long Lin, Shutao Cao
2021, 40(5): 71-79. doi: 10.1007/s13131-021-1731-4
Abstract:
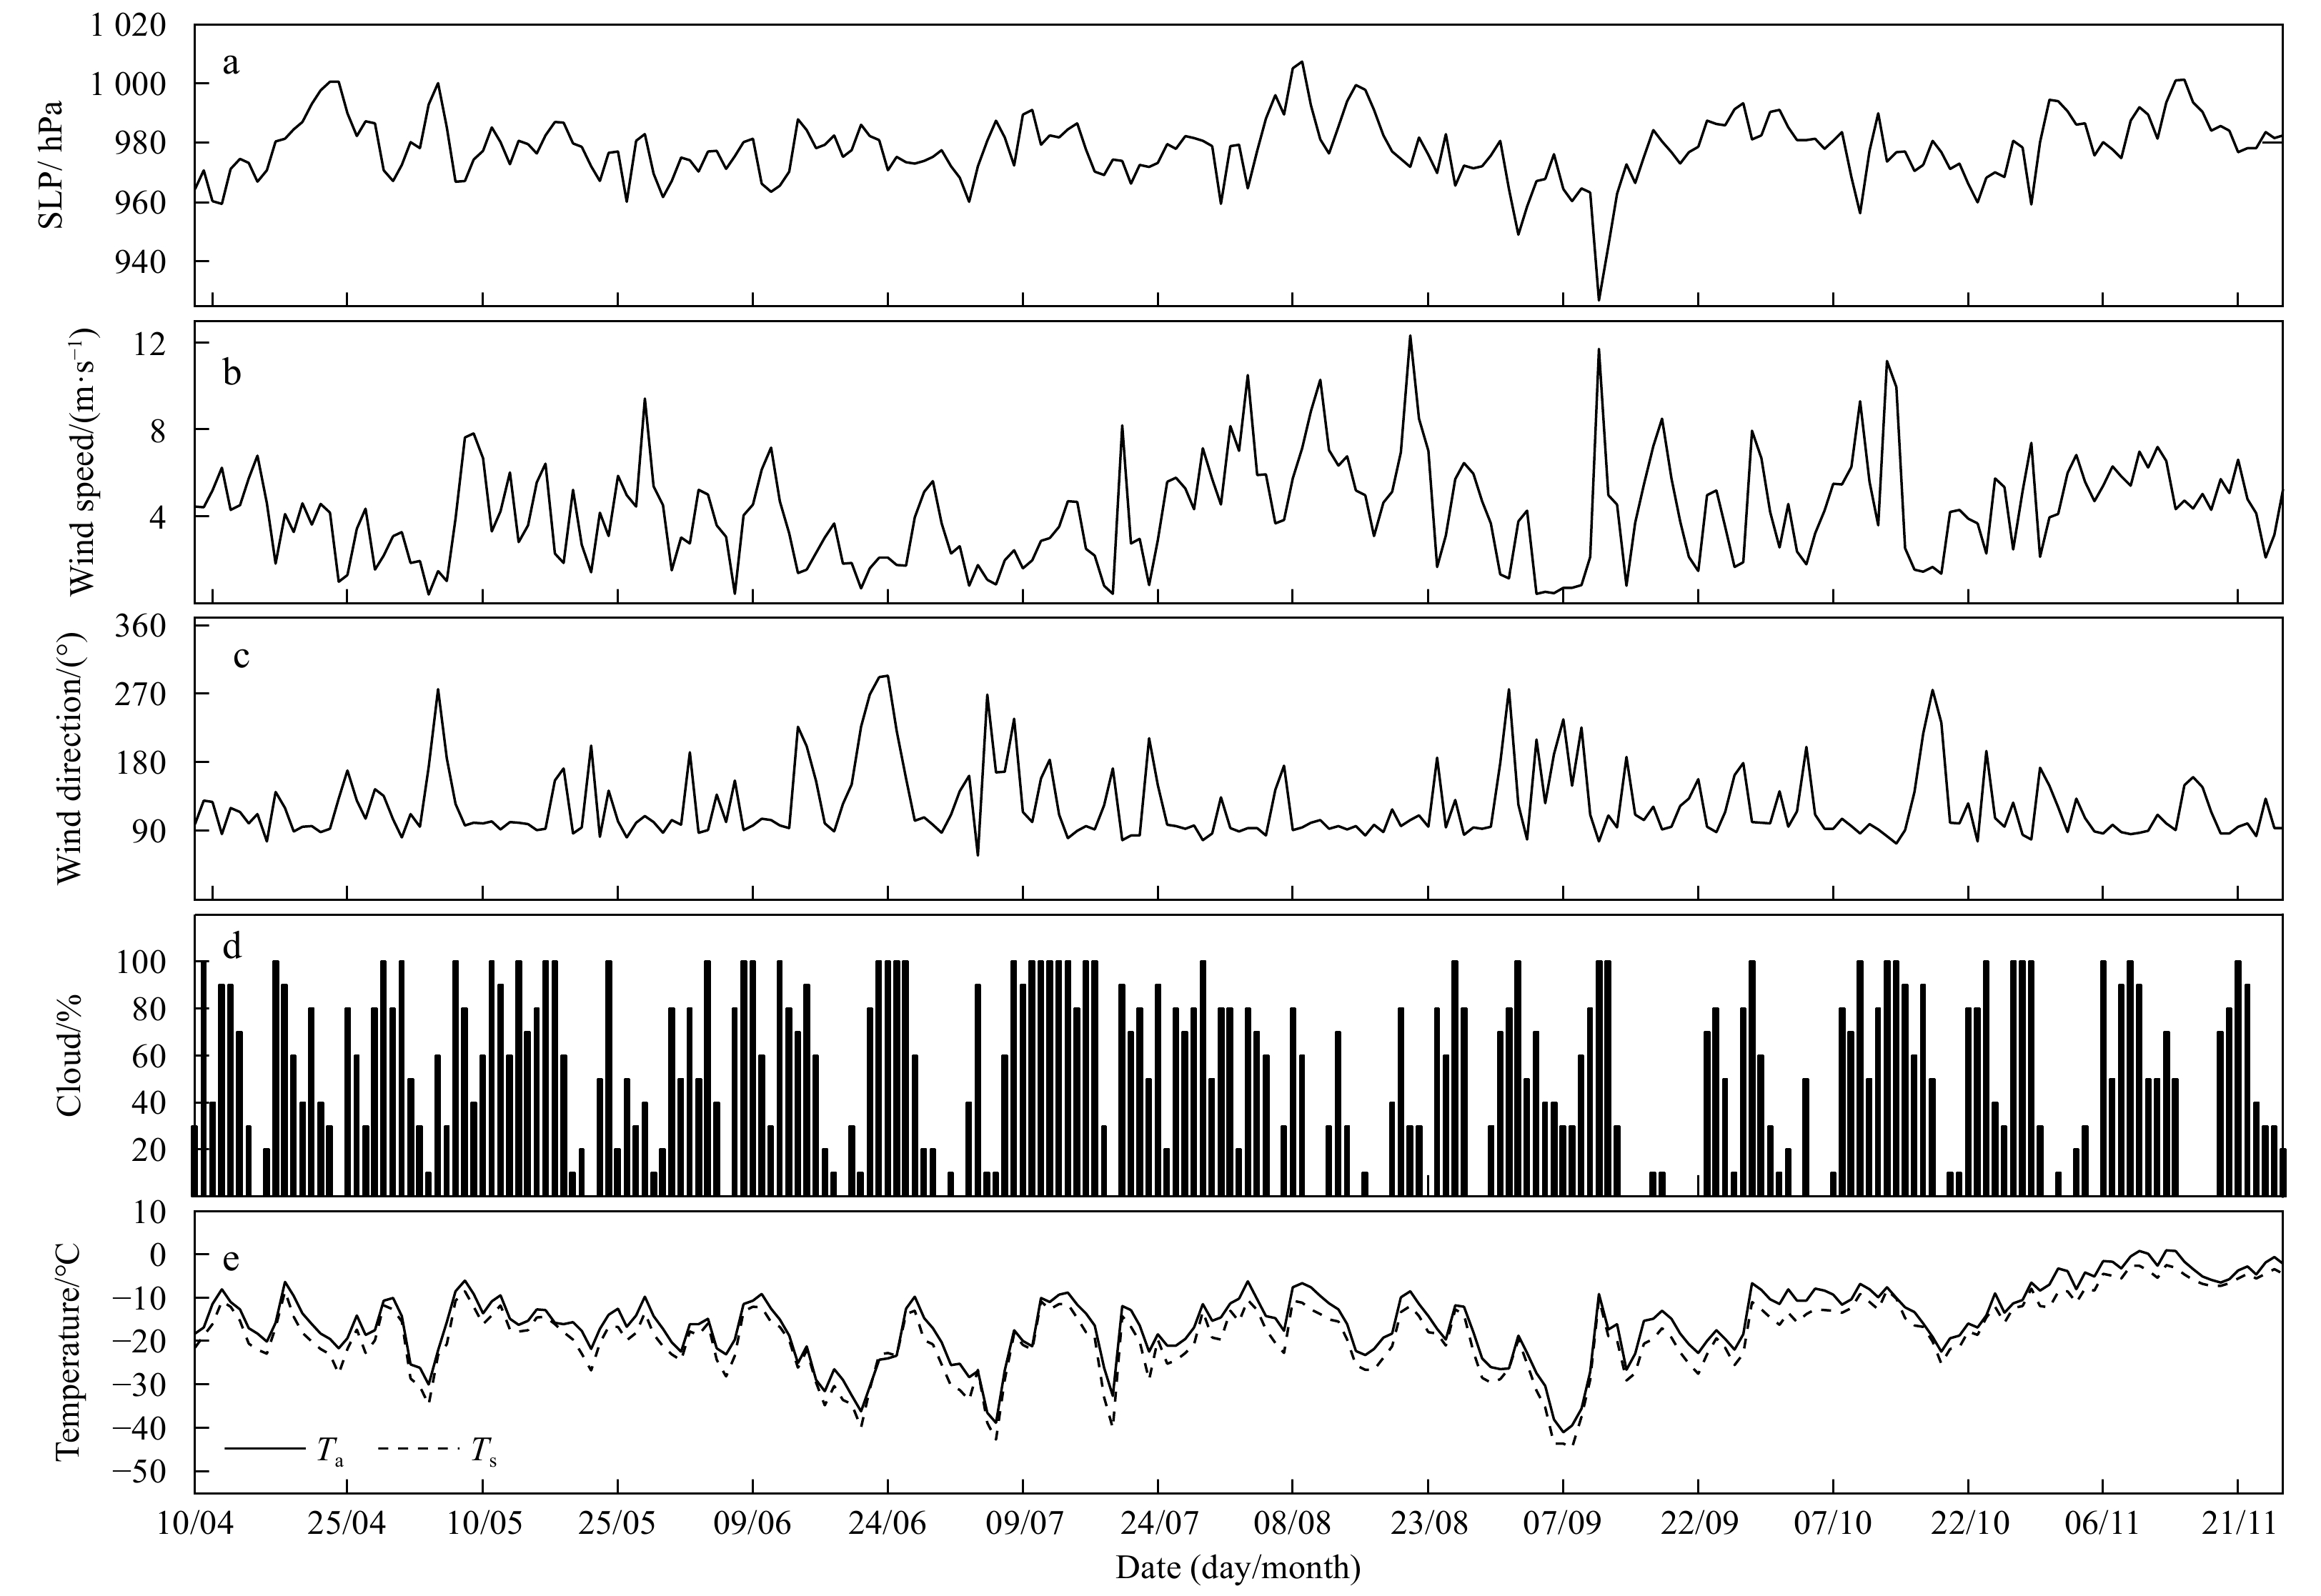
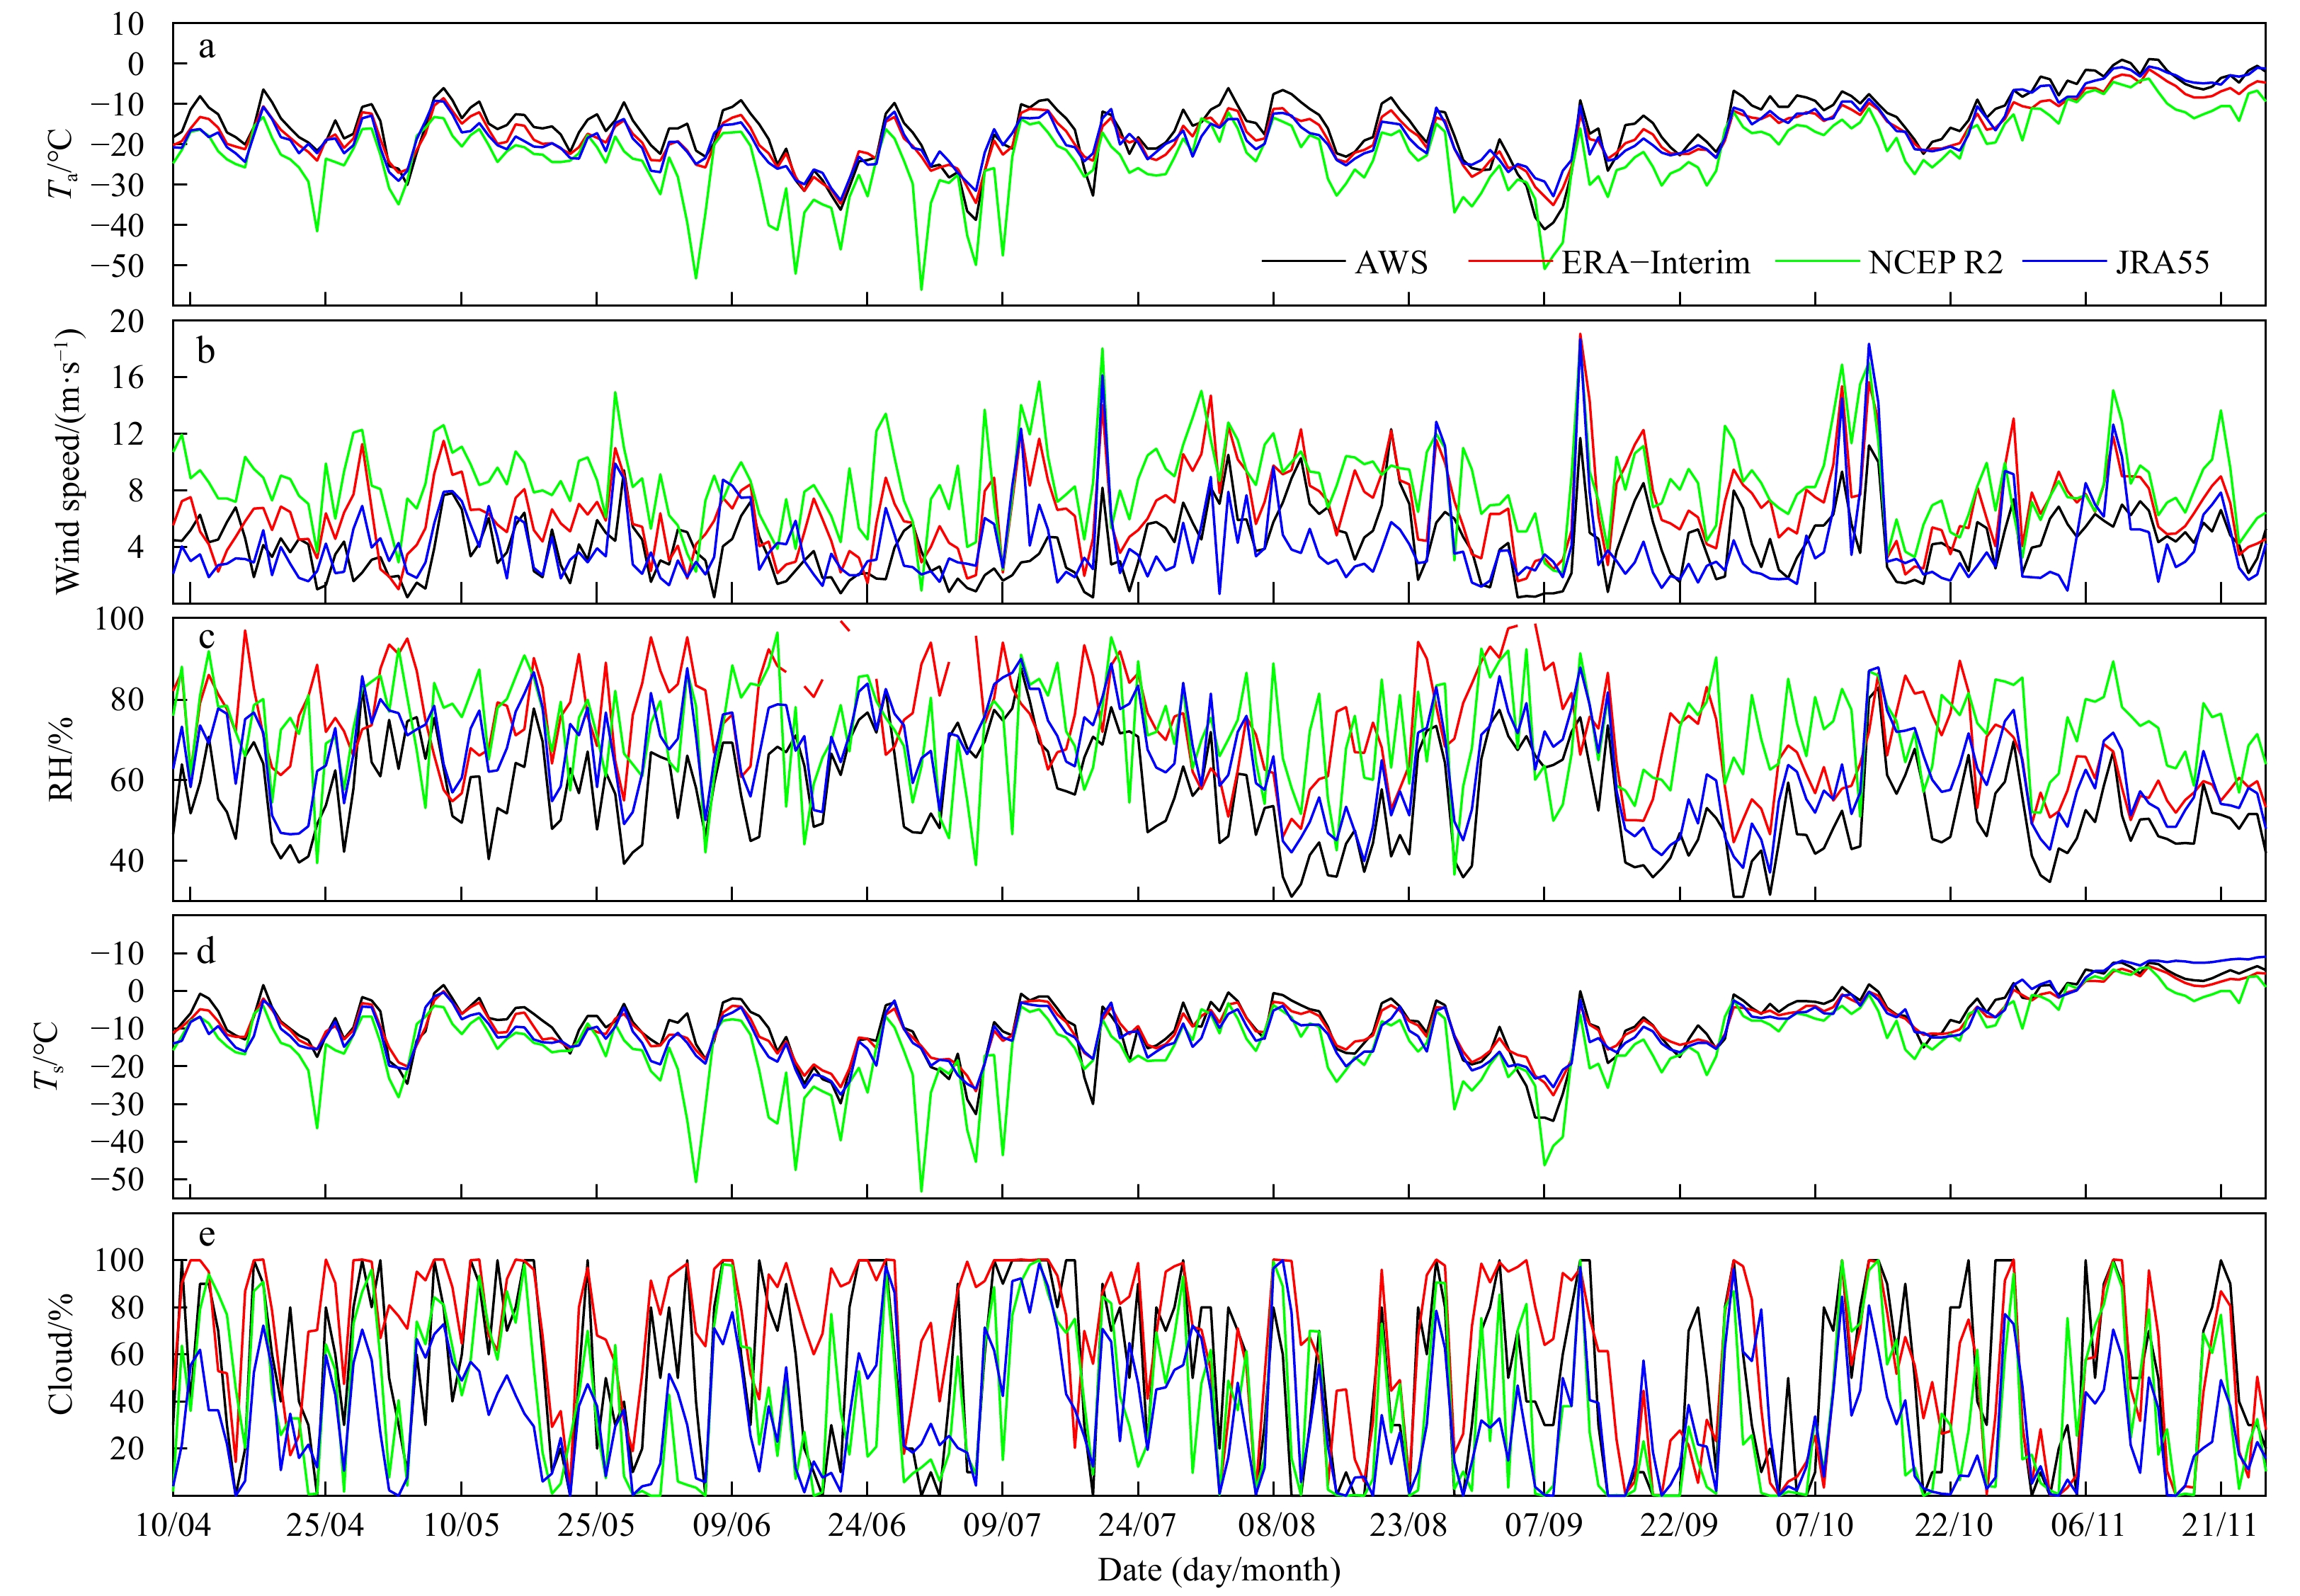
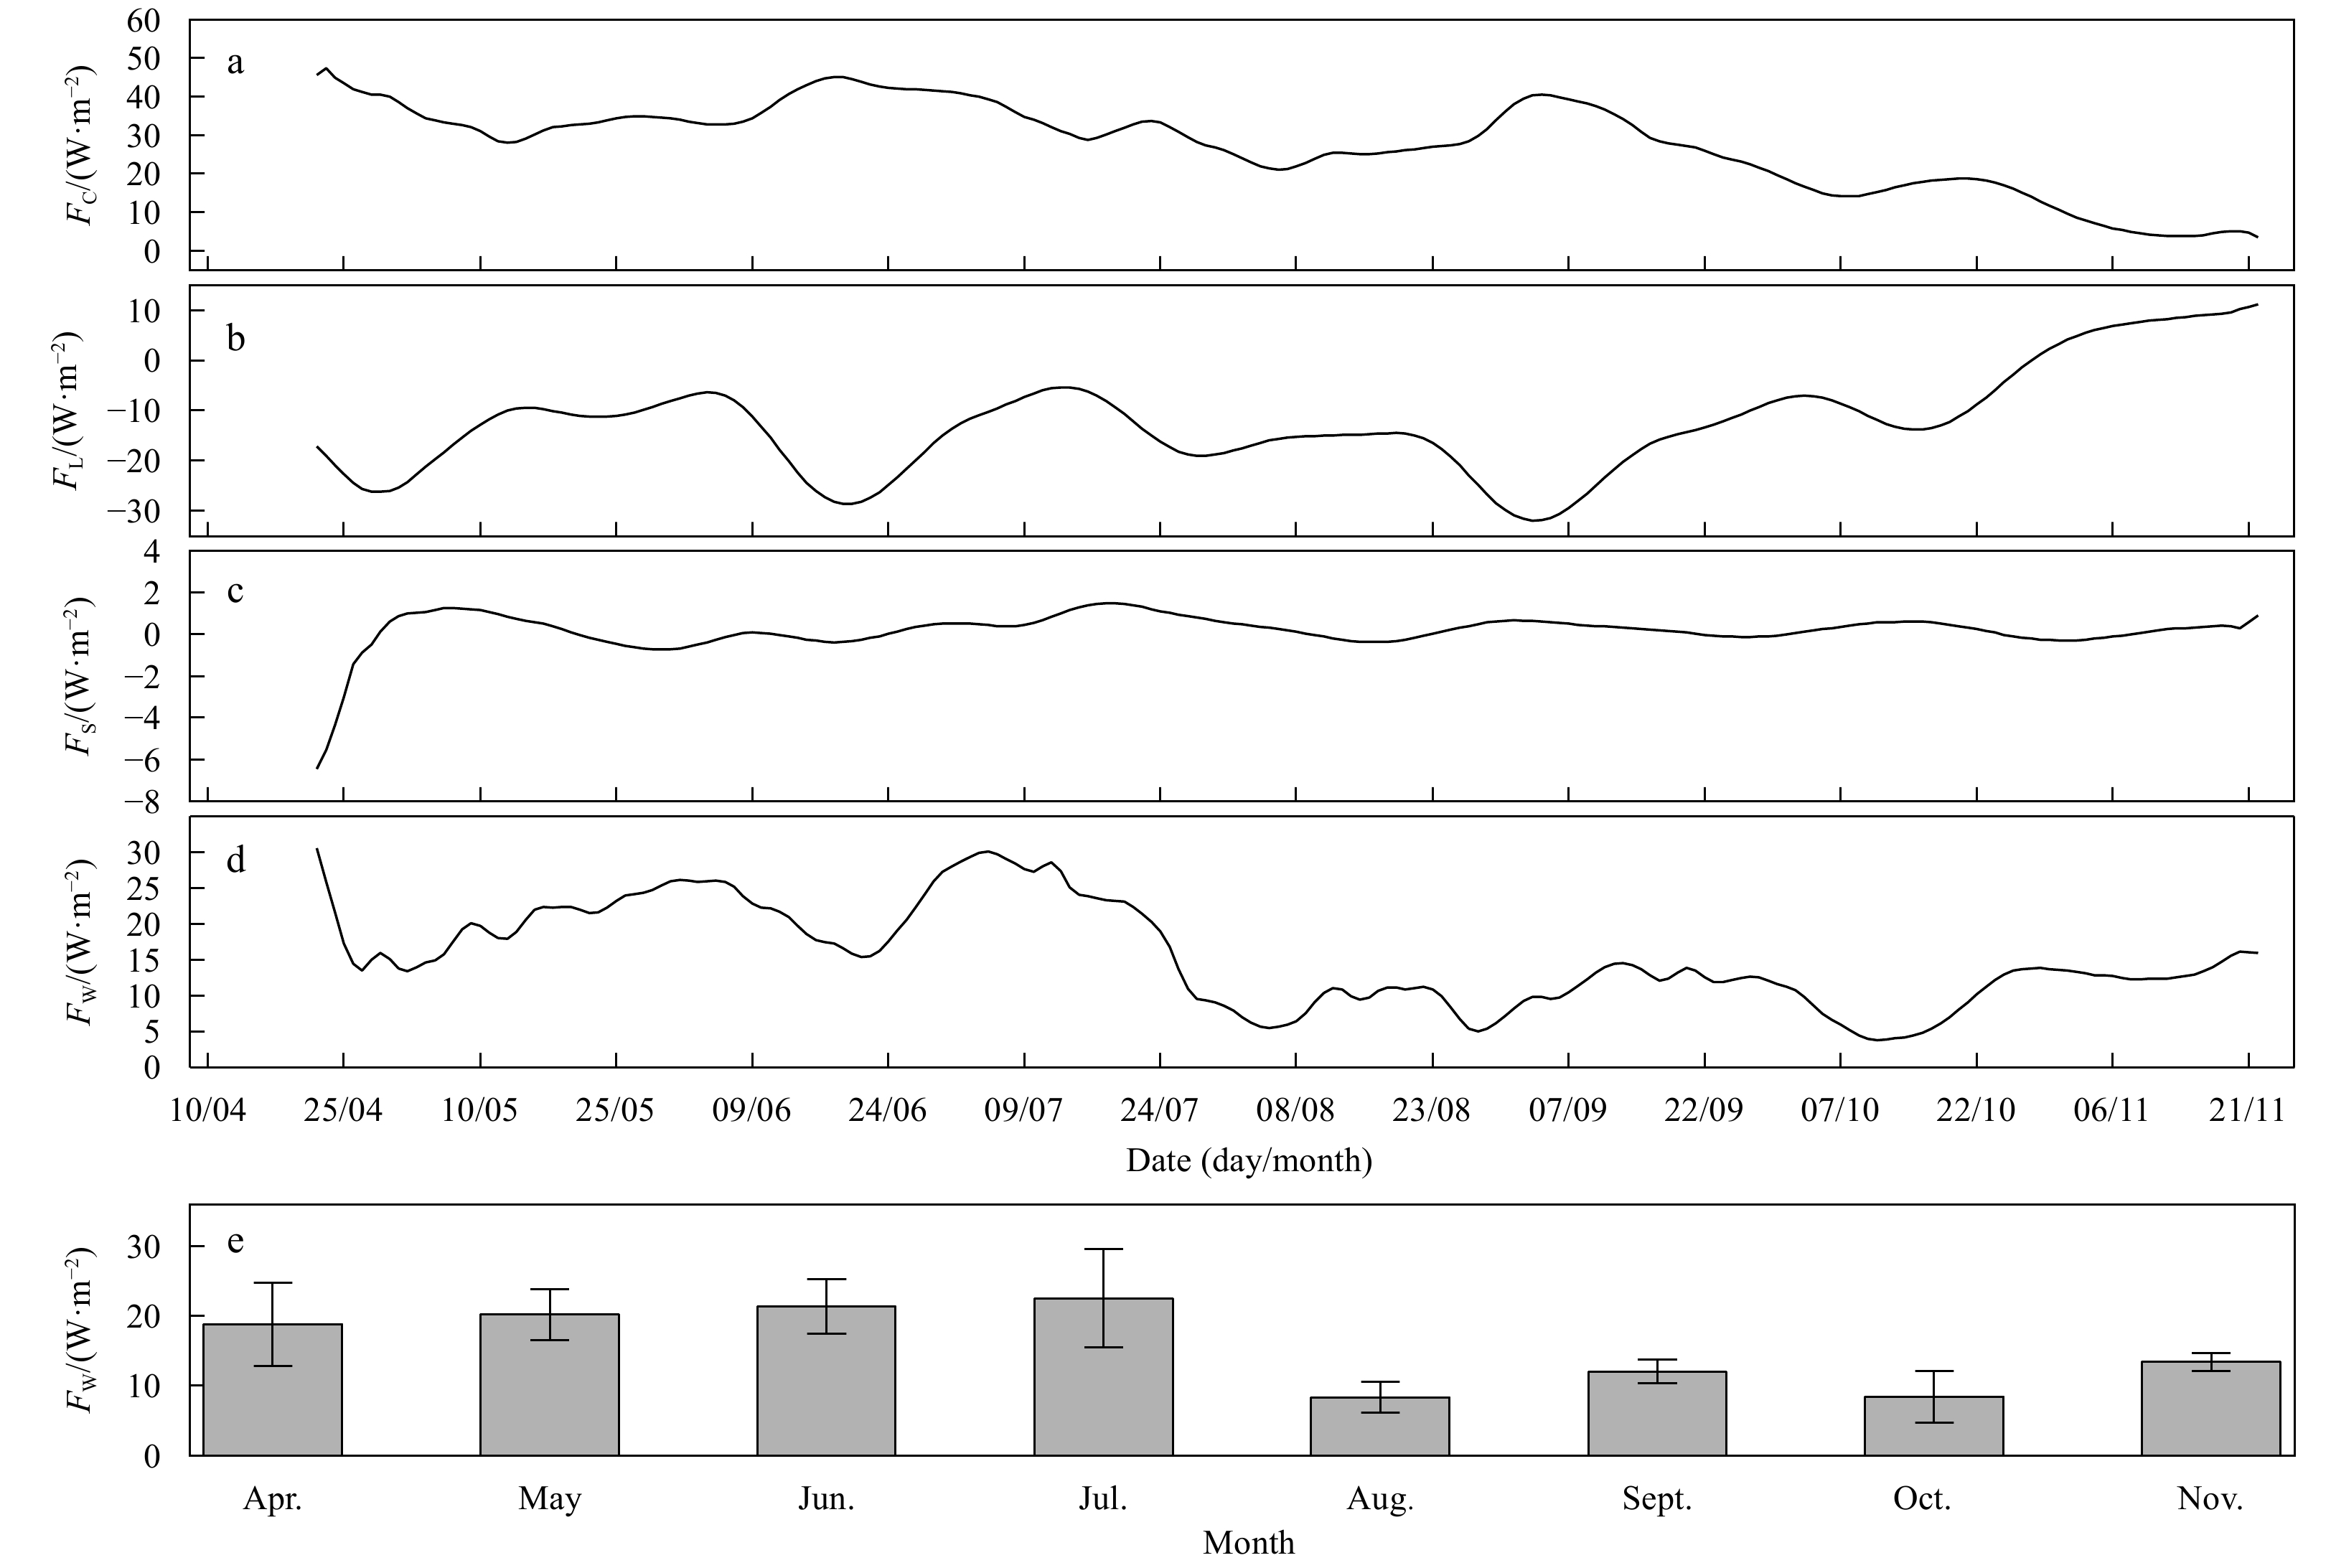
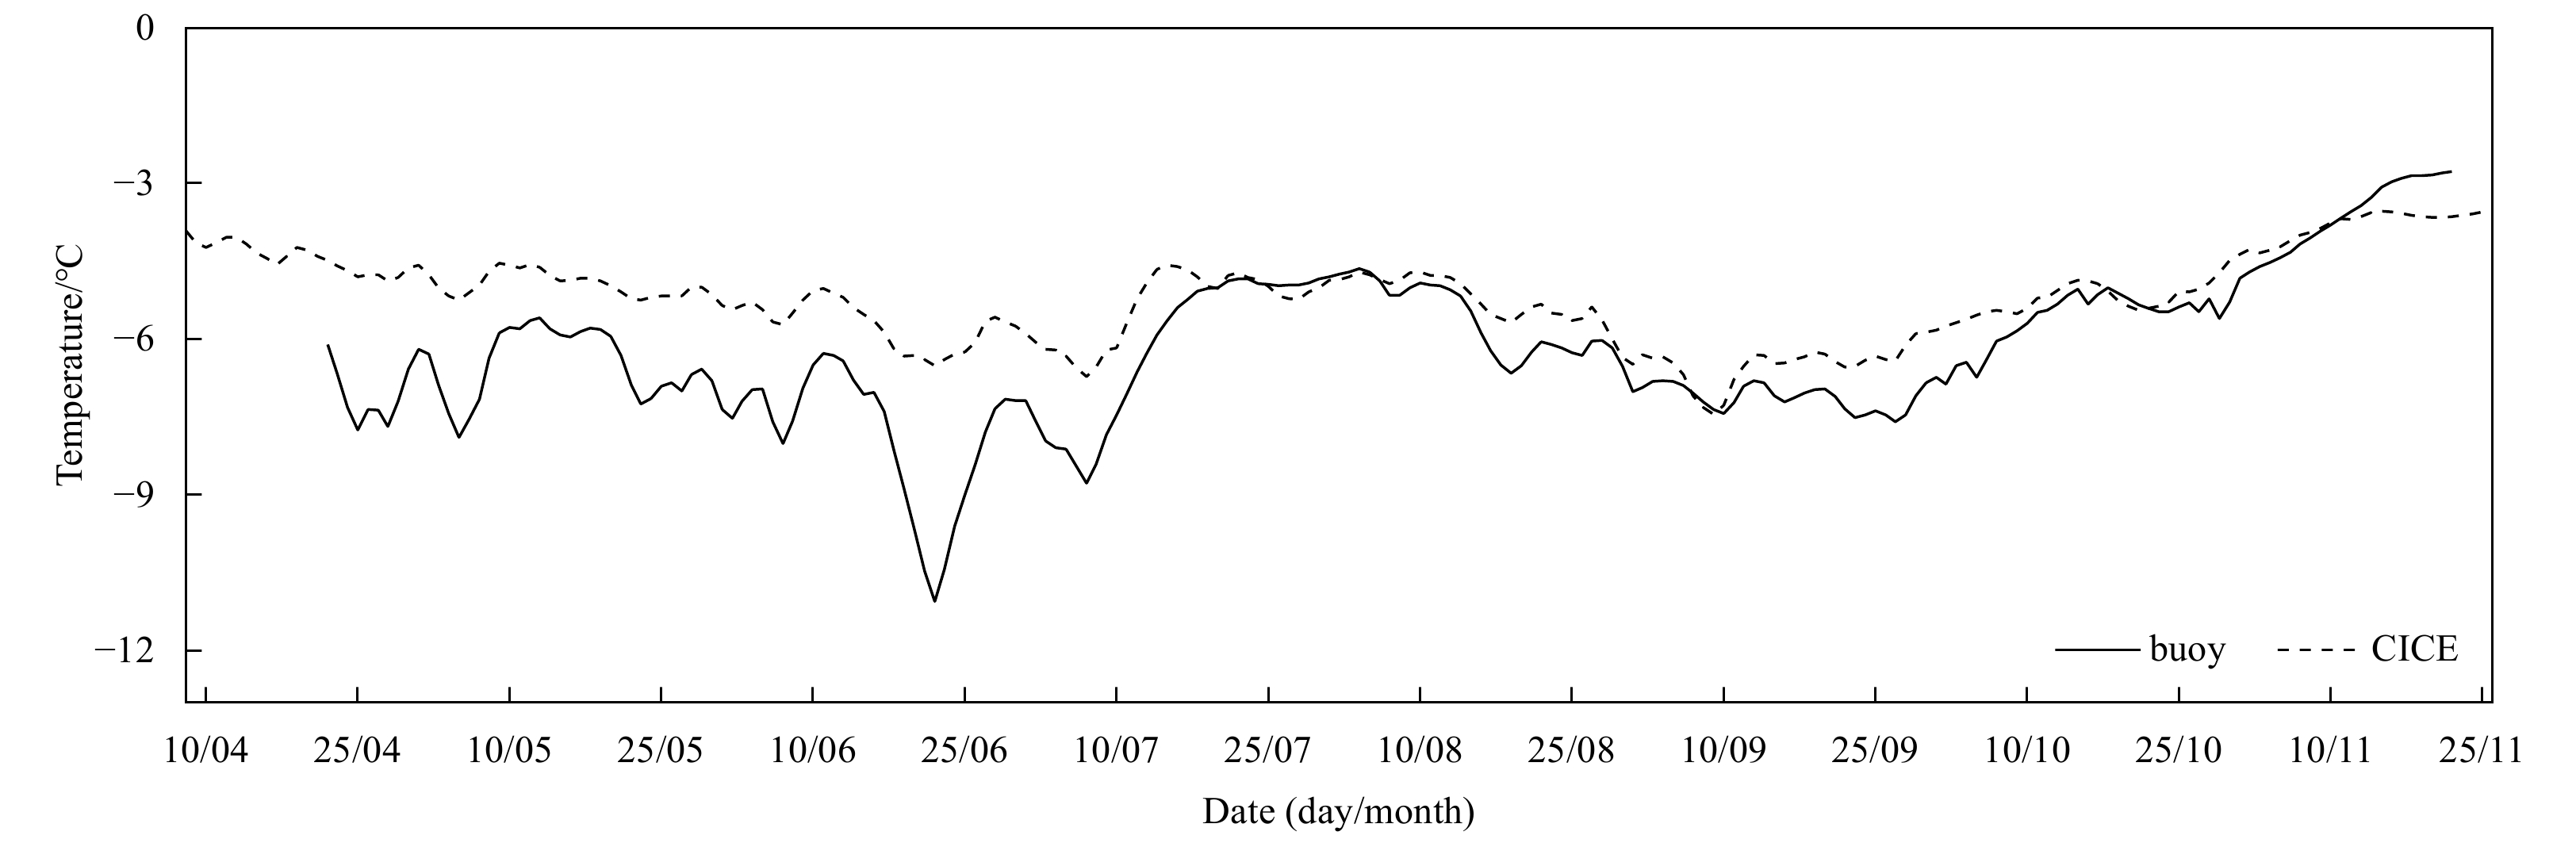
Long term in situ atmospheric observation of the landfast ice nearby Zhongshan Station in the Prydz Bay was performed from April to November 2016. The in situ observation, including the conventional meteorological elements and turbulent flux, enabled this study to evaluate the sea ice surface energy budget process. Using in situ observations, three different reanalysis datasets from the European Centre for Medium-Range Weather Forecasts Interim Re-analysis (ERA-Interim), National Centers for Environmental Prediction Reanalysis2 (NCEP R2), and Japanese 55-year Reanalysis (JRA55), and the Los Alamos sea ice model, CICE, output for surface fluxes were evaluated. The observed sensible heat flux (SH) and net longwave radiation showed seasonal variation with increasing temperature. Air temperature rose from the middle of October as the solar elevation angle increased. The ice surface lost more energy by outgoing longwave radiation as temperature increased, while the shortwave radiation showed obvious increases from the middle of October. The oceanic heat flux demonstrated seasonal variation and decreased with time, where the average values were 21 W/m2 and 11 W/m2, before and after August, respectively. The comparisons with in situ observations show that, SH and LE (latent heat flux) of JRA55 dataset had the smallest bias and mean absolute error (MAE), and those of NCEP R2 data show the largest differences. The ERA-Interim dataset had the highest spatial resolution, but performance was modest with bias and MAE between JRA55 and NCEP R2 compare with in situ observation. The CICE results (SH and LE) were consistent with the observed data but did not demonstrate the amplitude of inner seasonal variation. The comparison revealed better shortwave and longwave radiation stimulation based on the ERA-Interim forcing in CICE than the radiation of ERA-Interim. The average sea ice temperature decreased in June and July and increased after September, which was similar to the temperature measured by buoys, with a bias and MAE of 0.9°C and 1.0°C, respectively.
Short-term offshore extension of Brahmaputra-Ganges and Irrawaddy freshwater plumes to the central northern Bay of Bengal based on in situ and satellite observations
Zhiyuan Li, Saihua Huang, Xiaohua Zhu, Zhilin Sun, Yu Long, Huawei Xie
2021, 40(5): 80-93. doi: 10.1007/s13131-021-1729-y
Abstract:
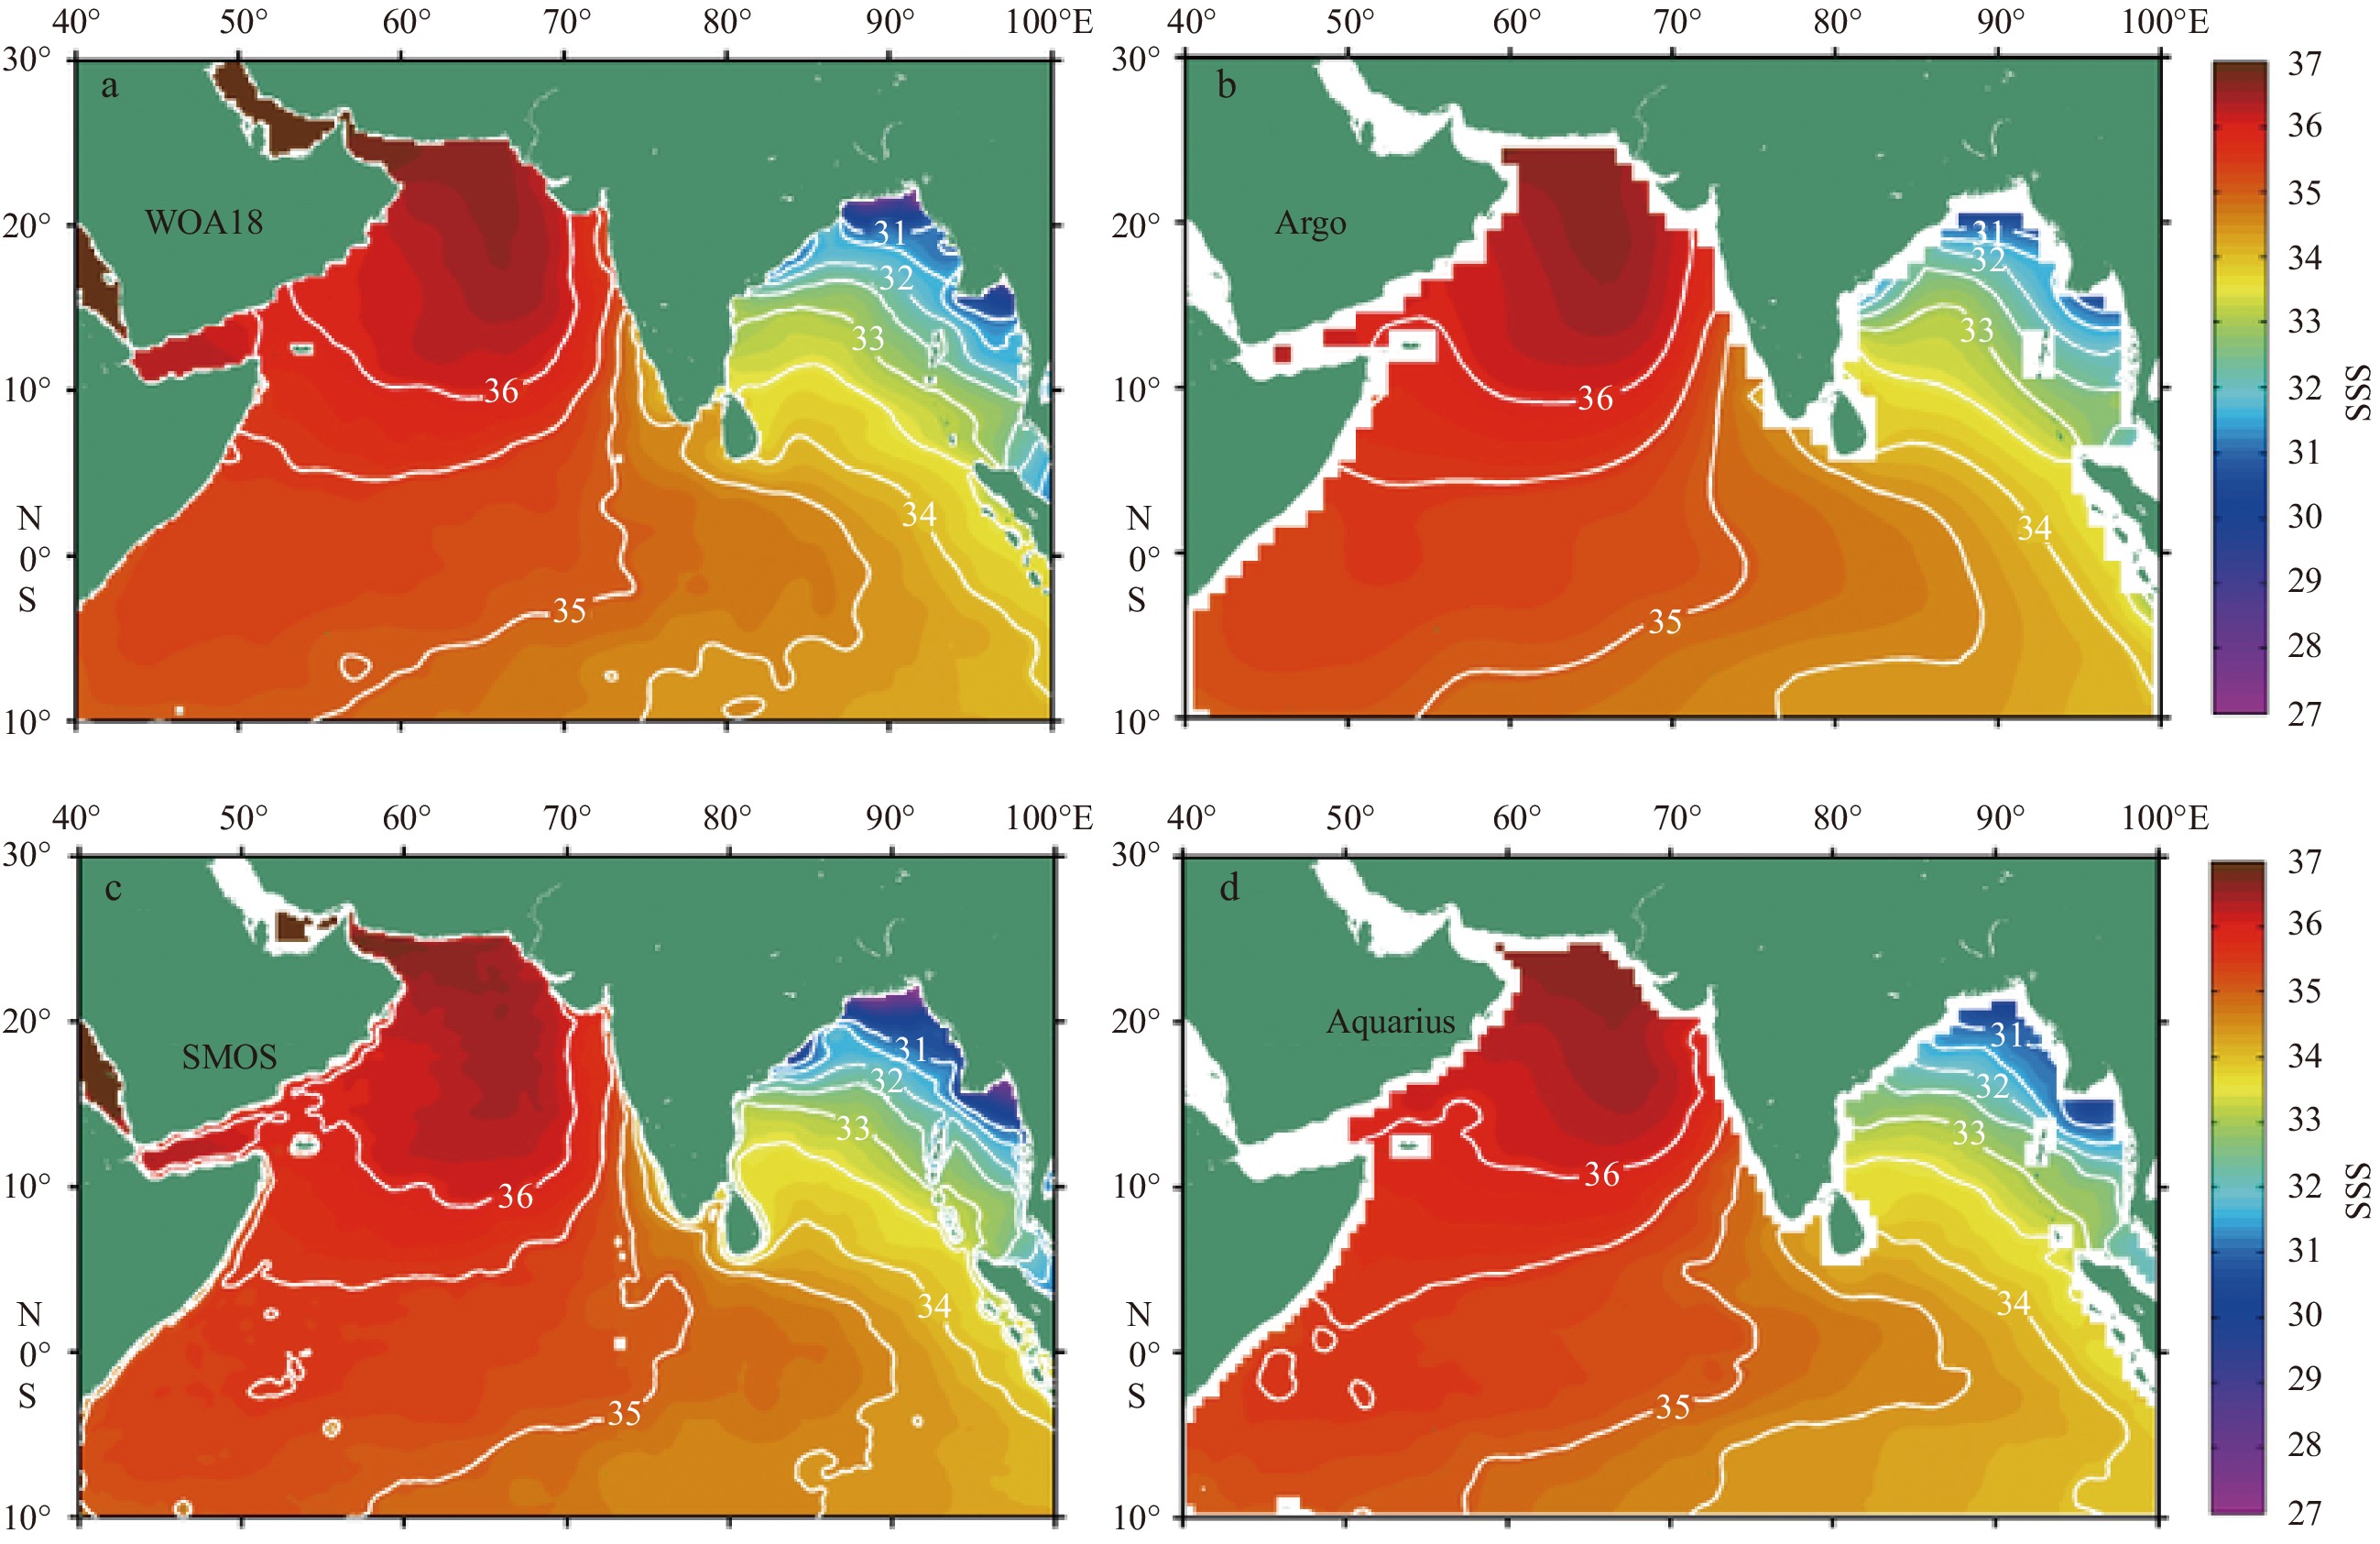
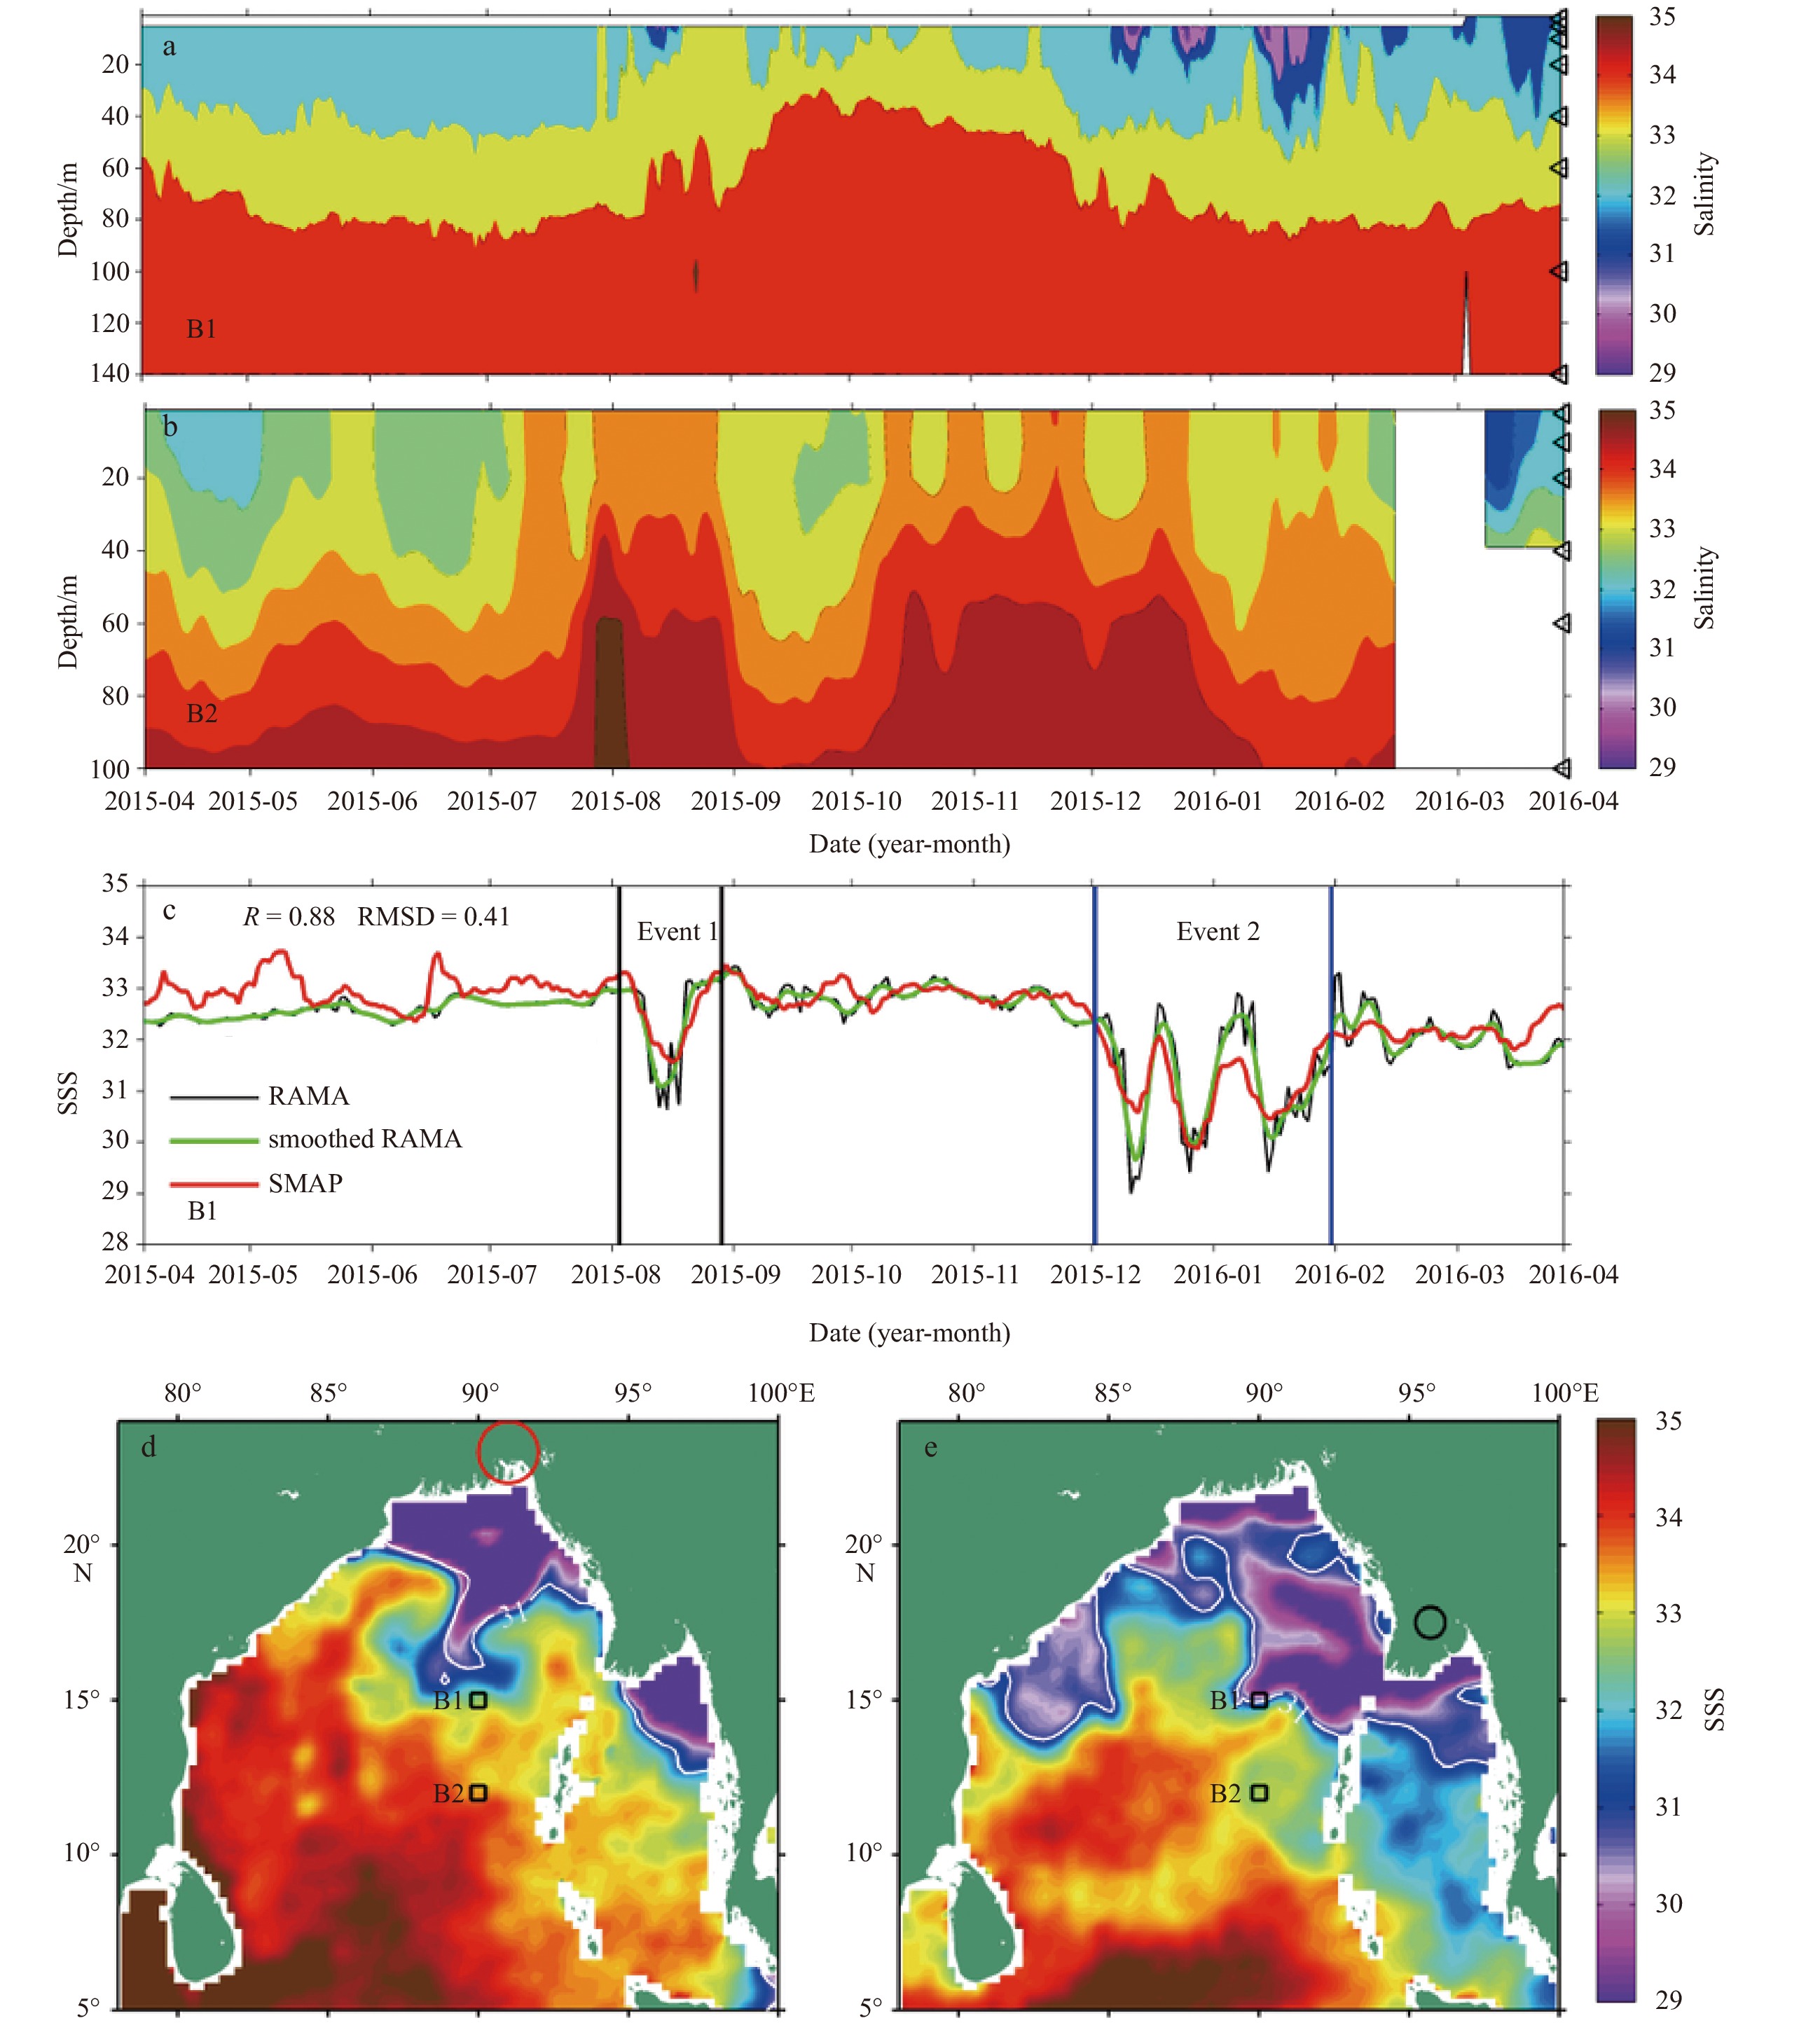
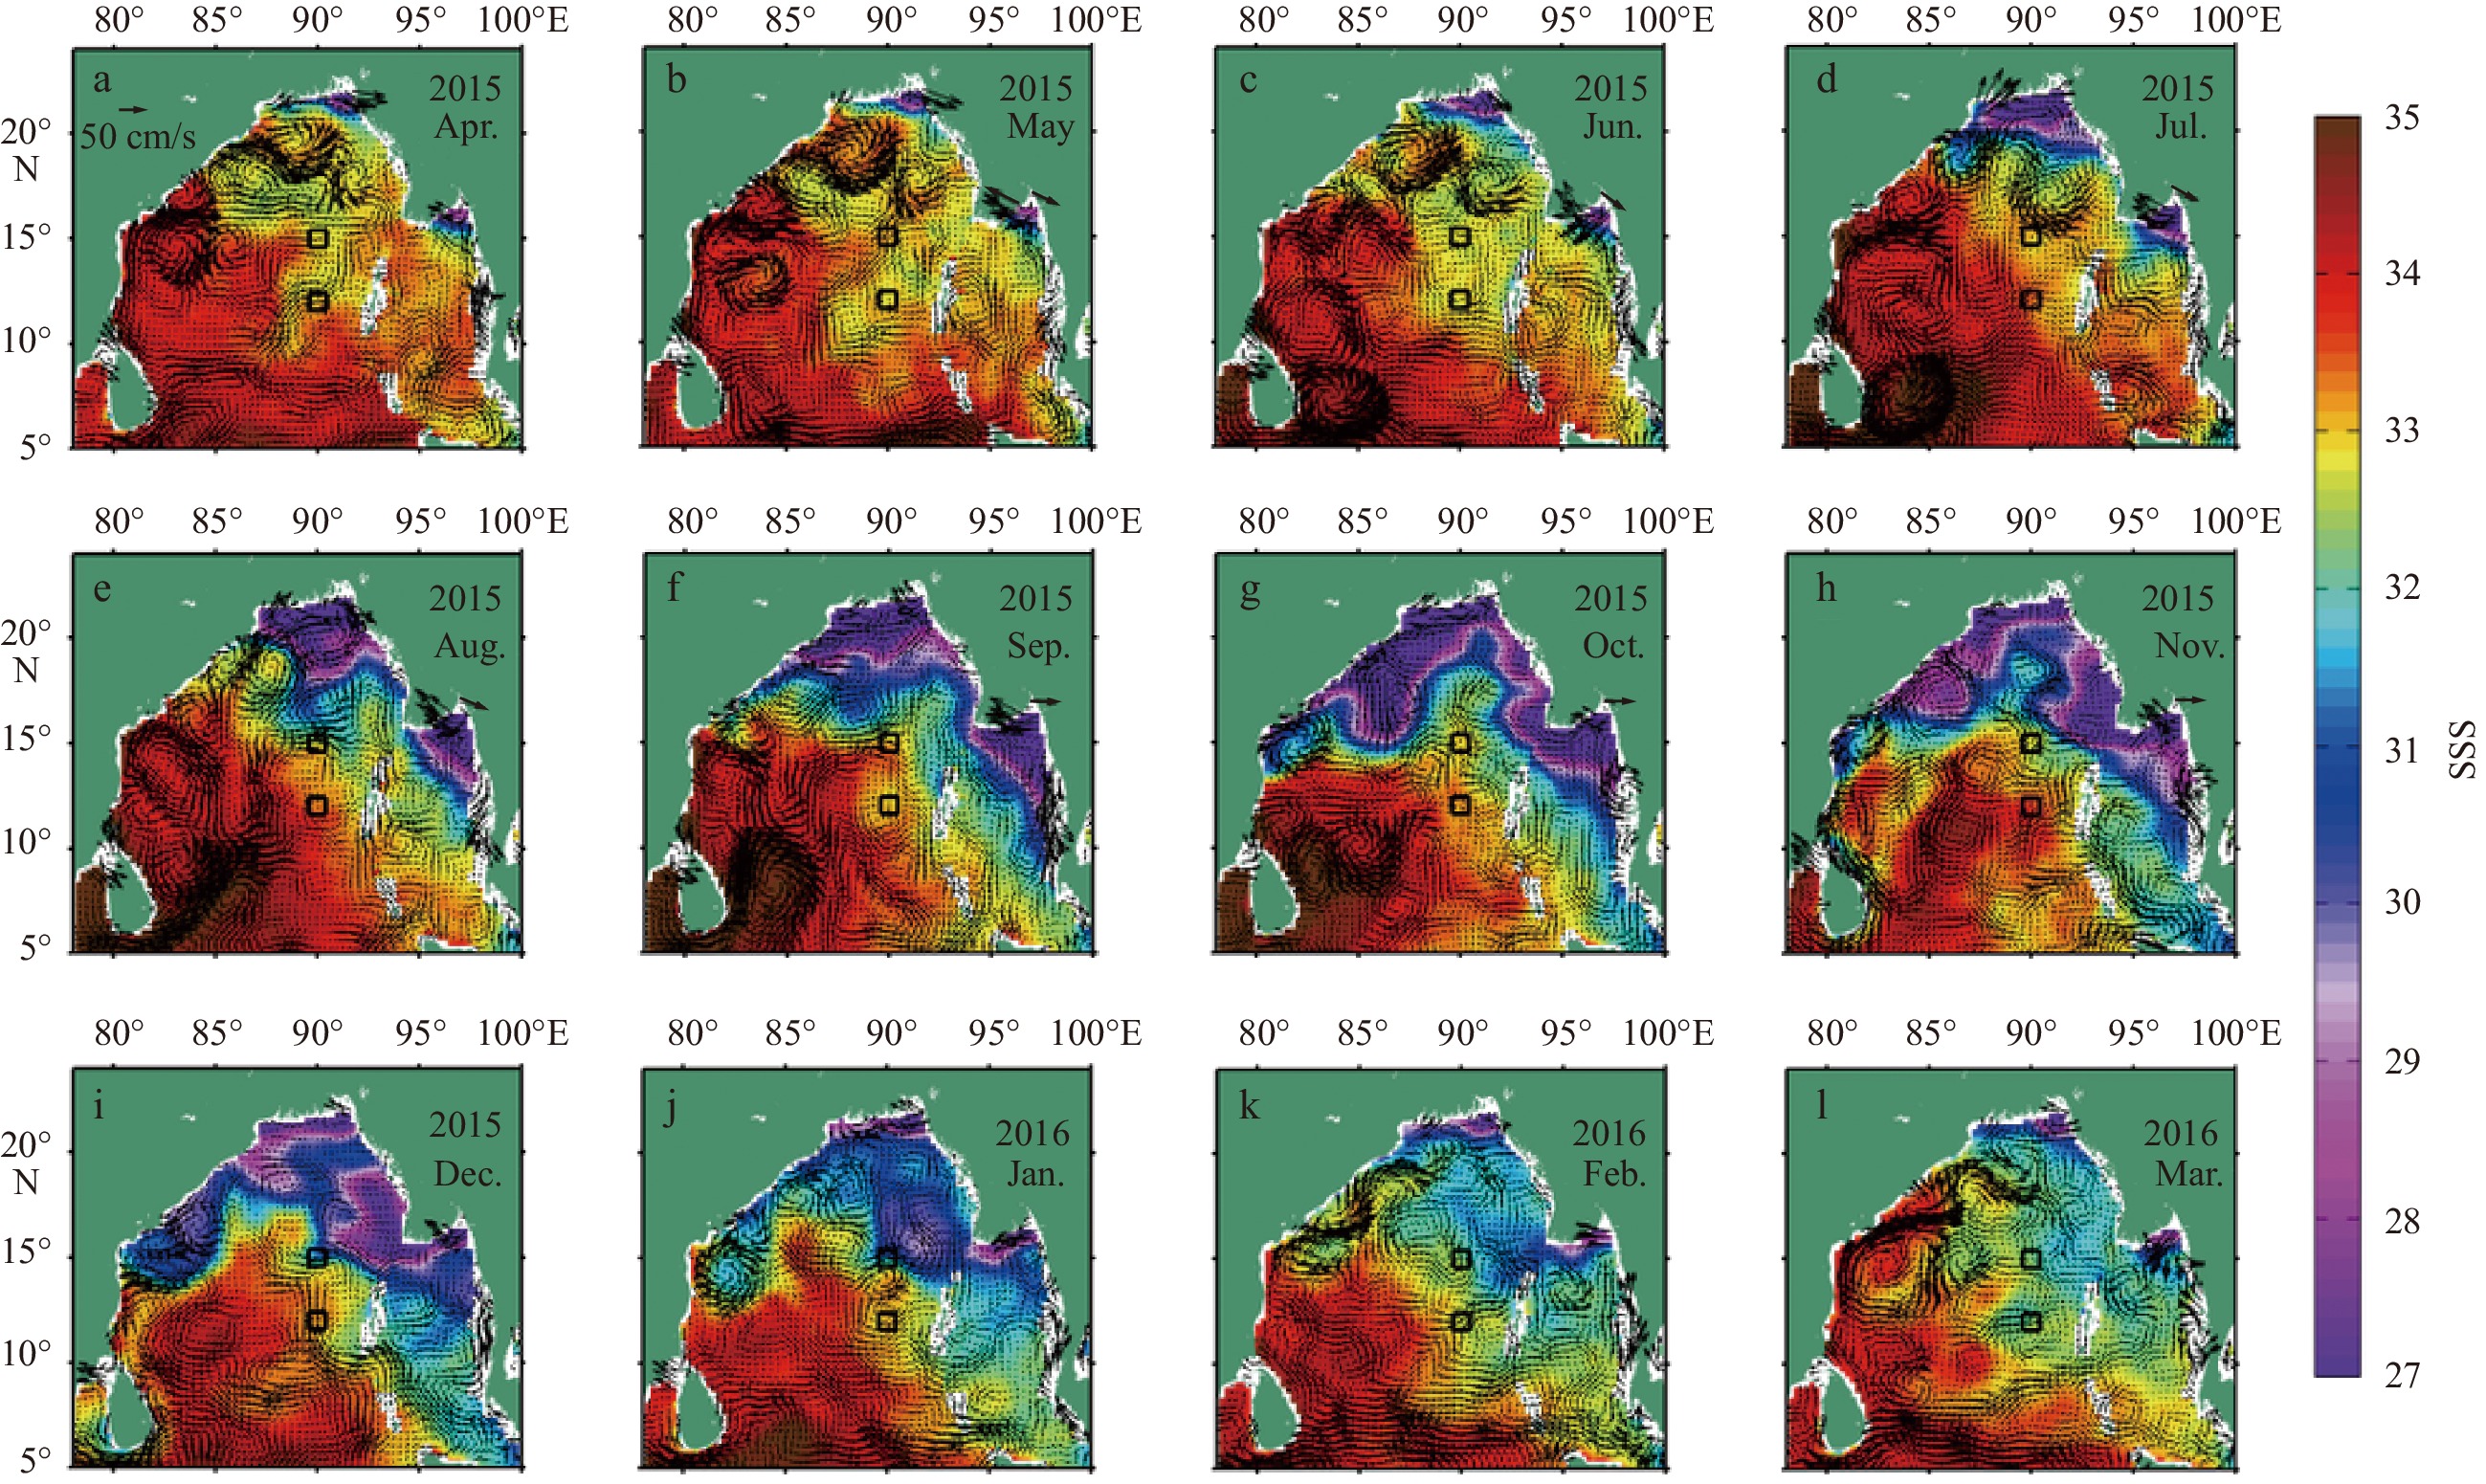
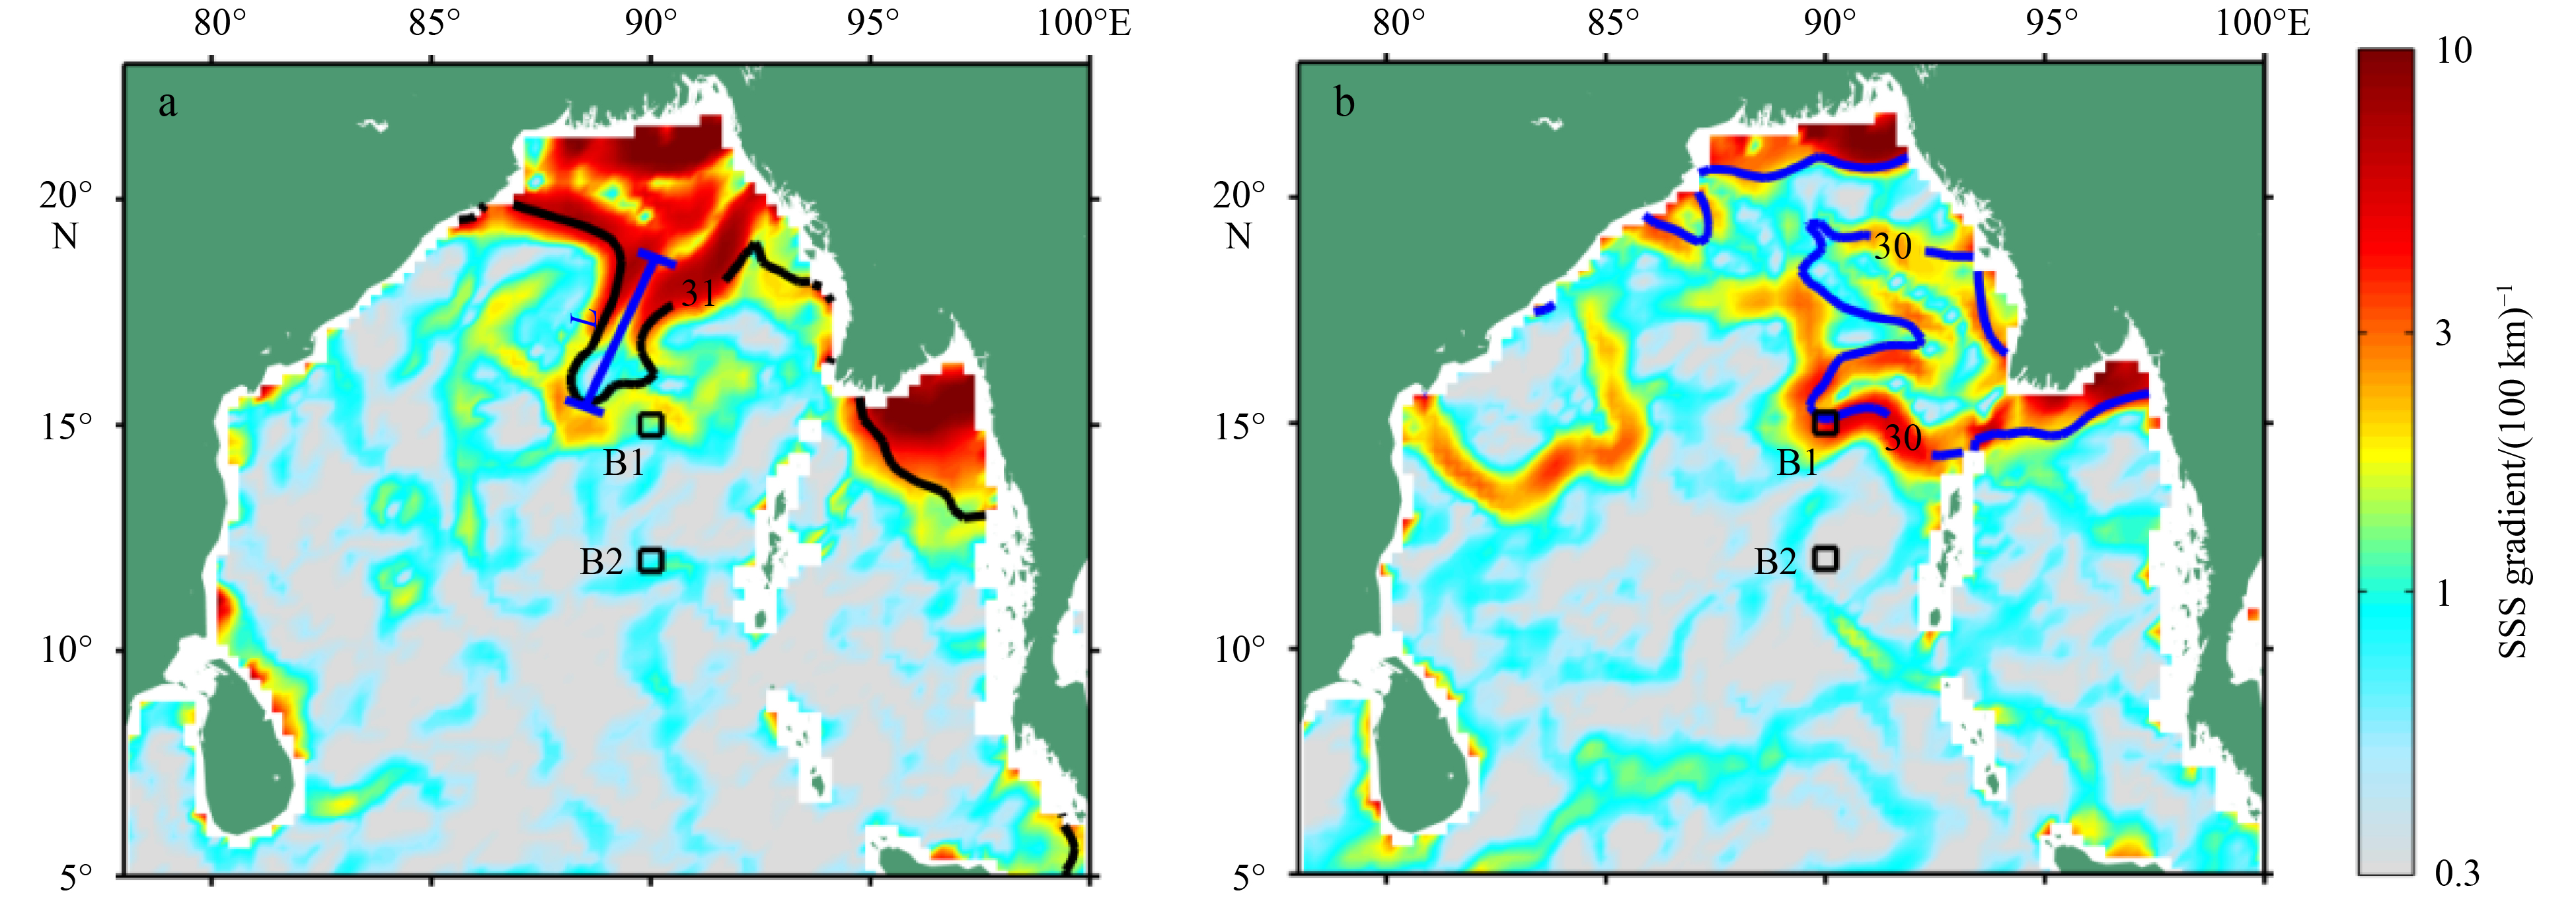
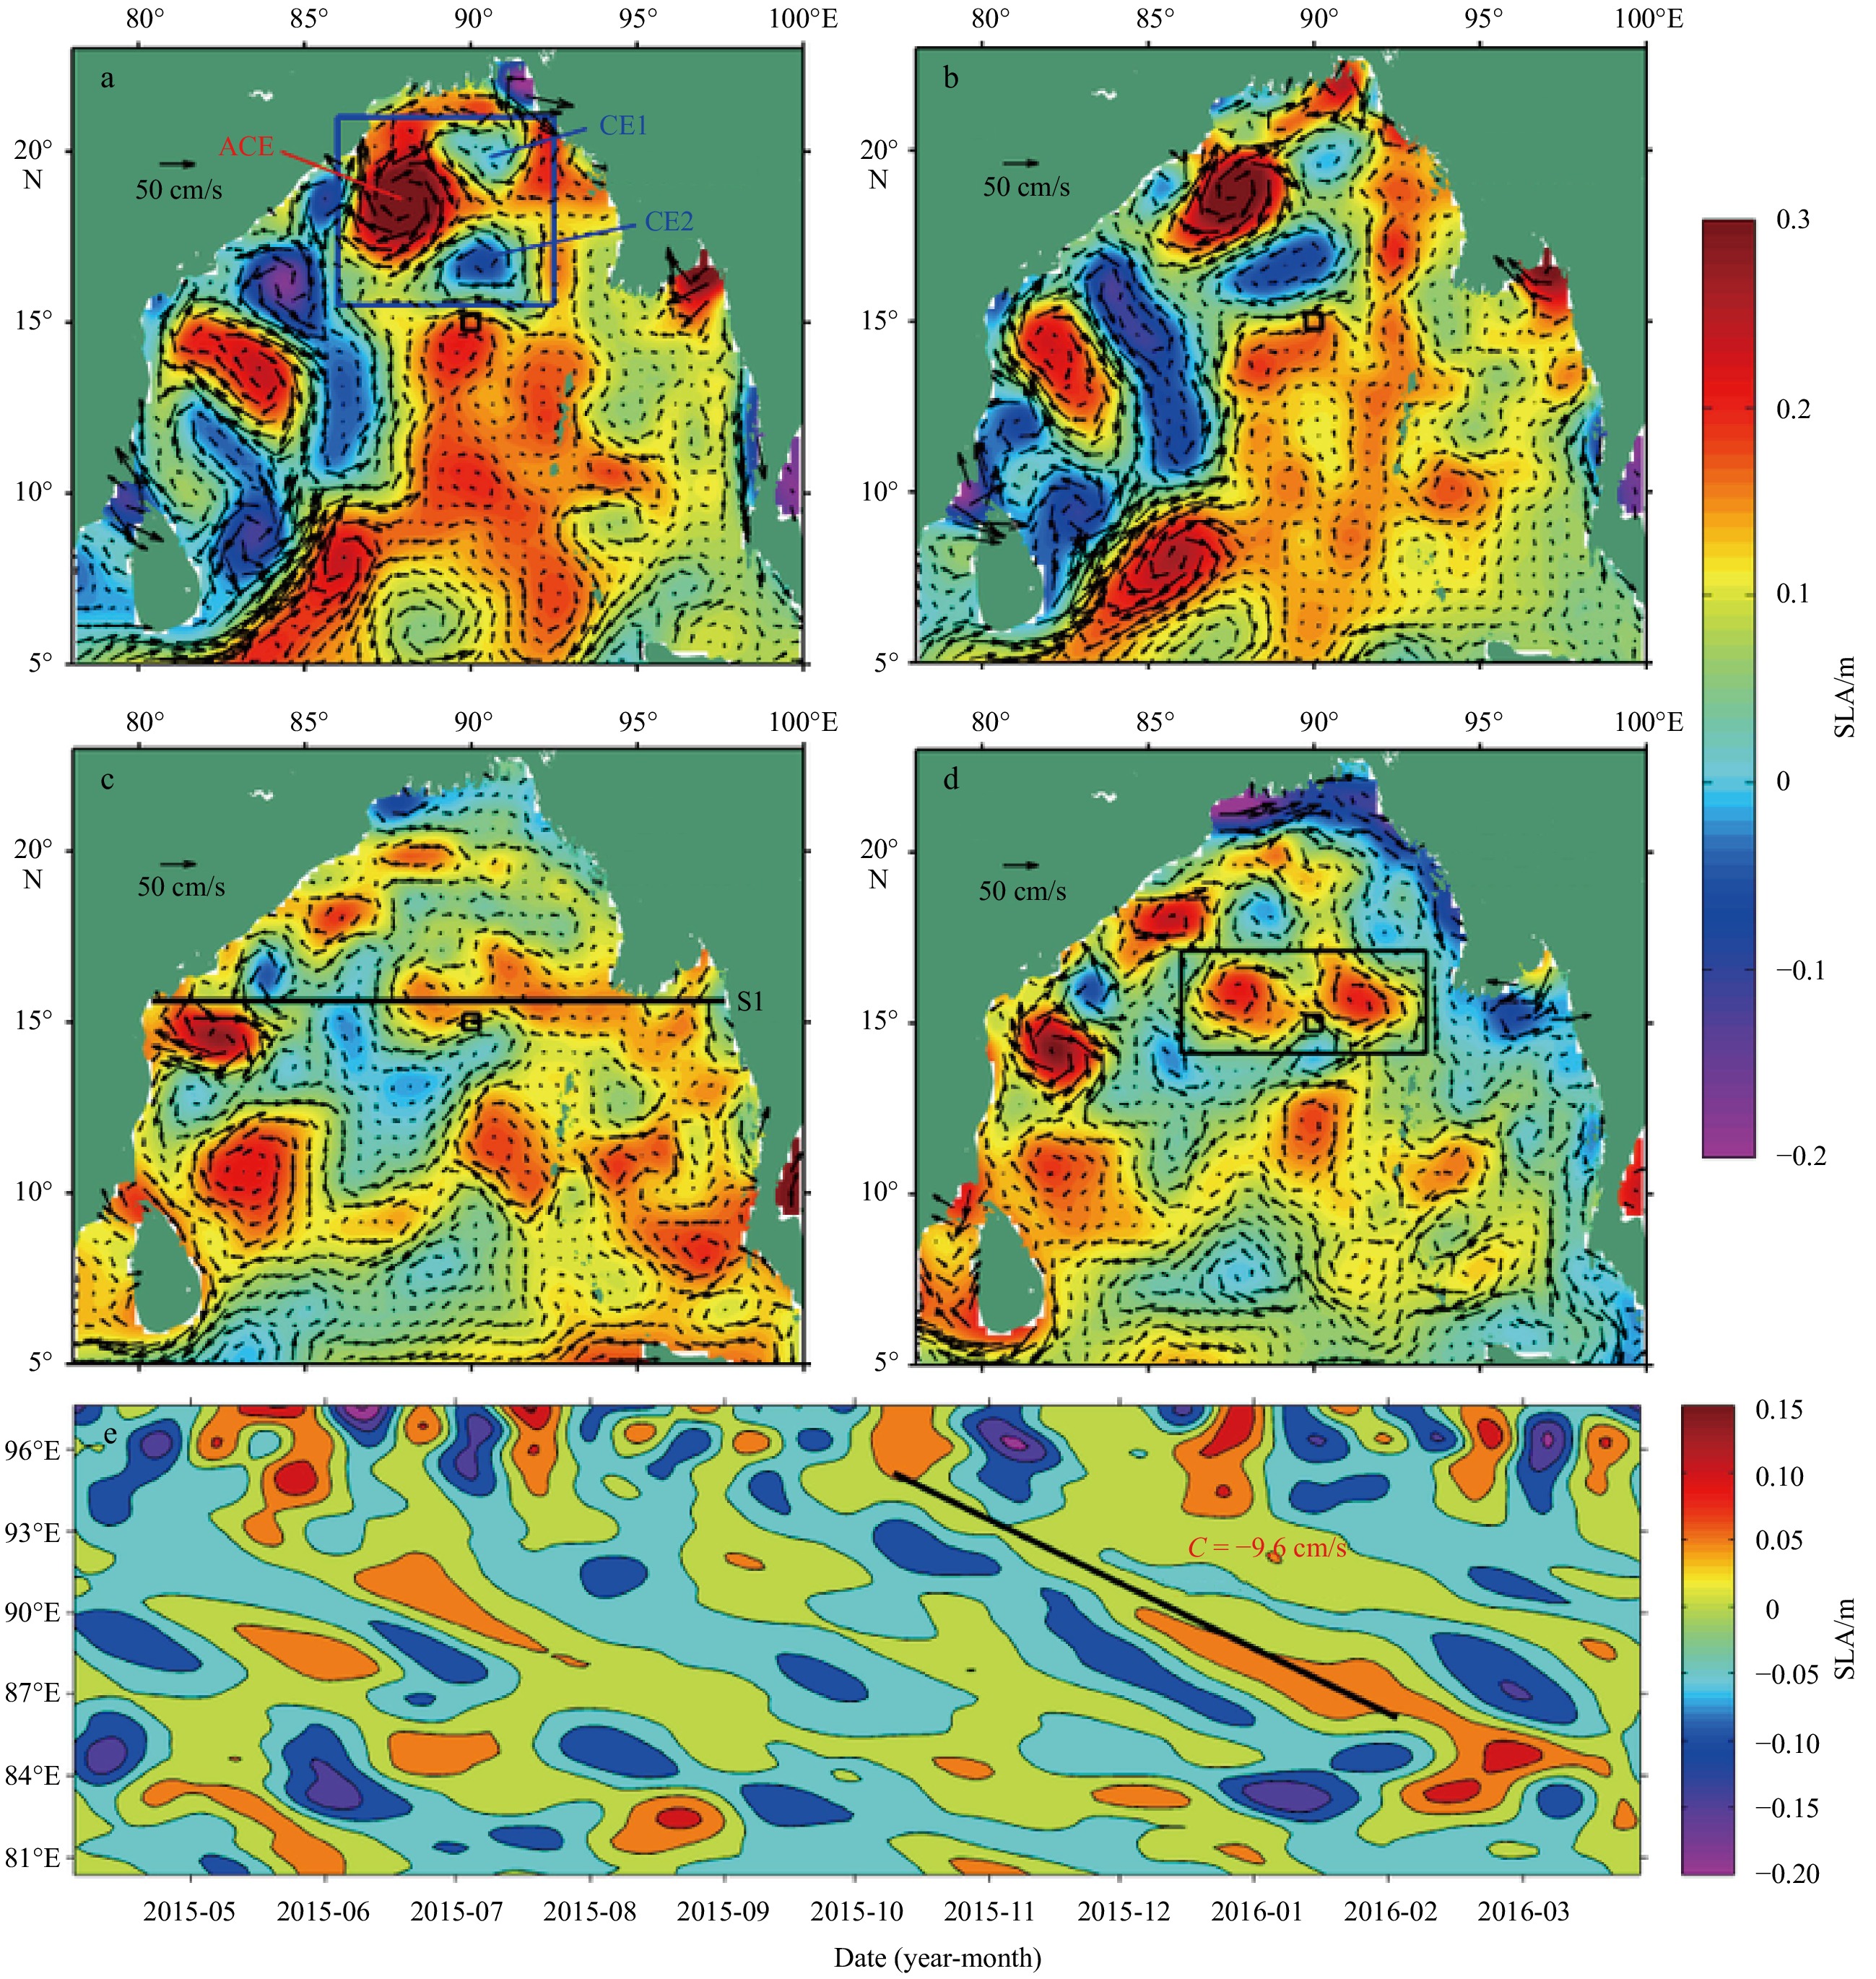
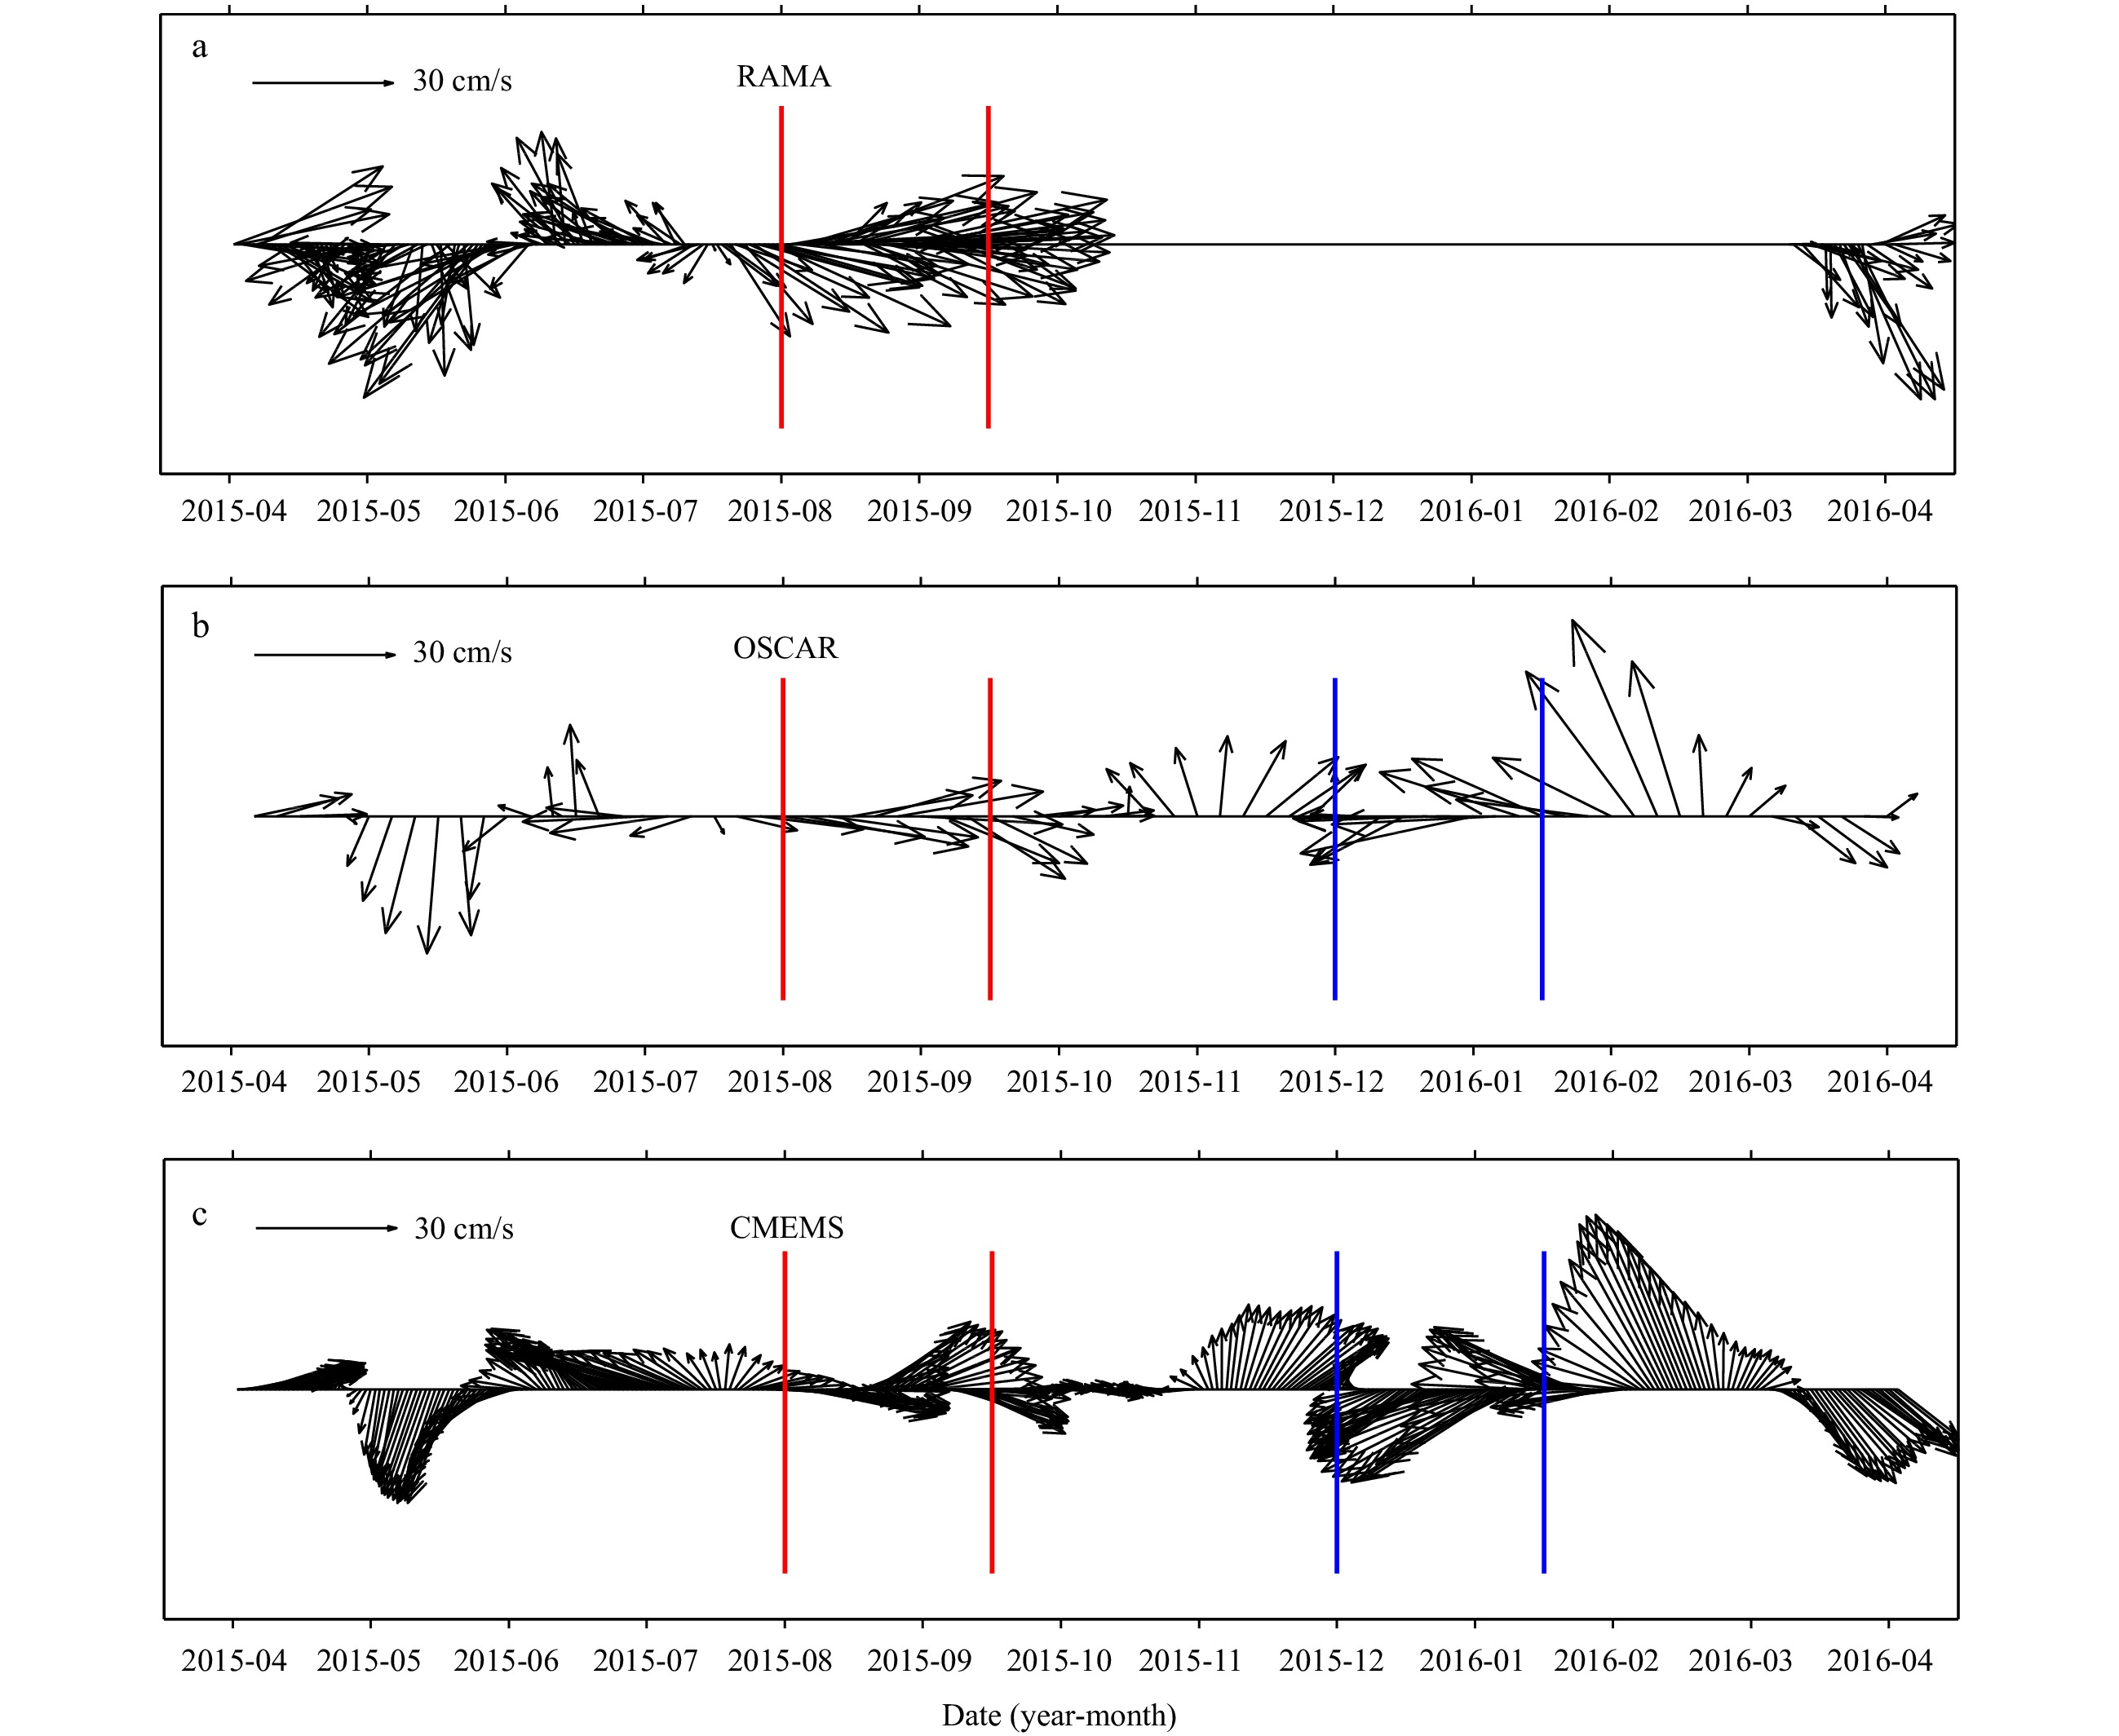
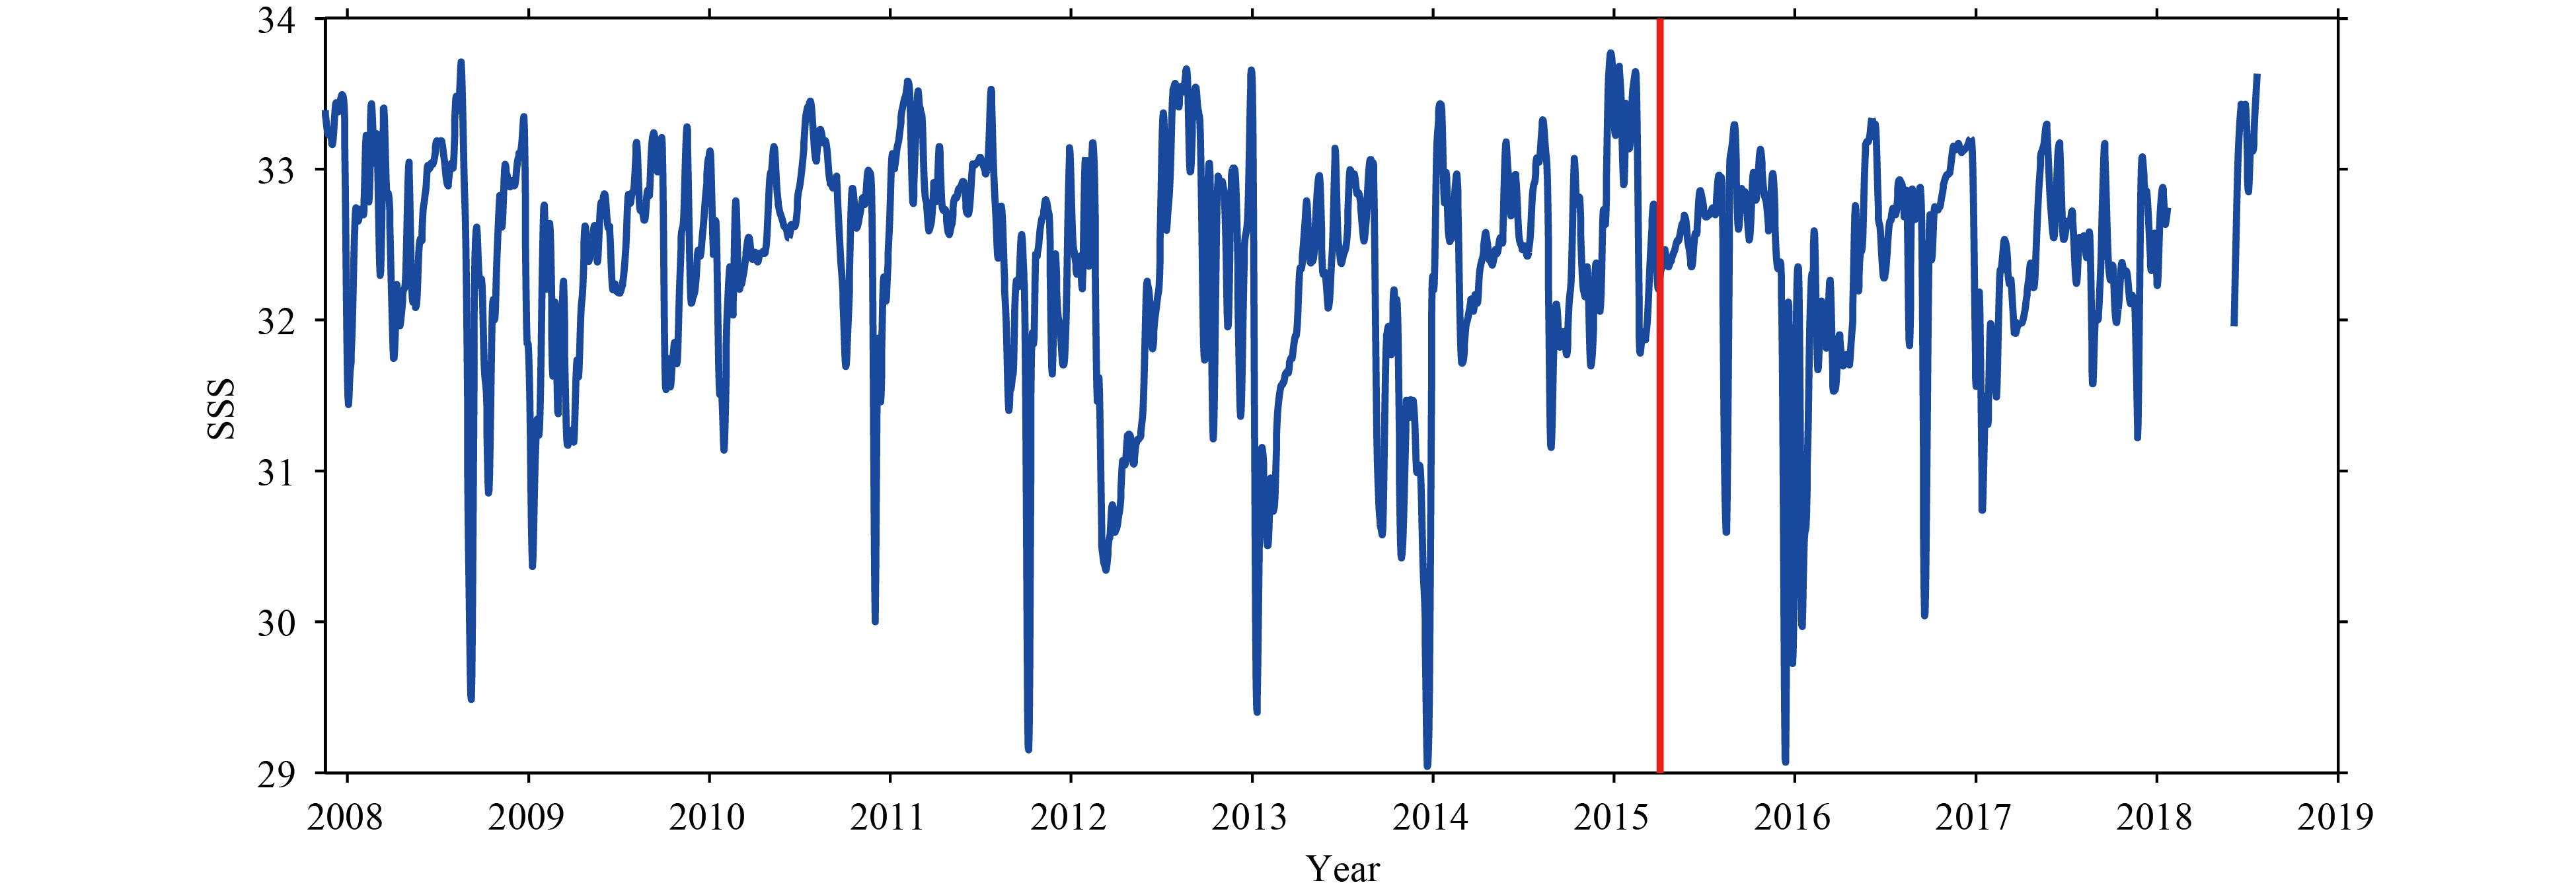
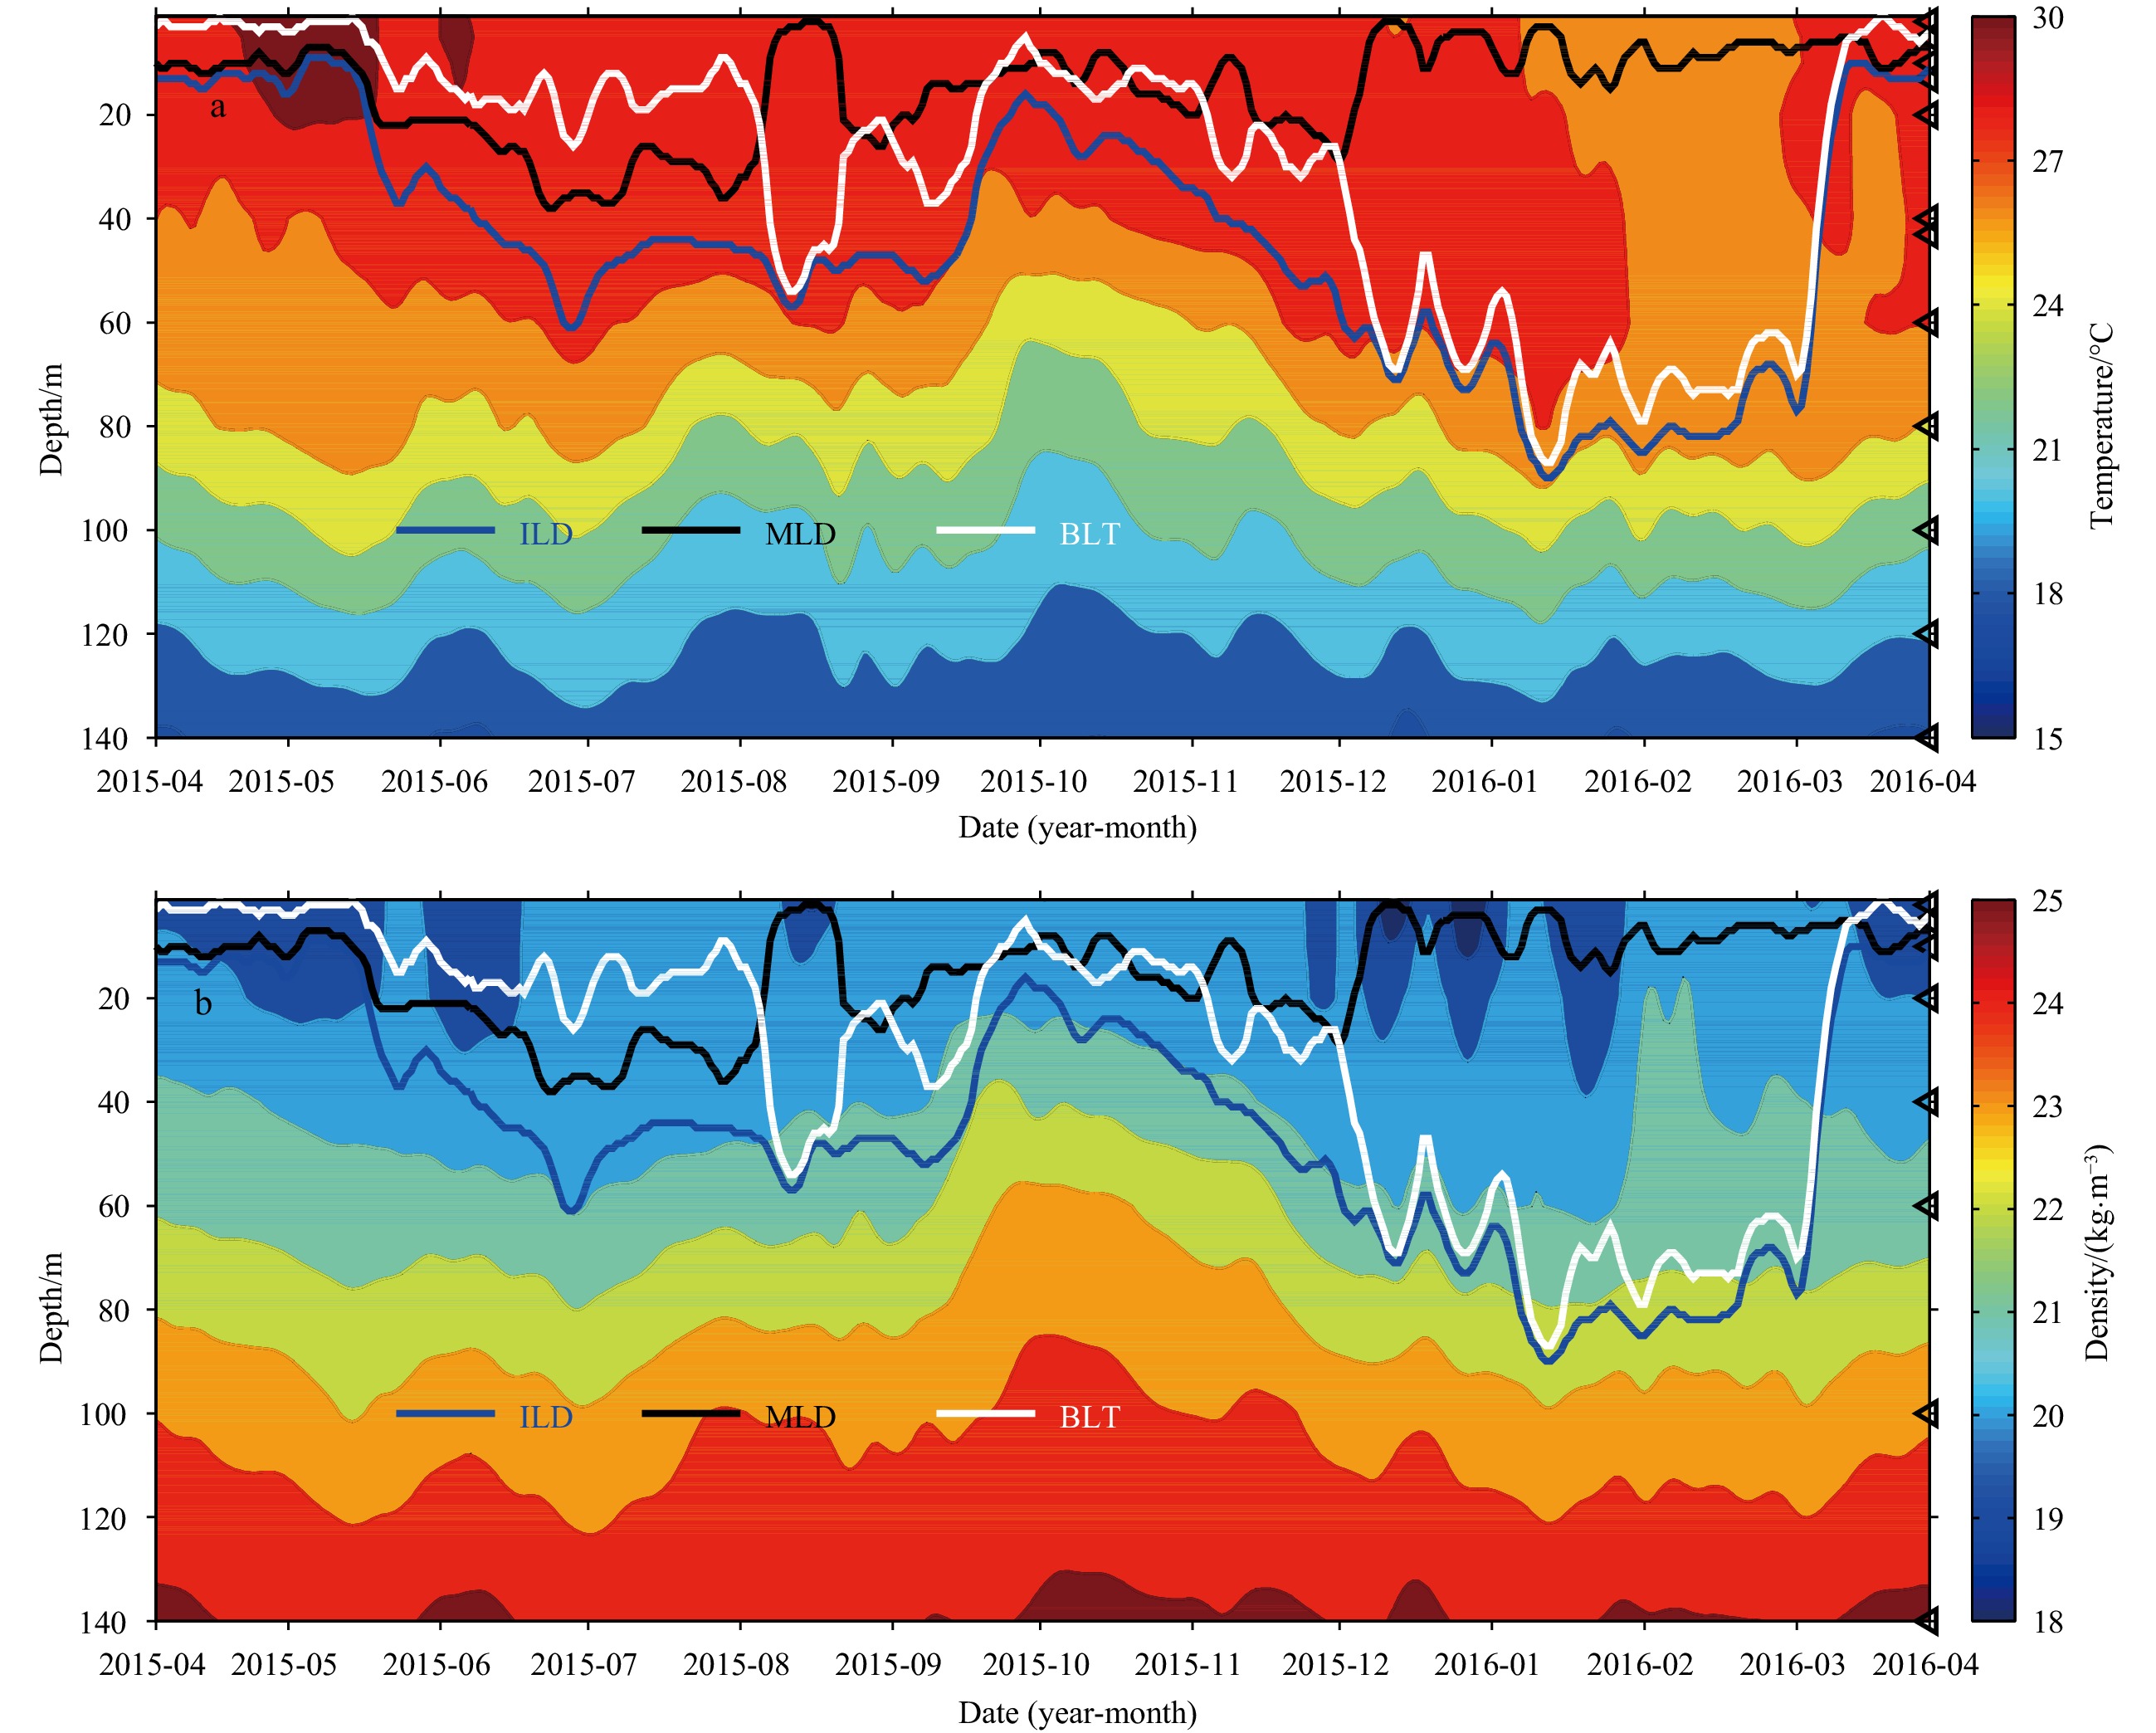
In this study, the short-term offshore extension of Brahmaputra-Ganges (BG) and Irrawaddy freshwater plumes to the central northern Bay of Bengal (BoB) was investigated based on in situ and satellite observations. In the summer and winter of 2015, two significant freshening events with periods of weeks were observed from a moored buoy at 15°N, 90°E in the BoB. Soil Moisture Active Passive (SMAP) satellite sea surface salinity compares well with the in situ data and shows that these freshening events are directly related to the short-term offshore extension of the BG and Irrawaddy freshwater, respectively. These data combined with the altimeter sea level anomaly data show that the offshore extending plumes result from freshwater modulated by eddies. During summer, the BG freshwater is modulated by a combination of three closely located eddies: a large anticyclonic eddy (ACE) off the northwestern BoB coast and two cyclonic eddies in the northern BoB. Consequently, the freshwater extends offshore from the river mouth and forms a long and narrow tongue-shaped plume extending southwestward to the central BoB. During winter, the Irrawaddy freshwater is modulated by two continuous ACEs evolved from Rossby wave propagating westward from the Irrawaddy Delta off Myanmar, forming a tongue-shaped plume extending to the central BoB. Strong salinity fronts are formed along the boundaries of these tongue-shaped plumes. These findings confirm good capability of the SMAP data to investigate the short-term offshore extension of the BG and Irrawaddy freshwater. This study provides direct evidences of the pathways of the offshore extension of the BG and Irrawaddy freshwater and highlights the role of eddies in the northern BoB freshwater plume variability.
Marine Geology
Variations in melt supply along an orthogonal supersegment of the Southwest Indian Ridge (16°–25°E)
Caicai Zha, Jian Lin, Zhiyuan Zhou, Xubo Zhang, Min Xu, Fan Zhang
2021, 40(5): 94-104. doi: 10.1007/s13131-021-1724-3
Abstract:
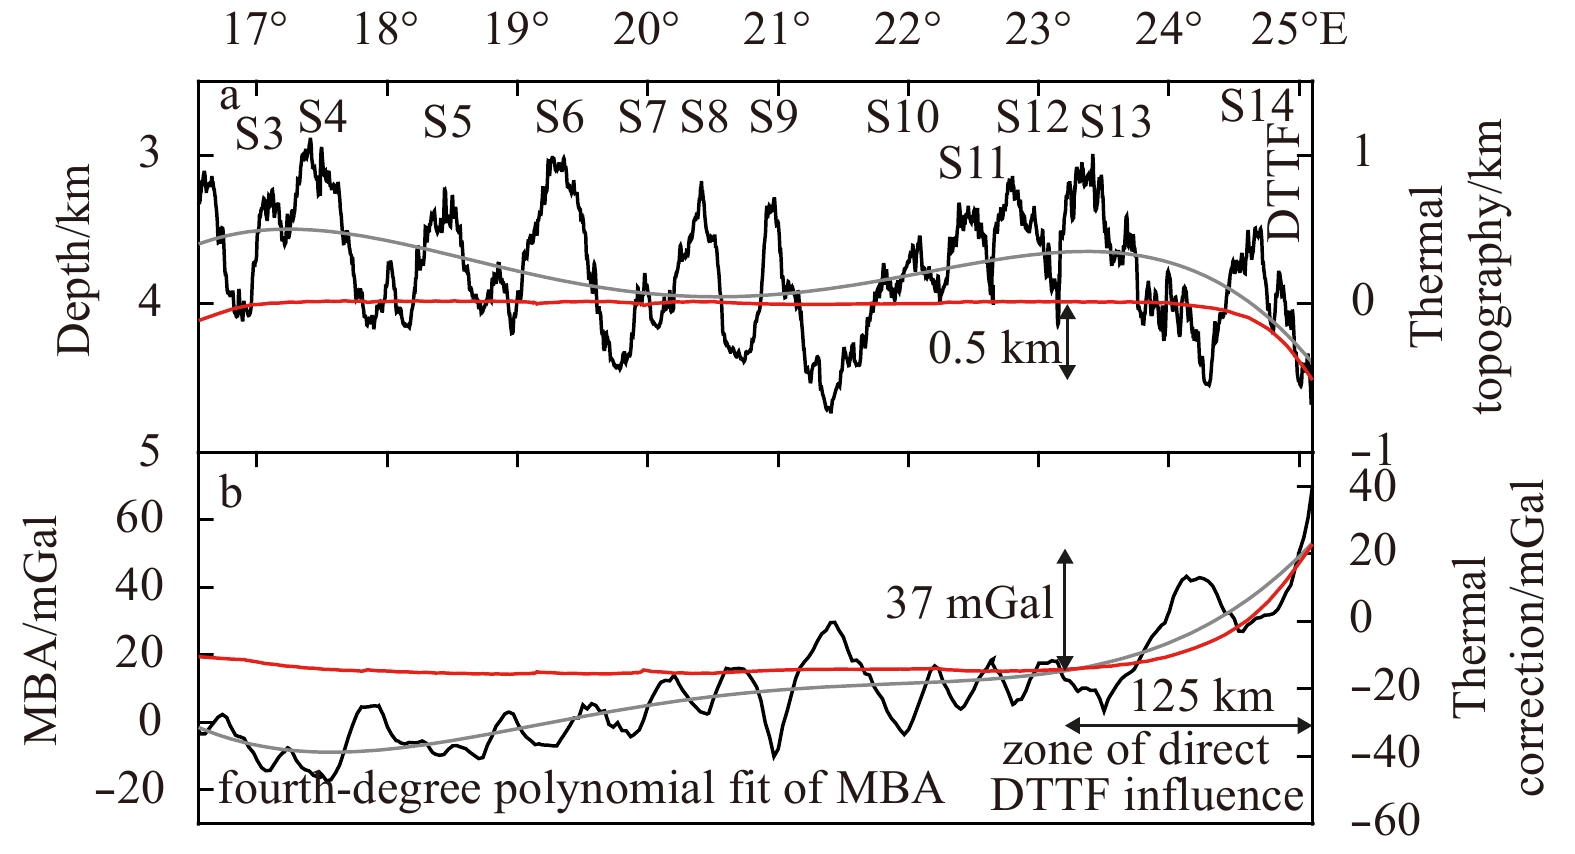
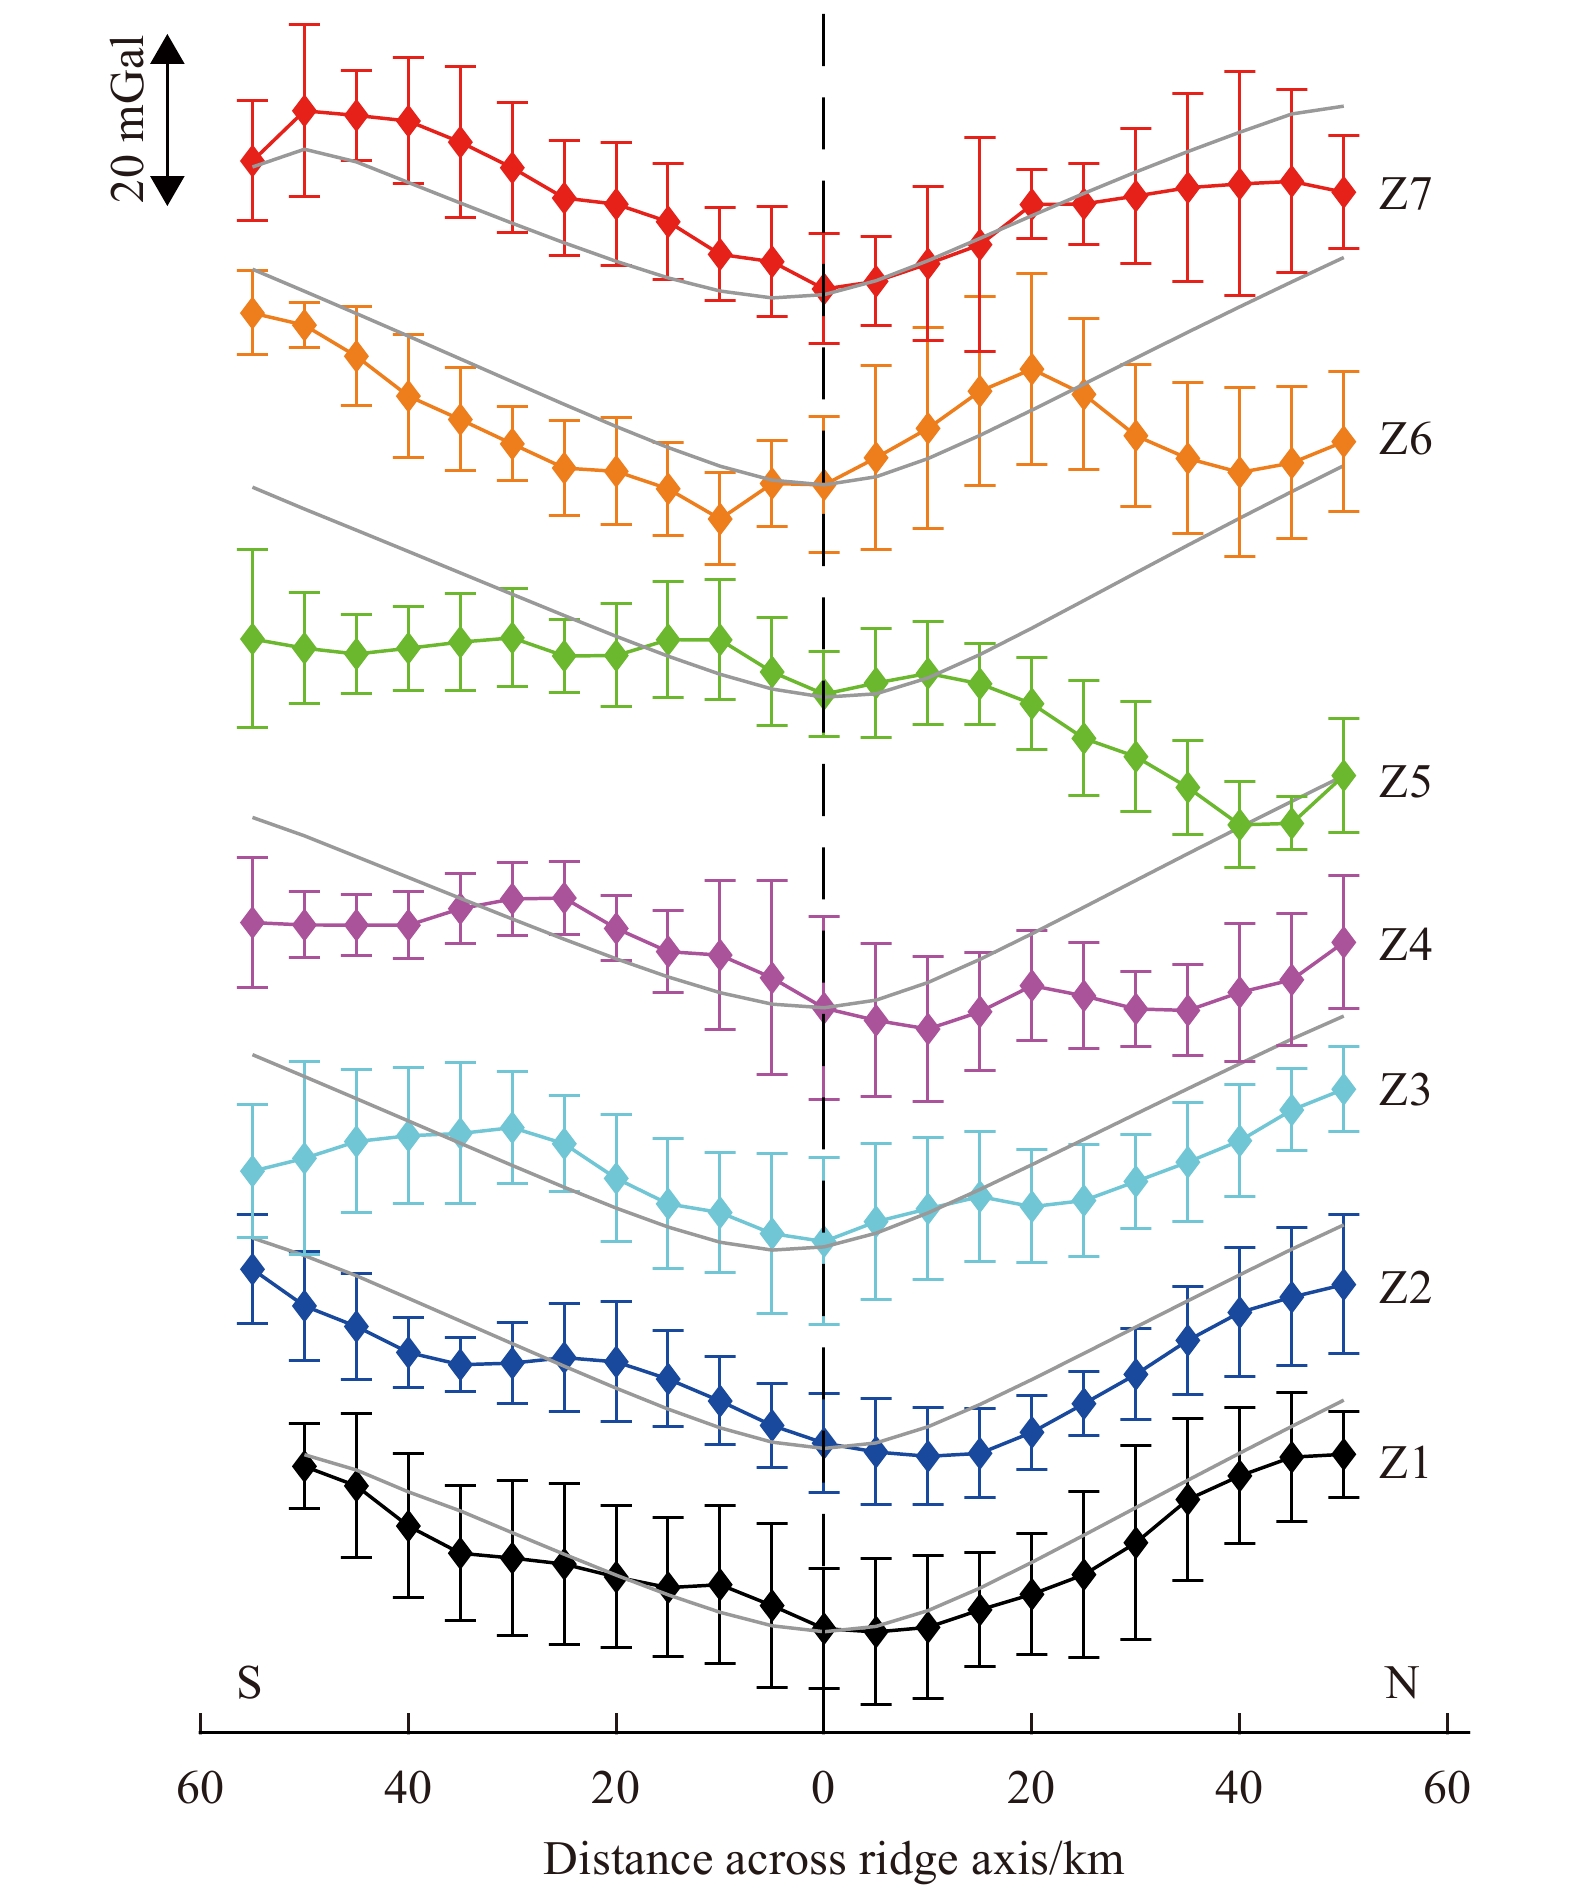
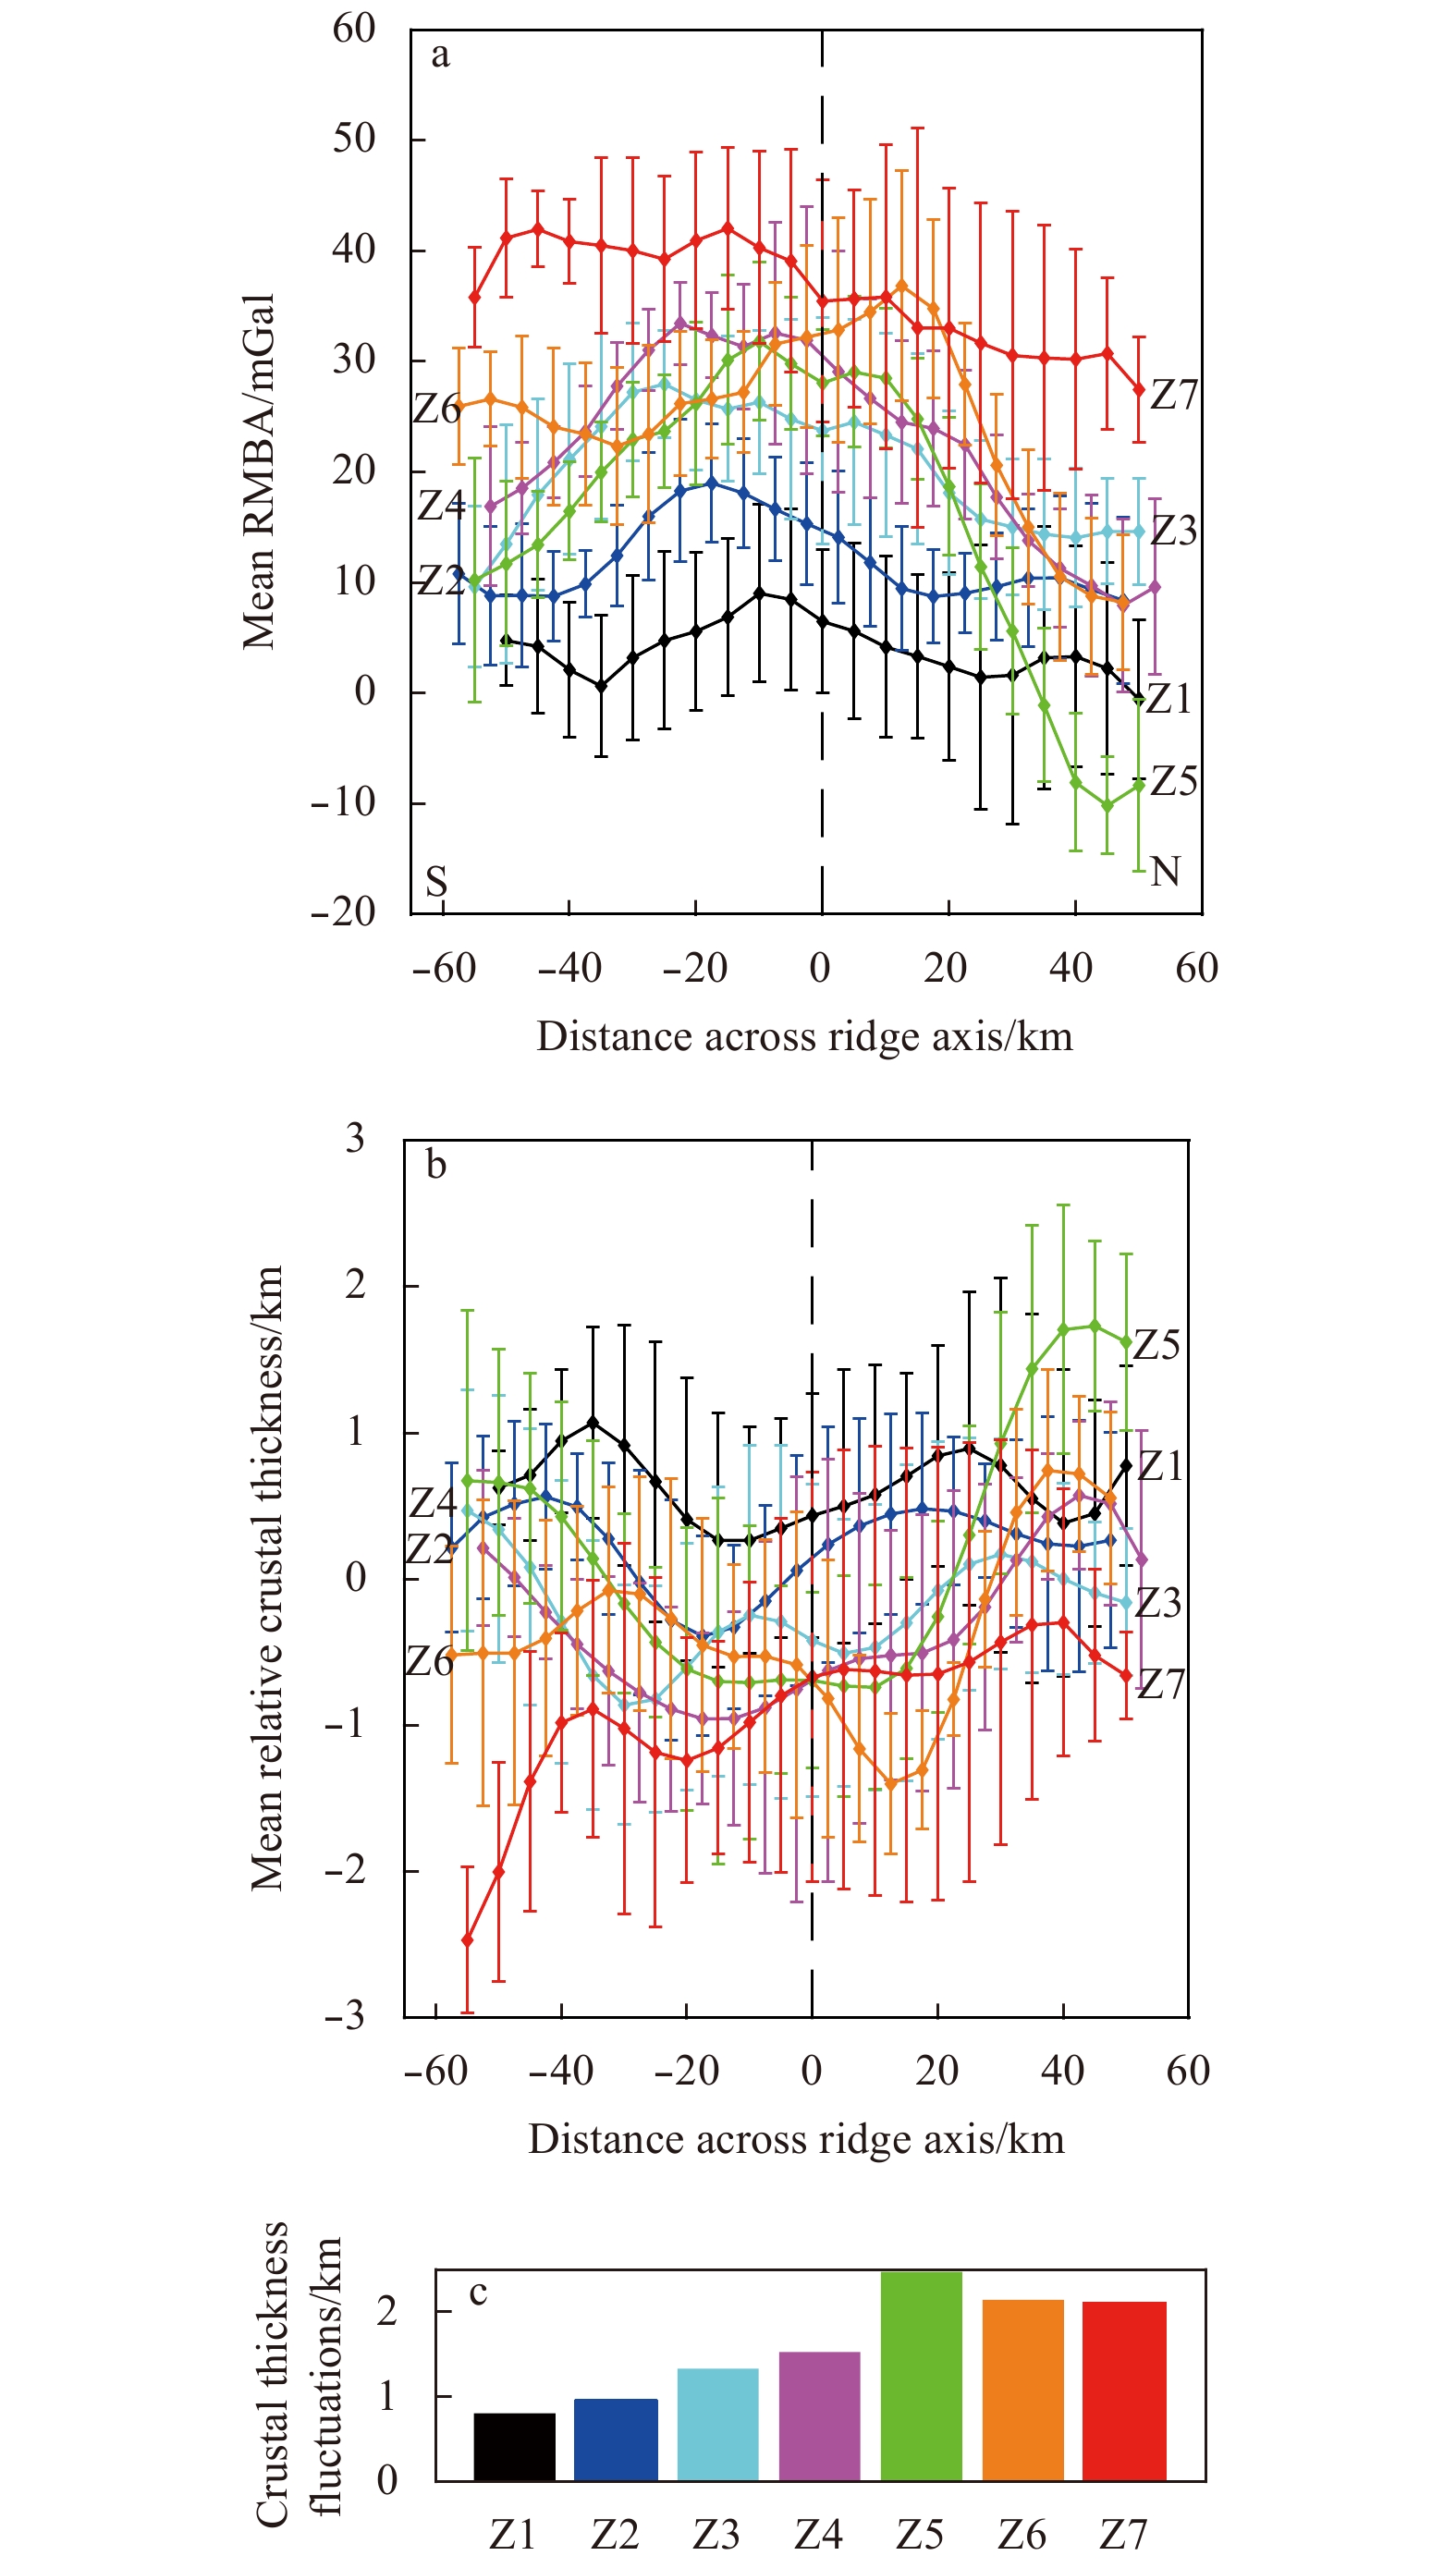
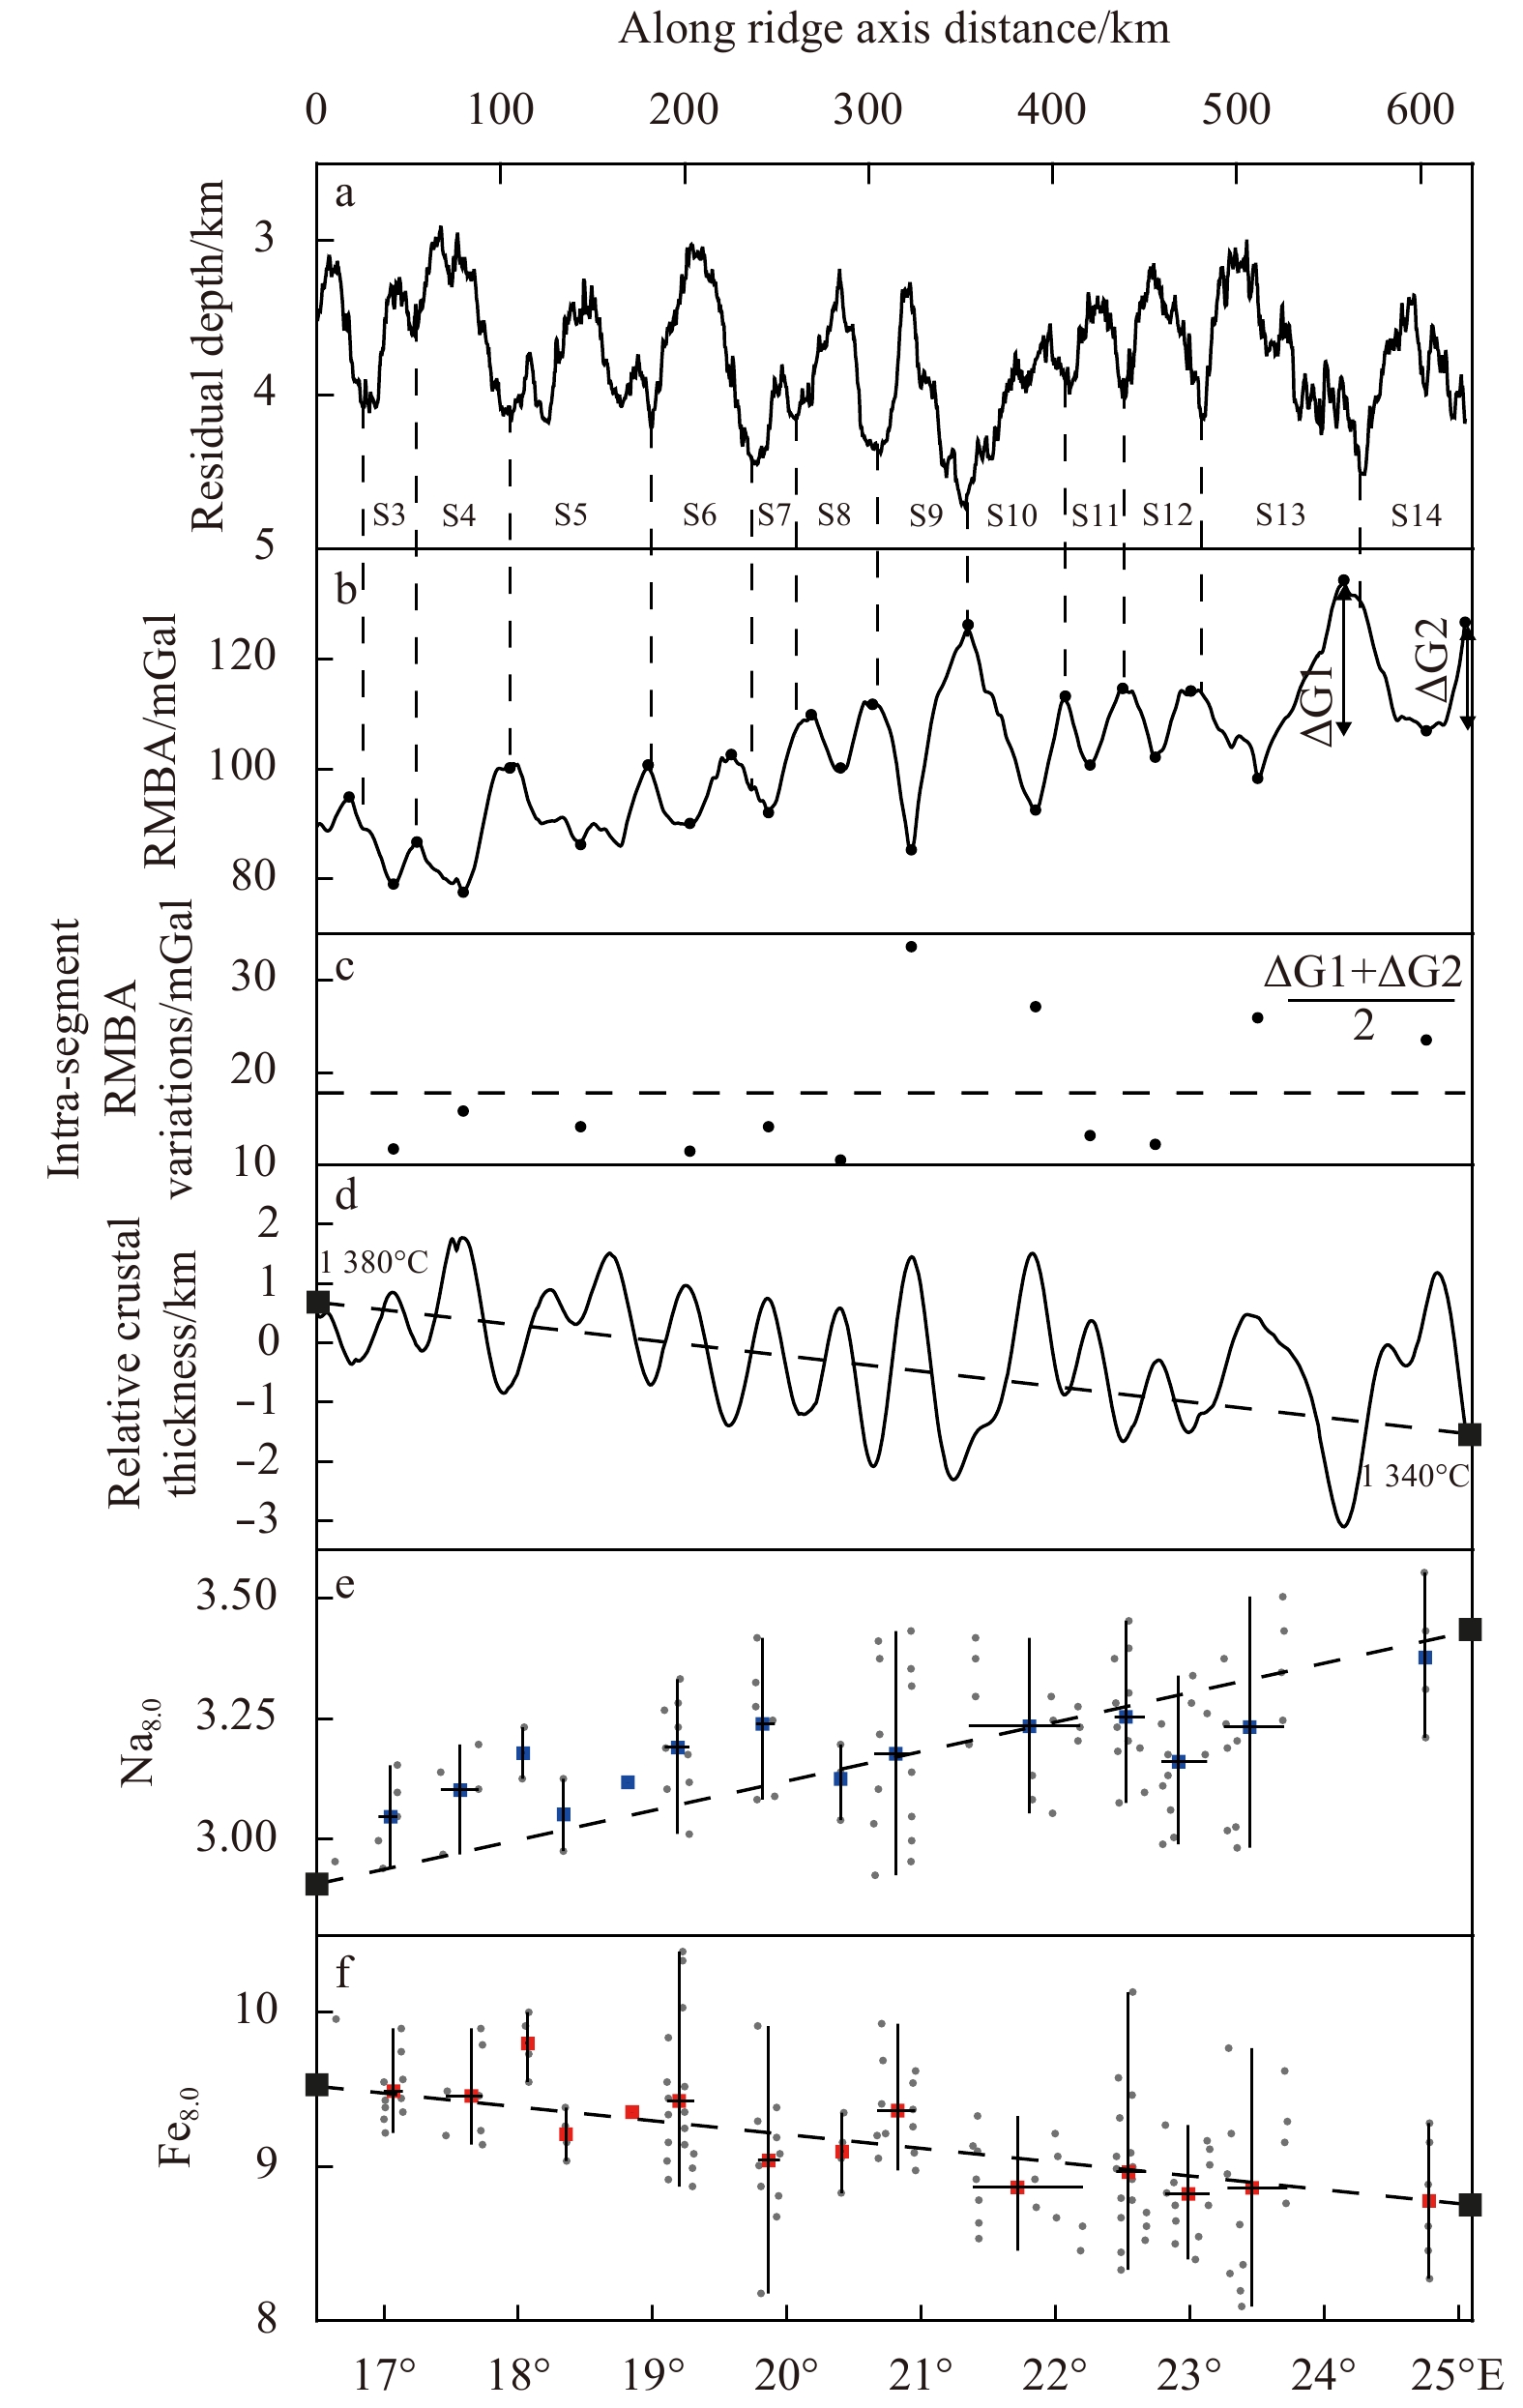
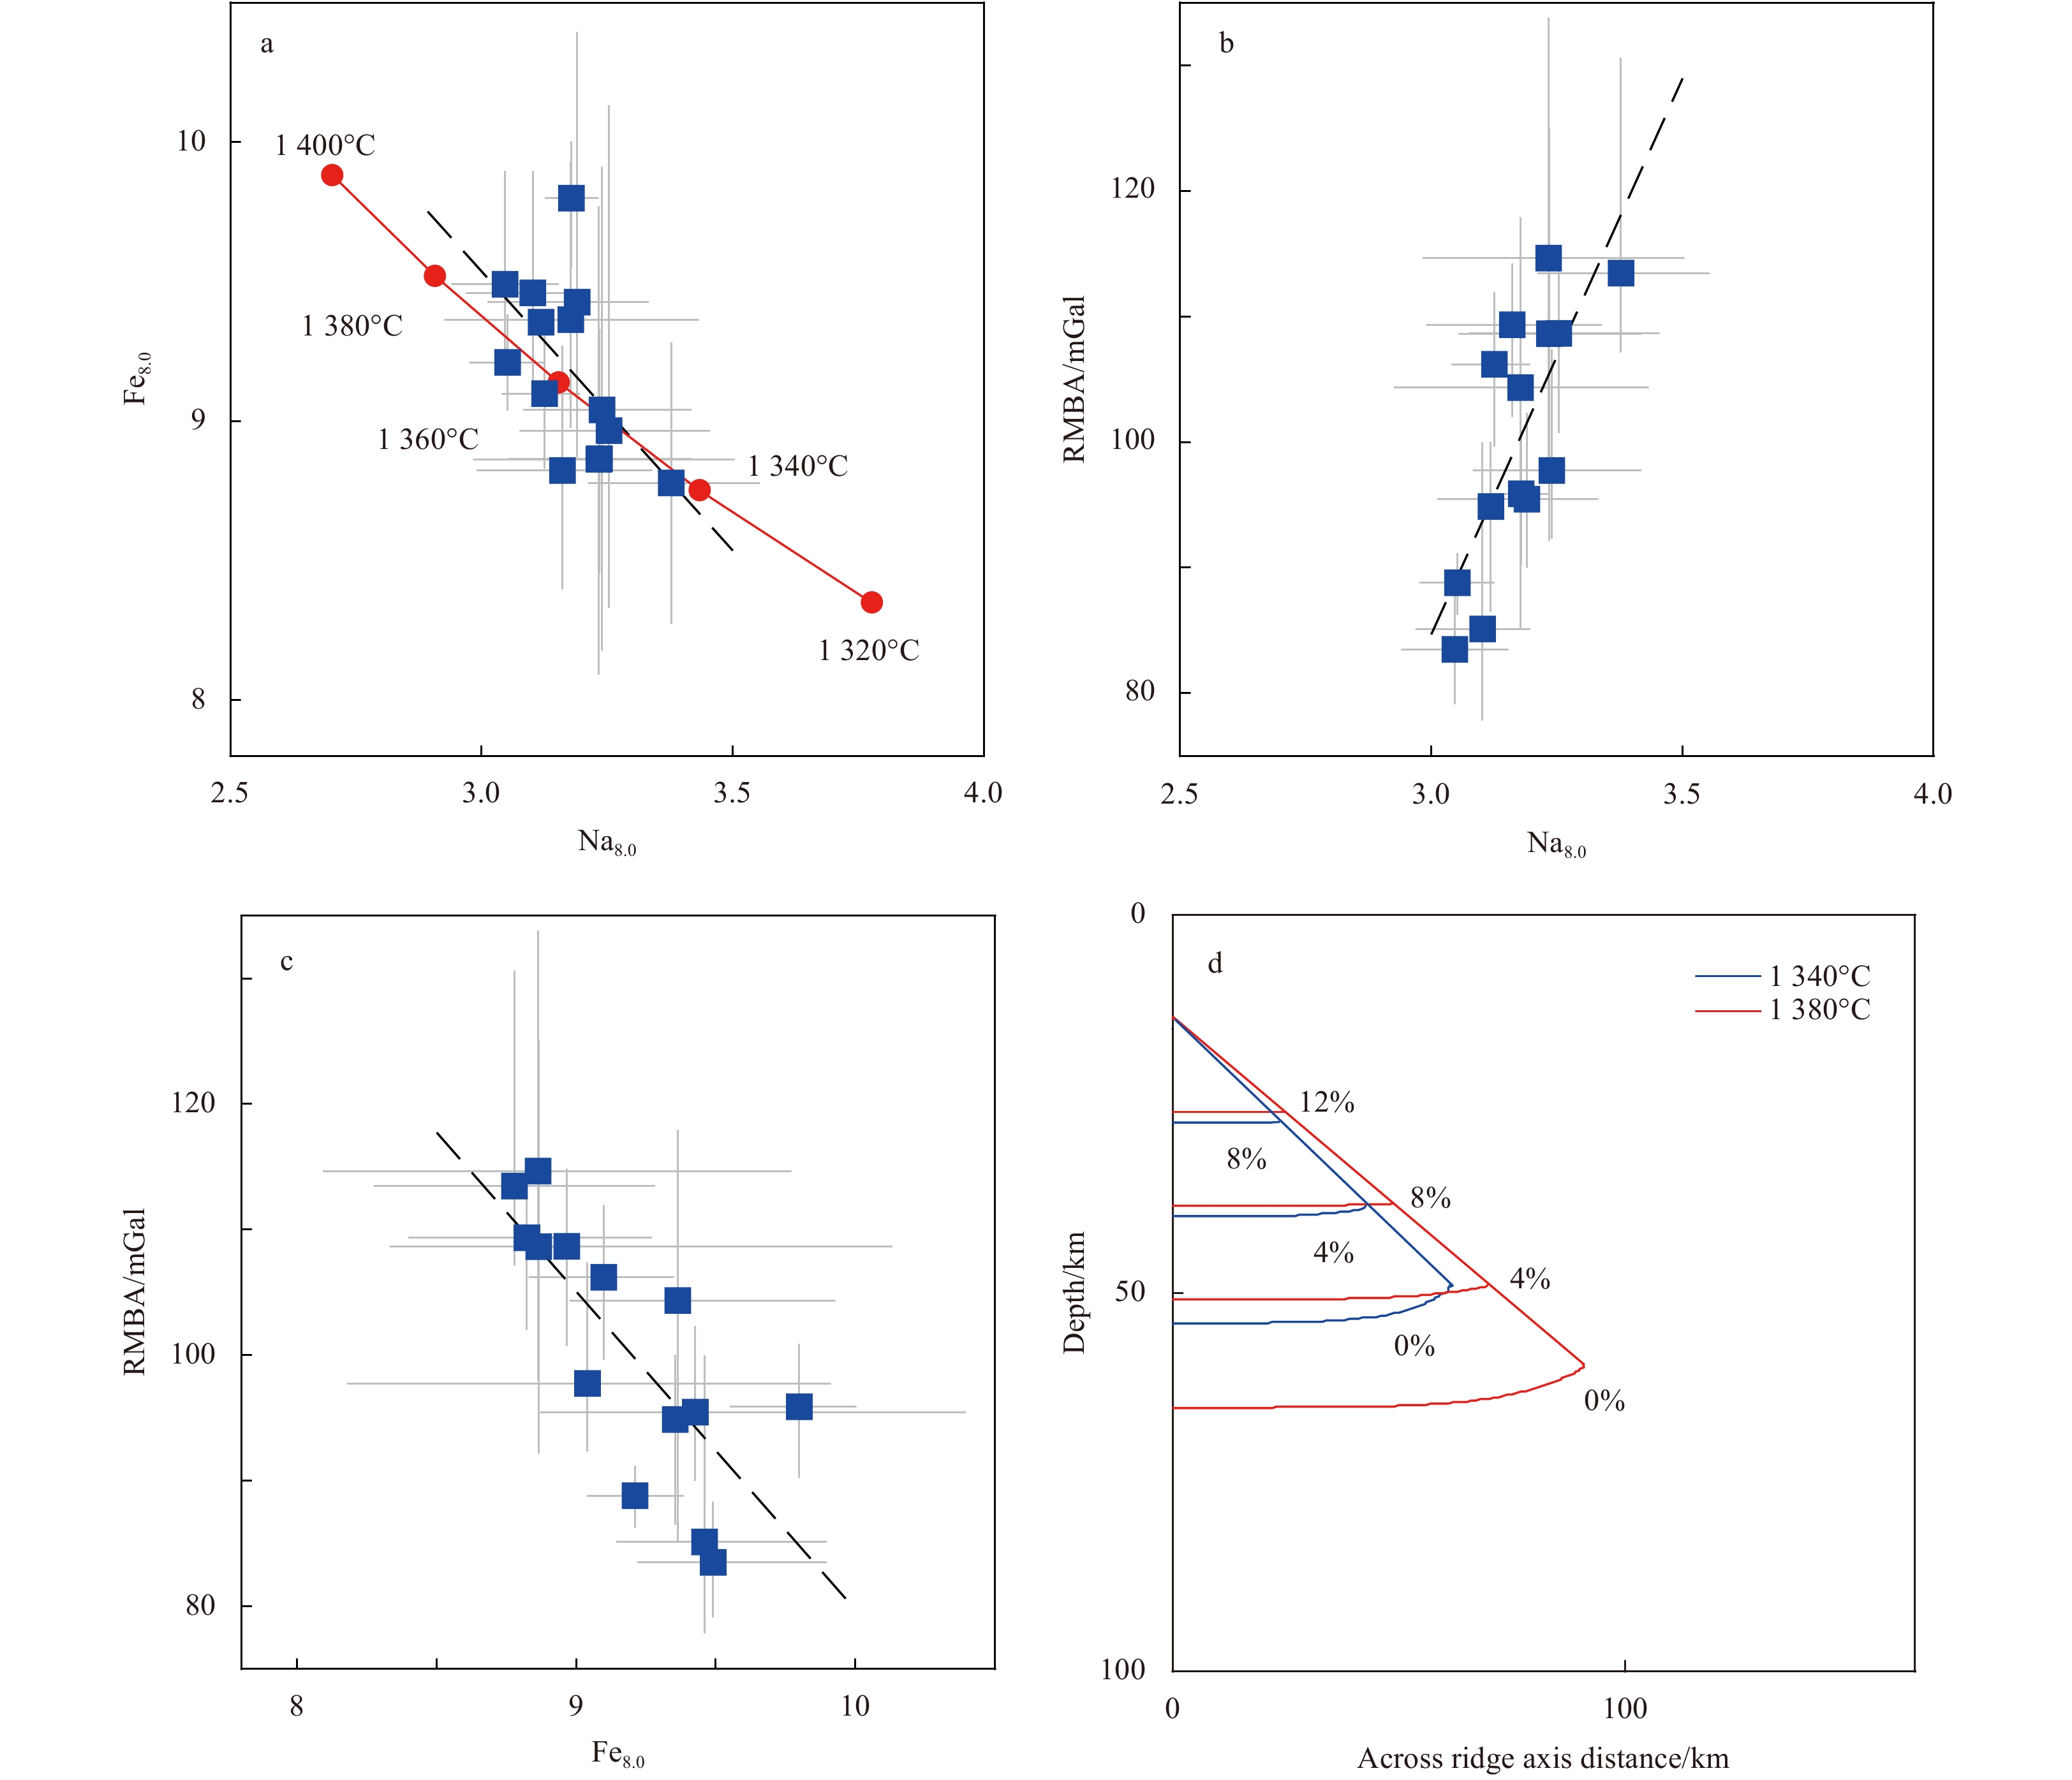
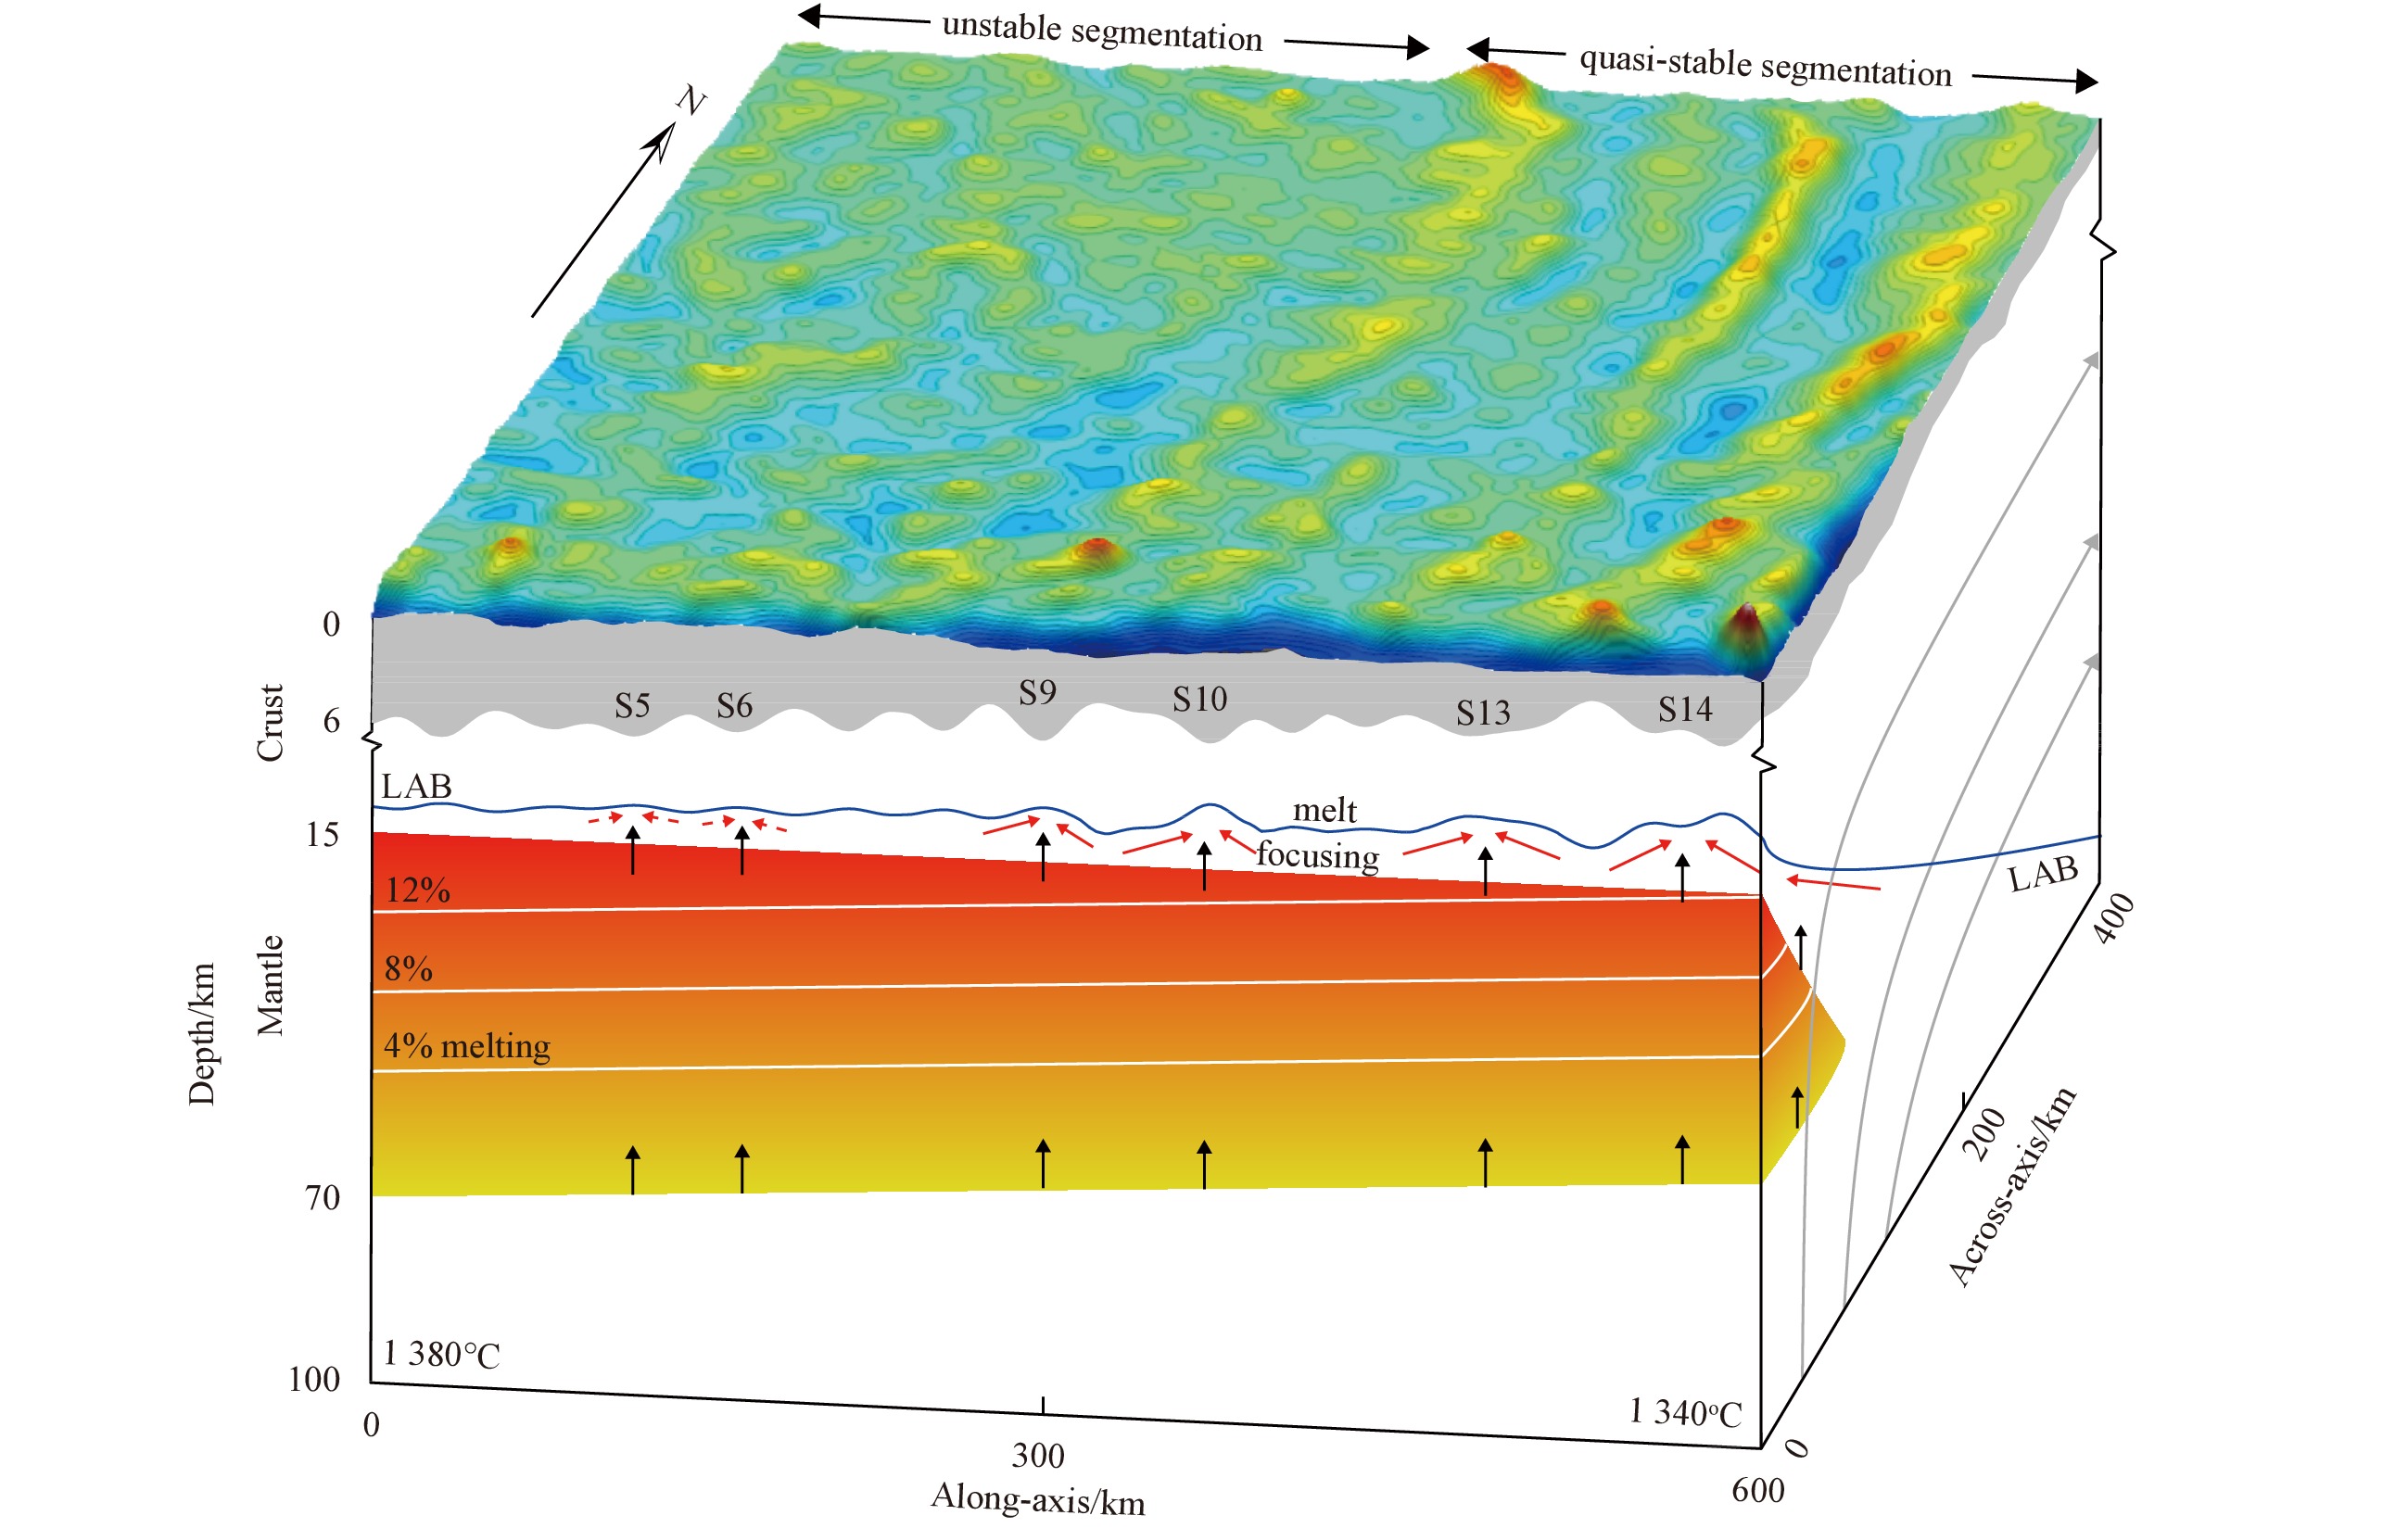
The orthogonal supersegment of the ultraslow-spreading Southwest Indian Ridge at 16°–25°E is characterized by significant along-axis variations of mantle potential temperature. A detailed analysis of multibeam bathymetry, gravity, and magnetic data were performed to investigate its variations in magma supply and crustal accretion process. The results revealed distinct across-axis variations of magma supply. Specifically, the regionally averaged crustal thickness reduced systematically from around 7 Ma to the present, indicating a regionally decreasing magma supply. The crustal structure is asymmetric in regional scale between the conjugate ridge flanks, with the faster-spreading southern flank showing thinner crust and greater degree of tectonic extension. Geodynamic models of mantle melting suggested that the observed variations in axial crustal thickness and major element geochemistry can be adequately explained by an eastward decrease in mantle potential temperature of about 40°C beneath the ridge axis. In this work, a synthesized model was proposed to explain the axial variations of magma supply and ridge segmentation stabilities. The existence of large ridge-axis offsets may play important roles in controlling melt supply. Several large ridge-axis offsets in the eastern section (21°–25°E) caused sustained along-axis focusing of magma supply at the centers of eastern ridge segments, enabling quasi-stable segmentation. In contrast, the western section (16°–21°E), which lacks large ridge-axis offsets, is associated with unstable segmentation patterns.
Distal axis sulfide mineralization on the ultraslow-spreading Southwest Indian Ridge: an LA-ICP-MS study of pyrite from the East Longjing-2 hydrothermal field
Shili Liao, Chuanwei Zhu, Jianping Zhou, Weiyong Liu, Junyu Yu, Jin Liang, Weifang Yang, Wei Li, Jia Liu, Chunhui Tao
2021, 40(5): 105-113. doi: 10.1007/s13131-020-1681-2
Abstract:
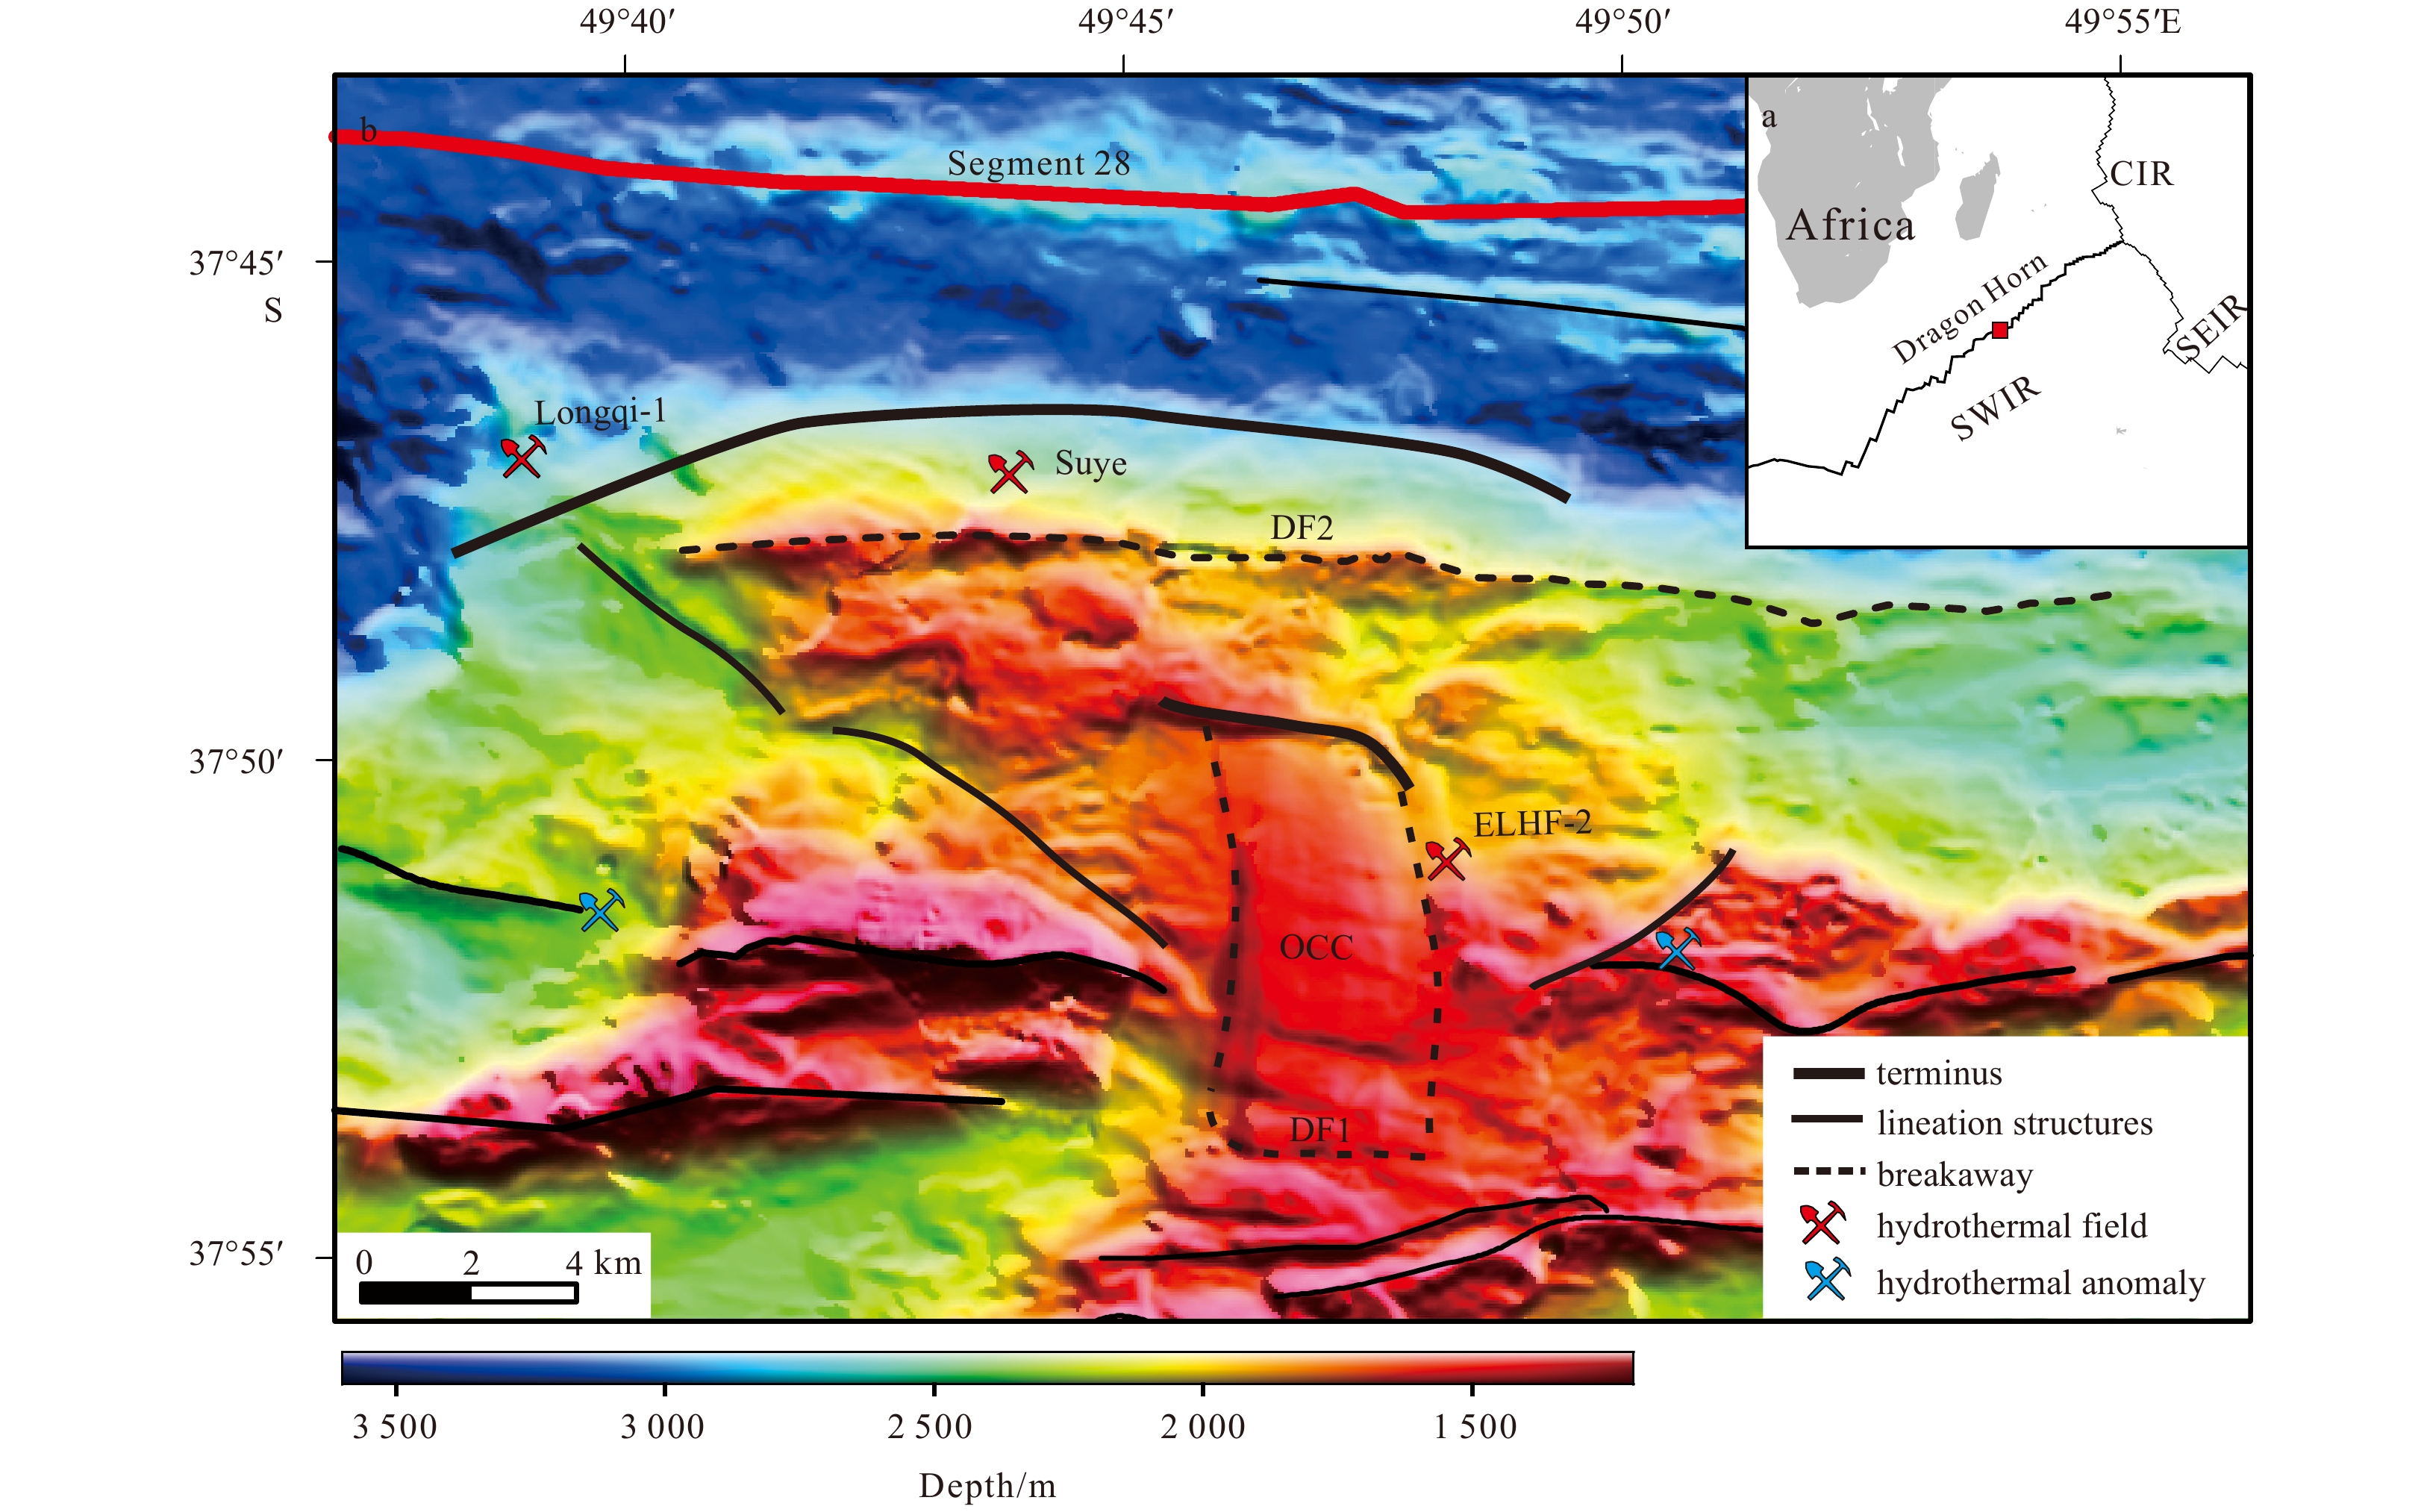
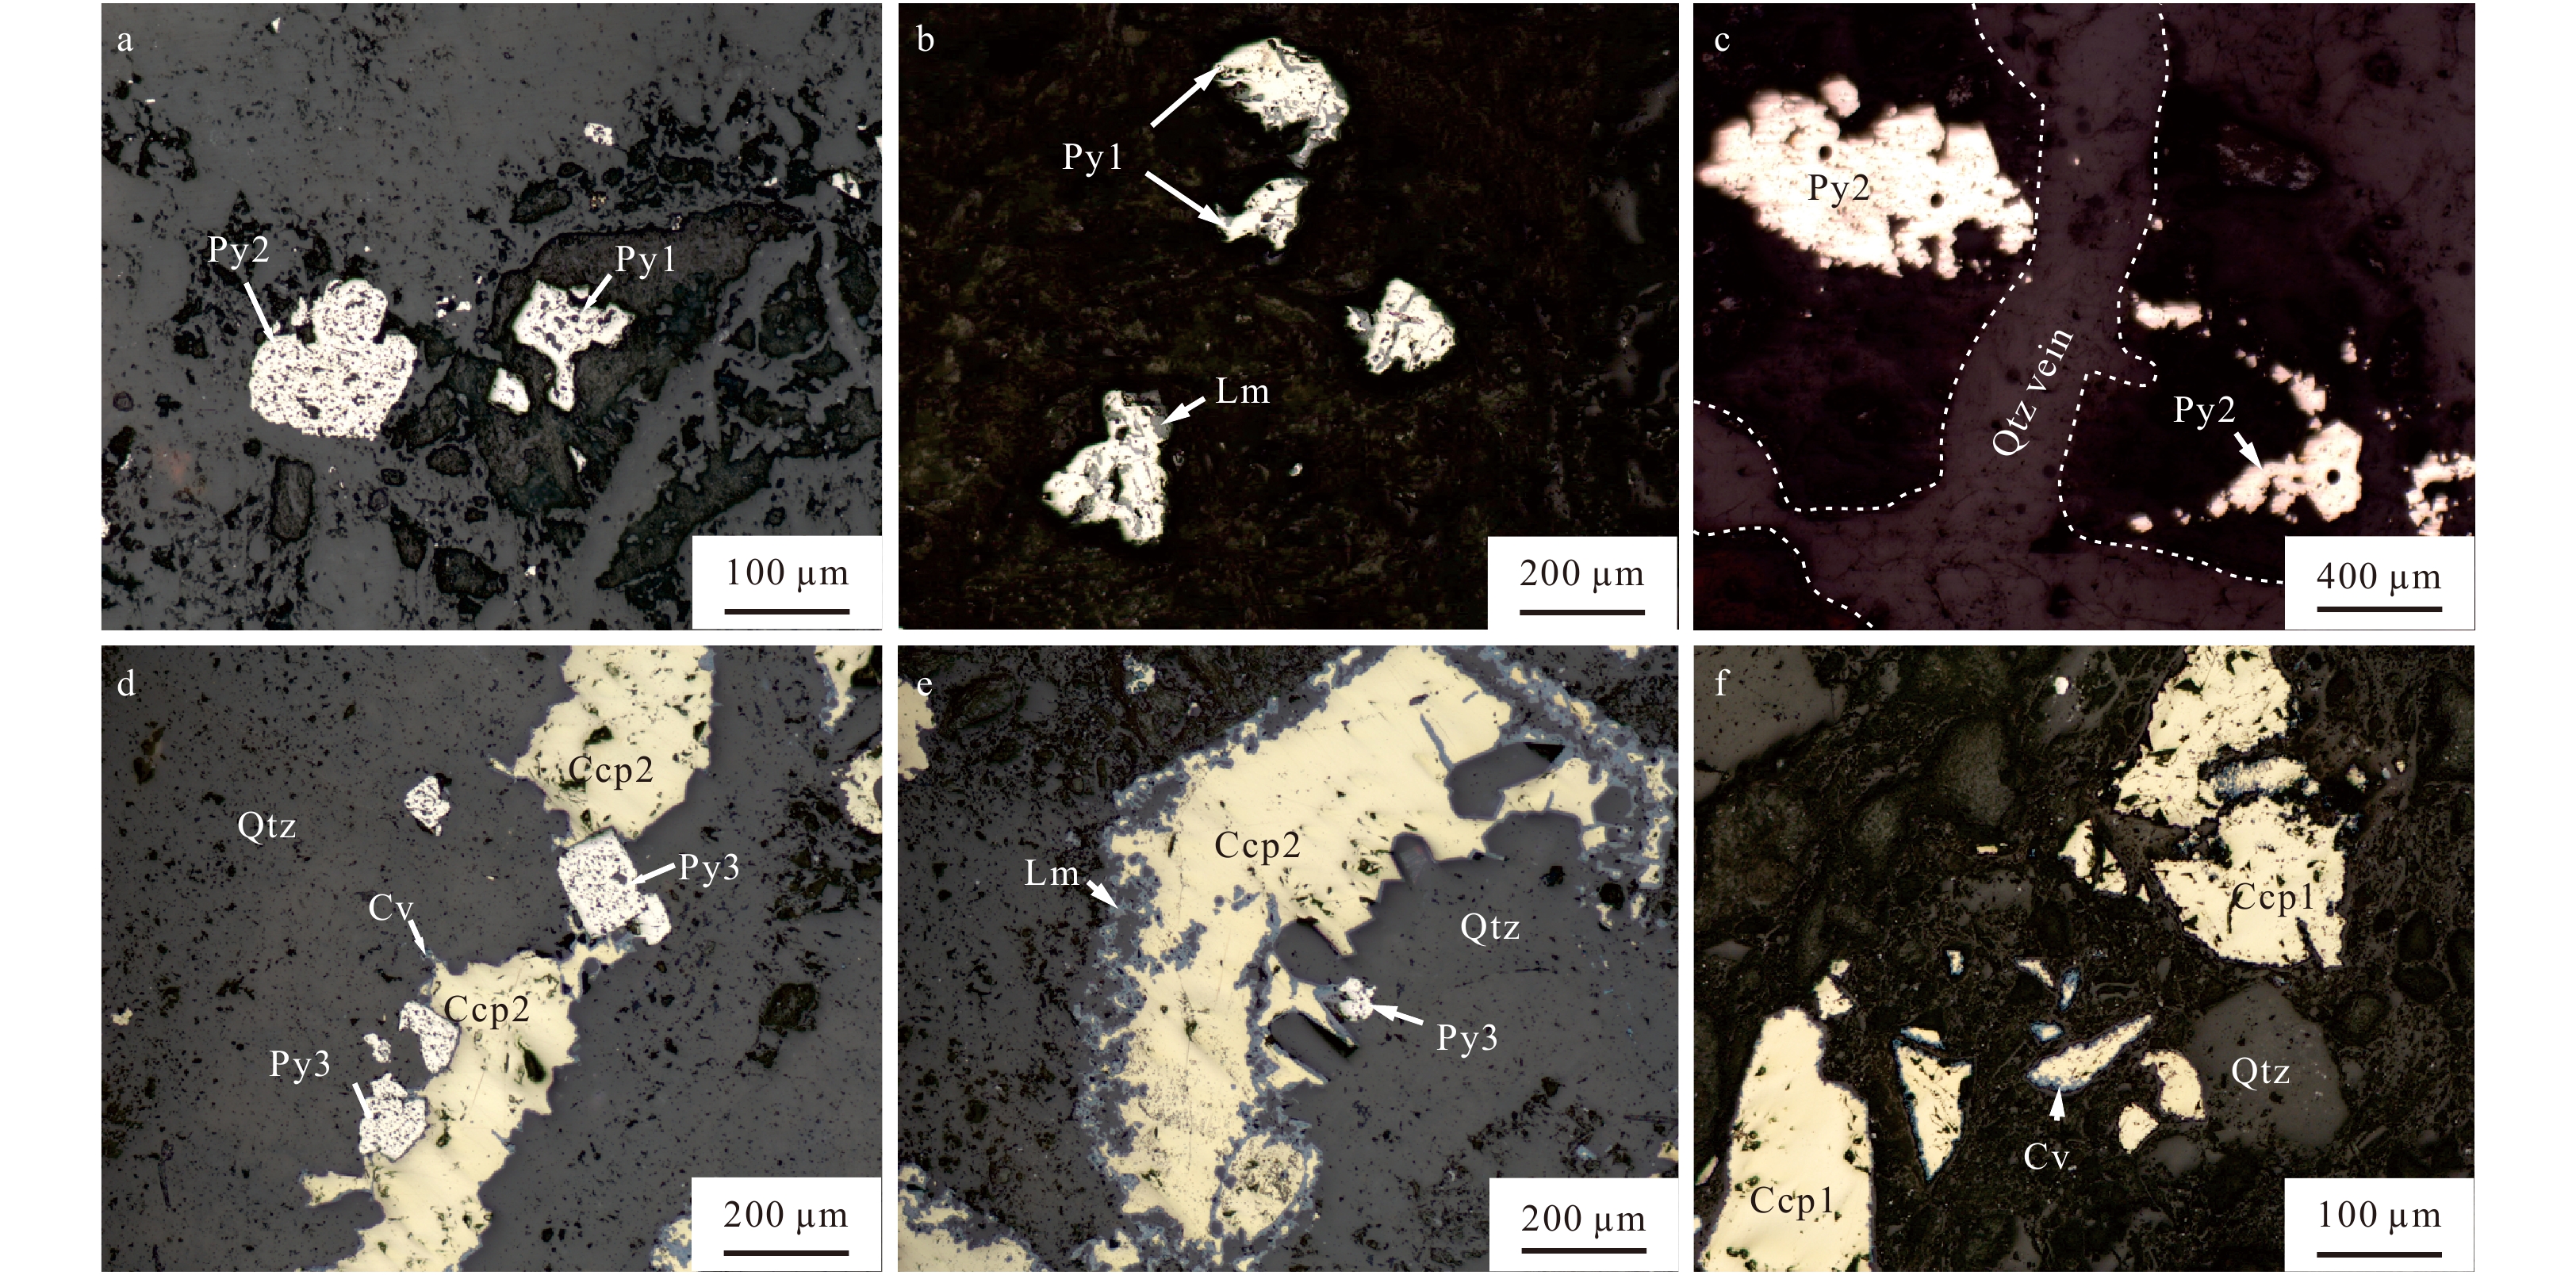
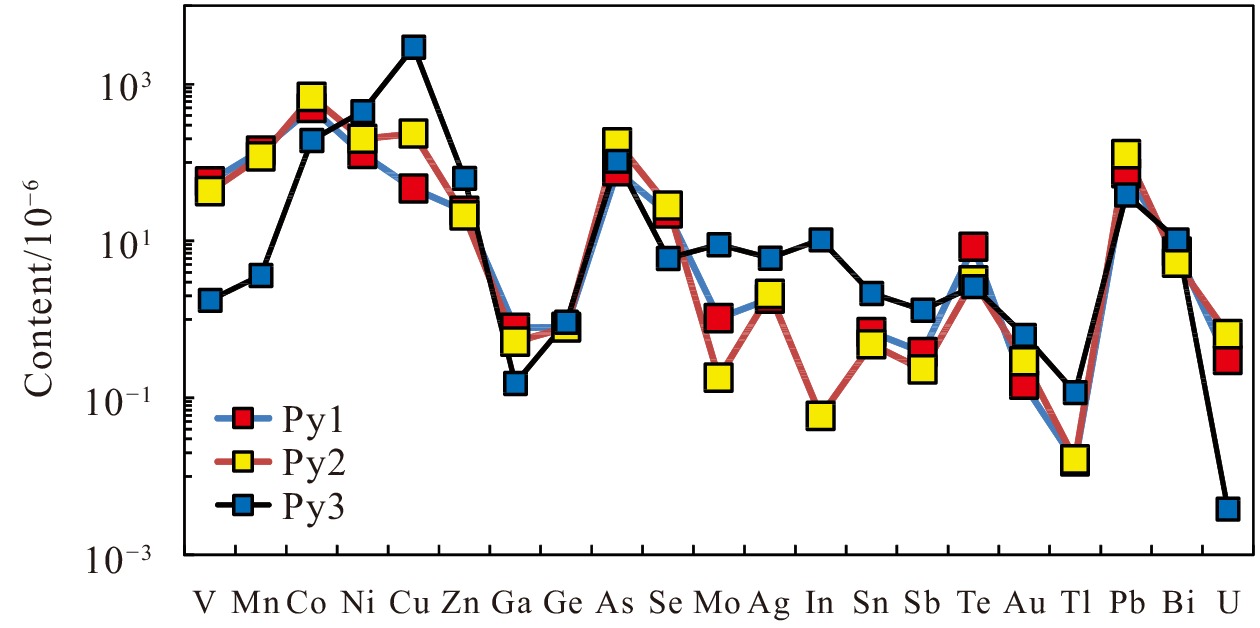
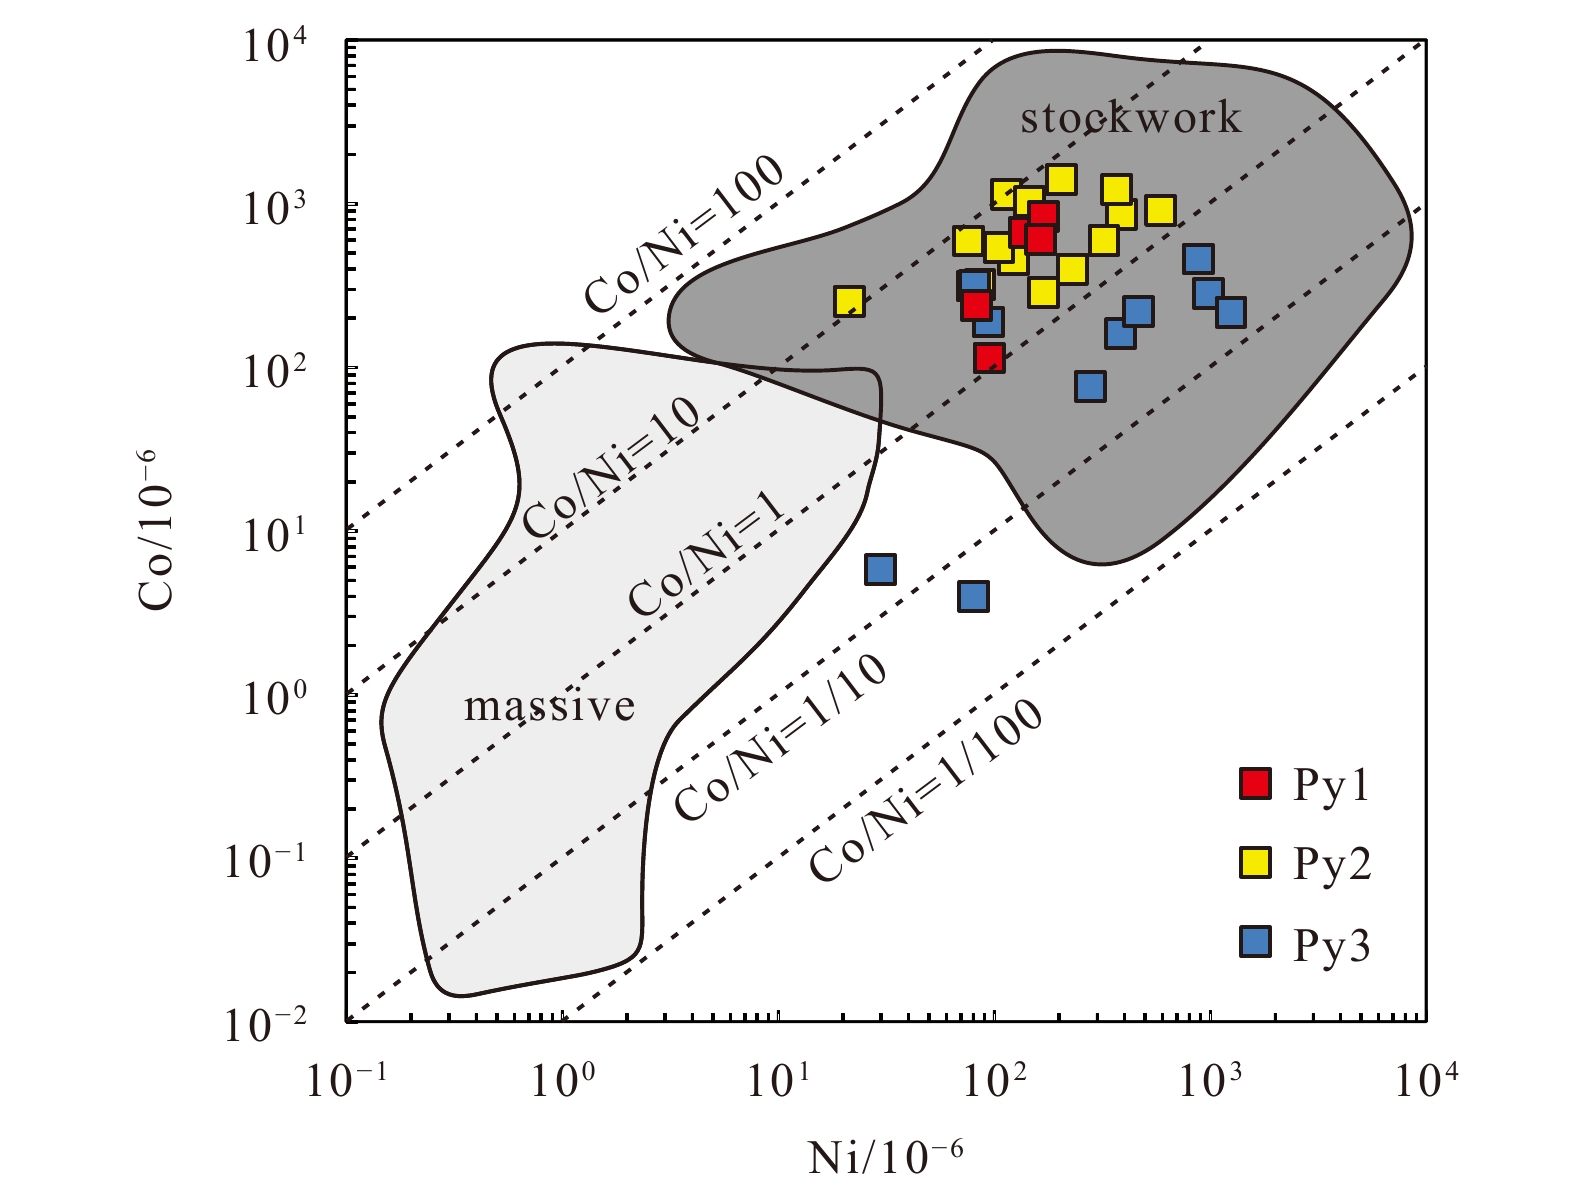
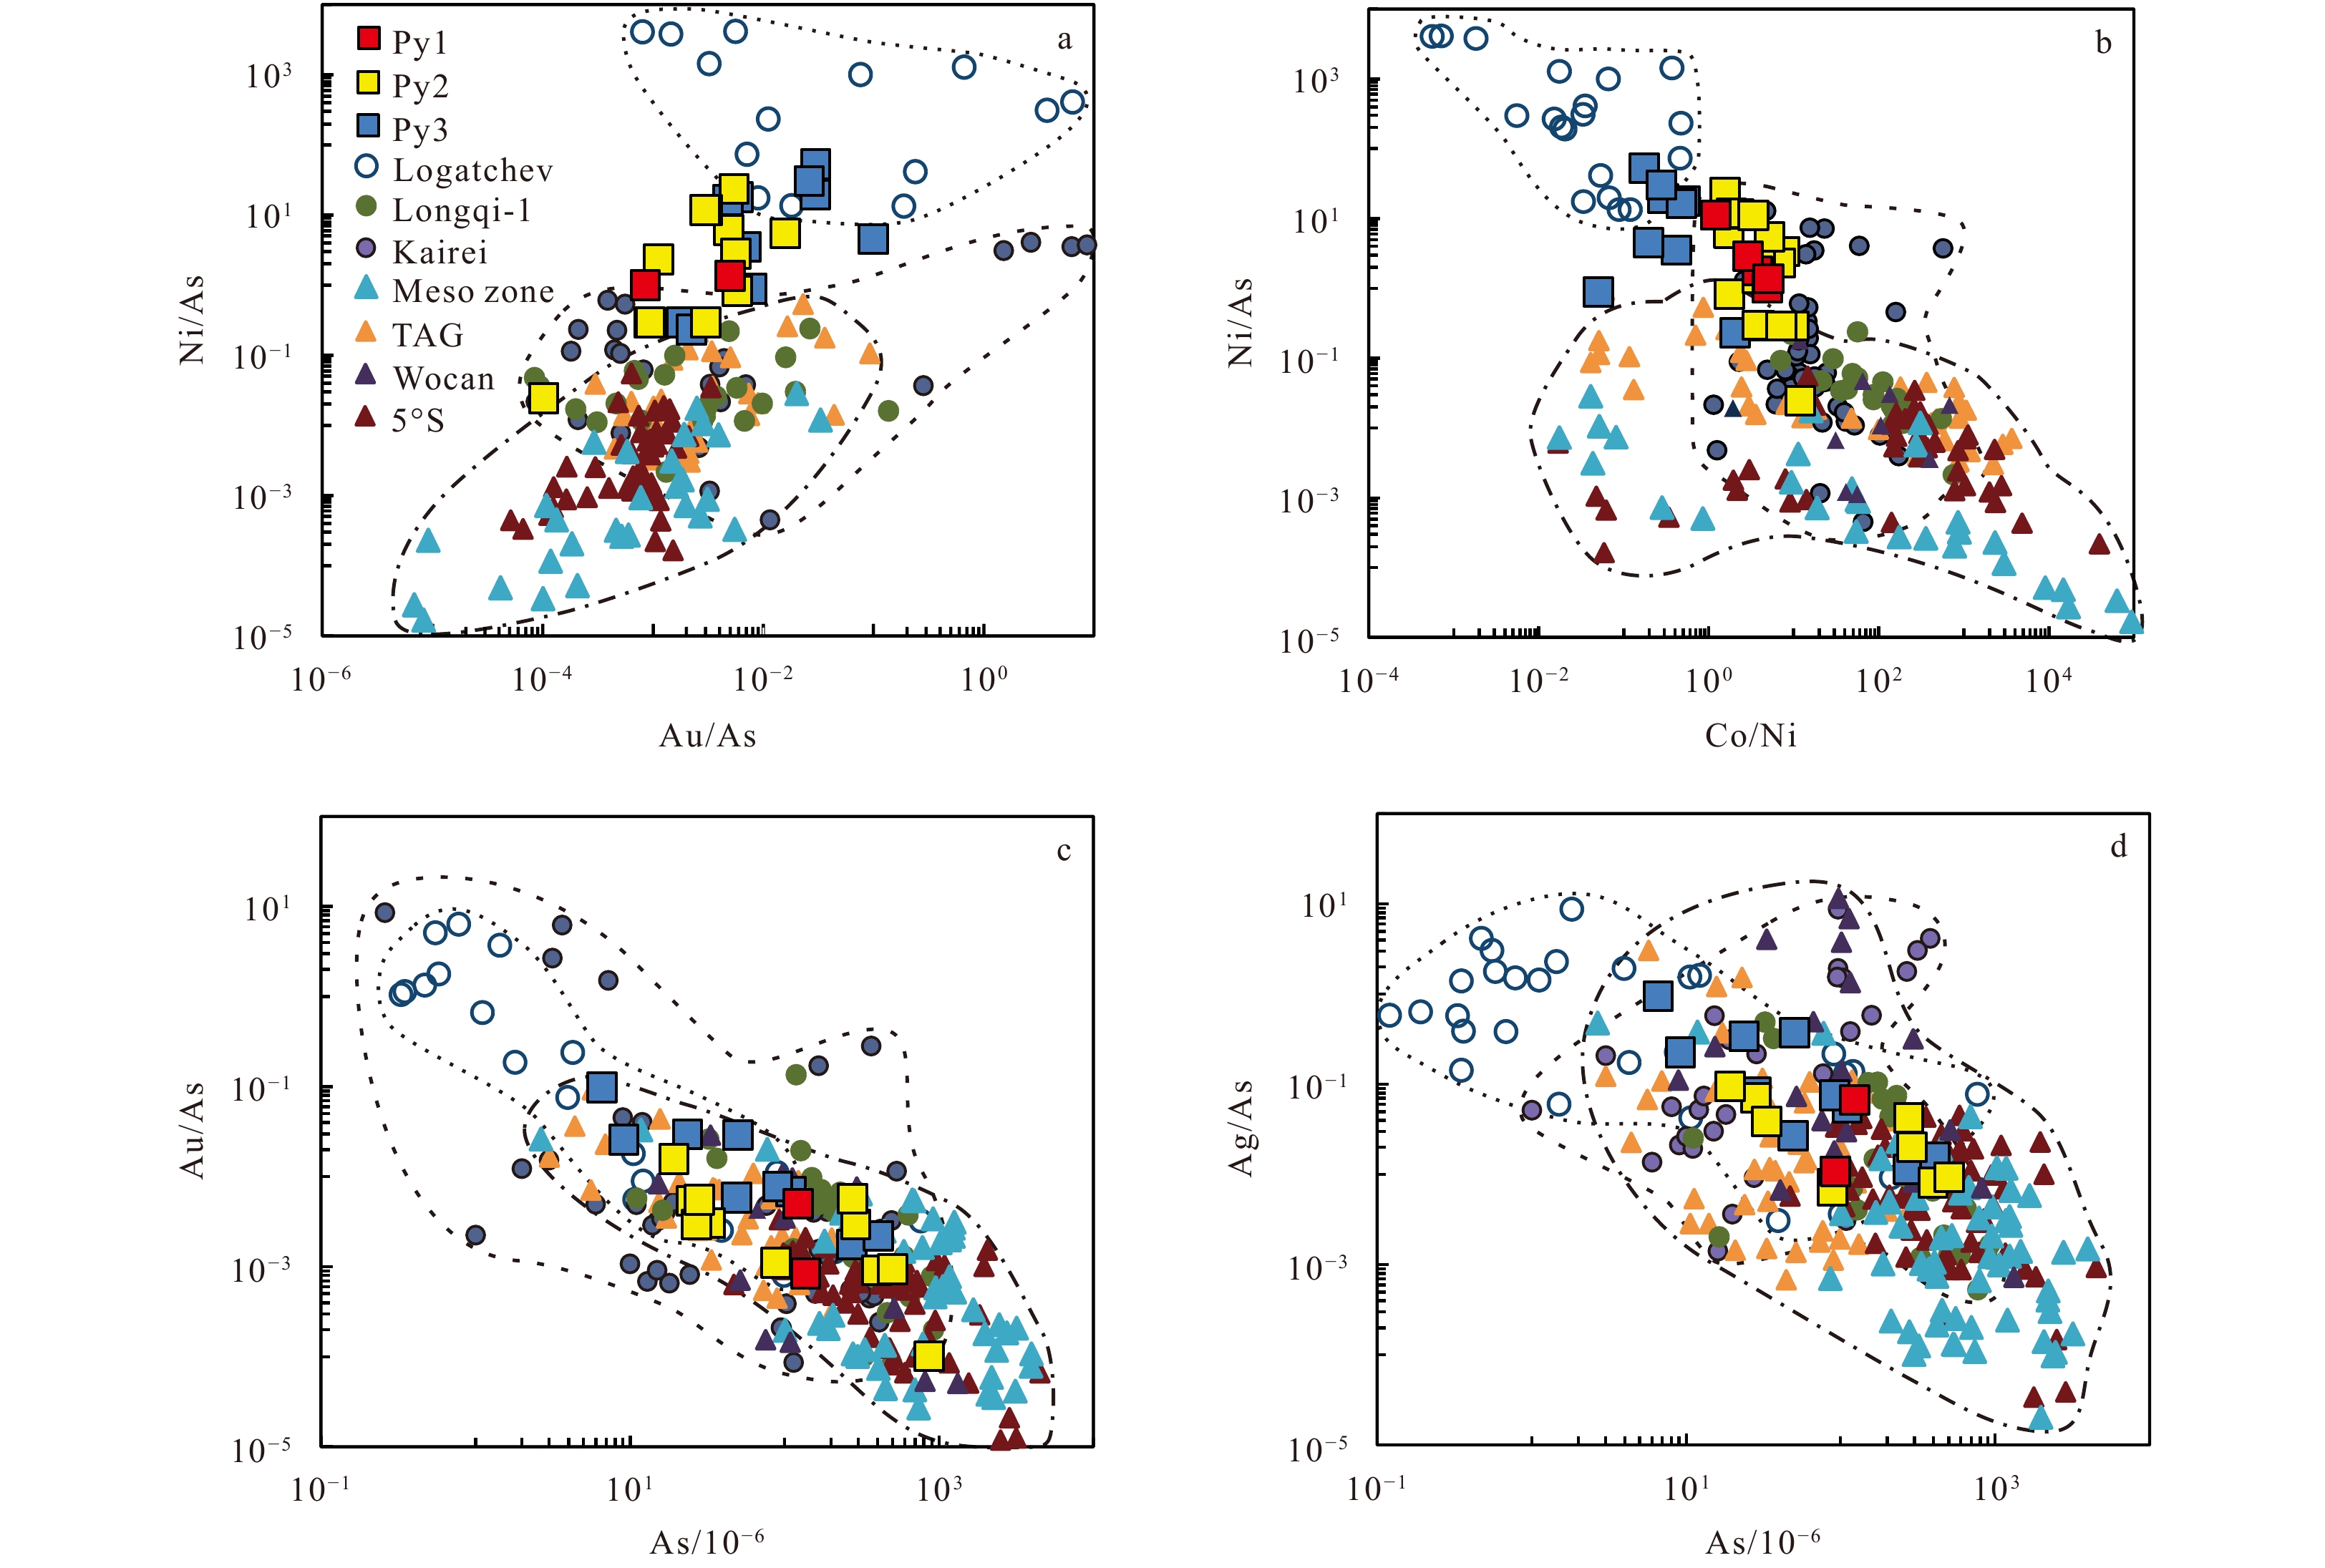
The newly discovered East Longjing-2 hydrothermal field (ELHF-2) is located on the Dragon Horn oceanic core complex of the ultraslow-spreading Southwest Indian Ridge, approximately 12 km from the ridge axis. This study measured the chemical compositions of pyrite from ELHF-2 using a laser ablation inductively coupled plasma mass spectrometry (LA-ICP-MS) to investigate the genesis of the field. Three generations of pyrite were classified, and found that: Py1 and Py2, rich in V, Mn, U, and Se, occur in altered basalt debris and the silica alteration matrix, respectively. Py3 was mainly intergrown with chalcopyrite in quartz veins and had higher Cu, In, Ag, Sb, and Au contents than Py1 and Py2. Some elements, such as Au, Se, and Pb, are likely presented as direct substitution with Fe2+ in pyrite, while Cu, Zn, Co, Ni, and Ag probably occur both as direct substitution with Fe and as distributed micro- to nanoparticle-sized sulfides. Meanwhile, the occurrence of V, Mn, and U is likely presented as oxide inclusions. Trace element geochemistry suggested that the pyrite was formed under high-temperature conditions, and the ore forming elements were likely derived from ultramafic rocks. In addition, Py1 and Py2 were formed under higher water/rock ratio and higher temperature conditions, with more seawater involvement compared with Py3. The formation of ELHF-2 was probably driven by exothermic serpentinization reactions with an additional magmatic heat. This study shows that high-temperature hydrothermal circulation driven by magmatic activity can be developed on distal rift flank areas of magma-starved ultraslow-spreading ridges.
Glacial bedforms in the Northwind Abyssal Plain, Chukchi Borderland
Zhongyan Shen, Tao Zhang, Jinyao Gao, Chunguo Yang, Qingsheng Guan
2021, 40(5): 114-119. doi: 10.1007/s13131-021-1728-z
Abstract:
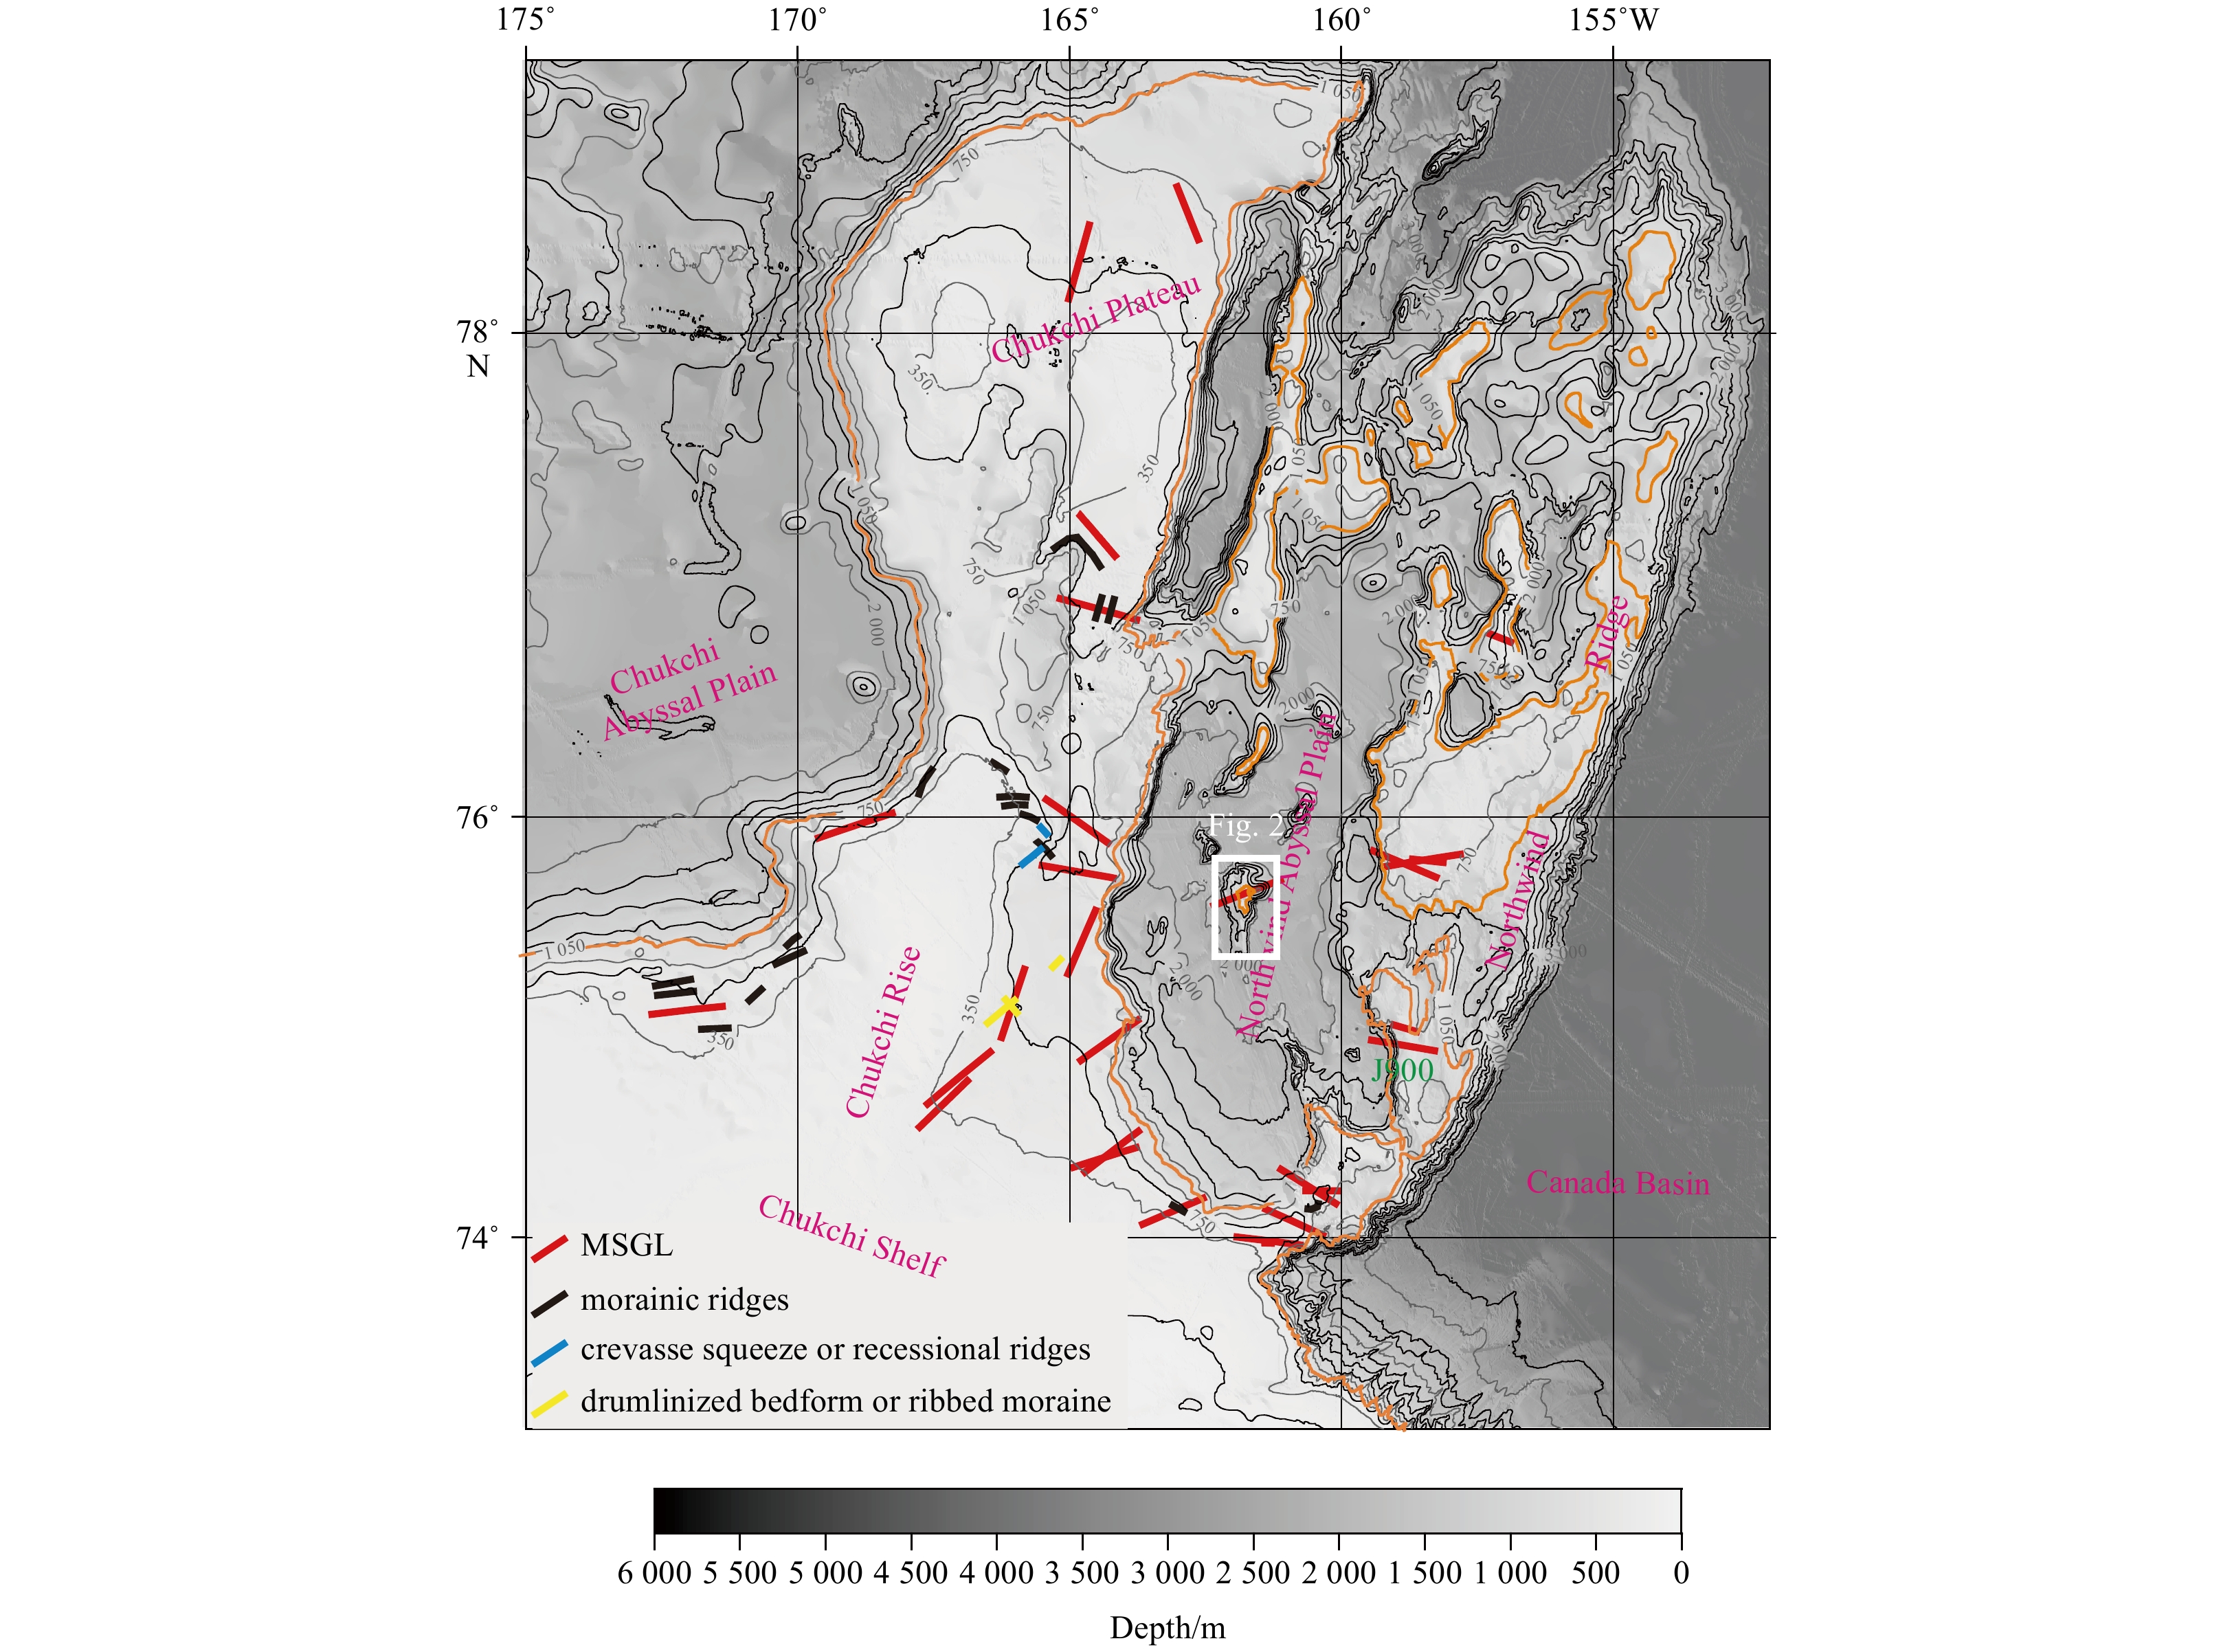
A series of sub-parallel linear glacial scours are identified on the crest of the Baoshi Seamount in the Northwind Abyssal Plain by compiling new multibeam data acquired during the 9th Chinese Arctic Research Expedition (CHINARE-Arc9) in 2018 and previously published data. The new data reveal scours that developed at water depths of 850–1 030 m with an orientation of about 75°/255°. The maximum water depth occurs in the southernmost scour and is deeper than that from previous investigations, which showed a maximum scouring depth of about 900 m on the seamount. The topographic and geomorphological characteristics suggest that these scours resulted from erosion by the ice shelf extending from the Chukchi margin and/or Laurentide Ice Sheet that grounded on the crest of the seamount and moved in a NE–SW direction. Other possibilities of their genesis include armadas of large icebergs/multi-keel icebergs calved from the Chukchi Shelf or the Laurentide Ice Sheet. The new data provide new constraints for assessing the extent and volume of the ice sheet in the Chukchi area during glacial maxima.
Forward modeling and inversion of the relation model between the gas content of plume and its seismic attribute
Canping Li, Jiachun You, Yanchun Tan, Fengying Chen, Yilin Liu, Zihao Guo, Xinyu Tian
2021, 40(5): 120-128. doi: 10.1007/s13131-021-1737-y
Abstract:
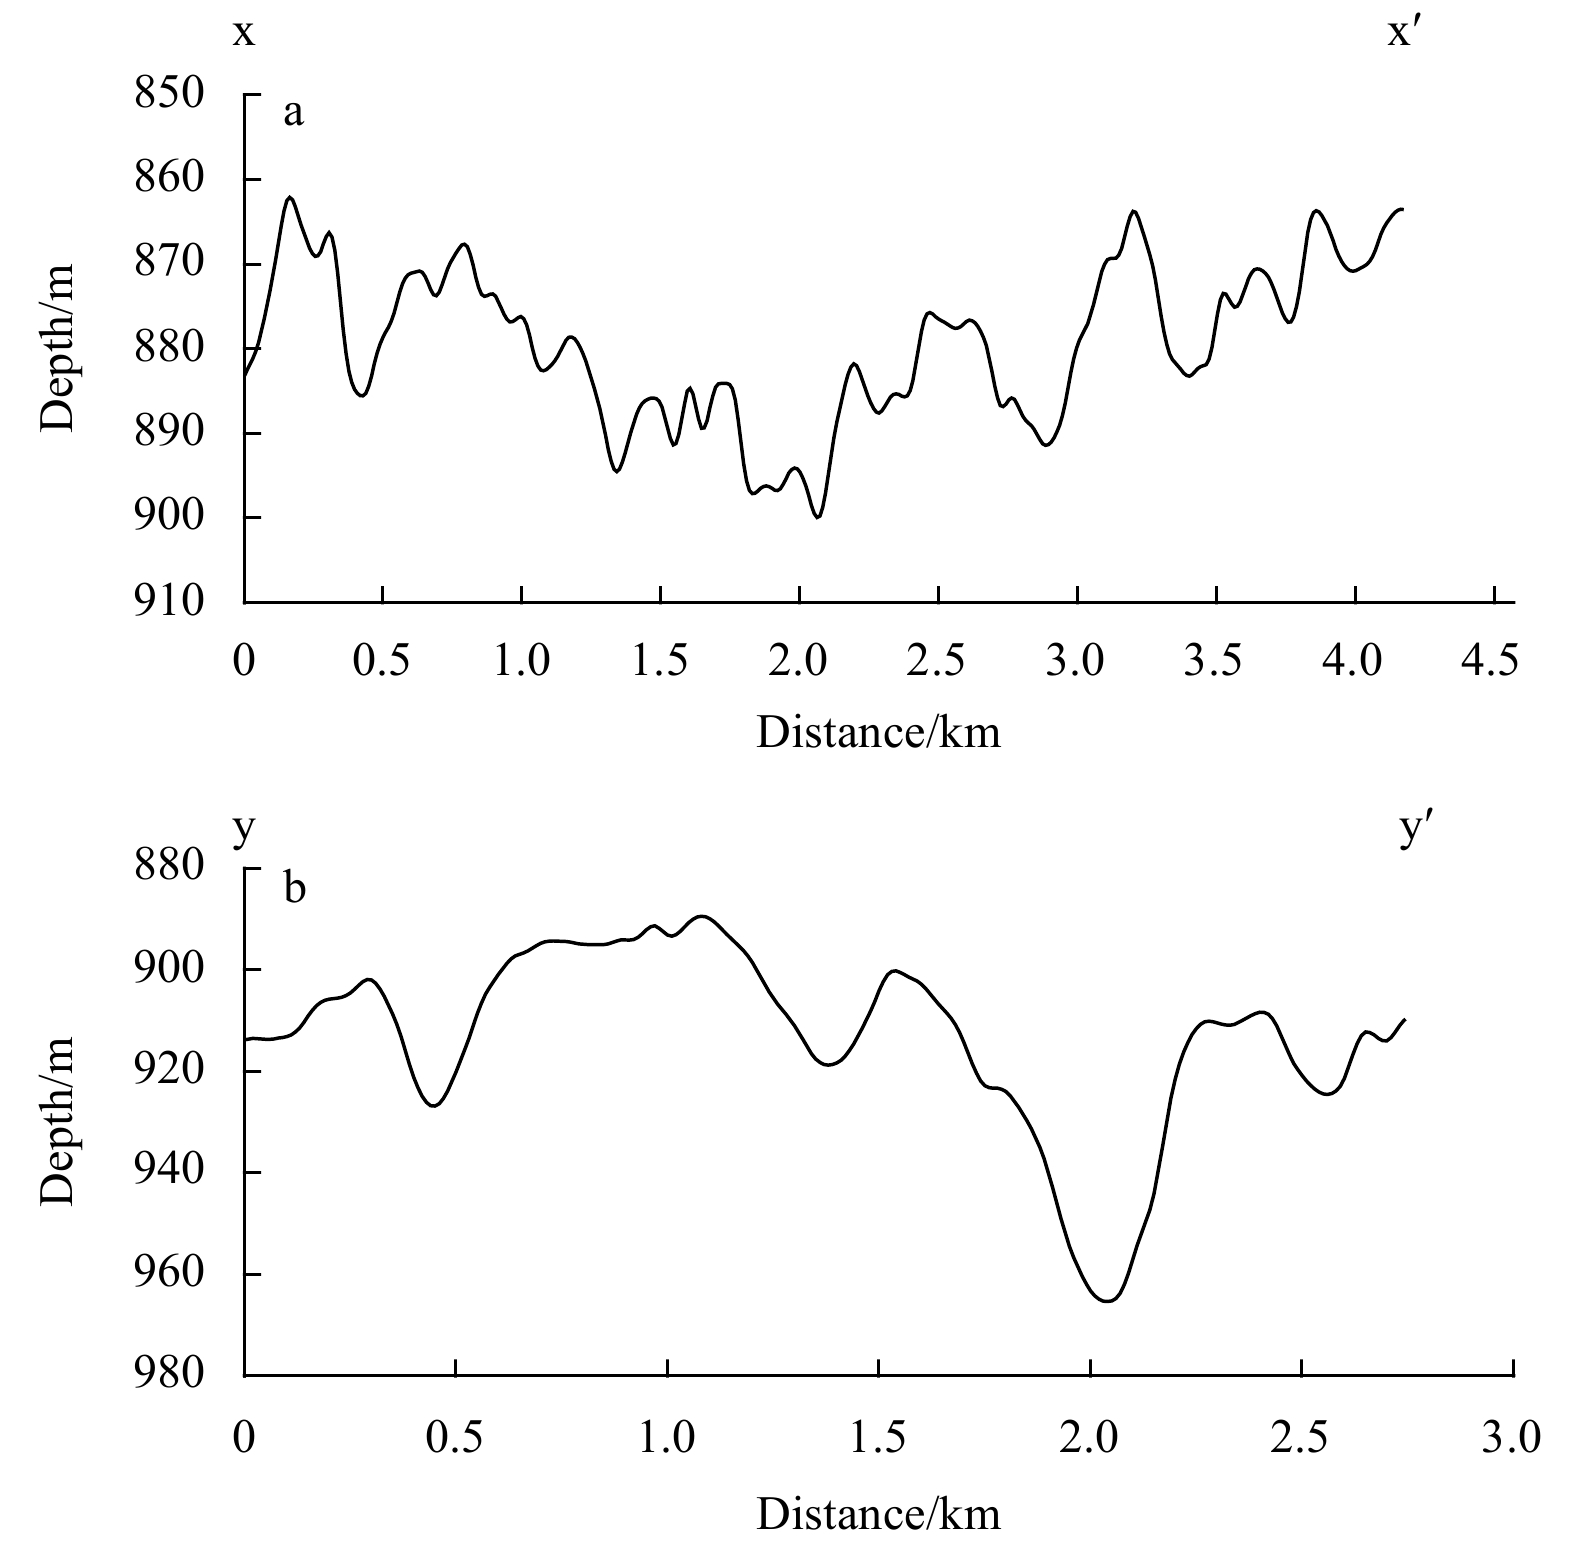
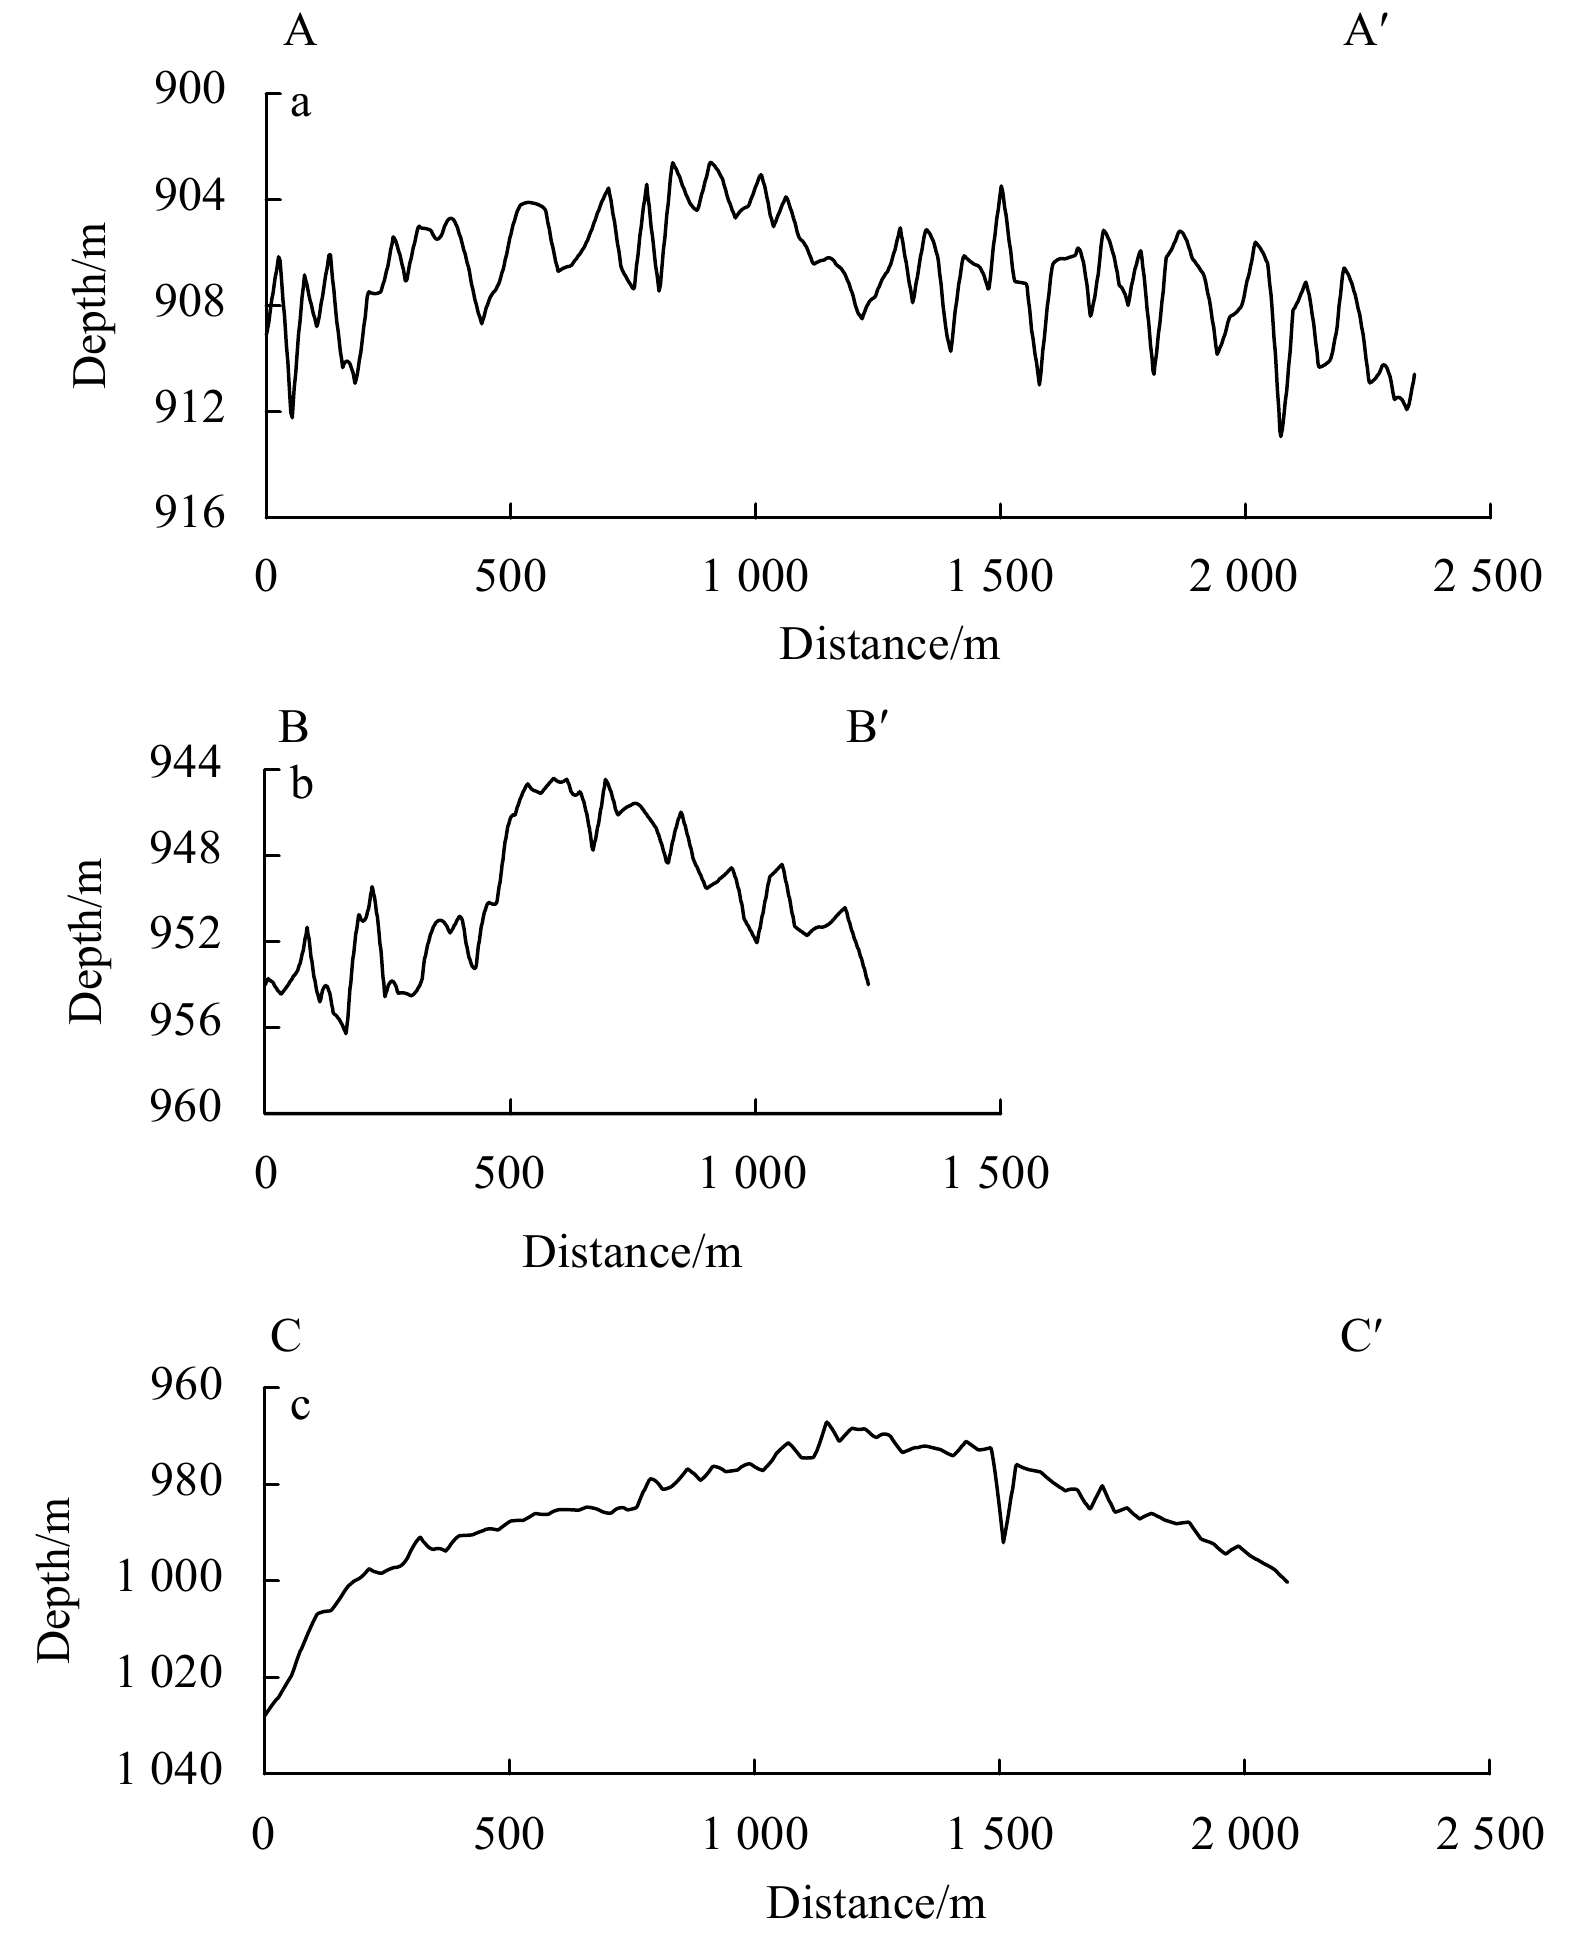
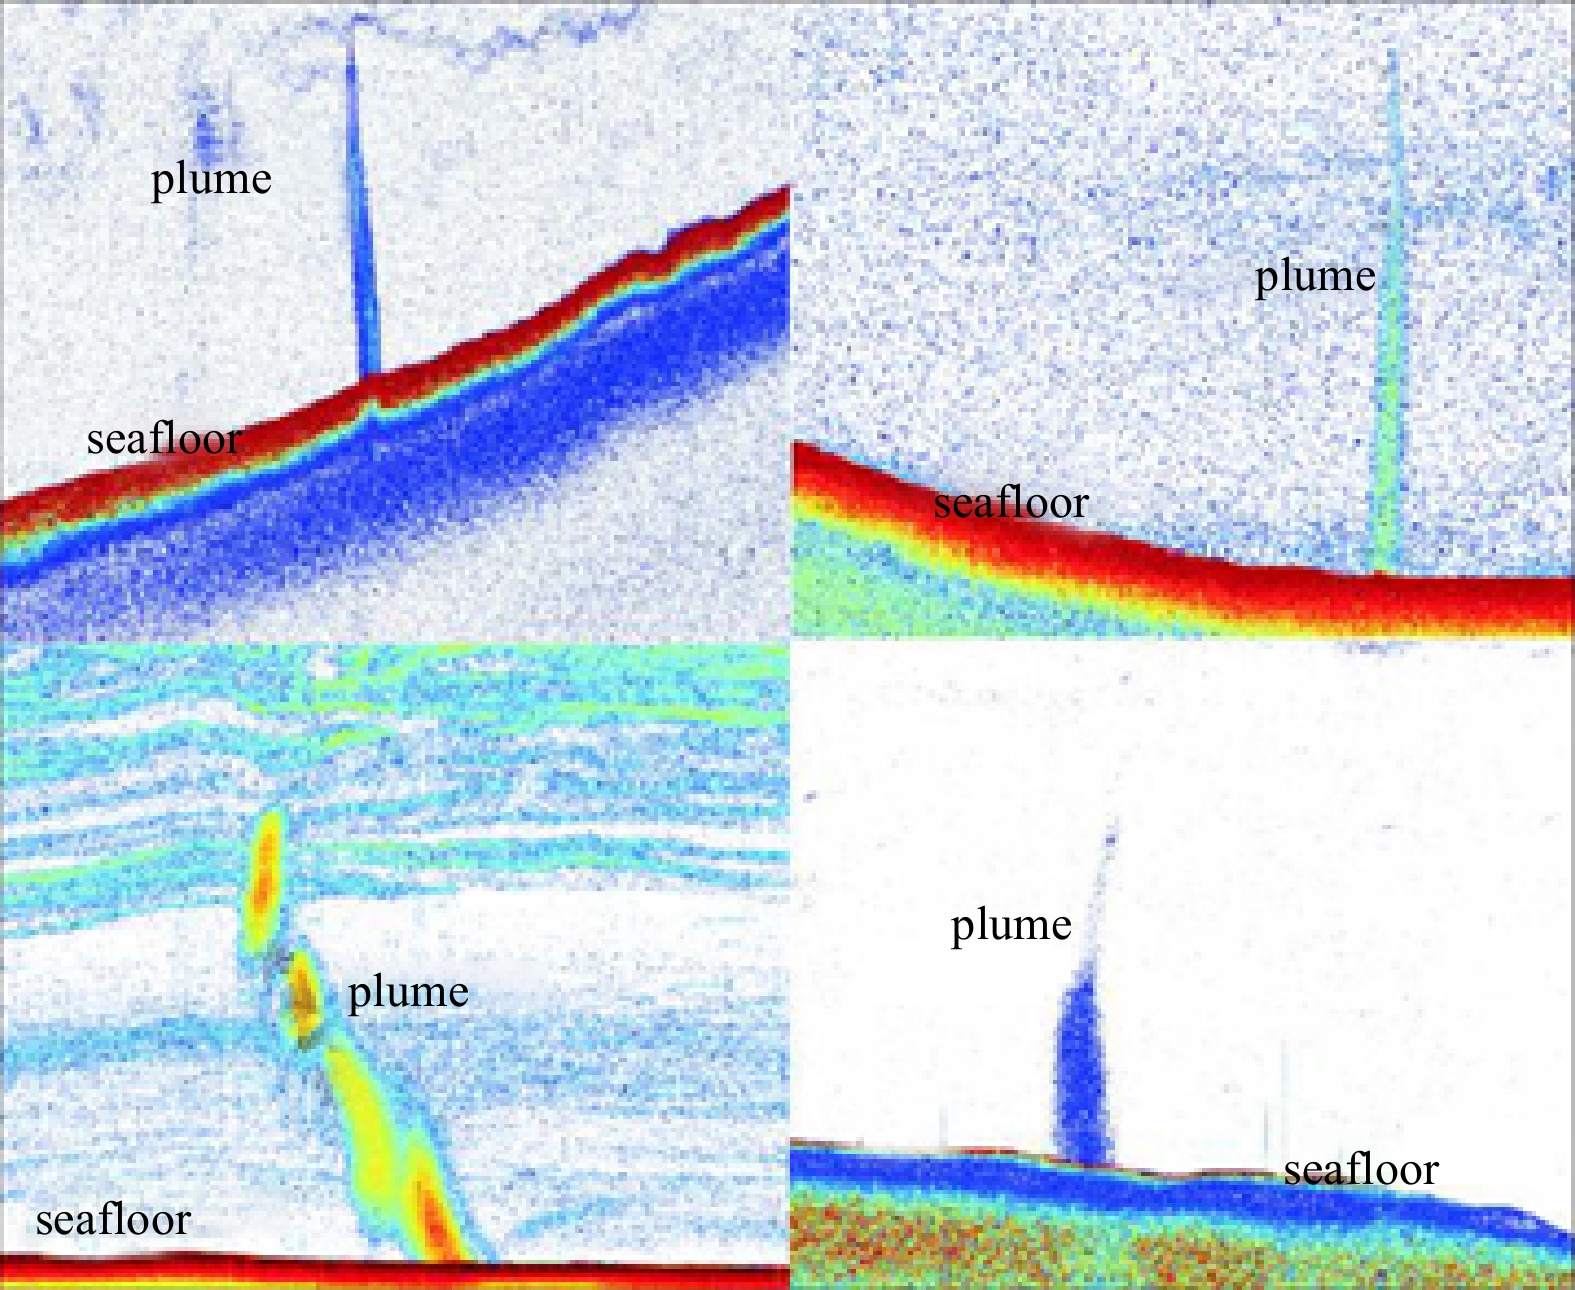
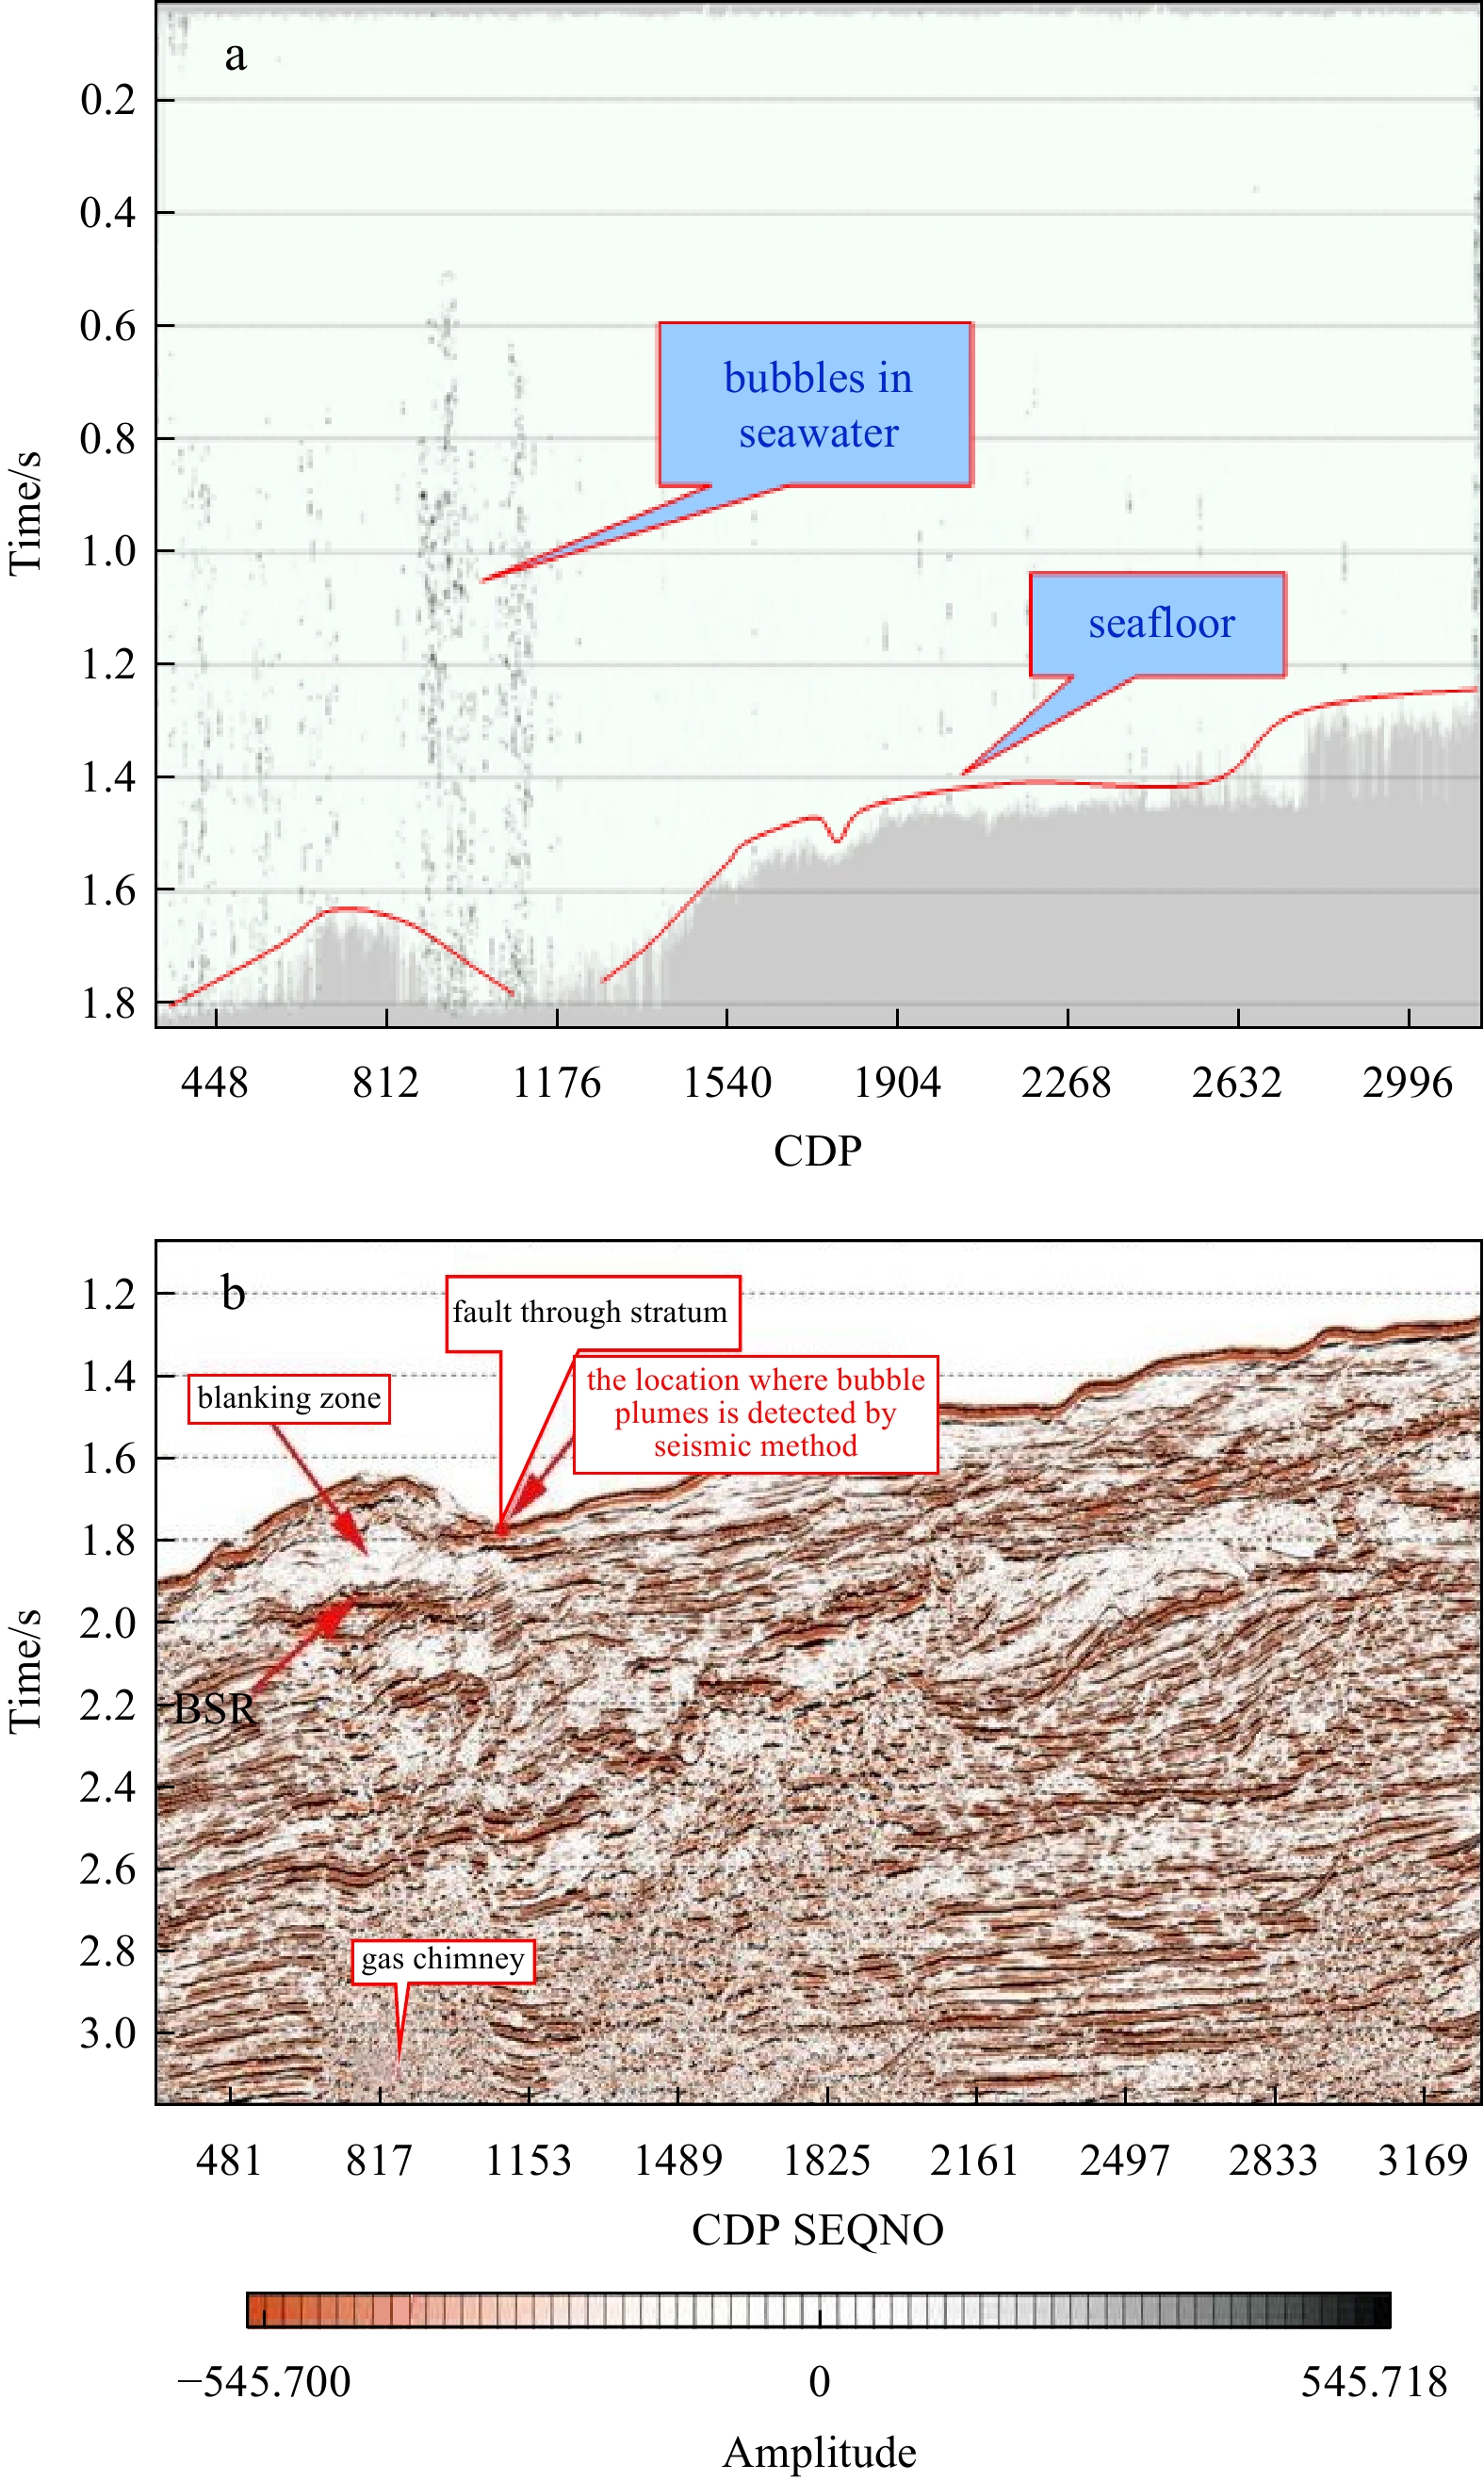
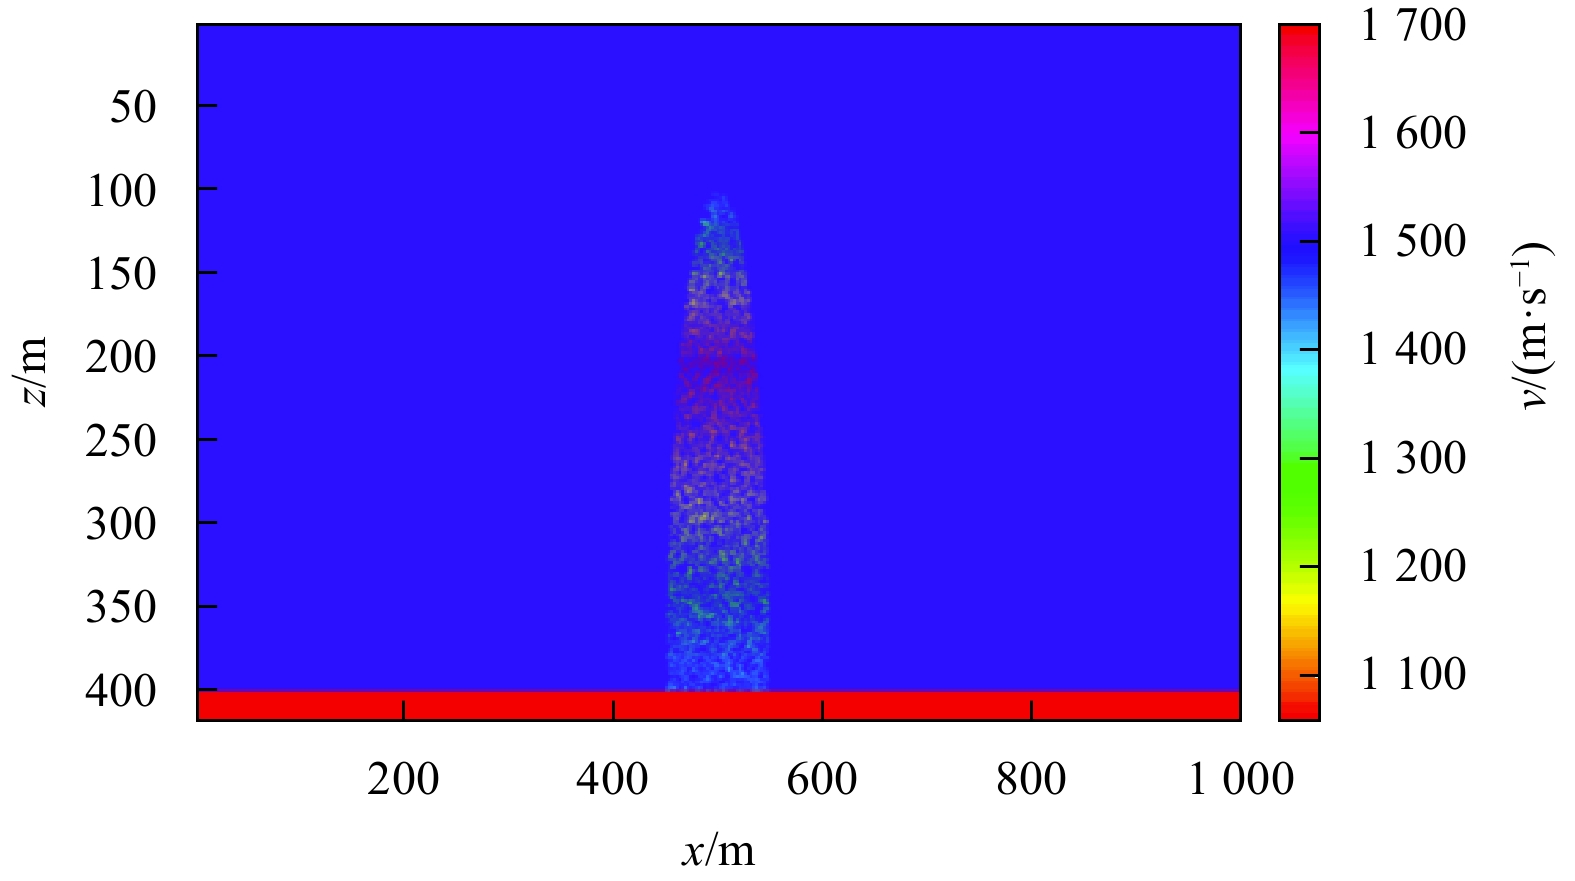
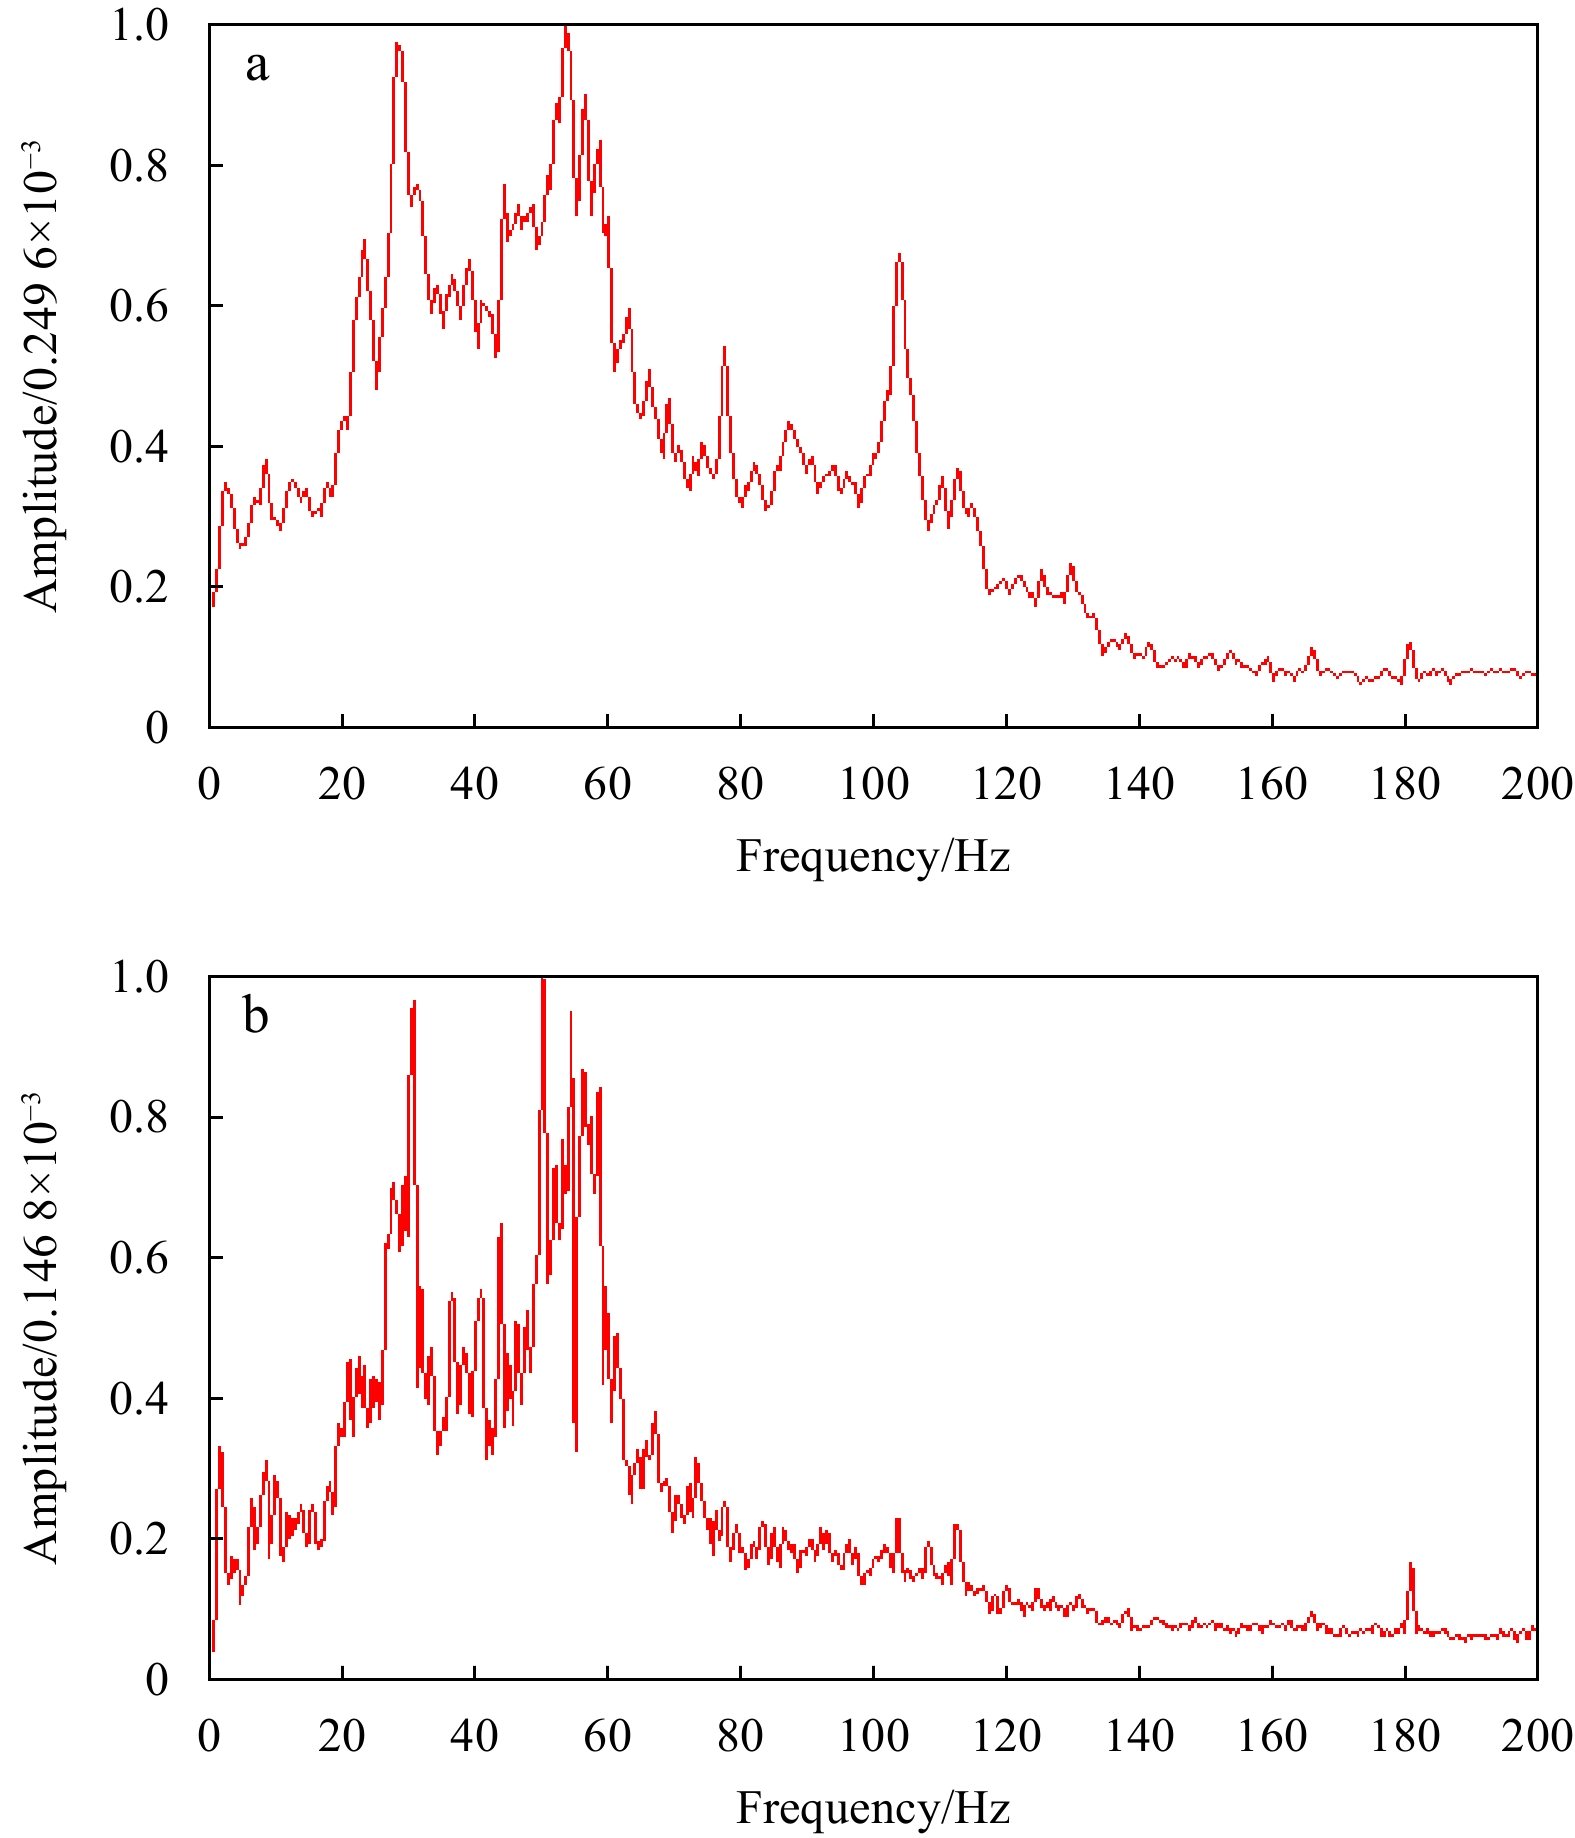
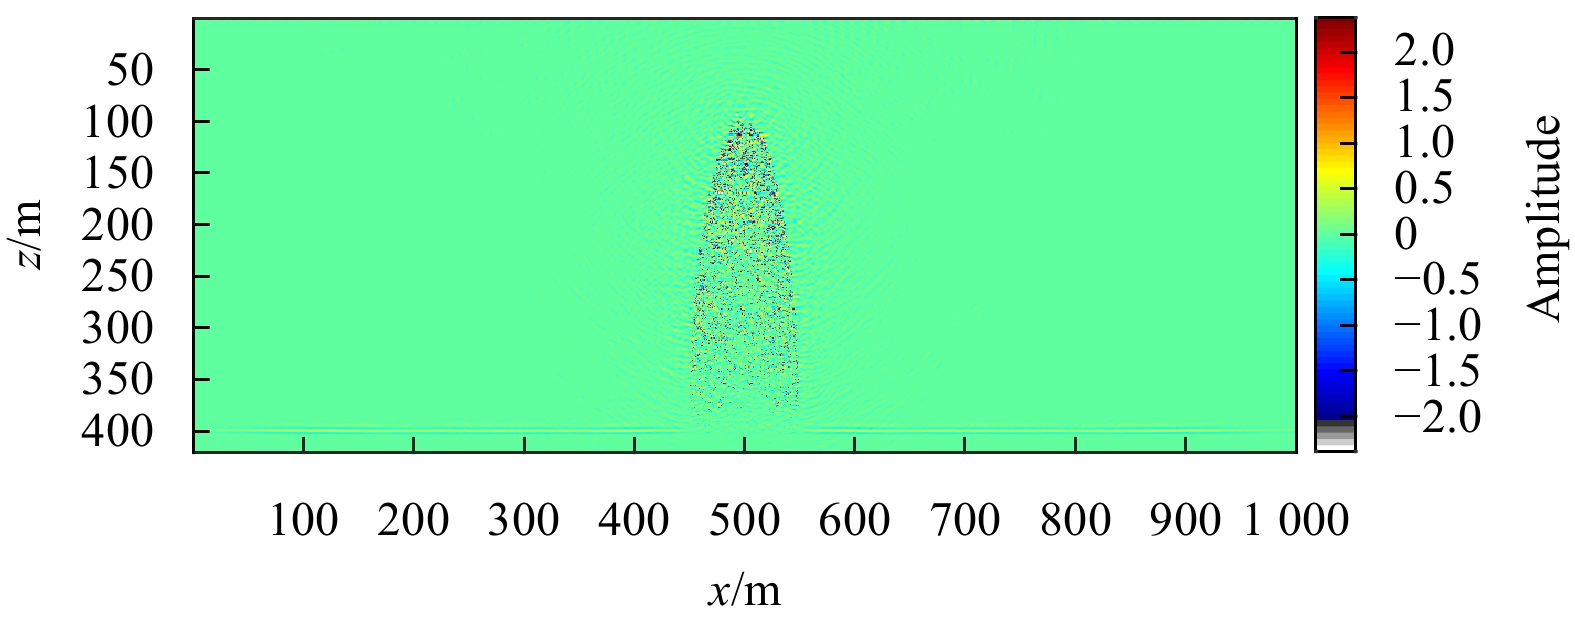
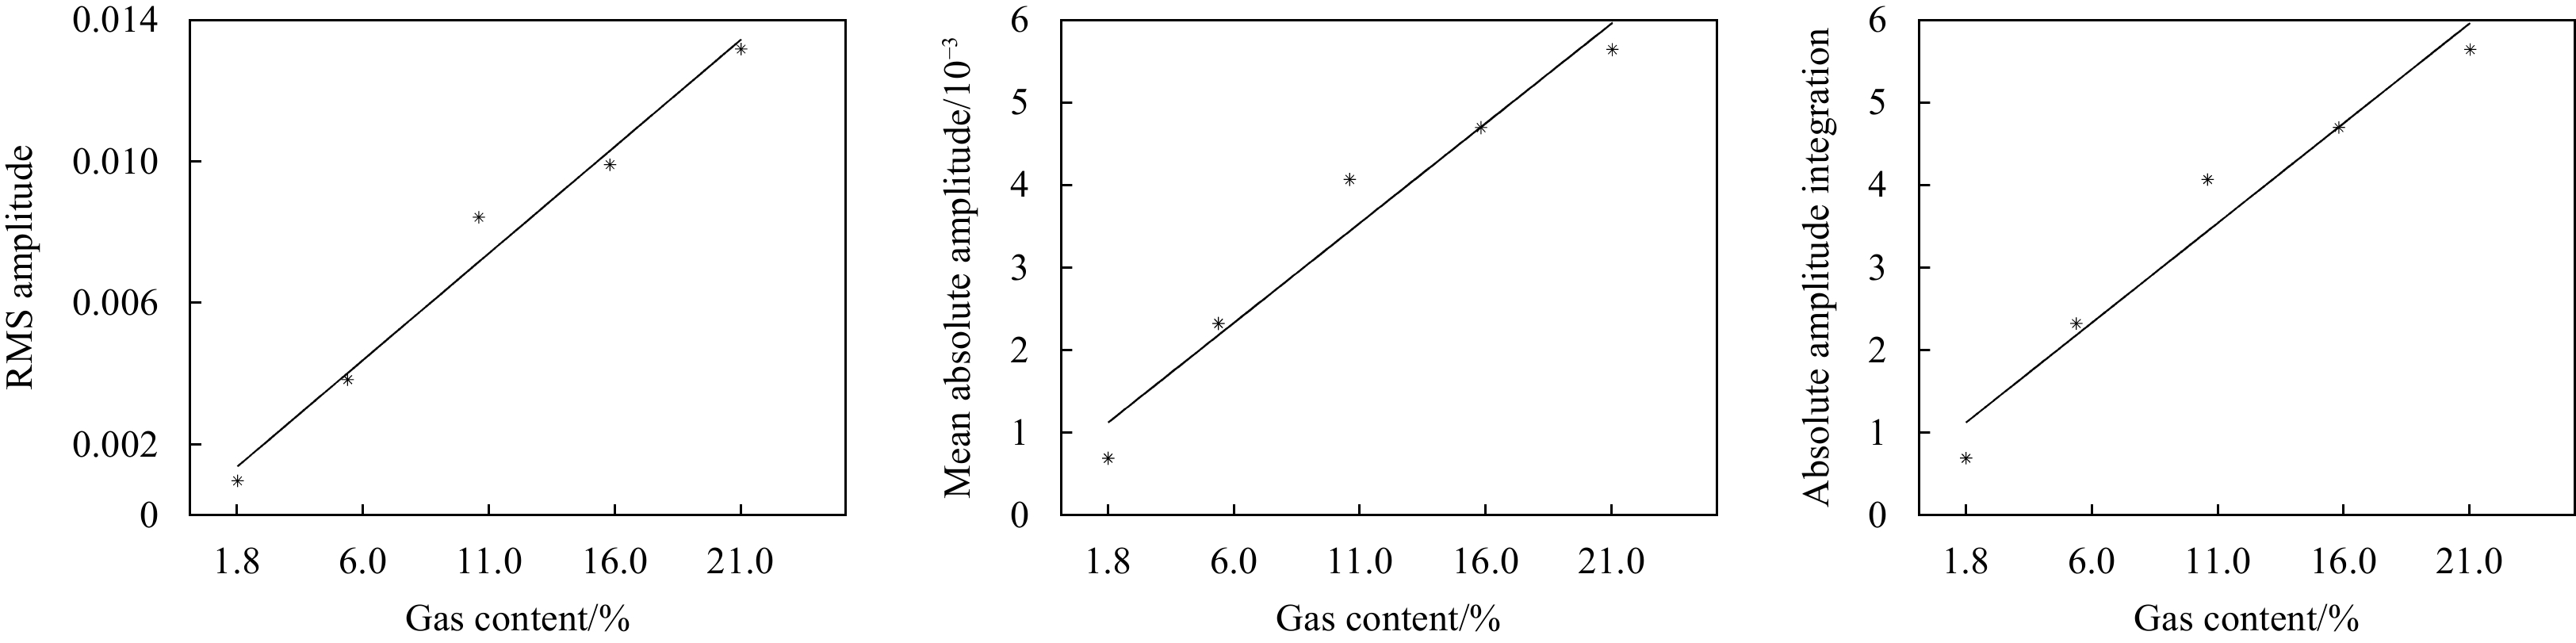
The methane bubble plume attracts interest because it offers direct evidence of seafloor gas leakage and plays an indirect role in the exploration and identification of natural gas hydrate. In this study, based on established plume models and their migration sections, three amplitude-class attributes were extracted from three formations for the migration sections of five plumes, and the correlation between the gas content and seismic attribute was obtained. As the gas content increases, the amplitude attribute correspondingly increases, and the linear correlation is relatively good. Moreover, correlation coefficients between gas content and amplitude attributes are close to 1.0. By using linear fitting, the relation model between the gas content of the plume and the seismic attribute was obtained. The relation model was subsequently used to invert the gas content from a real data-bearing plume. Comparison of the gas content section of the plume with the attribute section and real seismic section reveals common distribution characteristics, namely, the color of the section in the lower right corner is dark. If the amplitude value is large in the seismic section of the real plume, the amplitude attribute value is also large in the corresponding attribute section, and the inverted value of the gas content is also large (because gas content and amplitude are linearly correlated), which indicates that the plume bubbles of the section in the lower right corner is intensively distributed. Finally, the obtained gas content section of the plume can reflect the distribution of the plume bubble content more simply and intuitively, from which the distribution law of seafloor bubbles can be deduced, and this lays a foundation for the further estimation of the gas content of the plume and hydrate reserves.
Marine Information Science
Preliminary calibration results of the HY-2B altimeter’s SSH at China’s Wanshan calibration site
Chuntao Chen, Jianhua Zhu, Chaofei Ma, Mingsen Lin, Longhao Yan, Xiaoqi Huang, Wanlin Zhai, Bo Mu, Yongjun Jia
2021, 40(5): 129-140. doi: 10.1007/s13131-021-1745-y
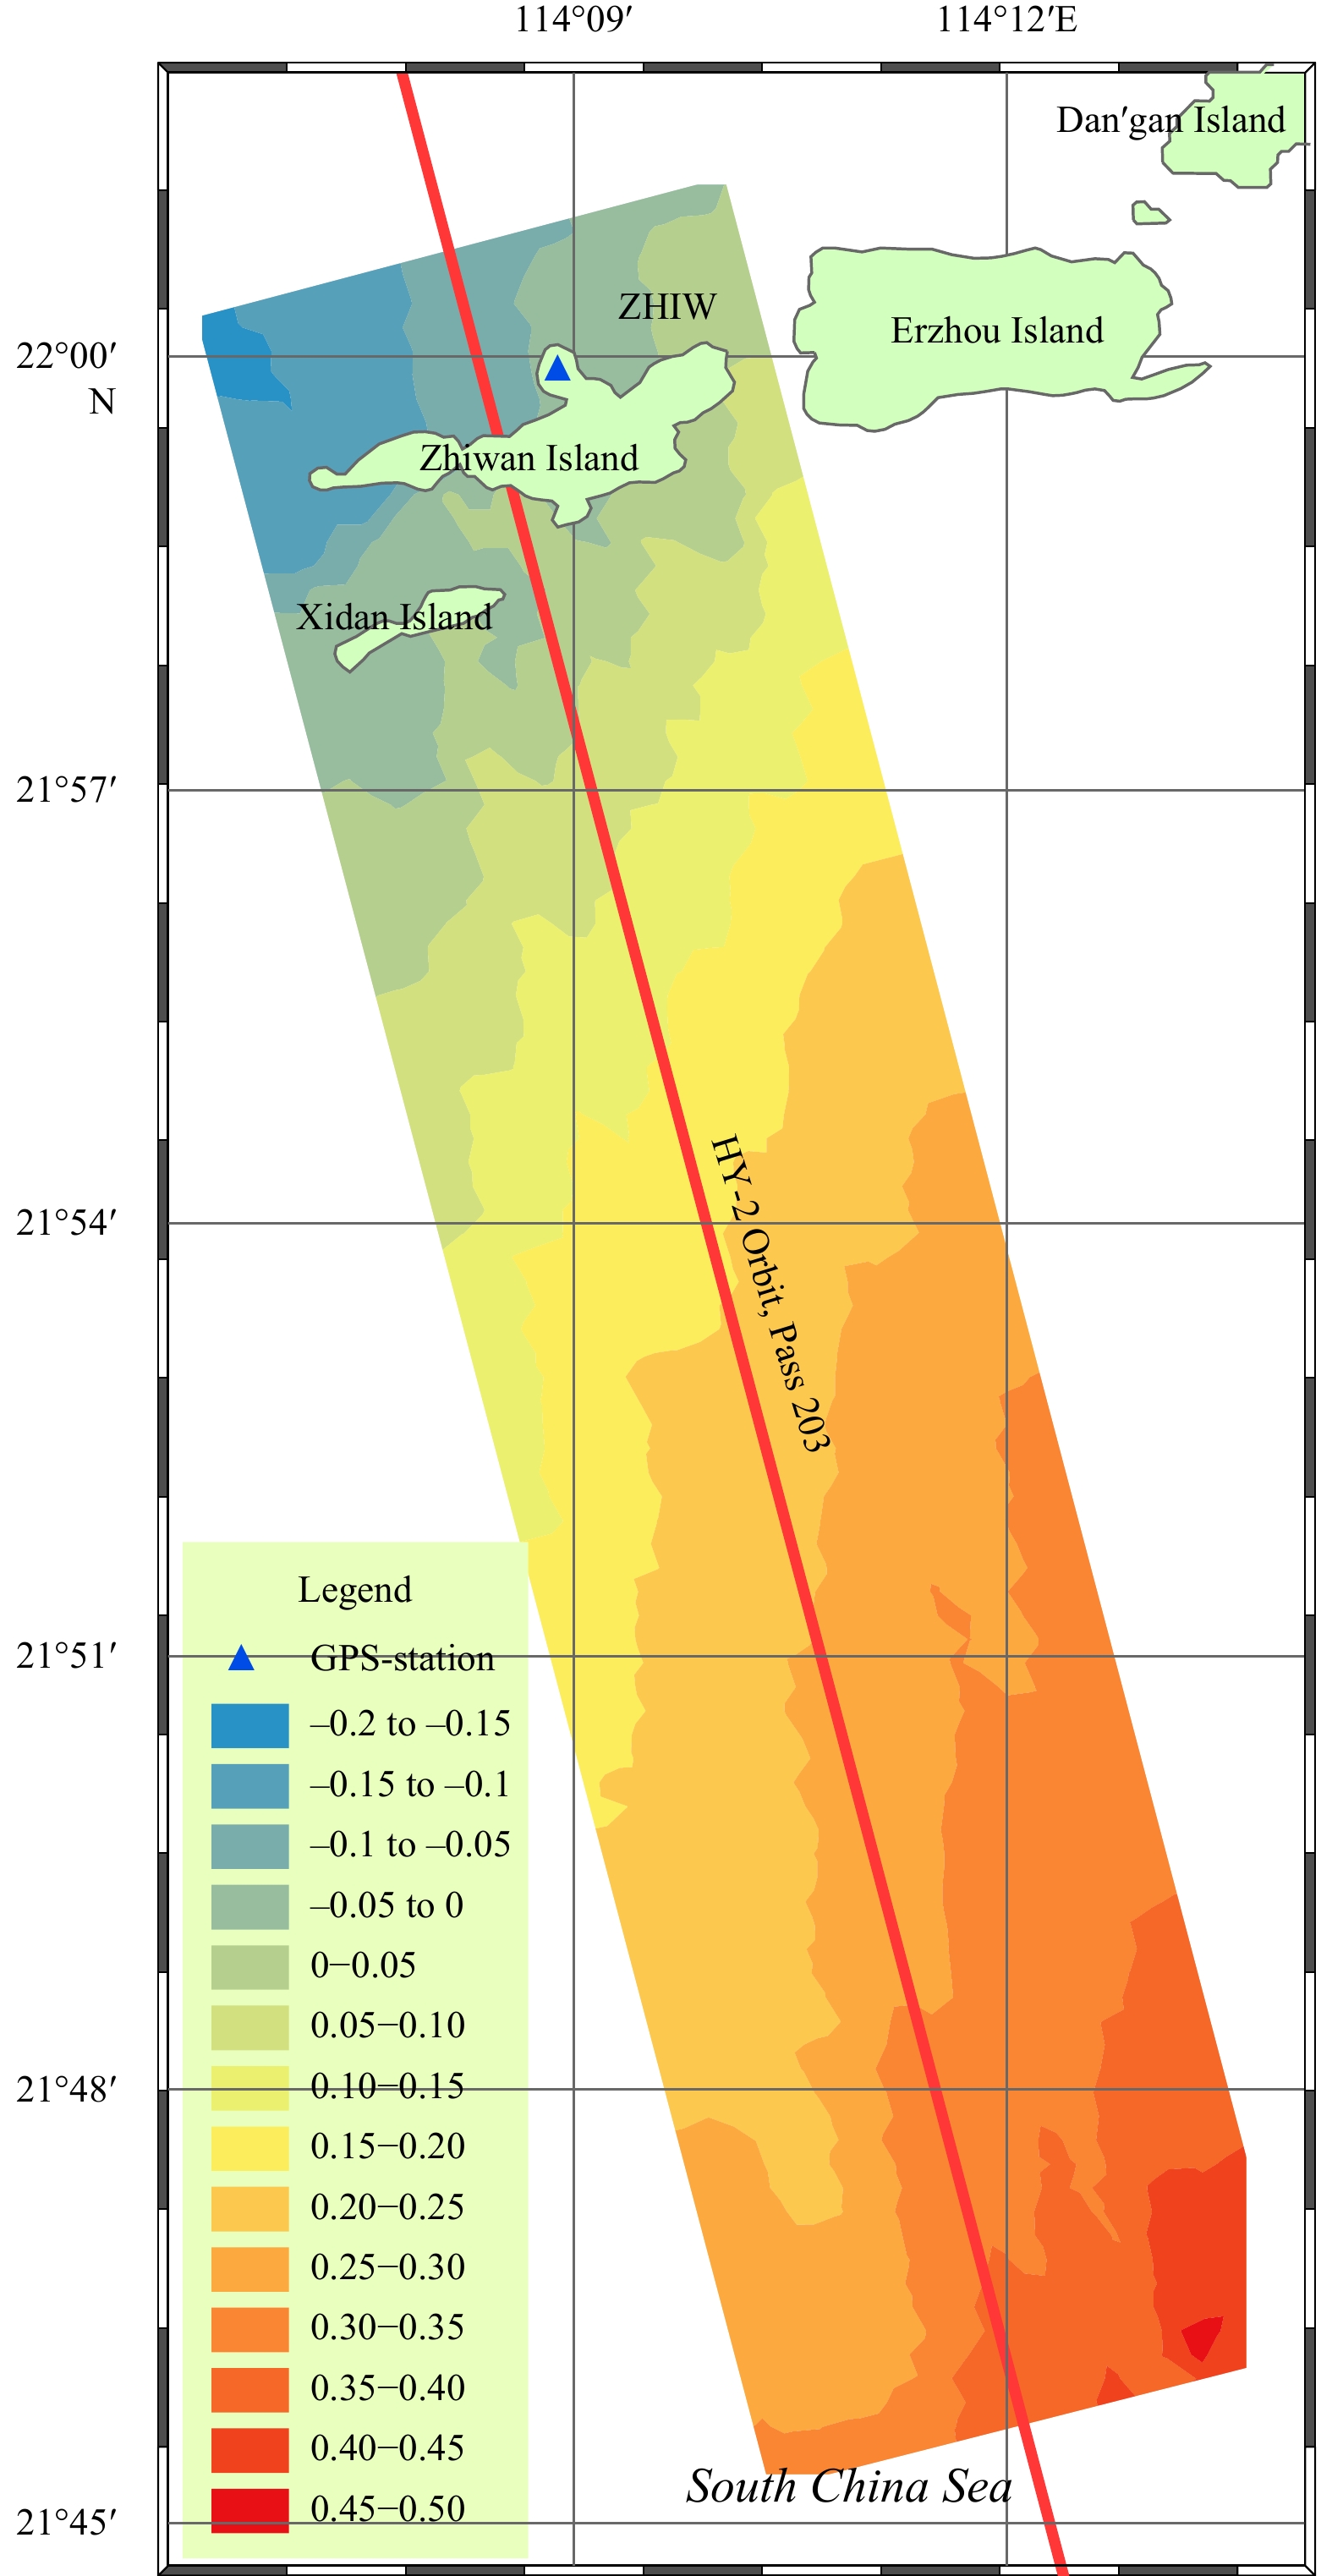
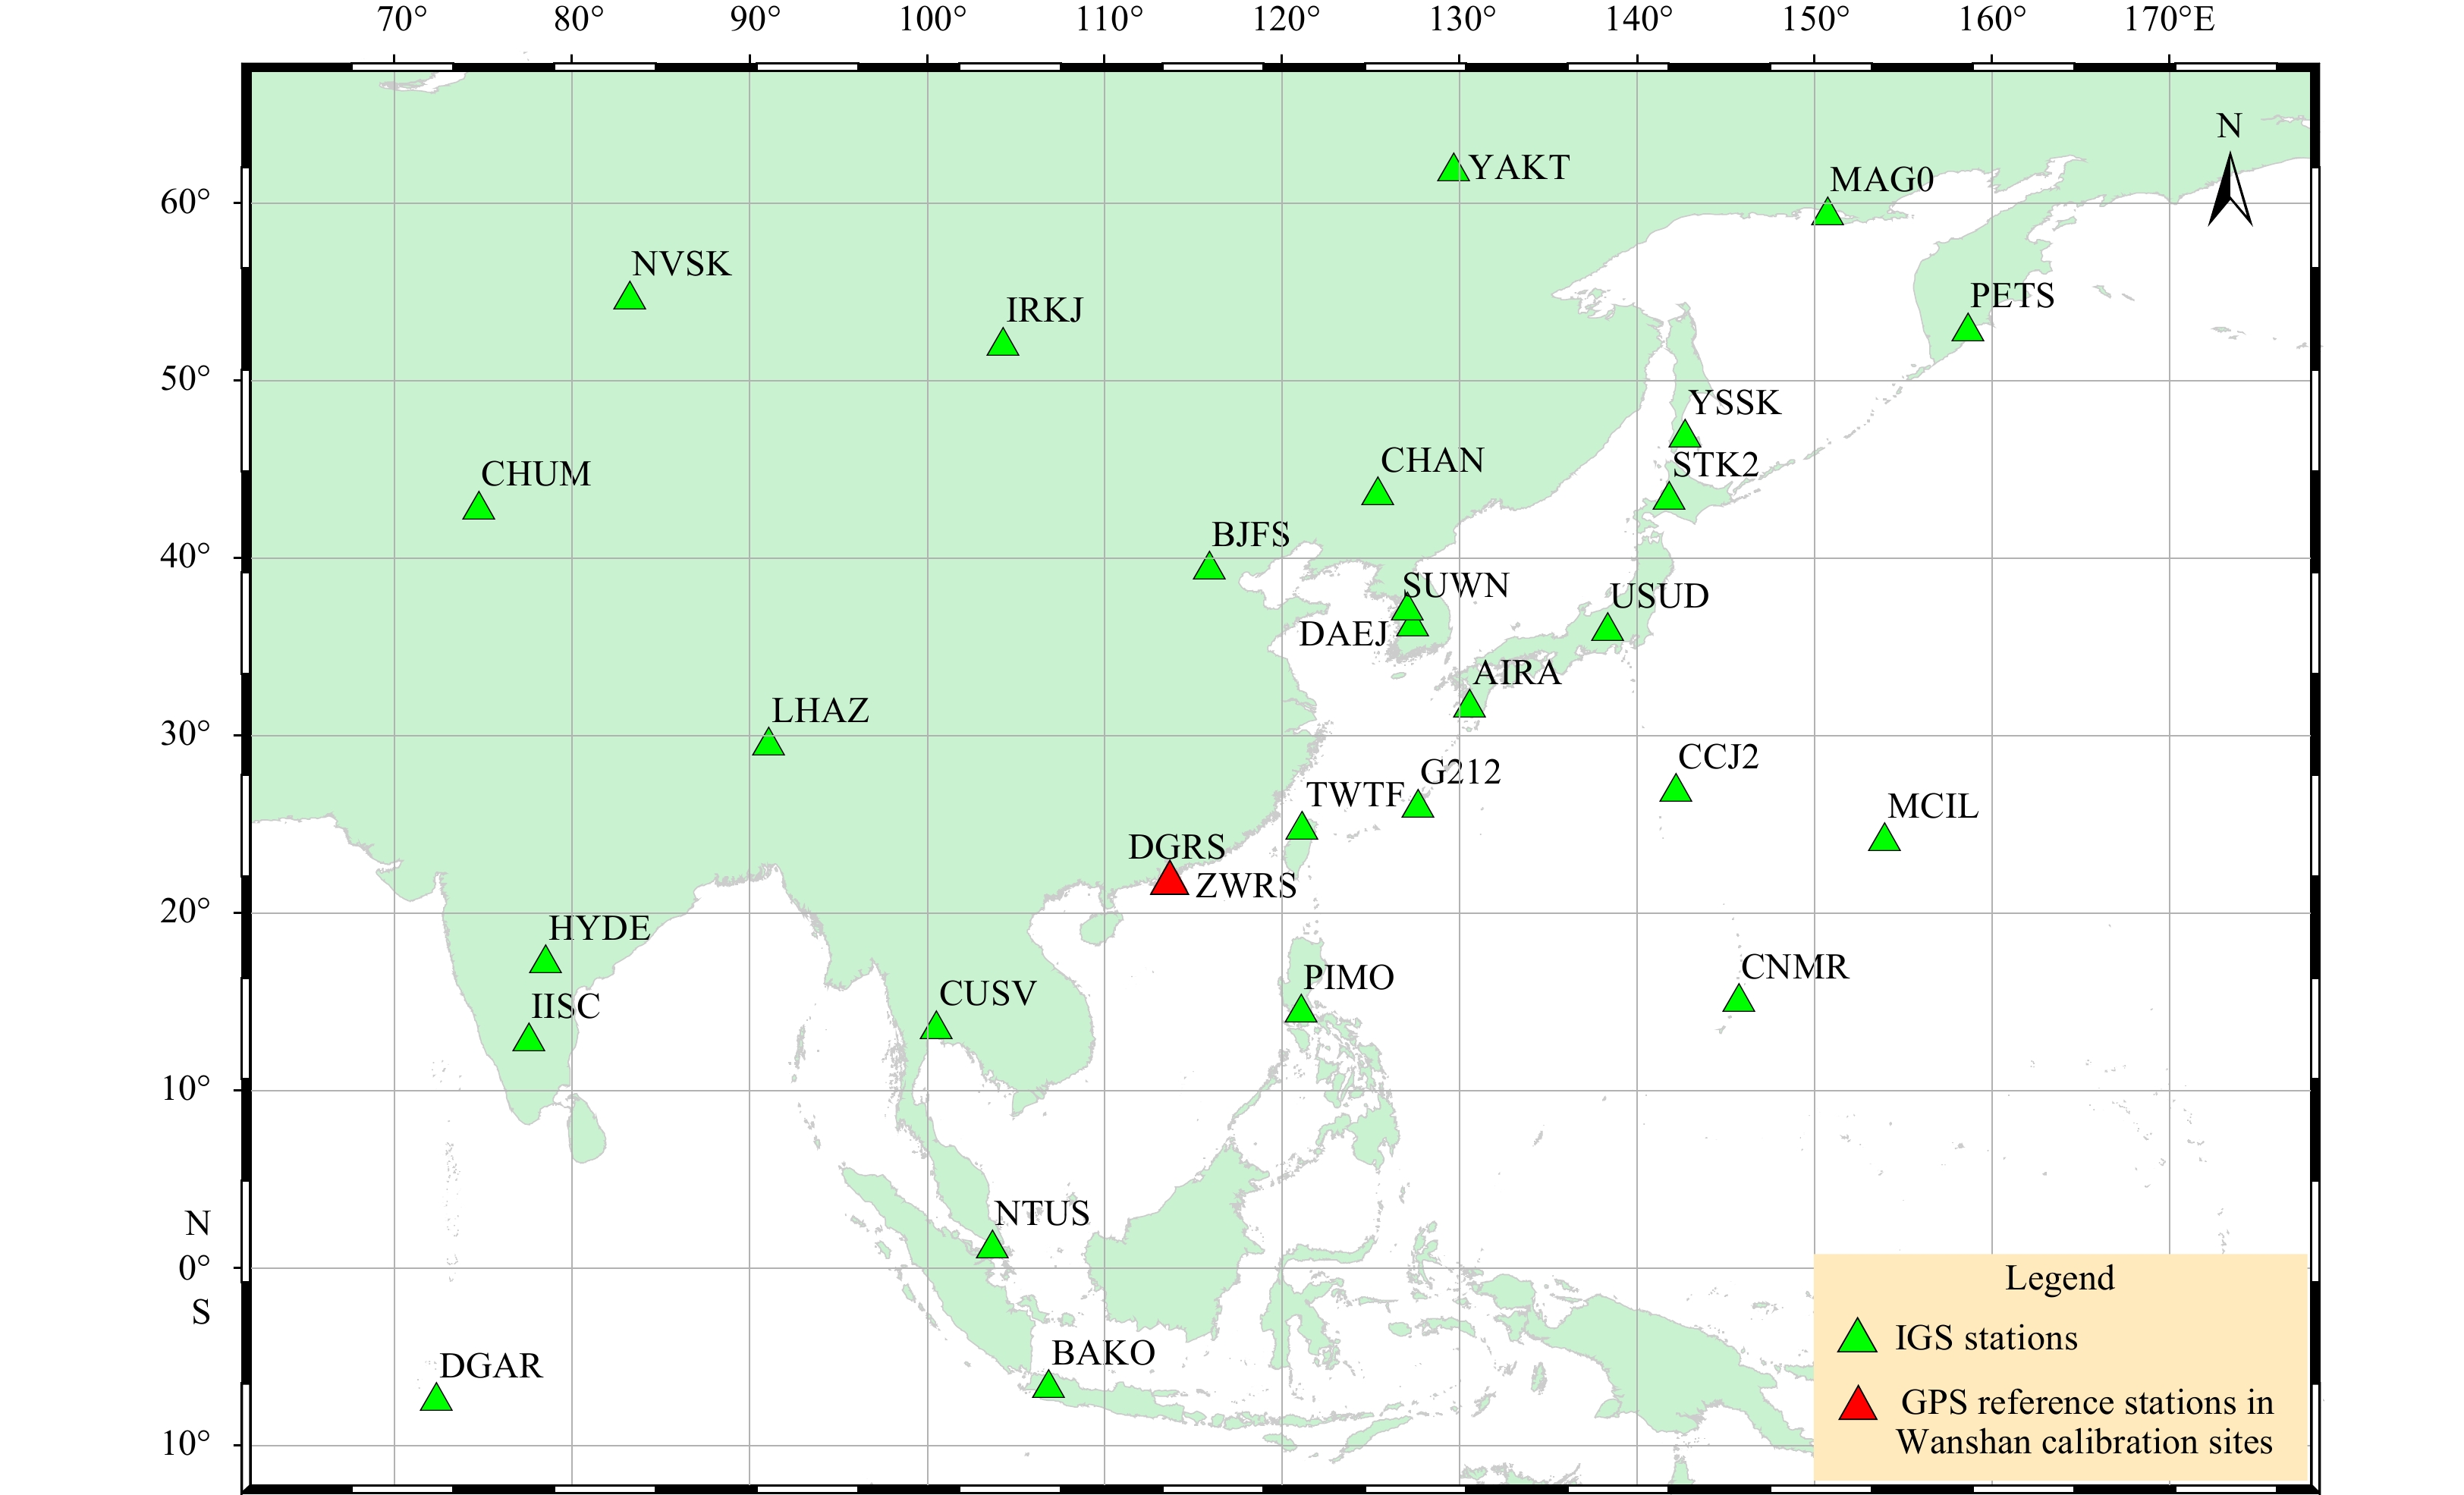
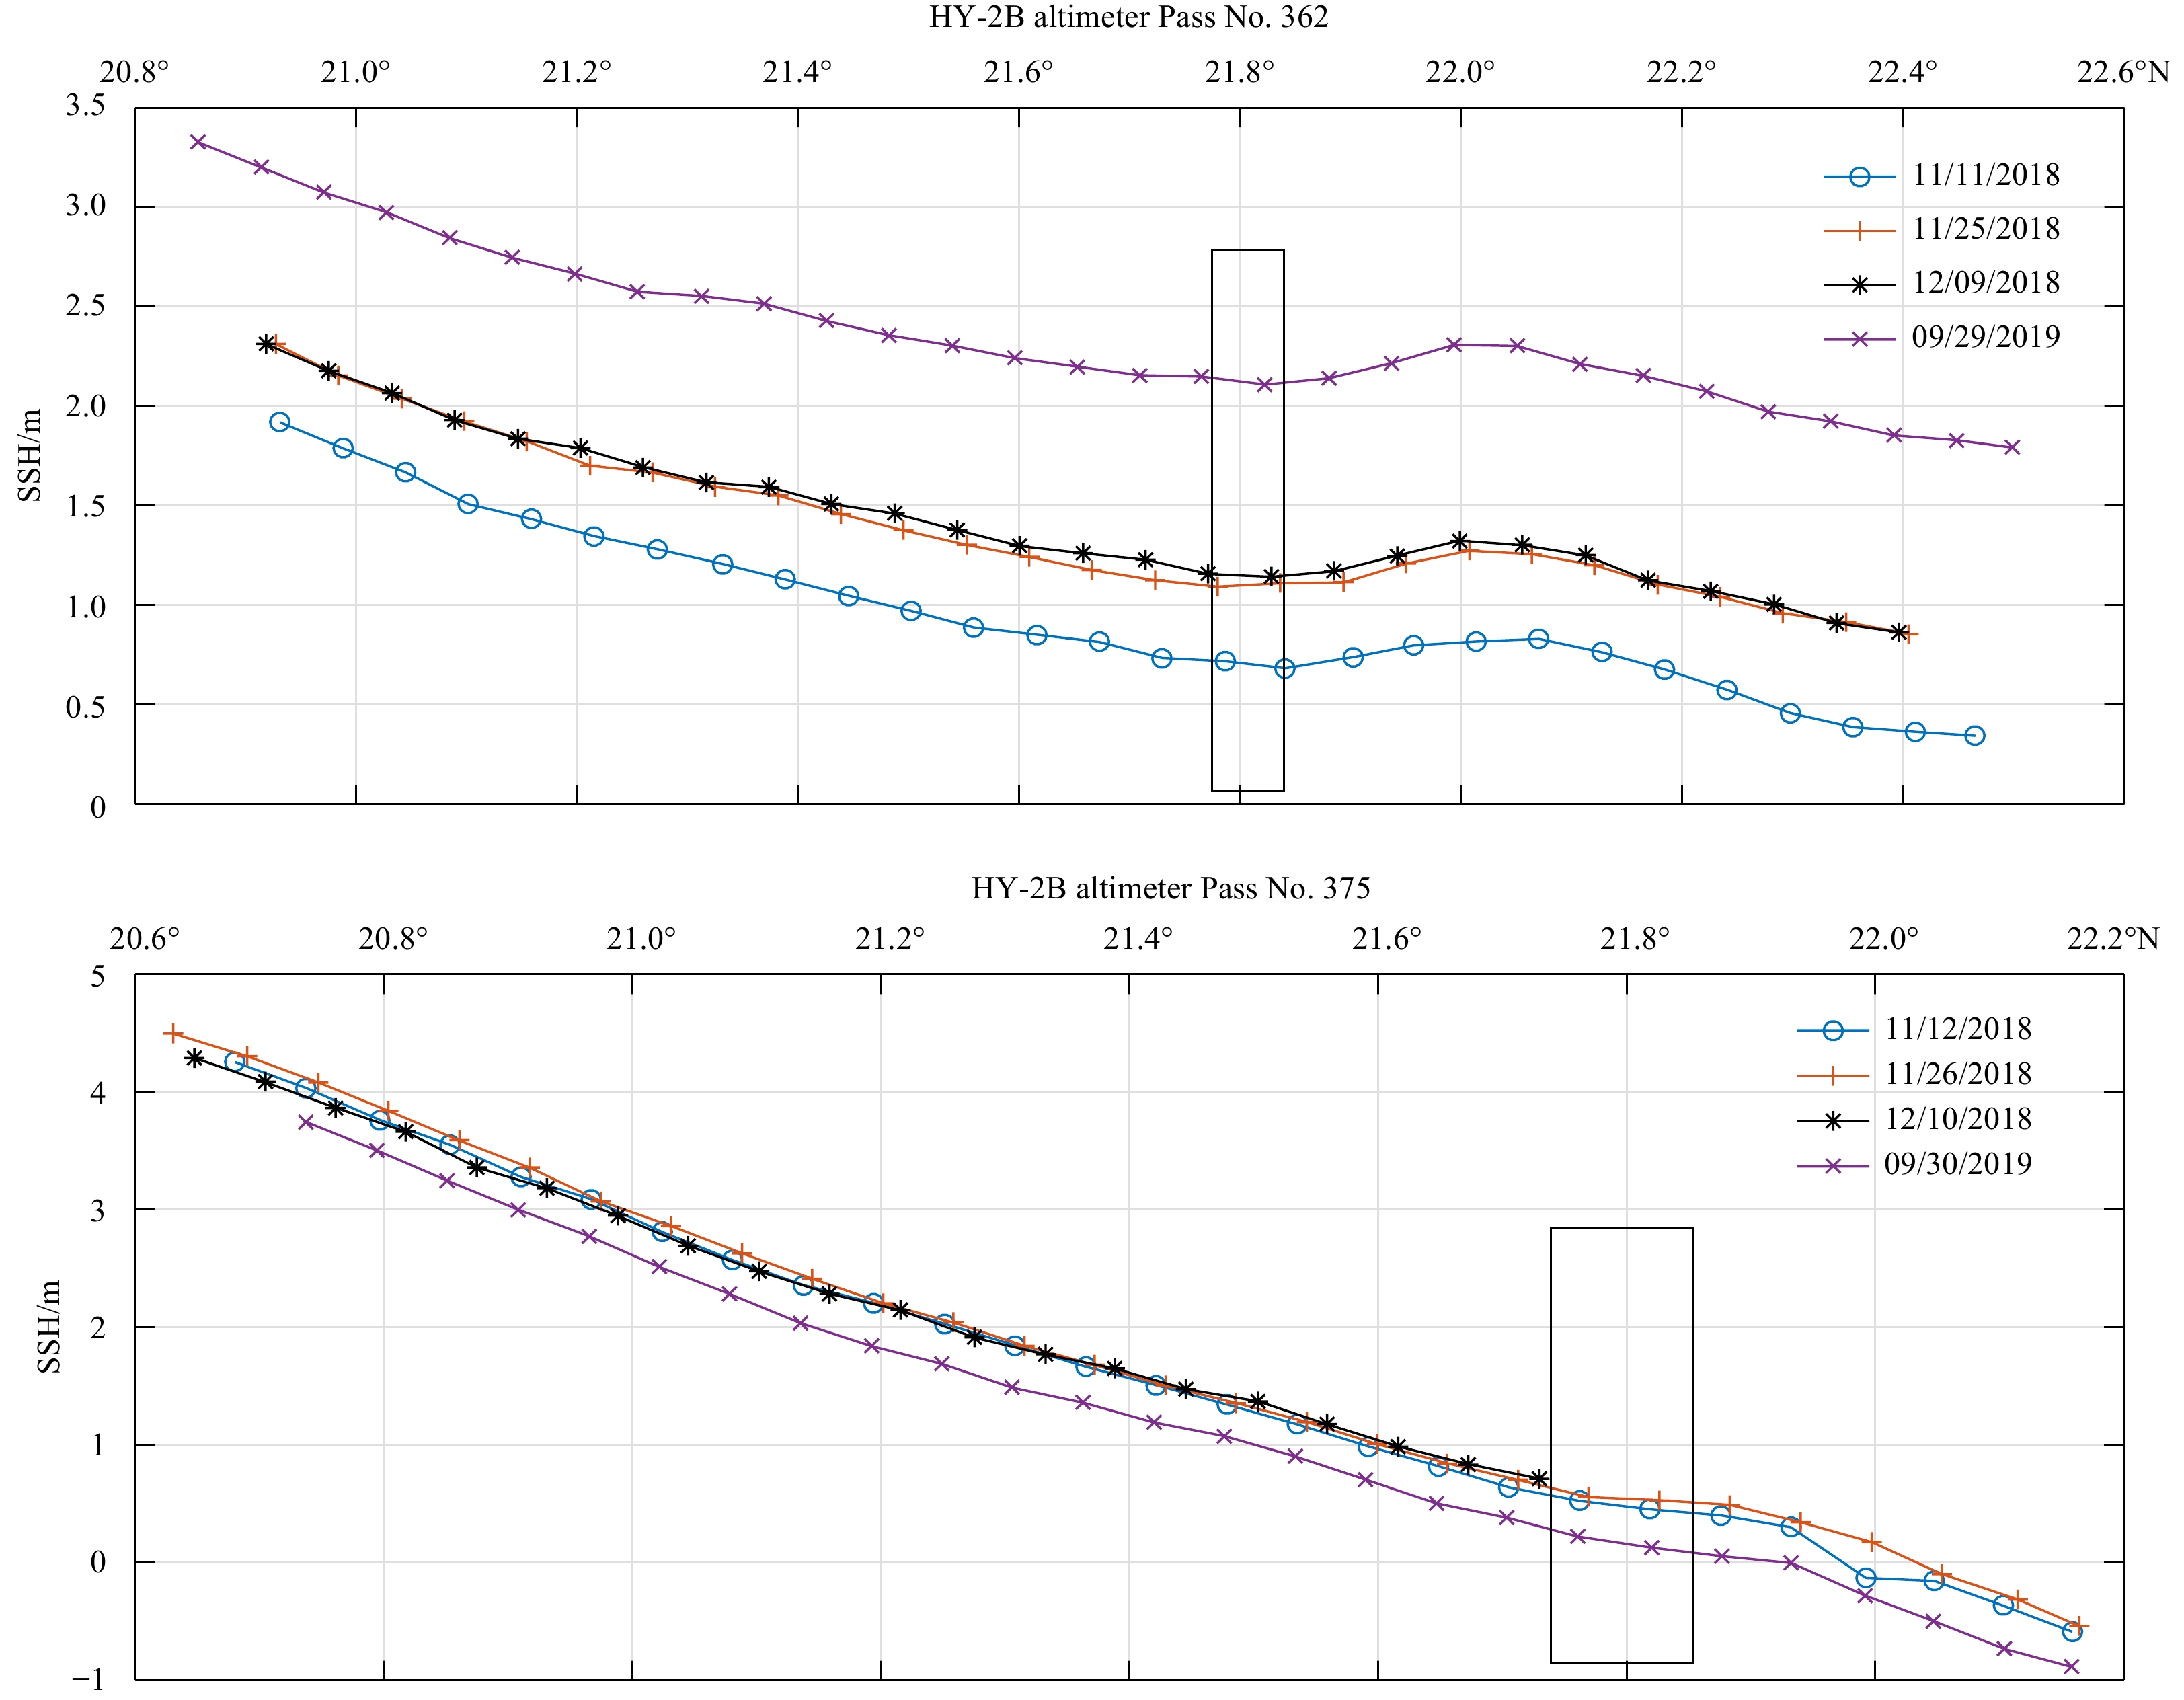
Abstract:
Satellite altimeter needs to be calibrated to evaluate the accuracy of sea surface height data. The dedicated altimeter calibration field needs to establish a special calibration strategy and needs to evaluate its calibration ability. This paper describes absolute calibration of HY-2B altimeter SSH using the GPS calibration method at the newly Wanshan calibration site, located in the Wanshan Islands, China. There are two HY-2B altimeter passes across the Wanshan calibration site. Pass No. 362 is descending and the ground track passes the east of Dan’gan Island. Pass No. 375 is ascending and crosses the Zhiwan Island. The GPS data processing strategy of Wanshan calibration site was established and the accuracy of GPS calibration method of Wanshan calibration site was evaluated. Meanwhile, the processing strategies of the HY-2B altimeter for the Wanshan calibration site were established, and a dedicated geoid model data were used to benefit the calibration accuracy. The time-averaged HY-2B altimeter bias was approximately 2.12 cm with a standard deviation of 2.08 cm. The performance of the HY-2B correction microwave radiometer was also evaluated in terms of the wet troposphere path delay and showed a mean difference −0.2 cm with a 1.4 cm standard deviation with respect to the in situ GPS radiosonde.