

Dynamic genetic analysis for body weight and main length ratio in turbot Scophthalmus maximus
-
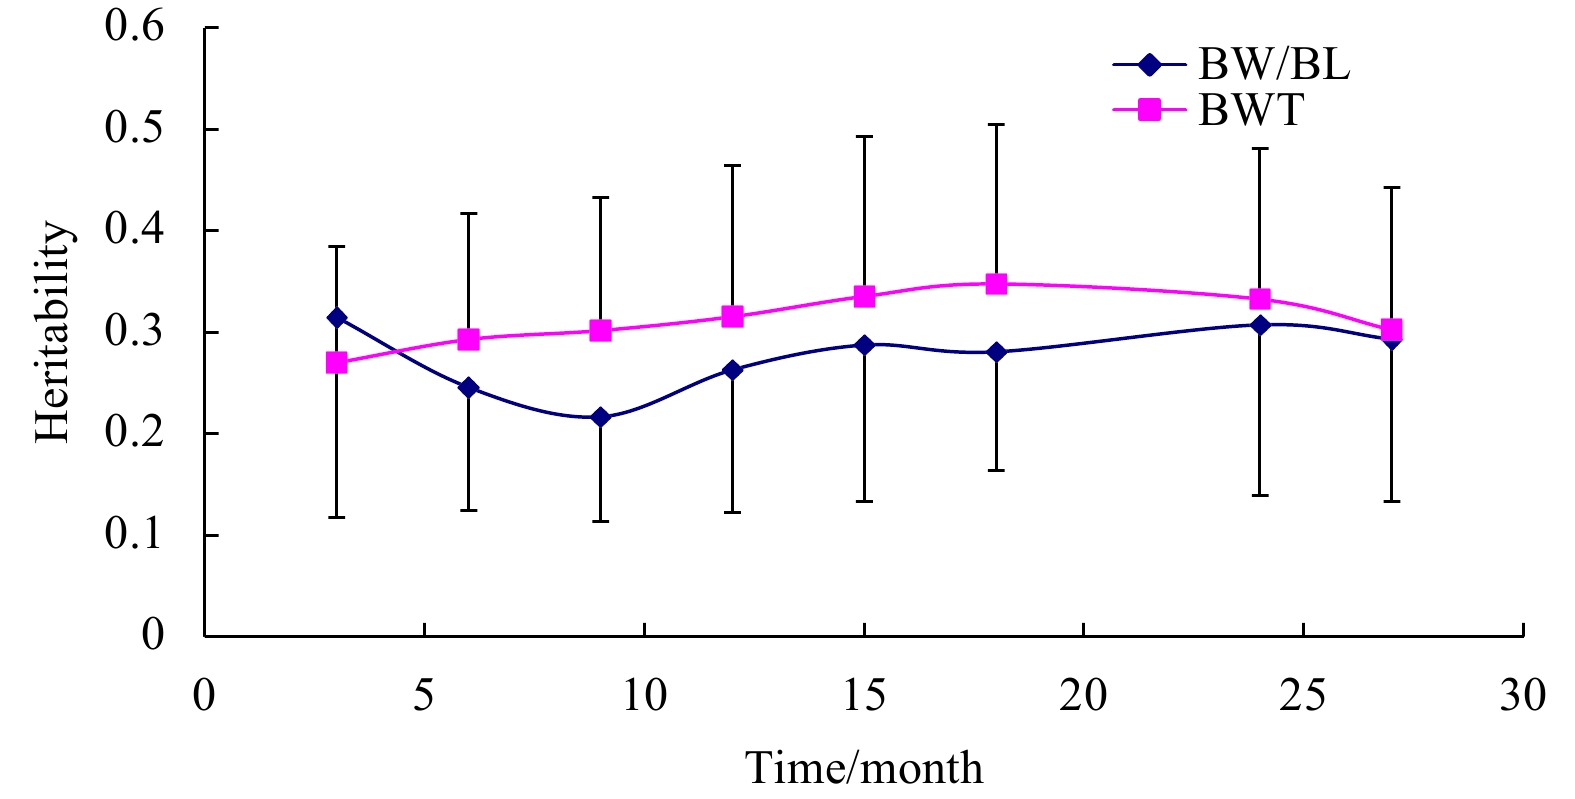
Abstract: The objective of this study was to estimate genetic parameters of body width (BW) to body length (BL) ratio (BW/BL) and of body weight traits (BWT) in turbot, and to elucidate the genetic mechanism of the two traits during ontogeny by dynamic genetic analysis. From 3 to 27 months, BW, BL and BWT of each communally stocked fish were measured every 3 months. The BW/BL ratio was measured at different sampling ages. A two-trait animal model was used for genetic evaluation of traits. The results showed that the heritability values of BW/BL ratio ranged from 0.216 8 to 0.314 8, corresponding to moderate heritability. The BWT heritability values ranged from 0.270 2 to 0.347 9 corresponding to moderate heritability. The heritability of BW/BL ratio was lower than that of BWT, except at 3 months of age. Genetic correlation between BW/BL ratio and BWT decreased throughout the measurement period. Genetic correlations were higher than the phenotypic correlations. The current results for estimating genetic parameters demonstrate that the BW/BL ratio could be used as a phenotypic marker of fast-growing turbot, and the BW/BL ratio and BWT could be improved simultaneously through selective breeding.
-
Key words:
- turbot /
- dynamic genetic analysis /
- body weight /
- main length ratio /
- heritability /
- genetic correlation
-

Figure 1. Morphometric characteristics measured in turbot. BL represents body length, TL total length, and BW body width excluding dorsal and pelvic fins.
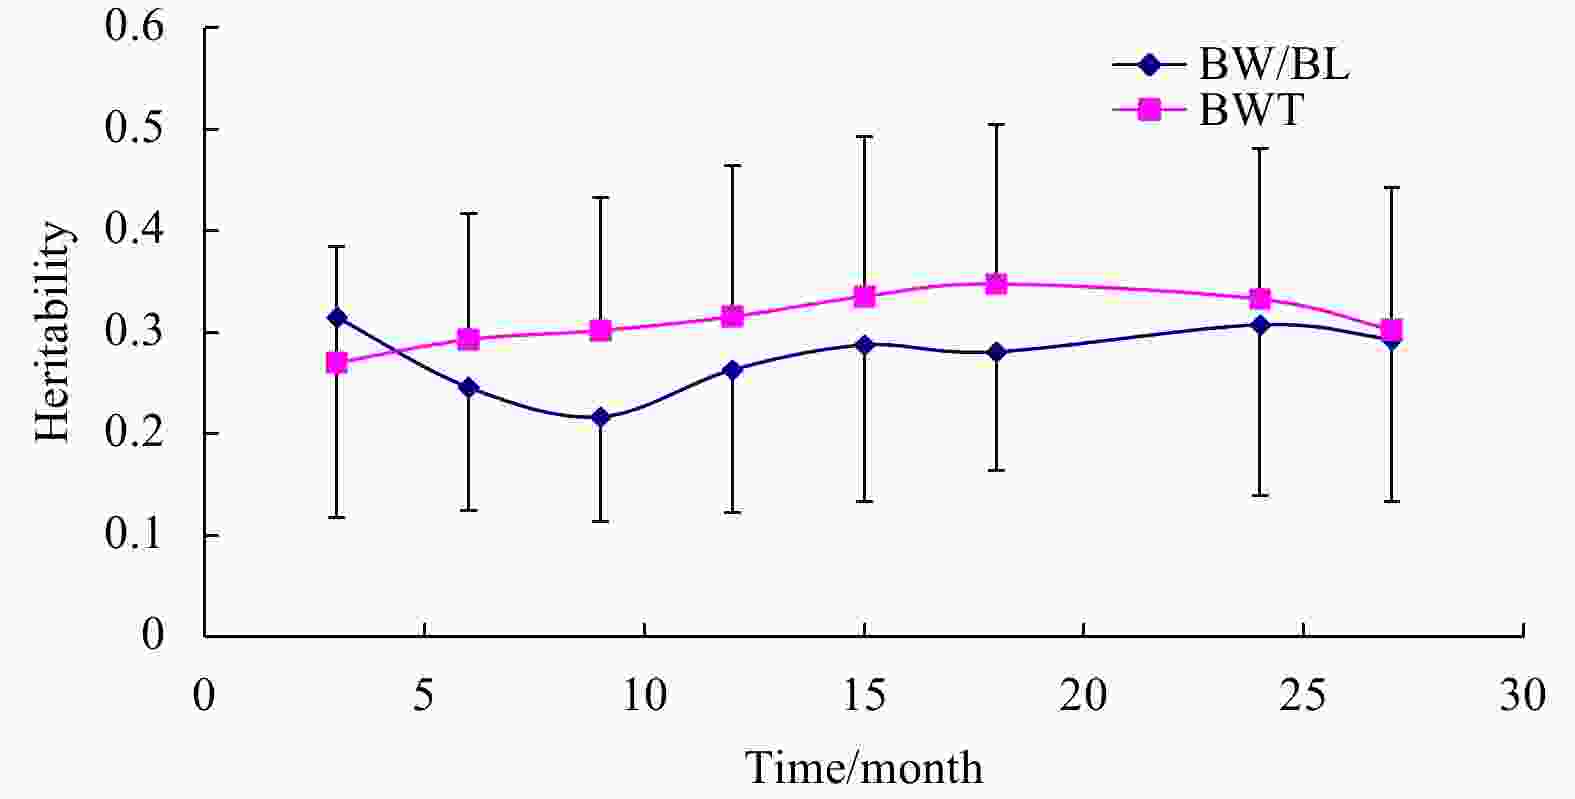
Figure 2. Comparison of heritability of body width/body length (BW/BL) ratio, and body weight (BWT).
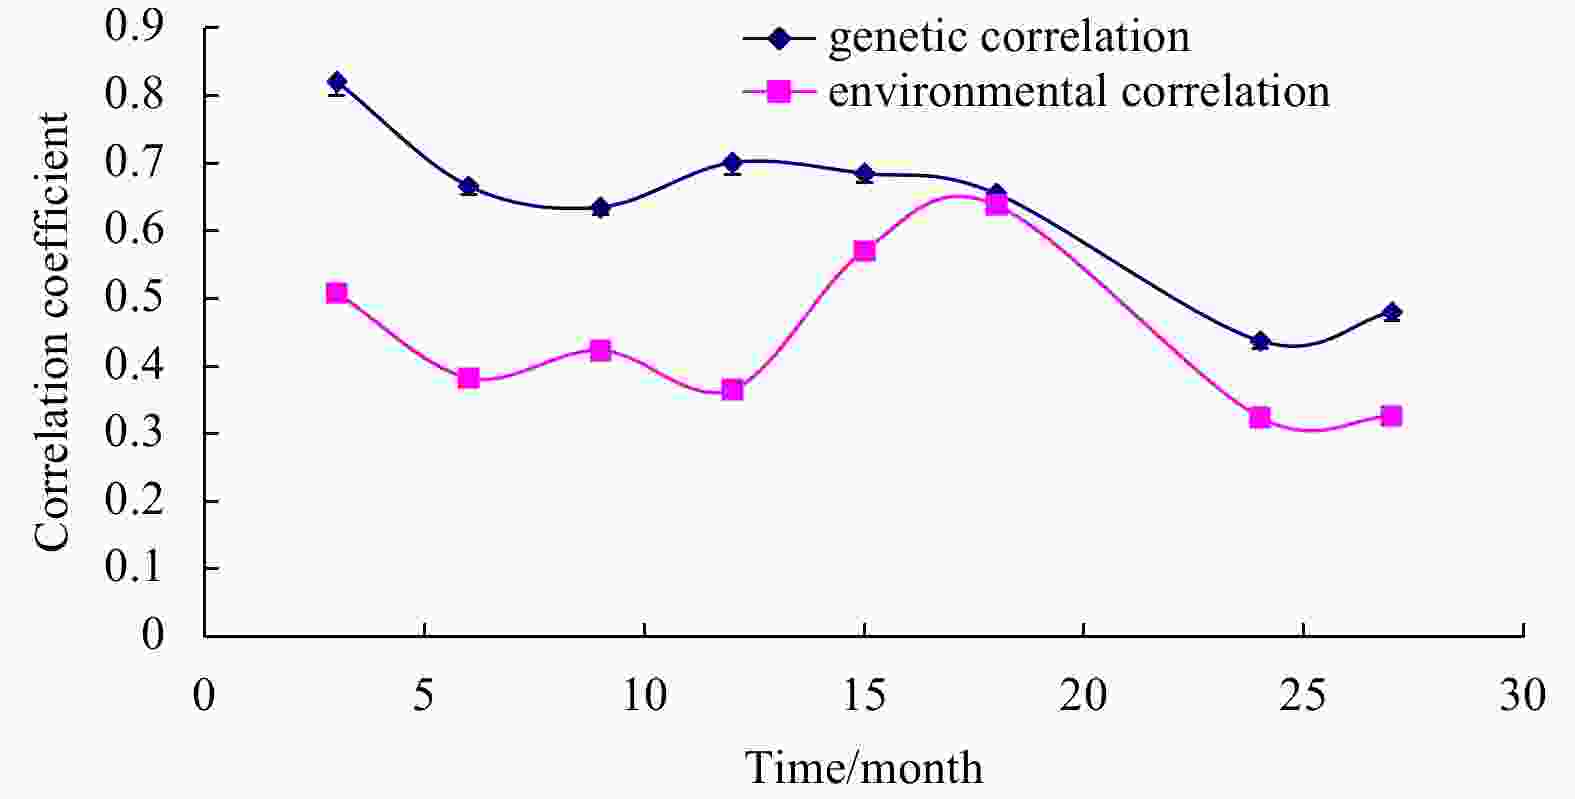
Figure 3. Comparison of genetic and environmental correlations between body width/body length (BW/BL) ratio and body weight (BWT) at different sampling ages.
Table 1. Ratio of body width/body length (BW/BL ratio), and mean body weight (BWT) for each family of turbot at different sampling ages (mean±standard deviation)
Months of age BW/BL ratio BWT/g 3 0.605 6±0.022 9 2.979 1±0.916 2 6 0.784 4±0.025 0 31.125 0±9.181 8 9 0.786 1±0.024 2 164.718 8±21.533 3 12 0.813 0±0.034 5 376.412 0±47.118 2 15 0.795 4±0.0314 593.113 1±76.325 6 18 0.827 9±0.0572 2 996.683 4±107.853 4 24 0.819 3±0.048 9 1 776.437 8±183.442 1 27 0.856 7±0.332 1 2 031.383 2±279.890 1  下载: 导出CSV
Table 2. Variance components and heritability (h2) with standard errors (mean±SE) of BW/BL ratio of turbot at different sampling ages
Months of age $\sigma _a^2$ $\sigma _f^2$ $\sigma _e^2$ ${h^2}$ 3 0.150 0±0.003 8 0.112 8±0.000 1 0.213 7±0.002 7 0.314 8±0.197 1 6 0.122 9±0.012 6 0.083 4±0.000 3 0.293 6±0.013 5 0.245 8±0.121 5 9 0.256 3±0.017 1 0.100 0±0.002 4 0.825 9±0.057 8 0.216 8±0.103 2 12 1.265 2±0.135 9 0.130 0±0.018 4 3.413 4±0.179 3 0.263 1±0.140 6 15 5.580 3±1.274 9 0.089 0±0.001 3 13.729 5±2.458 1 0.287 6±0.154 3 18 18.720 2±3.946 6 0.100 0±0.003 5 47.807 3 ±7.073 4 0.280 9±0.117 2 24 27.350 8±5.001 2 0.095 1±0.001 4 61.501 1±10.713 0 0.307 5±0.168 3 27 33.331 1±8.701 1 0.016 0±0.001 1 80.312 1±12.673 2 0.293 3±0.159 8 Note: $\sigma _a^2$ represents additive genetic variance, $\sigma _f^2$ full-sib variance, $\sigma _e^2$ residual variance, h2 heritability, BW body width, and BL body length.
下载: 导出CSV
Table 3. Variance components and heritability (h2) with standard errors (mean±SE) of BWT of turbot at different sampling ages
Months of age $\sigma _a^2$ $\sigma _f^2$ $\sigma _e^2$ ${h^2}$ 3 0.101 5±0.019 3 0.223 4±0.001 1 0.050 7±0.040 2 0.270 2±0.114 3 6 12.365 1±6.124 1 0.194 4±0.001 2 29.685 3±11.365 1 0.293 1±0.123 6 9 276.341 6±66.606 0 0.210 6±0.001 4 638.884 3±105.131 6 0.301 9±0.130 8 12 700.260 0±101.098 6 0.240 6±0.001 7 2 218.330 0±283.817 3 0.315 6±0.149 0 15 1 950.150 0±196.814 1 0.199 6±0.001 1 3 858.514 0±415.443 1 0.335 6±0.157 7 18 4 047.030 0±527.378 4 0.210 6±0.001 4 7 584.000 1±994.087 2 0.347 9±0.156 5 24 29 679.150 0±3 043.887 7 0.205 7±0.001 5 59 496.430 0±6 211.432 1 0.332 816±0.148 8 27 49 368.553 2±6 003.087 0 0.126 6±0.001 2 113 783.300 1±2 0583.076 3 0.302 5±0.140 1 Note: $\sigma _a^2$ represents additive genetic variance, $\sigma _f^2$full-sib variance, $\sigma _e^2$residual variance, h2 heritability, and BWT body weight.
下载: 导出CSV
Table 4. Genetic and phenotypic correlations between BW/BL ratio and BWT
Months of age Genetic correlation (${r_{{A_1}{A_2}}}$) Phenotypic correlation (${r_{{P_1}{P_2}}}$) 3 0.821 3±0.021 6** 0.534 0±0.000 3** 6 0.666 7±0.013 7** 0.402 7±0.000 1** 9 0.635 5±0.012 1** 0.435 9±0.000 2** 12 0.701 4±0.017 8** 0.392 9±0.000 0** 15 0.685 4±0.014 2** 0.581 2±0.000 0** 18 0.655 5±0.011 9** 0.638 3±0.000 1** 24 0.437 8±0.012 2** 0.336 1±0.000 0** 27 0.480 4±0.012 9** 0.340 1±0.000 0** Note: * A significant correlation (P<0.05); ** a highly significant correlation (P<0.01). BW represents body width, BL body length, and BWT body weight.
下载: 导出CSV
-
[1] Ankorion Y, Moav R, Wohlfarth G W. 1992. Bidirectional mass selection for body shape in common carp. Genetics Selection Evolution, 24: 43. doi: 10.1186/1297-9686-24-1-43 [2] Awan Z K, Masood S A, Naseem Z, et al. 2015. Genetic variability and trait association for relative growth rate and green fodder yield in Sorghum bicolorl. International Journal of Biology Pharmacy and Allied Sciences, 4(8): 5566–5576 [3] Battaglene S C. 1996. Hormone-induced ovulation of sand whiting (Sillago ciliate). Asian Fisheries Science, 9: 169–176 [4] Blonk R J W, Komen J, Tenghe A, et al. 2010. Heritability of shape in common sole, Solea solea, estimated from image analysis data. Aquaculture, 307(1–2): 6–11. doi: 10.1016/j.aquaculture.2010.06.025 [5] Cardellino R, Rovira J. 1987. Mejoramiento Genético Animal (in Spanish). Buenos Aires: Hemisferio Sur, 253 [6] De Oliveira C A L, Ribeiro R P, Yoshida G M, et al. 2016. Correlated changes in body shape after five generations of selection to improve growth rate in a breeding program for Nile tilapia Oreochromis niloticus in Brazil. Journal of Applied Genetics, 57(4): 487–493. doi: 10.1007/s13353-016-0338-5 [7] Gilmour A R, Gogel B J, Cullis B R, et al. 2009. ASReml User Guide Release 3.0. Hemel Hempstead, UK: VSN International Ltd [8] Gjerde B, Schaeffer L R. 1989. Body traits in rainbow trout: II. Estimates of heritabilities and of phenotypic and genetic correlations. Aquaculture, 80(1–2): 25–44. doi: 10.1016/0044-8486(89)90271-8 [9] Guan C T. 2016. Annual Report 2015 of National Technology System for Flatfish Culture Industry (in Chinese). Qingdao: China Ocean University Press, 179–242 [10] Islam M S, Khan S, Khanam D, et al. 1993. Genetic variability and path analysis in cucumber (Cucumis sativus L.). Bangladesh Journal of Plant Breeding and Genetics, 6: 45–51 [11] Kause A, Ritola O, Paananen T, et al. 2003. Big and beautiful? Quantitative genetic parameters for appearance of large rainbow trout. Journal of Fish Biology, 62(3): 610–622. doi: 10.1046/j.1095-8649.2003.00051.x [12] Kirkpatrick M, Heckman N. 1989. A quantitative genetic model for growth, shape, reaction norms, and other infinite-dimensional characters. Journal of Mathematical Biology, 27(4): 429–450. doi: 10.1007/BF00290638 [13] Kirkpatrick M, Lofsvold D, Bulmer M. 1990. Analysis of the inheritance, selection and evolution of growth trajectories. Genetics, 124(4): 979–993 [14] Kumar V, Singh D K, Panchbhaiya A, et al. 2017. Correlation and path coefficient analysis studies in midseason cauliflower (Brassica oleracea var. botrytis L.). Journal of Pharmacognosy and Phytochemistry, 6(4): 1130–1137 [15] Lei Jilin. 2010. Annual Report 2009 of National Technology System for Flatfish Culture Industry (in Chinese). Qingdao: China Ocean University Press, 75–120 [16] Lei Jilin. 2012. Annual Report 2011 of National Technology System for Flatfish Culture Industry (in Chinese). Qingdao: China Ocean University Press, 117–176 [17] Lei Jilin. 2013. AnnuaL Report 2012 of National Technology System for Flatfish Culture Industry (in Chinese). Qingdao: China Ocean University Press, 183–242 [18] Lei Jilin. 2014. Annual Report 2013 of National Technology System for Flatfish Culture Industry (in Chinese). Qingdao: China Ocean University Press, 187–246 [19] Lei Jilin. 2015. AnnuAl Report 2014 of National Technology System for Flatfish Culture Industry (in Chinese). Qingdao: China Ocean University Press, 199–266 [20] Liu Yongxin, Jiang Li, Liu Haijin, et al. 2014. Phenotypic and genetic parameter estimation of morphological traits related to axial body growth in Japanese flounder. Fisheries Science, 80(2): 317–321. doi: 10.1007/s12562-014-0704-3 [21] Liu Yongxin, Sun Zhaohui, Wang Yufen, et al. 2015. Genetic analysis for main length ratio associated with morphological traits in Japanese flounder Paralichthys olivaceus. Journal of Fish Biology, 86(3): 1129–1138. doi: 10.1111/jfb.12635 [22] Ma Aijun, Chen Chao, Lei Jilin, et al. 2006. Turbot Scophthalmus maximus: stocking density on growth, pigmentation and feed conversion. Chinese Journal of Oceanology and Limnology, 24(3): 307–312. doi: 10.1007/BF02842633 [23] National Technology Research and Development Center for Flounder Industry. 2011. AnnuaL Report 2010 of National Technology System for Flatfish Culture Industry (in Chinese). Qingdao: China Ocean University Press, 129–174 [24] Rana N P, Pandit M K. 2011. Studies on the genetic variability, character association and path analysis in snake gourd (Trichosanthes anguina L.) genotypes. Journal of Crop and Weed, 7(2): 91–96 [25] Ruan X H, Wang W J, Kong J, et al. 2011. Isolation and analysis of microsatellites in the genome of turbot (Scophthalmus maximus L.). African Journal of Biotechnology, 10(4): 507–518 [26] Saatci M, Dewi I A, Aksoy A R. 2003. Application of REML procedure to estimate the genetic parameters of weekly liveweights in one-to-one sire and dam pedigree recorded Japanese quail. Journal of Animal Breeding and Genetics, 120(1): 23–28. doi: 10.1046/j.1439-0388.2003.00370.x [27] Said E M, Fatiha H. 2015. Genotypic variation in fruit characters in some genotypes of watermelon cultivated in Morocco. International Journal of Agronomy and Agricultural Research, 6(4): 130–137 [28] Schaeffer L R. 2004. Application of random regression models in animal breeding. Livestock Production Science, 86(1–3): 35–45. doi: 10.1016/S0301-6226(03)00151-9 [29] Shikano T. 2007. Quantitative genetic parameters for growth-related and morphometric traits of hatchery-produced Japanese flounder Paralichthys olivaceus in the wild. Aquaculture Research, 38(12): 1248–1253. doi: 10.1111/j.1365-2109.2007.01749.x [30] Shimada Y, Shikano T, Murakami N, et al. 2007. Maternal and genetic effects on individual variation during early development in Japanese flounder Paralichthys olivaceus. Fisheries Science, 73(2): 244–249. doi: 10.1111/j.1444-2906.2007.01330.x [31] Wang Xin’an, Ma Aijun. 2015. Comparison of the morphometric dynamics of fast-growing and slow-growing strains of turbot Scophthalmus maximus. Chinese Journal of Oceanology and Limnology, 33(4): 890–894. doi: 10.1007/s00343-015-4195-6 [32] Wang Xin’an, Ma Aijun. 2016. Comparison of four nonlinear growth models for effective exploration of growth characteristics of turbot Scophthalmus maximus fish strain. African Journal of Biotechnology, 15(40): 2251–2258. doi: 10.5897/AJB2016.15490 [33] Wang Xin’an, Ma Aijun, Huang Zhihui, et al. 2010. Heritability and genetic correlation of survival in turbot (Scophthalmus maximus). Chinese Journal of Oceanology and Limnology, 28(6): 1200–1205. doi: 10.1007/s00343-010-9014-5 [34] Wang Xin’an, Ma Aijun, Ma Deyou. 2015. Developmental quantitative genetic analysis of body weights and morphological traits in the turbot, Scophthalmus maximus. Acta Oceanologica Sinica, 34(2): 55–62. doi: 10.1007/s13131-015-0618-7 [35] Xu Liyong, Wang Weiji, Kong Jie, et al. 2015. Estimates of heritability and correlation for growth traits of Turbot (Scophthalmus maximus L.) under low temperature conditions. Acta Oceanologica Sinica, 34(2): 63–67. doi: 10.1007/s13131-015-0616-9 [36] Zhang Tianshi, Kong Jie, Liu Baosuo, et al. 2014. Genetic parameter estimation for juvenile growth and upper thermal tolerance in turbot (Scophthalmus maximus Linnaeus). Acta Oceanologica Sinica, 33(8): 106–110. doi: 10.1007/s13131-014-0460-3 -


 点击查看大图

计量
- 文章访问数: 446
- HTML全文浏览量: 98
- PDF下载量: 154
- 被引次数: 0

