

Accuracy assessment of global ocean tide models in the South China Sea using satellite altimeter and tide gauge data
-
Abstract: In this study, to meet the need for accurate tidal prediction, the accuracy of global ocean tide models was assessed in the South China Sea (0°–26°N, 99°–121°E). Seven tide models, namely, DTU10, EOT11a, FES2014, GOT4.8, HAMTIDE12, OSU12 and TPXO8, were considered. The accuracy of eight major tidal constituents (i.e., Q1, O1, P1, K1, N2, M2, S2 and K2) were assessed for the shallow water and coastal areas based on the tidal constants derived from multi-mission satellite altimetry (TOPEX and Jason series) and tide gauge observations. The root mean square values of each constituent between satellite-derived tidal constants and tide models were found in the range of 0.72–1.90 cm in the deep ocean (depth>200 m) and 1.18–5.63 cm in shallow water area (depth<200 m). Large inter-model discrepancies were noted in the Strait of Malacca and the Taiwan Strait, which could be attributable to the complicated hydrodynamic systems and the paucity of high-quality satellite altimetry data. In coastal regions, an accuracy performance was investigated using tidal results from 37 tide gauge stations. The root sum square values were in the range of 9.35–19.11 cm, with the FES2014 model exhibiting slightly superior performance.
-
Key words:
- accuracy assessment /
- tide model /
- satellite altimetry /
- tide gauge /
- South China Sea
-
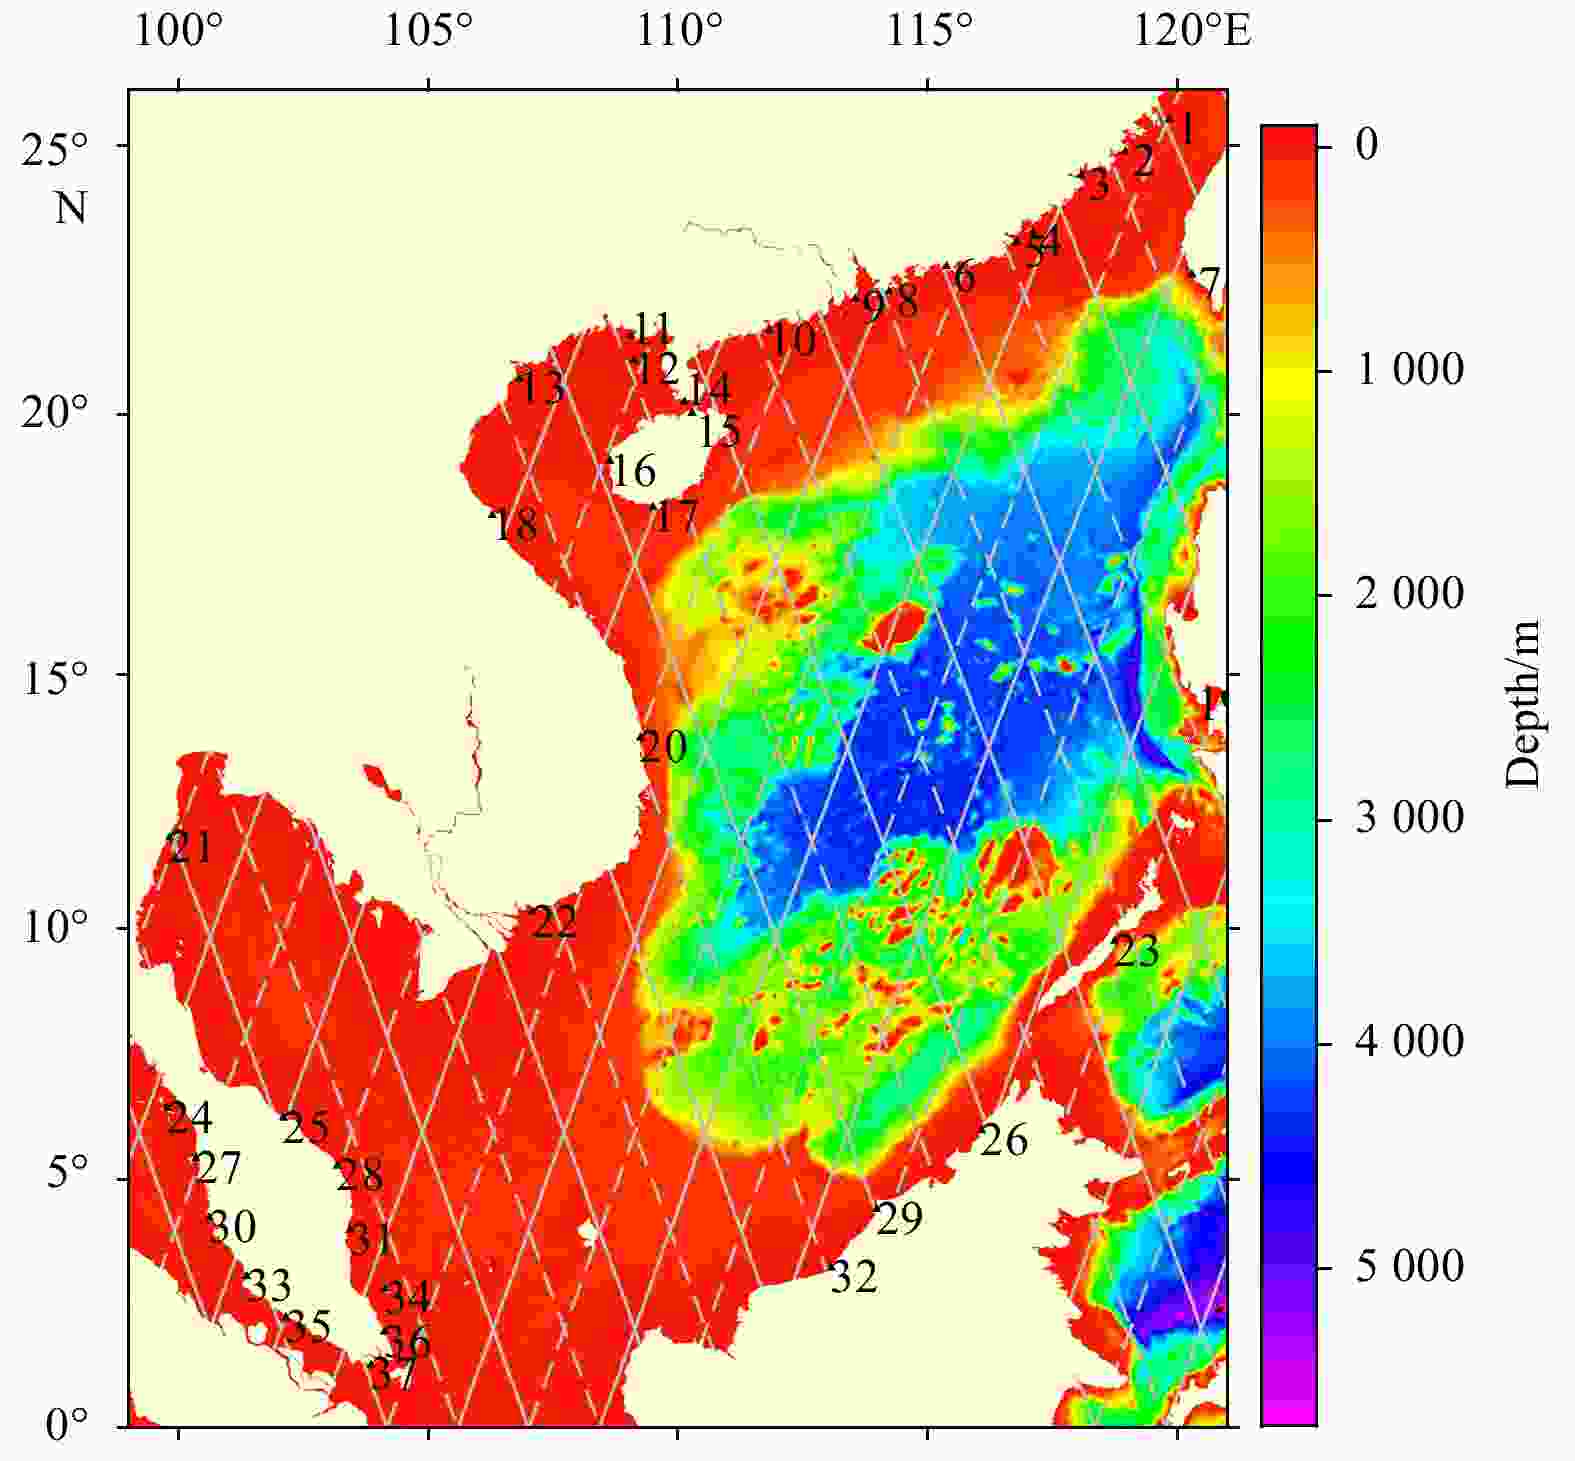
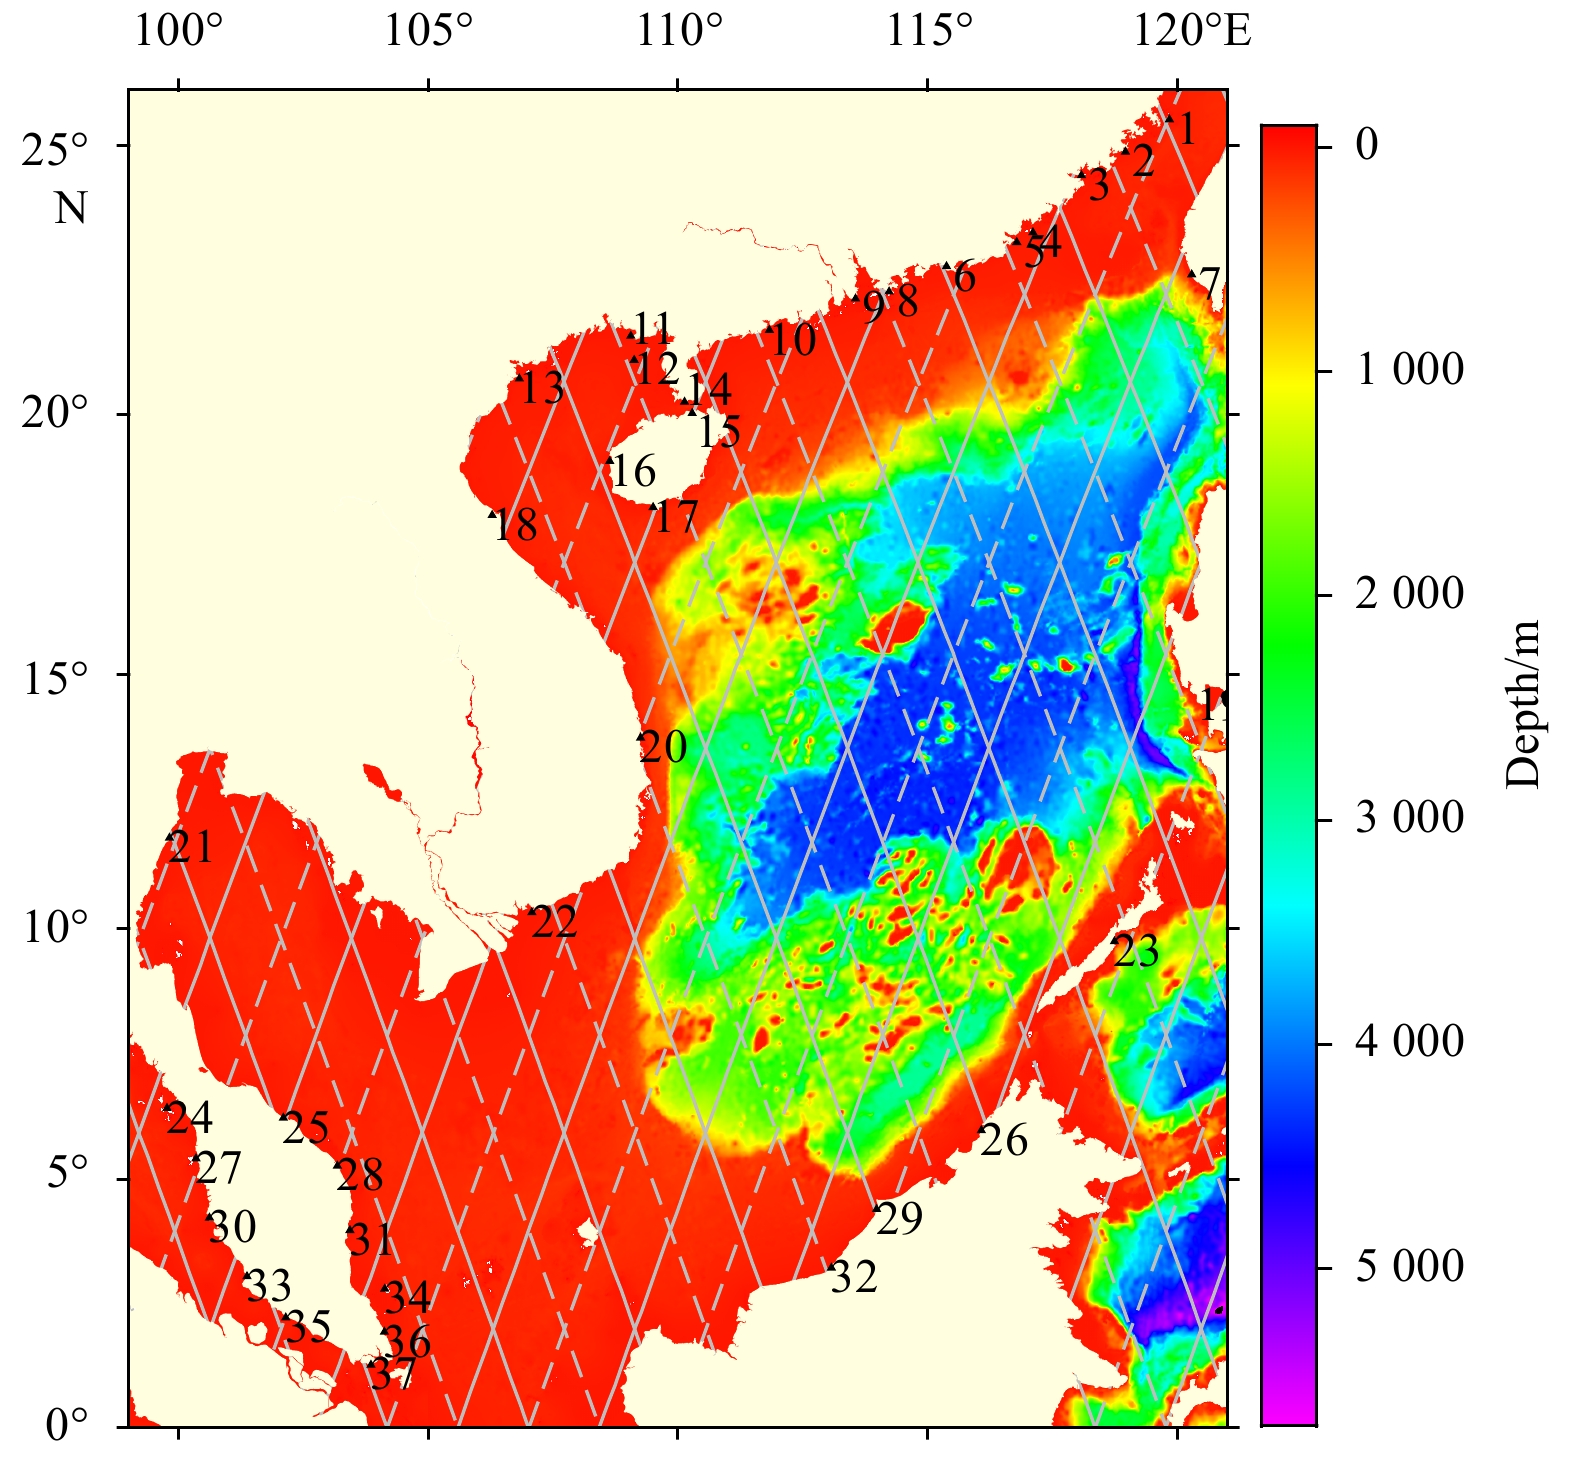
Figure 1. Distribution of satellite altimetry along-track points and tide gauge stations in the study area. The numbered dark triangles denote the 37 tide gauges. Gray solid and dashed lines are the primary and interleaved mission tracks, respectively.
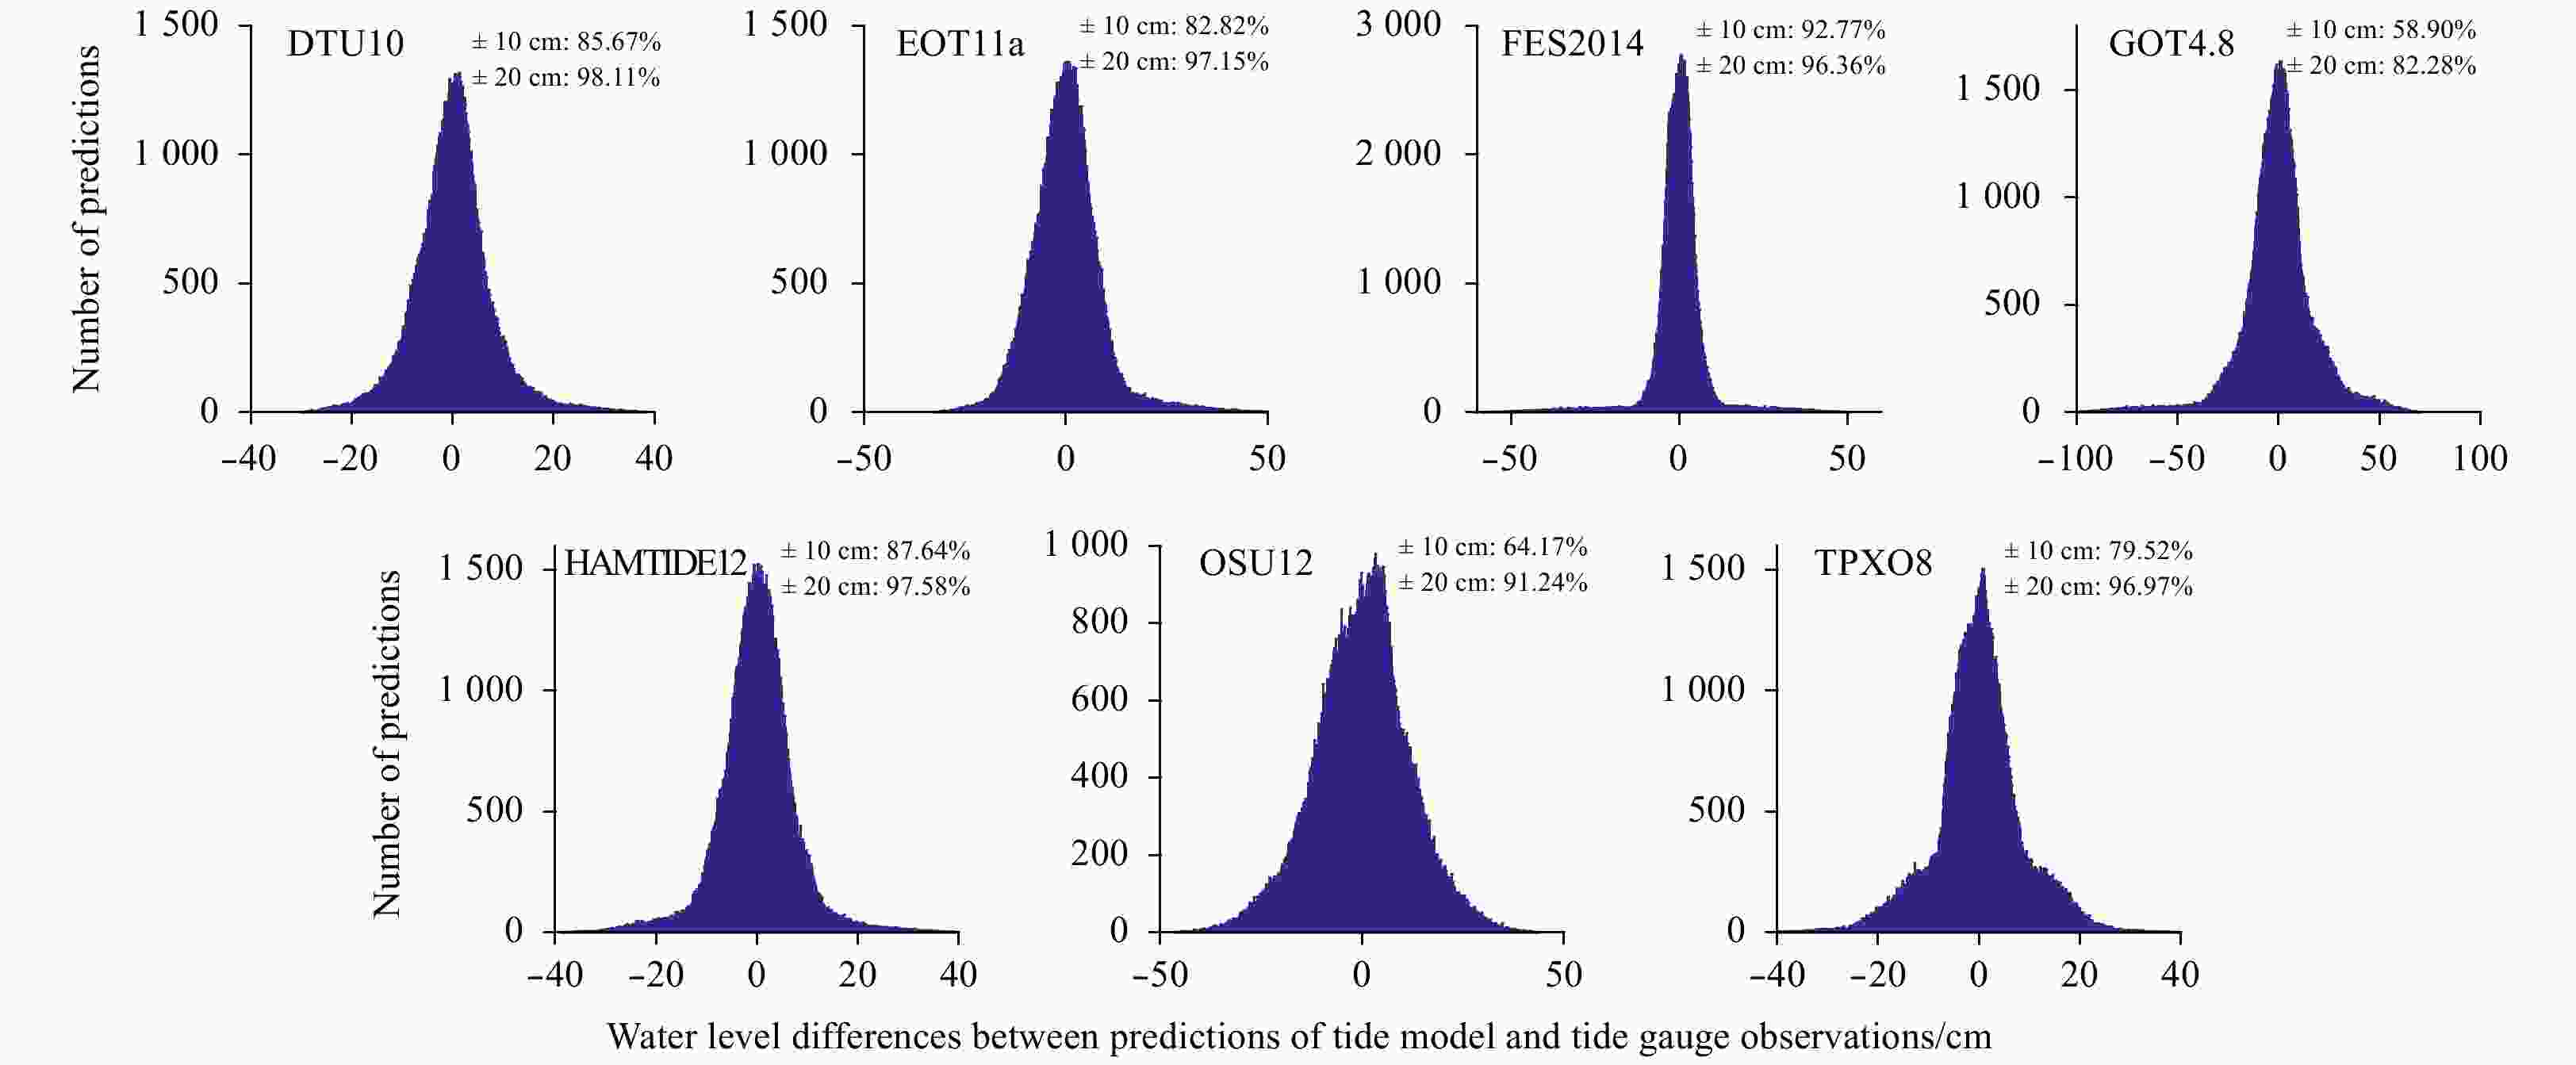
Figure 7. Comparisons between predictions of each tide model and tide gauge observations.
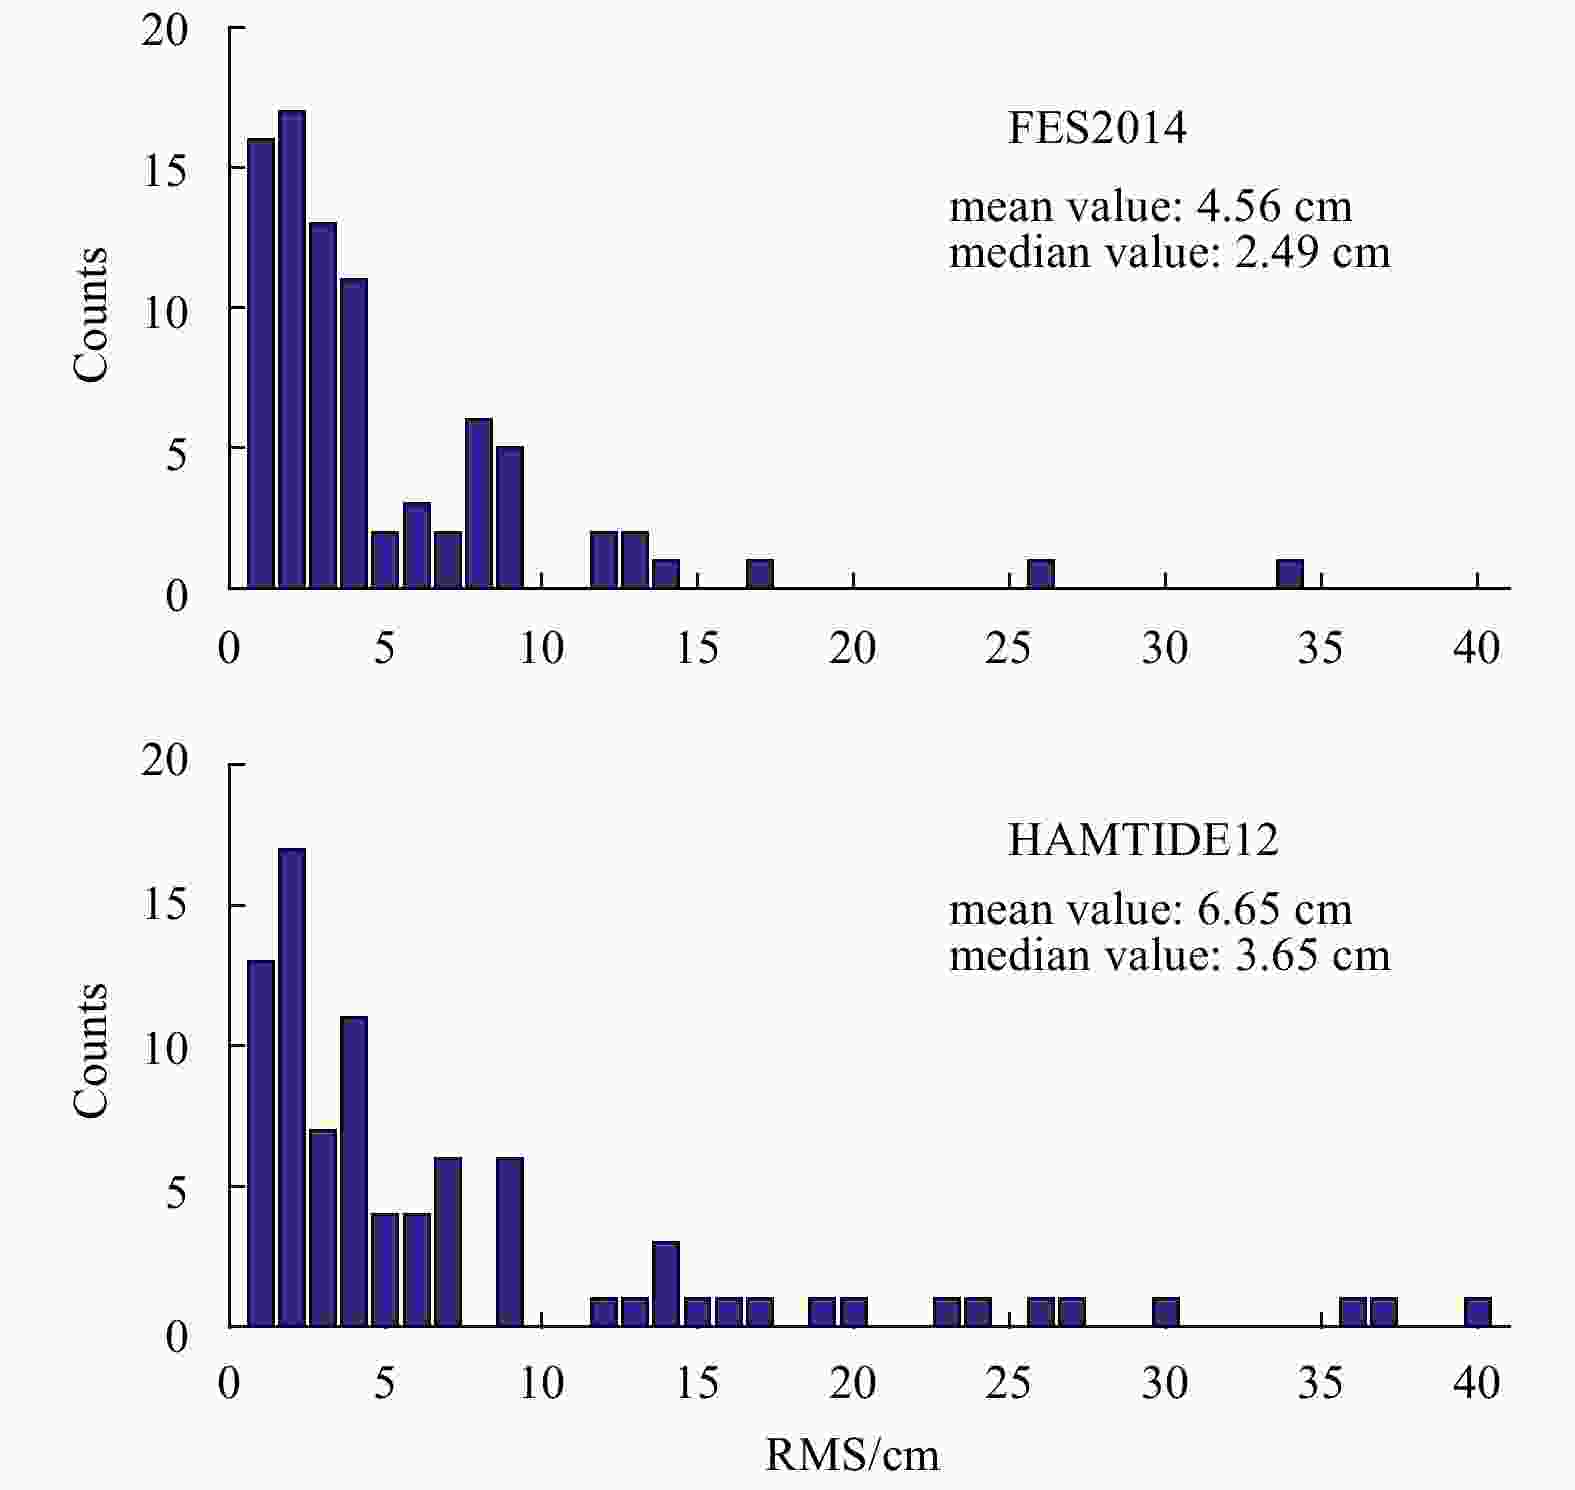
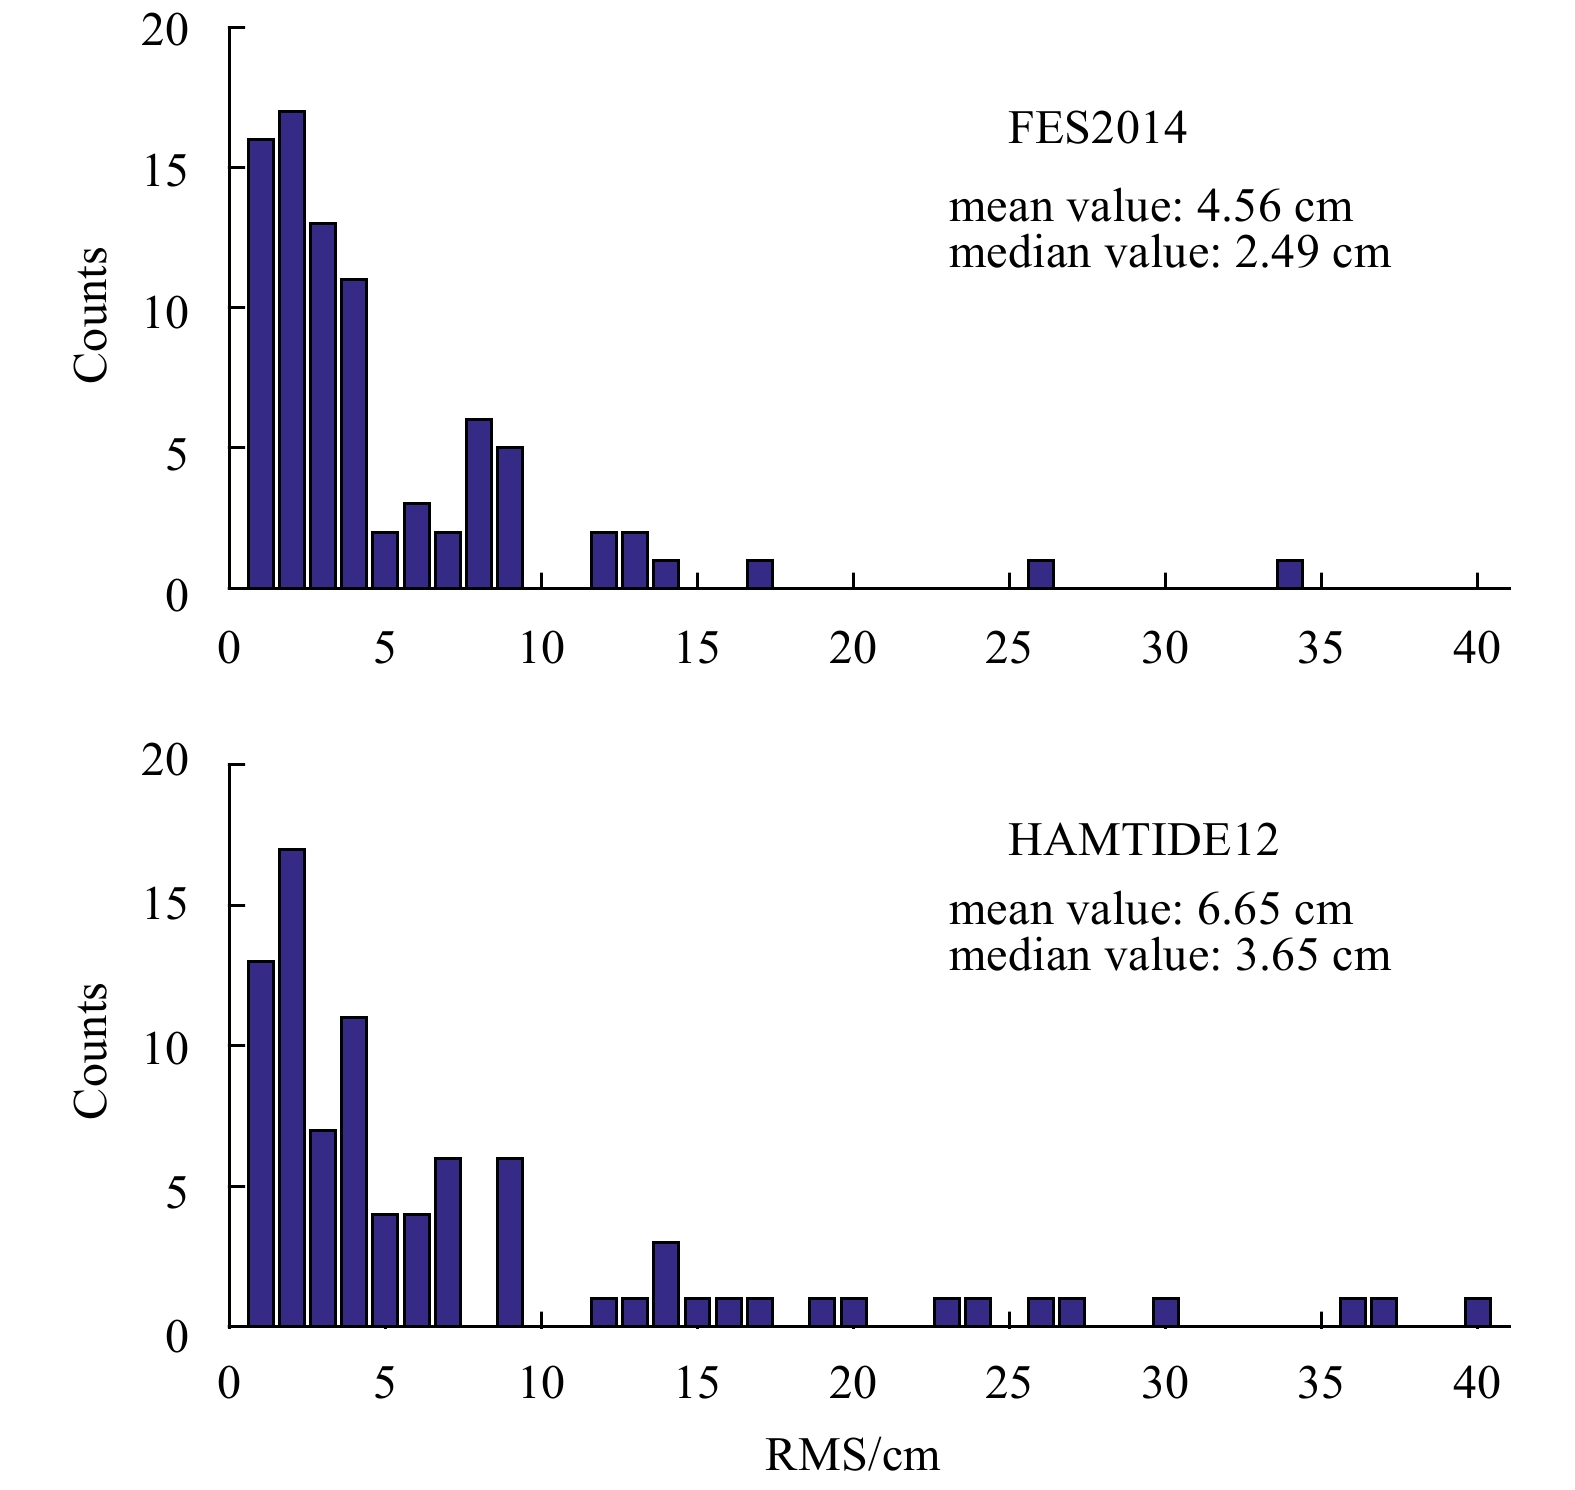
Figure 8. Histograms of RMS values in M2 between the 84 tide gauge stations and FES2014 and HAMTIDE12. Overall, 54.76% (FES 2014) and 44.05% (HAMTIDE12) of stations agreed with the corresponding model to accuracy better than 3 cm.
Table 1. The geographical coordinates, time range, amplitude and phase of the four major tidal constituents of the tide gauge stations located in the South China Sea
Station No. Name Geographic coordinate Time coverage K1 O1 M2 S2 Amplitude/cm Phase/(°) Amplitude/cm Phase/(°) Amplitude/cm Phase/(°) Amplitude/cm Phase/(°) 1 Pingtan 25.47°N, 119.83°E 2010–2012 30.41 131.19 24.71 99.99 205.32 78.05 62.52 113.20 2 Chongwu 24.88°N, 118.95°E 2010–2012 32.20 148.67 26.29 115.70 206.05 97.93 61.41 137.41 3 Xiamen 24.45°N, 118.07°E 1954–1997 34.16 163.62 27.84 122.47 184.80 120.10 54.01 163.41 4 Nanao 23.40°N, 117.10°E 2010–2012 30.24 169.44 24.94 131.15 56.44 130.59 13.90 187.35 5 Shantou 23.22°N, 116.78°E 2010–2012 29.70 170.54 24.62 131.35 33.71 129.78 6.75 198.40 6 Shanwei 22.77°N, 115.37°E 2010–2012 32.56 177.07 26.47 137.80 27.16 26.72 10.54 38.08 7 Kaohsiung 22.62°N, 120.28°E 1983–2013 17.69 165.86 15.99 129.54 18.14 350.66 6.71 350.90 8 Hong Kong 22.30°N, 114.22°E 1986–2012 35.32 166.96 28.08 121.94 39.50 7.91 15.73 27.55 9 Macau 22.17°N, 113.55°E 1978–1985 37.64 186.97 30.56 146.18 46.36 56.04 18.65 81.29 10 Zhapo 21.58°N, 111.83°E 1975–1997 41.51 195.04 35.13 149.09 64.43 61.61 27.99 92.55 11 Beihai 21.47°N, 109.05°E 2010–2012 90.67 336.14 98.36 281.53 45.47 306.41 11.05 357.97 12 Weizhou 21.02°N, 109.12°E 2010–2012 86.48 333.60 94.59 279.18 38.84 300.59 9.80 354.40 13 Hon Dau 20.67°N, 106.82°E 1960–1960 70.49 92.42 78.40 28.40 5.87 40.88 4.40 104.39 14 Haian 20.23°N, 110.13°E 2010–2012 44.26 329.66 53.67 276.37 16.35 17.28 11.18 79.36 15 Haikou 20.02°N, 110.28°E 1976–1997 37.32 335.62 44.48 281.83 22.50 26.69 12.94 81.45 16 Dongfanggang 19.11°N, 108.63°E 2010–2012 54.25 311.64 63.59 259.50 18.01 190.26 5.71 239.50 17 Sanya 18.23°N, 109.50°E 2010–2012 31.16 209.59 29.49 173.21 21.56 88.74 7.15 121.54 18 Vung Ang 18.08°N, 106.28°E 1996–1997 32.62 98.13 40.48 31.05 24.70 353.50 6.59 62.79 19 Manila 14.58°N, 120.97°E 1984–2012 32.95 198.16 28.87 153.38 19.75 63.84 7.29 95.31 20 Qui Nohn 13.77°N, 109.25°E 1994–2005 32.77 192.81 27.55 153.03 17.72 85.42 6.97 120.66 21 Ko Lak 11.80°N, 99.82°E 1985–2012 51.62 59.48 33.53 17.81 6.44 291.48 1.51 339.18 22 Vung Tau 10.33°N, 107.07°E 1986–2002 63.78 207.34 50.34 166.50 75.39 194.89 29.46 231.06 23 Puerto Princesa 9.75°N, 118.73°E 1998–2012 34.21 204.88 29.88 167.81 29.92 79.78 15.99 113.35 24 Langkawi 6.43°N, 99.77°E 1985–2012 16.70 232.40 5.19 183.55 80.12 118.28 44.48 155.80 25 Geting 6.23°N, 102.10°E 1986–2011 23.81 233.36 12.29 190.06 16.98 20.21 8.11 50.96 26 Kota Kinabalu 5.98°N, 116.07°E 1987–2011 34.78 194.53 30.07 152.82 23.59 88.36 10.20 115.43 27 Penang 5.42°N, 100.35°E 1984–2011 19.56 237.20 5.08 177.45 61.26 152.29 36.13 185.91 28 Cendering 5.27°N, 103.18°E 1984–2011 48.07 238.41 29.50 209.61 30.09 5.98 12.02 42.85 29 Miri 4.40°N, 113.97°E 1992–2011 35.84 194.52 31.35 154.15 17.81 101.45 8.68 123.43 30 Lumut 4.23°N, 100.62°E 1984–2011 21.61 246.33 3.19 159.22 74.47 241.51 34.95 275.77 31 Kuantan 3.98°N, 103.43°E 1983–2011 52.04 254.40 34.81 218.17 52.57 29.86 17.33 68.75 32 Bintulu 3.22°N, 113.07°E 1992–2011 39.80 198.57 32.18 160.95 19.04 182.12 6.02 165.73 33 Kelang 3.05°N, 101.37°E 1983–2011 19.42 264.68 3.50 48.94 137.63 284.38 69.07 325.67 34 Tioman 2.80°N, 104.13°E 1985–2011 46.14 264.23 34.56 231.25 59.16 40.80 18.43 83.16 35 Keling 2.22°N, 102.15°E 1984–2011 9.08 29.94 20.99 34.13 61.13 356.11 29.86 35.40 36 Sedili 1.93°N, 104.12°E 1986–2011 33.28 286.01 28.22 253.65 56.22 59.35 16.06 107.42 37 Tanjong Pagar 1.27°N, 103.85°E 1988–2011 30.61 350.46 29.68 306.02 79.32 91.84 32.14 138.38 Note: Column 1 is the tide gauge number used corresponding to the location in Fig. 1.  下载: 导出CSV
Table 2. Main properties of the seven ocean tide models under review
Tide models Resolution Major constituents Type Diurnal Semidiurnal DTU10 (1/8)°×(1/8)° K1, O1, P1, Q1, S1 M2, S2, N2, K2 E EOT11a (1/8)°×(1/8)° K1, O1, P1, Q1, S1 M2, S2, N2, K2, 2N2 E FES2014 (1/16)°×(1/16)° K1, O1, P1, Q1, S1 M2, S2, N2, K2, 2N2 H GOT4.8 (1/2)°×(1/2)° K1, O1, P1, Q1, S1 M2, S2, N2, K2 E HAMTIDE12 (1/8)°×(1/8)° K1, O1, P1, Q1 M2, S2, N2, K2 H OSU12 (1/4)°×(1/4)° K1, O1, P1, Q1, S1 M2, S2, N2, K2 E TPXO8 (1/30)°×(1/30)° K1, O1, P1, Q1, S1 M2, S2, N2, K2 H Note: E, empirical adjustment to an adopted prior model; H, assimilation into a barotropic hydrodynamic model.
下载: 导出CSV
Table 3. RMS values between the tide models of the South China Sea and their RSS values
Water depth Points number RMS/cm RSS/cm Q1 O1 P1 K1 N2 M2 S2 K2 8376 0.97 2.19 1.39 3.08 1.28 4.14 2.29 1.11 6.51 <200 m 4027 1.18 2.87 1.72 4.14 1.63 5.63 3.09 1.39 8.69 >200 m 4349 0.72 1.26 0.99 1.55 0.84 1.90 1.13 0.78 3.42
下载: 导出CSV
Table 4. Comparison of satellite results and tide models in shallow-water areas
Tide model RMS/cm RSS/cm Q1 O1 P1 K1 N2 M2 S2 K2 DTU10 0.91 1.75 1.56 2.16 1.23 1.90 1.48 1.16 4.43 EOT11a 0.93 2.27 1.66 3.89 1.43 4.22 2.53 1.19 7.18 FES2014 0.92 1.22 1.32 1.82 1.10 2.42 1.39 1.03 4.18 GOT4.8 1.27 3.65 2.11 5.15 2.33 6.51 3.72 1.63 10.50 HAMTIDE12 1.08 3.07 1.63 3.67 1.59 5.84 4.15 1.61 9.12 OSU12 1.48 2.94 1.79 4.16 1.65 4.22 3.08 1.43 7.96 TPXO8 1.45 1.75 1.57 2.31 1.43 3.82 2.59 1.23 6.15 Note: Bold values represent the best performance in terms of accuracy.
下载: 导出CSV
Table 5. RMS and RSS values between the models and the 37 tide gauge stations
Tide model RMS/cm RSS/cm Q1 O1 P1 K1 N2 M2 S2 K2 DTU10 1.52 7.12 2.32 5.96 1.97 9.92 5.42 1.90 15.14 EOT11a 0.95 3.59 1.47 4.20 2.77 10.11 6.07 2.12 13.59 FES2014 1.04 4.08 2.14 3.96 1.46 6.13 2.79 1.42 9.35 GOT4.8 1.30 5.89 2.11 6.02 2.70 11.99 4.79 2.29 16.01 HAMTIDE12 1.38 7.44 1.66 6.12 4.78 13.30 7.45 3.53 19.11 OSU12 1.46 5.58 1.66 4.89 4.28 8.19 5.36 2.41 13.41 TPXO8 1.23 5.36 1.91 3.82 3.16 14.60 7.41 2.62 18.26
下载: 导出CSV
-
[1] Amante C, Eakins B W. 2009. ETOPO1 1 arc-minute global relief model: procedures, data sources and analysis. In: National Oceanic and Atmospheric Administration. NOAA Technical Memorandum NESDIS NGDC-24. Boulder, Colorado: National Geophysical Data Center, NOAA, 1–19, doi: 10.7289/V5C8276M [2] Andersen O B, Woodworth P L, Flather R A. 1995. Intercomparison of recent ocean tide models. Journal of Geophysical Research: Oceans, 100(C12): 25261–25282. doi: 10.1029/95JC02642 [3] Carrere L, Lyard F, Cancet M, et al. 2015. FES 2014, a new tidal model on the global ocean with enhanced accuracy in shallow seas and in the Arctic region. In: EGU General Assembly 2015. Vienna, Austria: EGU [4] Chen Ming, Murali K, Khoo B C, et al. 2005. Circulation modelling in the strait of Singapore. Journal of Coastal Research, 21(5): 960–972 [5] Cheng Yongcun, Andersen O B. 2011. Multimission empirical ocean tide modeling for shallow waters and polar seas. Journal of Geophysical Research: Oceans, 116(C11): C11001. doi: 10.1029/2011JC007172 [6] Cheng Yongcun, Xu Qing, Zhang Yuan. 2016. Tidal estimation from TOPEX/Poseidon, Jason primary, and Interleaved missions in the Bohai, Yellow, and East China seas. Journal of Coastal Research, 32(4): 966–973. doi: 10.2112/JCOASTRES-D-14-00209.1 [7] Cherniawsky J Y, Foreman M G G, Crawford W R, et al. 2001. Ocean tides from TOPEX/Poseidon sea level data. Journal of Atmospheric and Oceanic Technology, 18(4): 649–664. doi: 10.1175/1520-0426(2001)018<0649:OTFTPS>2.0.CO;2 [8] Daher V B, de Oliveira Vieira Paes R C, França G B, et al. 2015. Extraction of tide constituents by harmonic analysis using altimetry satellite data in the Brazilian coast. Journal of Atmospheric and Oceanic Technology, 32(3): 614–626. doi: 10.1175/JTECH-D-14-00091.1 [9] Desportes E, Obligis E, Eymard L. 2007. On the wet tropospheric correction for altimetry in coastal regions. IEEE Transactions on Geoscience and Remote Sensing, 45(7): 2139–2149. doi: 10.1109/TGRS.2006.888967 [10] Dorandeu J, Le Traon P Y. 1999. Effects of global mean atmospheric pressure variations on mean sea level changes from TOPEX/Poseidon. Journal of Atmospheric and Oceanic Technology, 16(9): 1279–1283. doi: 10.1175/1520-0426(1999)016<1279:EOGMAP>2.0.CO;2 [11] Egbert G D, Bennett A F, Foreman M G G. 1994. TOPEX/POSEIDON tides estimated using a global inverse model. Journal of Geophysical Research: Oceans, 99(C12): 24821–24852. doi: 10.1029/94JC01894 [12] Egbert G D, Erofeeva S Y. 2002. Efficient inverse modeling of barotropic ocean tides. Journal of Atmospheric and Oceanic Technology, 19(2): 183–204. doi: 10.1175/1520-0426(2002)019<0183:EIMOBO>2.0.CO;2 [13] Egbert G D, Ray R D. 2000. Significant dissipation of tidal energy in the deep ocean inferred from satellite altimeter data. Nature, 405(6788): 775–778. doi: 10.1038/35015531 [14] Fang Guohong. 1986. Tide and tidal current charts for the marginal seas adjacent to China. Chinese Journal of Oceanology and Limnology, 4(1): 1–16. doi: 10.1007/BF02850393 [15] Fang Guohong, Kwok Y K, Yu Kejun, et al. 1999. Numerical simulation of principal tidal constituents in the South China Sea, Gulf of Tonkin and Gulf of Thailand. Continental Shelf Research, 19(7): 845–869. doi: 10.1016/S0278-4343(99)00002-3 [16] Fok H S, Iz H B, Shum C K, et al. 2010. Evaluation of ocean tide models used for Jason-2 altimetry corrections. Marine Geodesy, 33(S1): 285–303. doi: 10.1080/01490419.2010.491027 [17] Fok H S. 2012. Ocean tides modeling using satellite altimetry [dissertation]. Columbus, OH, USA: The Ohio State University [18] Fu Yanguang, Zhou Dongxu, Zhou Xinghua, et al. 2020. Evaluation of satellite-derived tidal constituents in the South China Sea by adopting the most suitable geophysical correction models. Journal of Oceanography, 76: 183–196. doi: 10.1007/s10872-019-00537-2 [19] Fu L L, Cazenave A. 2001. Satellite Altimetry and Earth Sciences: A Handbook of Techniques and Applications. San Diego: Academic Press, 463 [20] Godin G. 1986. The use of nodal corrections in the calculation of harmonic constants. International Hydrographic Review, 63(2): 143–162 [21] Green J A M, David T W. 2013. Non-assimilated tidal modeling of the South China Sea. Deep -Sea Research Part I: Oceanographic Research Papers, 78: 42–48. doi: 10.1016/j.dsr.2013.04.006 [22] Groves G W, Reynolds R W. 1975. An orthogonalized convolution method of tide prediction. Journal of Geophysical Research, 80(30): 4131–4138. doi: 10.1029/JC080i030p04131 [23] Iliffe J C, Ziebart M K, Turner J F, et al. 2013. Accuracy of vertical datum surfaces in coastal and offshore zones. Survey Review, 45(331): 254–262. doi: 10.1179/1752270613Y.0000000040 [24] Kalnay E, Kanamitsu M, Kistle R, et al. 1996. The NCEP/NCAR 40-year reanalysis project. Bulletin of the American Meteorological Society, 77(3): 437–472. doi: 10.1175/1520-0477(1996)077<0437:TNYRP>2.0.CO;2 [25] Keysers J H, Quadros N D, Collier P A. 2015. Vertical datum transformations across the Australian littoral zone. Journal of Coastal Research, 31(1): 119–128. doi: 10.2112/JCOASTRES-D-12-00228.1 [26] Lyard F, Lefevre F, Letellier T, et al. 2006. Modelling the global ocean tides: modern insights from FES2004. Ocean Dynamics, 56(5–6): 394–415. doi: 10.1007/s10236-006-0086-x [27] Mayer-Gürr T, Savcenko R, Bosch W, et al. 2012. Ocean tides from satellite altimetry and GRACE. Journal of Geodynamics, 59–60: 28–38. doi: 10.1016/j.jog.2011.10.009 [28] Munk W H, Cartwright D E. 1966. Tidal spectroscopy and prediction. Philosophical Transactions of the Royal Society A: Mathematical, Physical and Engineering Sciences, 259(1105): 533–583. doi: 10.1098/rsta.1966.0024 [29] Pawlowicz R, Beardsley B, Lentz S. 2002. Classical tidal harmonic analysis including error estimates in MATLAB using T_TIDE. Computers & Geosciences, 28(8): 929–937. doi: 10.1016/S0098-3004(02)00013-4 [30] Ray R D. 1999. A global ocean tide model from TOPEX/POSEIDON altimetry, GOT99.2. In: NASA/TM—1999-209478. Greenbelt, MD: Goddard Space Flight Center, 58 [31] Rizal S, Damm P, Wahid M A, et al. 2012. General circulation in the Malacca Strait and Andaman Sea: a numerical model study. American Journal of Environmental Sciences, 8(5): 479–488. doi: 10.3844/ajessp.2012.479.488 [32] Savcenko R, Bosch W. 2012. EOT11a-Empirical ocean tide model from multi-mission satellite altimetry. Munchen: Deutsches Geodätisches Forschungsinstitut (DGFI), 89, 49, https://epic.awi.de/id/eprint/36001/1/DGFI_Report_89.pdf [2017-11-8] [33] Schrama E J O, Ray R D. 1994. A preliminary tidal analysis of TOPEX/POSEIDON altimetry. Journal of Geophysical Research: Oceans, 99(C12): 24799–24808. doi: 10.1029/94JC01432 [34] Seifi F, Deng Xiaoli, Andersen O B. 2019. Assessment of the accuracy of recent empirical and assimilated tidal models for the Great Barrier Reef, Australia, using satellite and coastal data. Remote Sensing, 11(10): 1211. doi: 10.3390/rs11101211 [35] Shum C K, Woodworth P L, Andersen O B, et al. 1997. Accuracy assessment of recent ocean tide models. Journal of Geophysical Research: Oceans, 102(C11): 25173–25194. doi: 10.1029/97JC00445 [36] Stammer D, Ray R D, Ander O B, et al. 2014. Accuracy assessment of global barotropic ocean tide models. Reviews of Geophysics, 52(3): 243–282. doi: 10.1002/2014RG000450 [37] Taguchi E, Stammer D, Zahel W. 2010. Inferring deep ocean tidal energy dissipation from the global high-resolution data-assimilative HAMTIDE model. Journal of Geophysical Research: Oceans, 119(7): 4573–4592. doi: 10.1002/2013JC009766 [38] Visser P N A M, Sneeuw N, Reubelt T, et al. 2010. Space-borne gravimetric satellite constellations and ocean tides: aliasing effects. Geophysical Journal International, 181(2): 789–805. doi: 10.1111/j.1365-246X.2010.04557.x [39] Ye A L, Robinson I S. 1983. Tidal dynamics in the South China Sea. Geophysical Journal International, 72(3): 691–707. doi: 10.1111/j.1365-246X.1983.tb02827.x [40] Zahel W. 1995. Assimilating ocean tide determined data into global tidal models. Journal of Marine Systems, 6(1–2): 3–13. doi: 10.1016/0924-7963(94)00014-3 [41] Zu Tingting, Gan Jianping, Erofeeva S Y. 2008. Numerical study of the tide and tidal dynamics in the South China Sea. Deep-Sea Research Part I: Oceanographic Research Papers, 55(2): 137–154. doi: 10.1016/j.dsr.2007.10.007 -


 点击查看大图
计量
- 文章访问数: 696
- HTML全文浏览量: 246
- PDF下载量: 59
- 被引次数: 0

