

-
Abstract: A high resolution one-dimensional thermodynamic snow and ice (HIGHTSI) model was used to model the annual cycle of landfast ice mass and heat balance near Zhongshan Station, East Antarctica. The model was forced and initialized by meteorological and sea ice in situ observations from April 2015 to April 2016. HIGHTSI produced a reasonable snow and ice evolution in the validation experiments, with a negligible mean ice thickness bias of (0.003±0.06) m compared to in situ observations. To further examine the impact of different snow conditions on annual evolution of first-year ice (FYI), four sensitivity experiments with different precipitation schemes (0, half, normal, and double) were performed. The results showed that compared to the snow-free case, the insulation effect of snow cover decreased bottom freezing in the winter, leading to 15%–26% reduction of maximum ice thickness. Thick snow cover caused negative freeboard and flooding, and then snow ice formation, which contributed 12%–49% to the maximum ice thickness. In early summer, snow cover delayed the onset of ice melting for about one month, while the melting of snow cover led to the formation of superimposed ice, accounting for 5%–10% of the ice thickness. Internal ice melting was a significant contributor in summer whether snow cover existed or not, accounting for 35%–56% of the total summer ice loss. The multi-year ice (MYI) simulations suggested that when snow-covered ice persisted from FYI to the 10th MYI, winter congelation ice percentage decreased from 80% to 44% (snow ice and superimposed ice increased), while the contribution of internal ice melting in the summer decreased from 45% to 5% (bottom ice melting dominated).
-
Key words:
- landfast ice /
- annual cycle /
- snow influence /
- Zhongshan Station /
- East Antarctica
-

Figure 1. The location of Prydz Bay and Zhongshan Station (a), and a satellite image of the area around Zhongshan Station (b). The Snow and Ice Mass Balance Array (SIMBA) buoy was deployed near the landfast ice observation site, which is marked by a black dot.

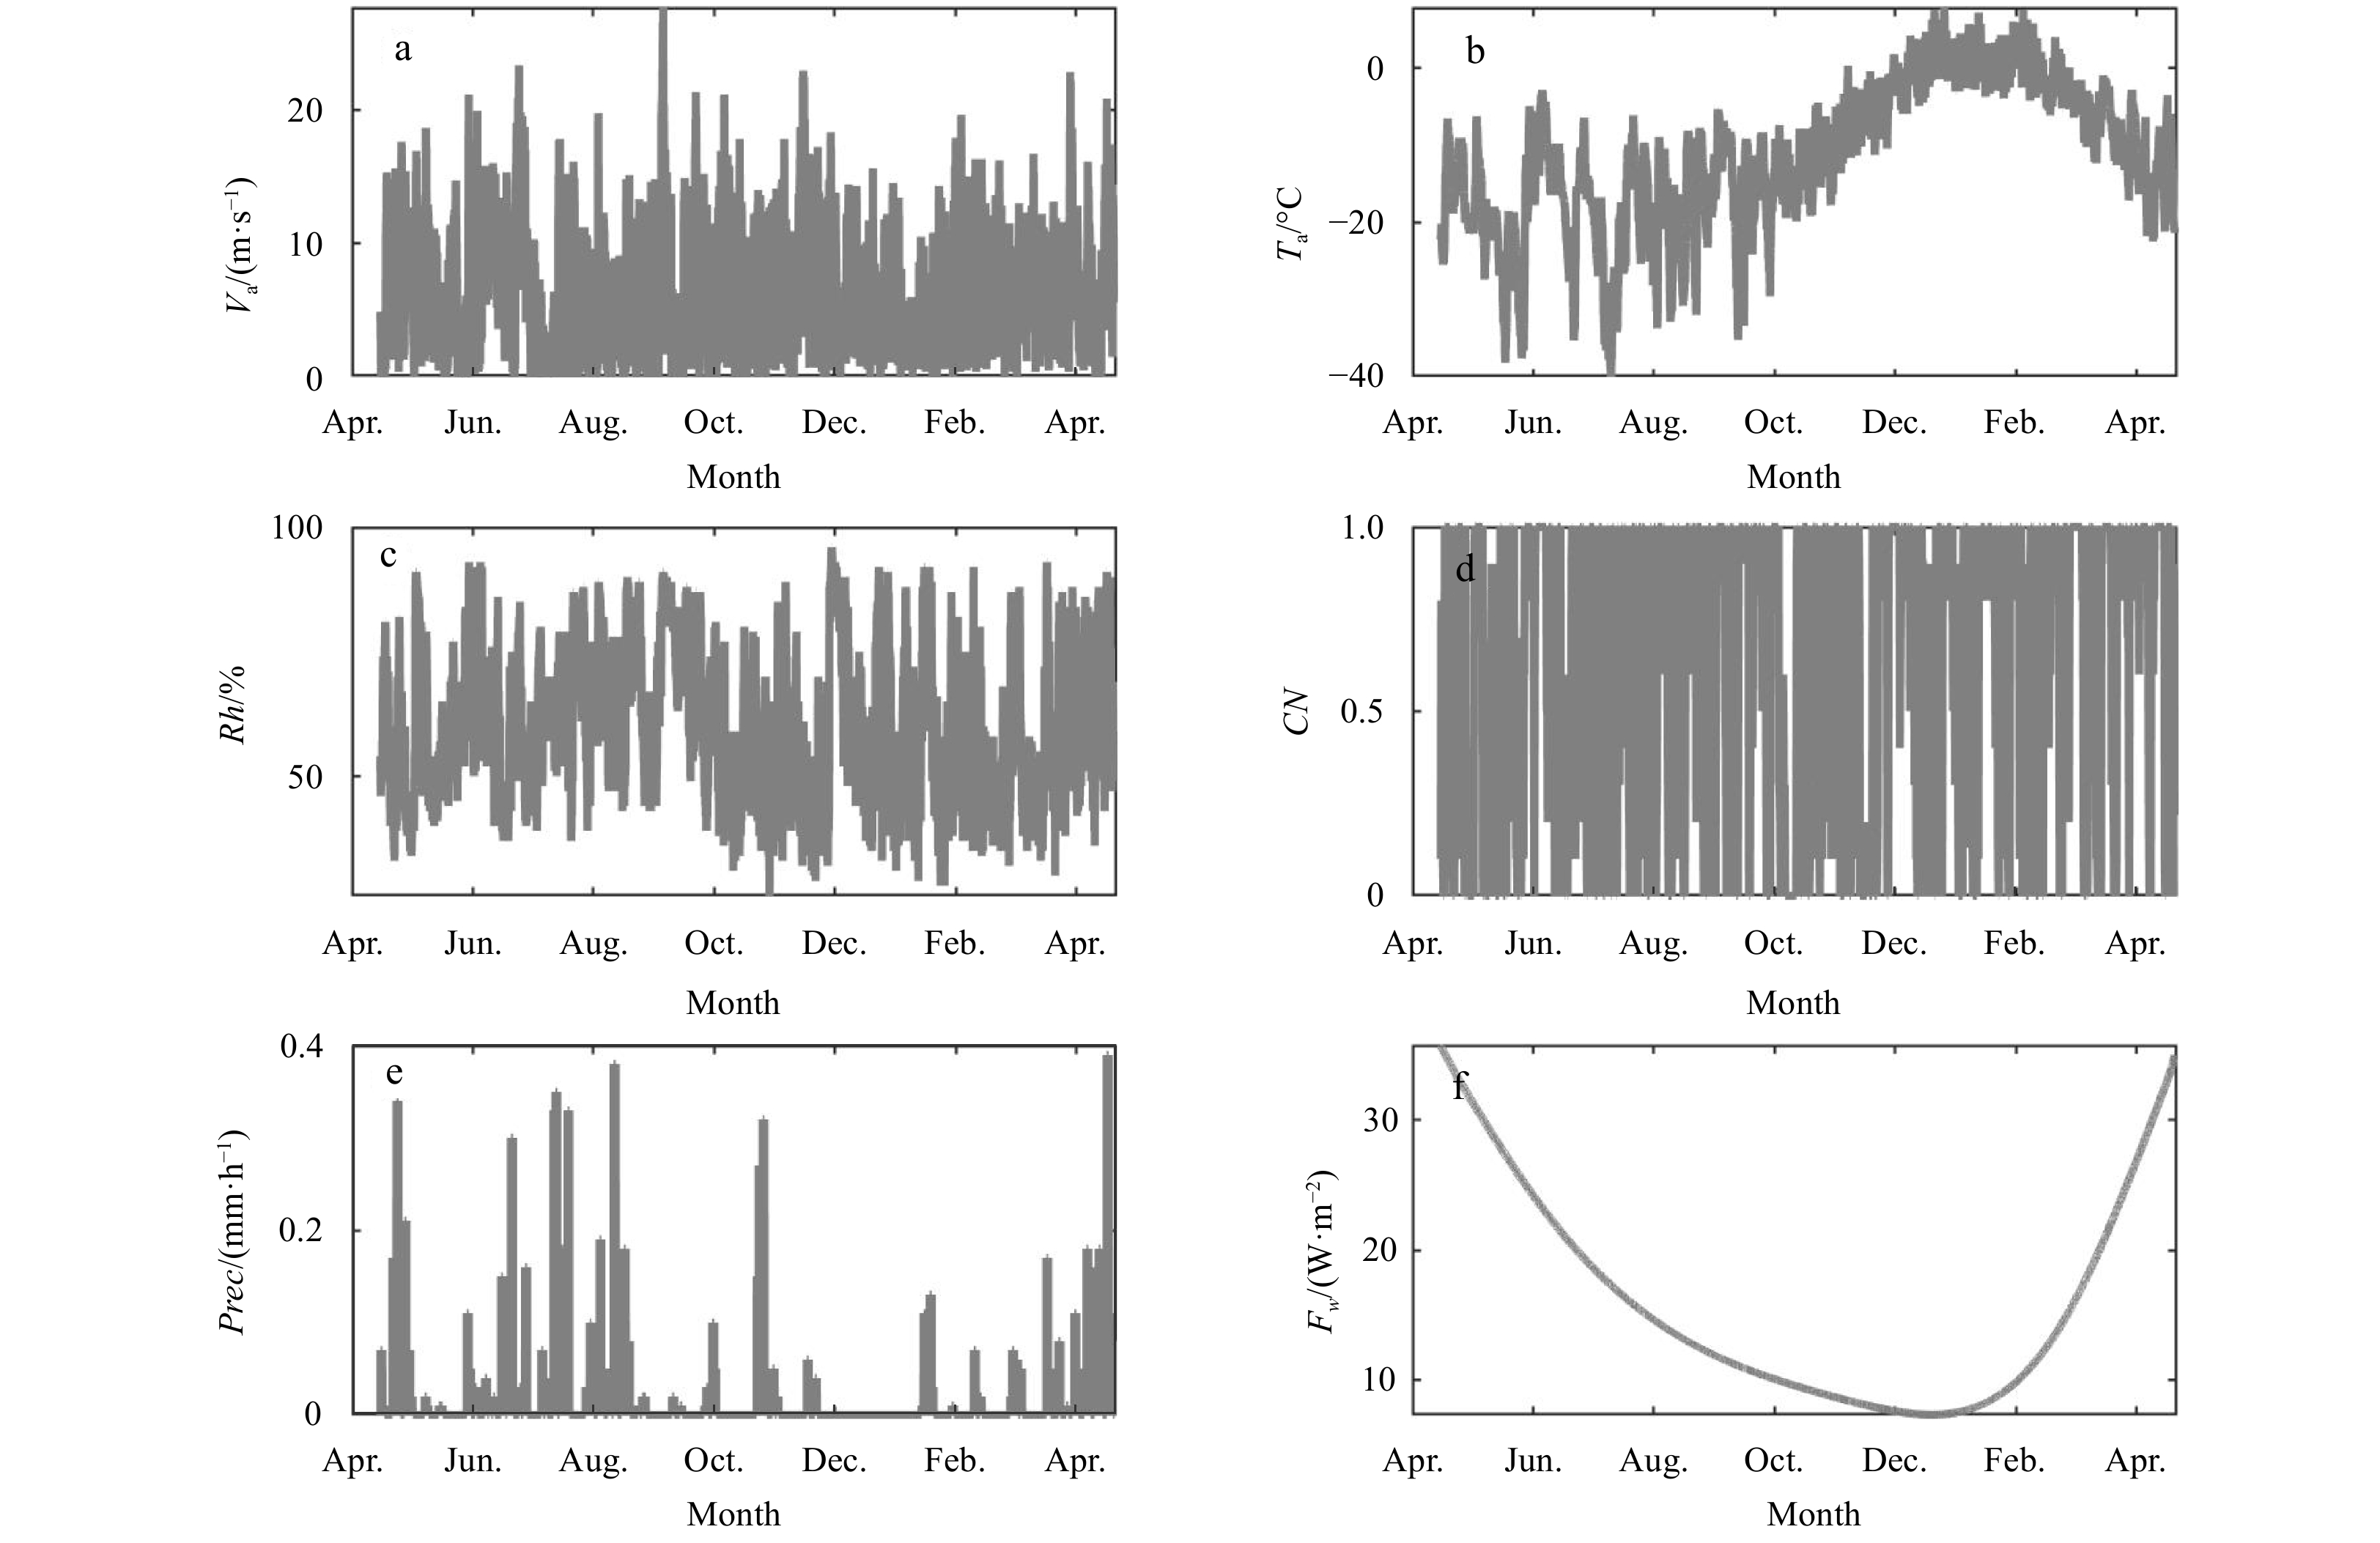
Figure 2. The hourly external forcing used for HIGHTSI model from April 2015 to April 2016: wind speed (a), air temperature (b), relative humidity (c), cloud fraction (d), precipitation rate (e), and oceanic heat flux (f).

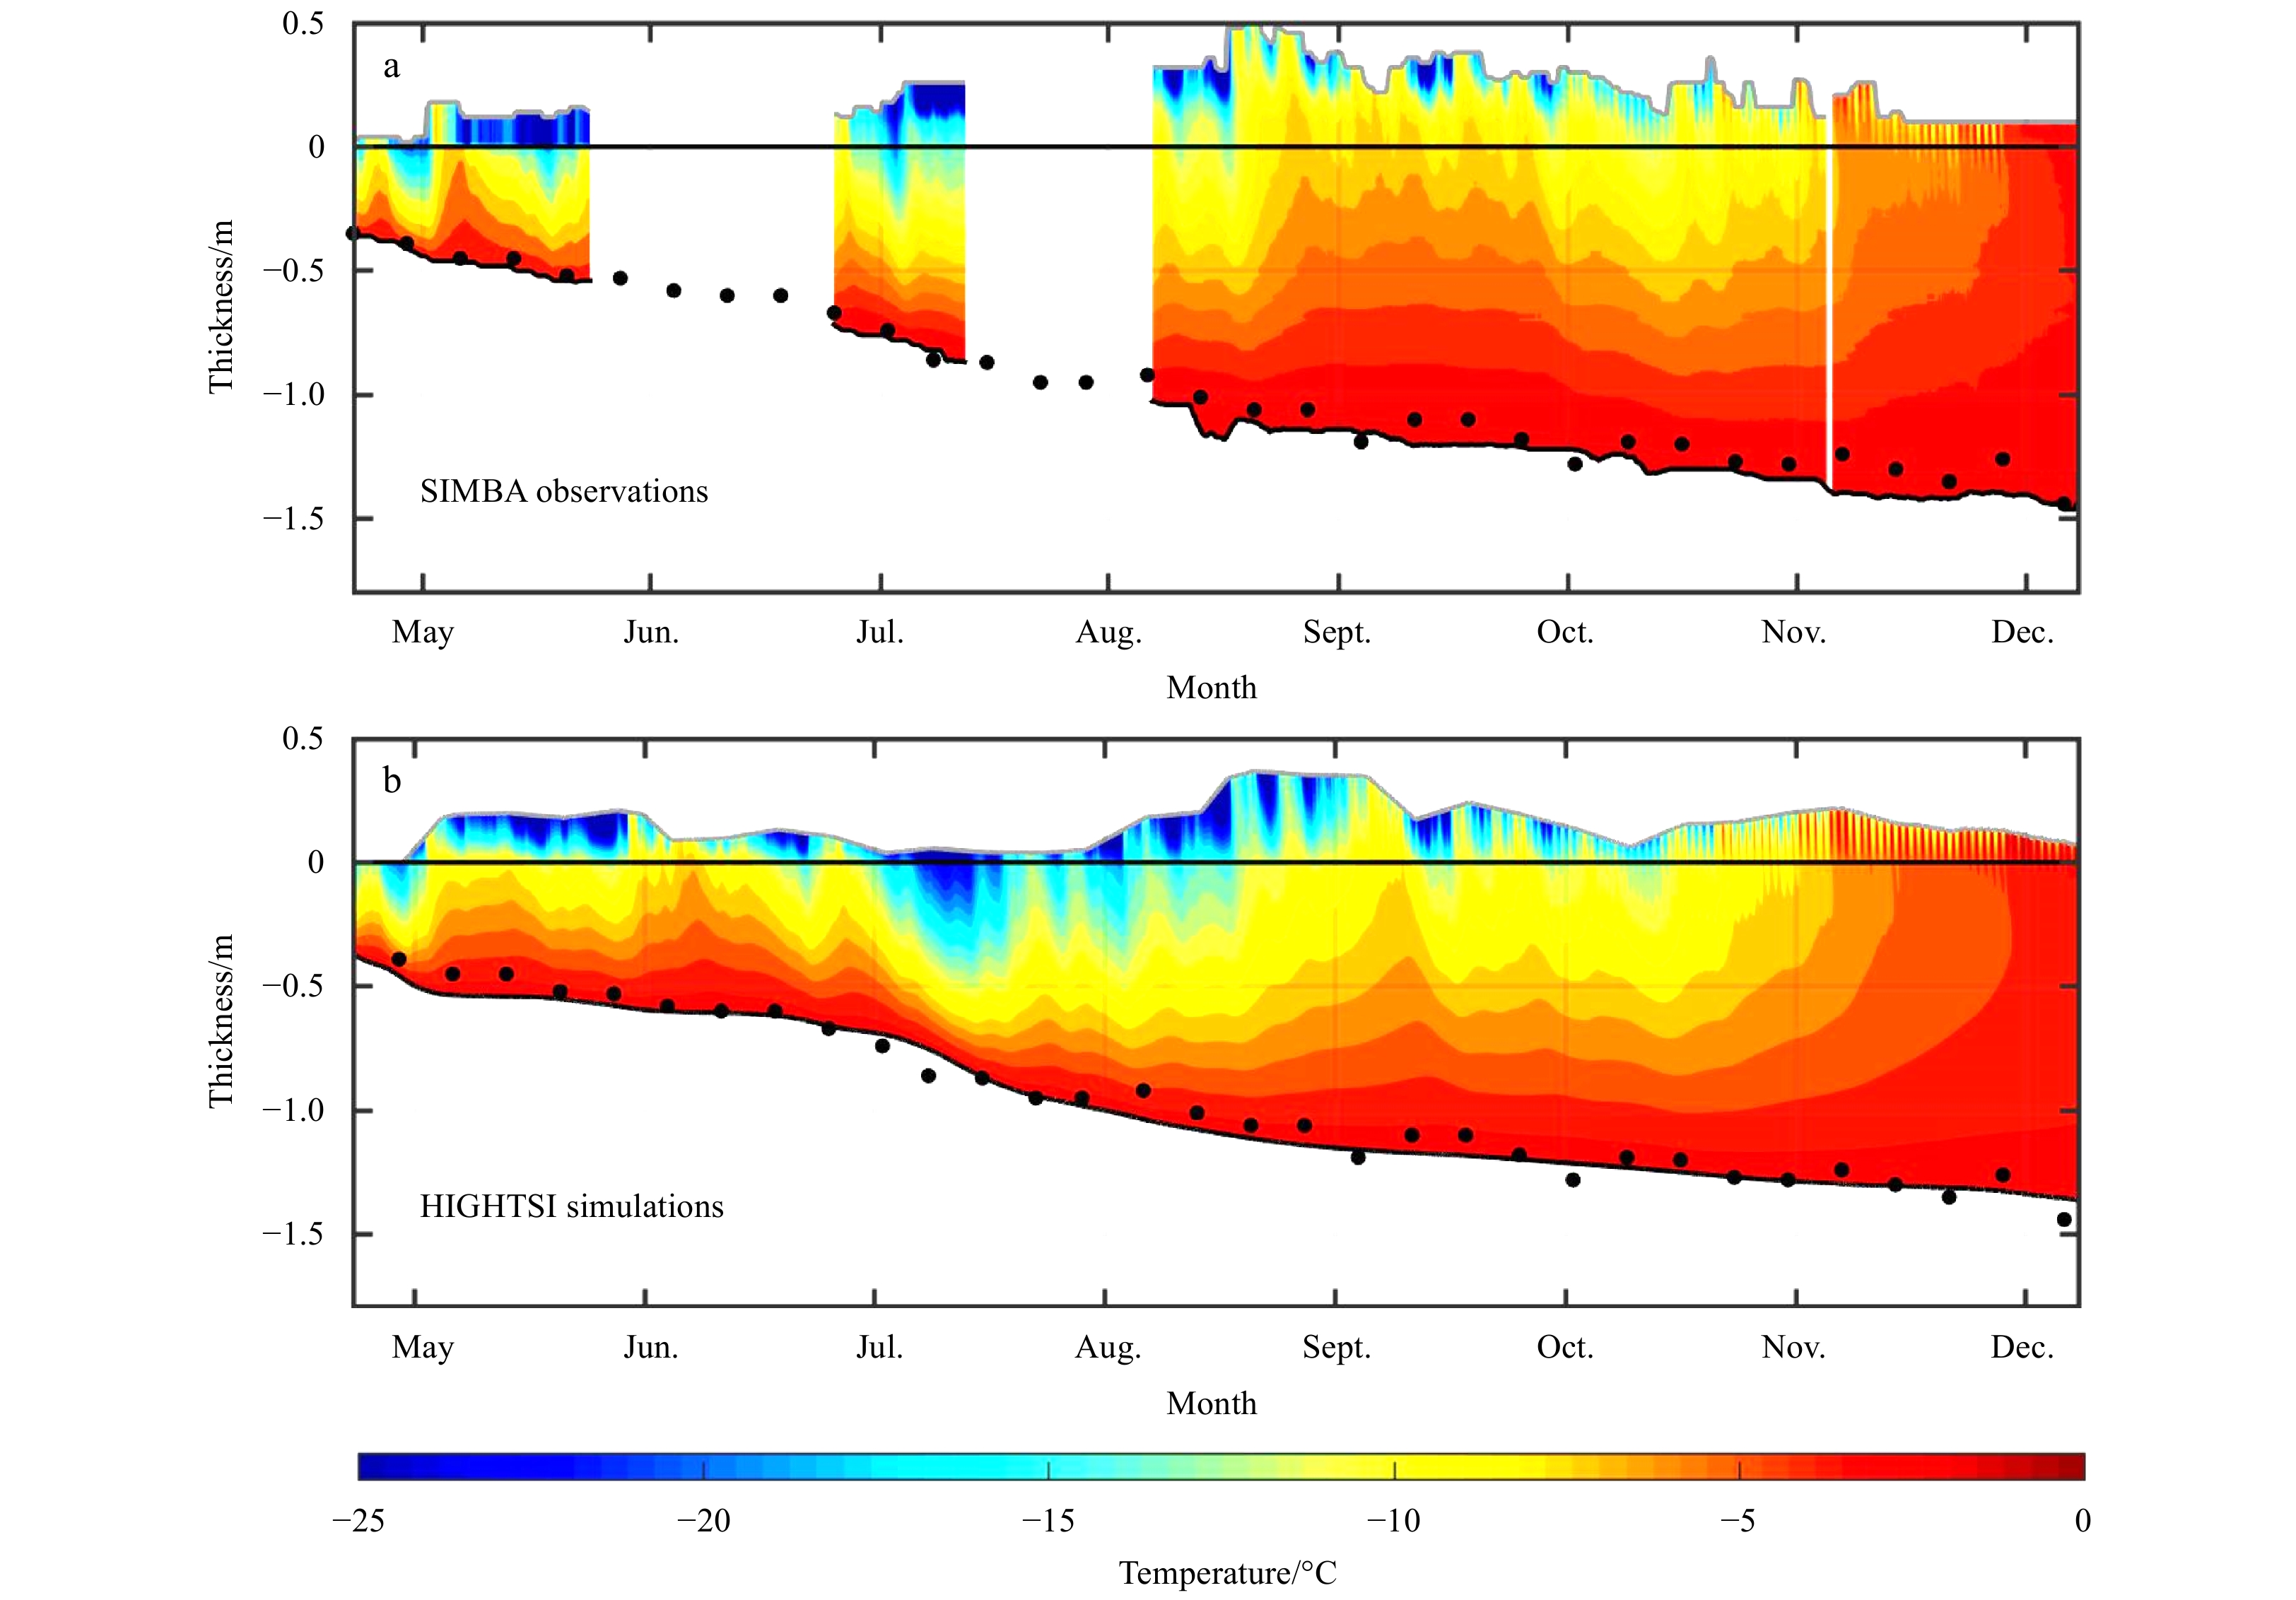
Figure 3. The snow and ice temperature profile observed by Snow and Ice Mass Balance Array (SIMBA) buoy (a) and simulated by HIGHTSI in Exp. V (b), from 15 April to December 15, 2015. In a, the snow surface and ice bottom was detected from SIMBA temperature profiles by a semi-automatic algorithm (Zhao et al., 2017). The zero position represents the snow/ice interface. The black dots represent the observed in situ ice thickness.

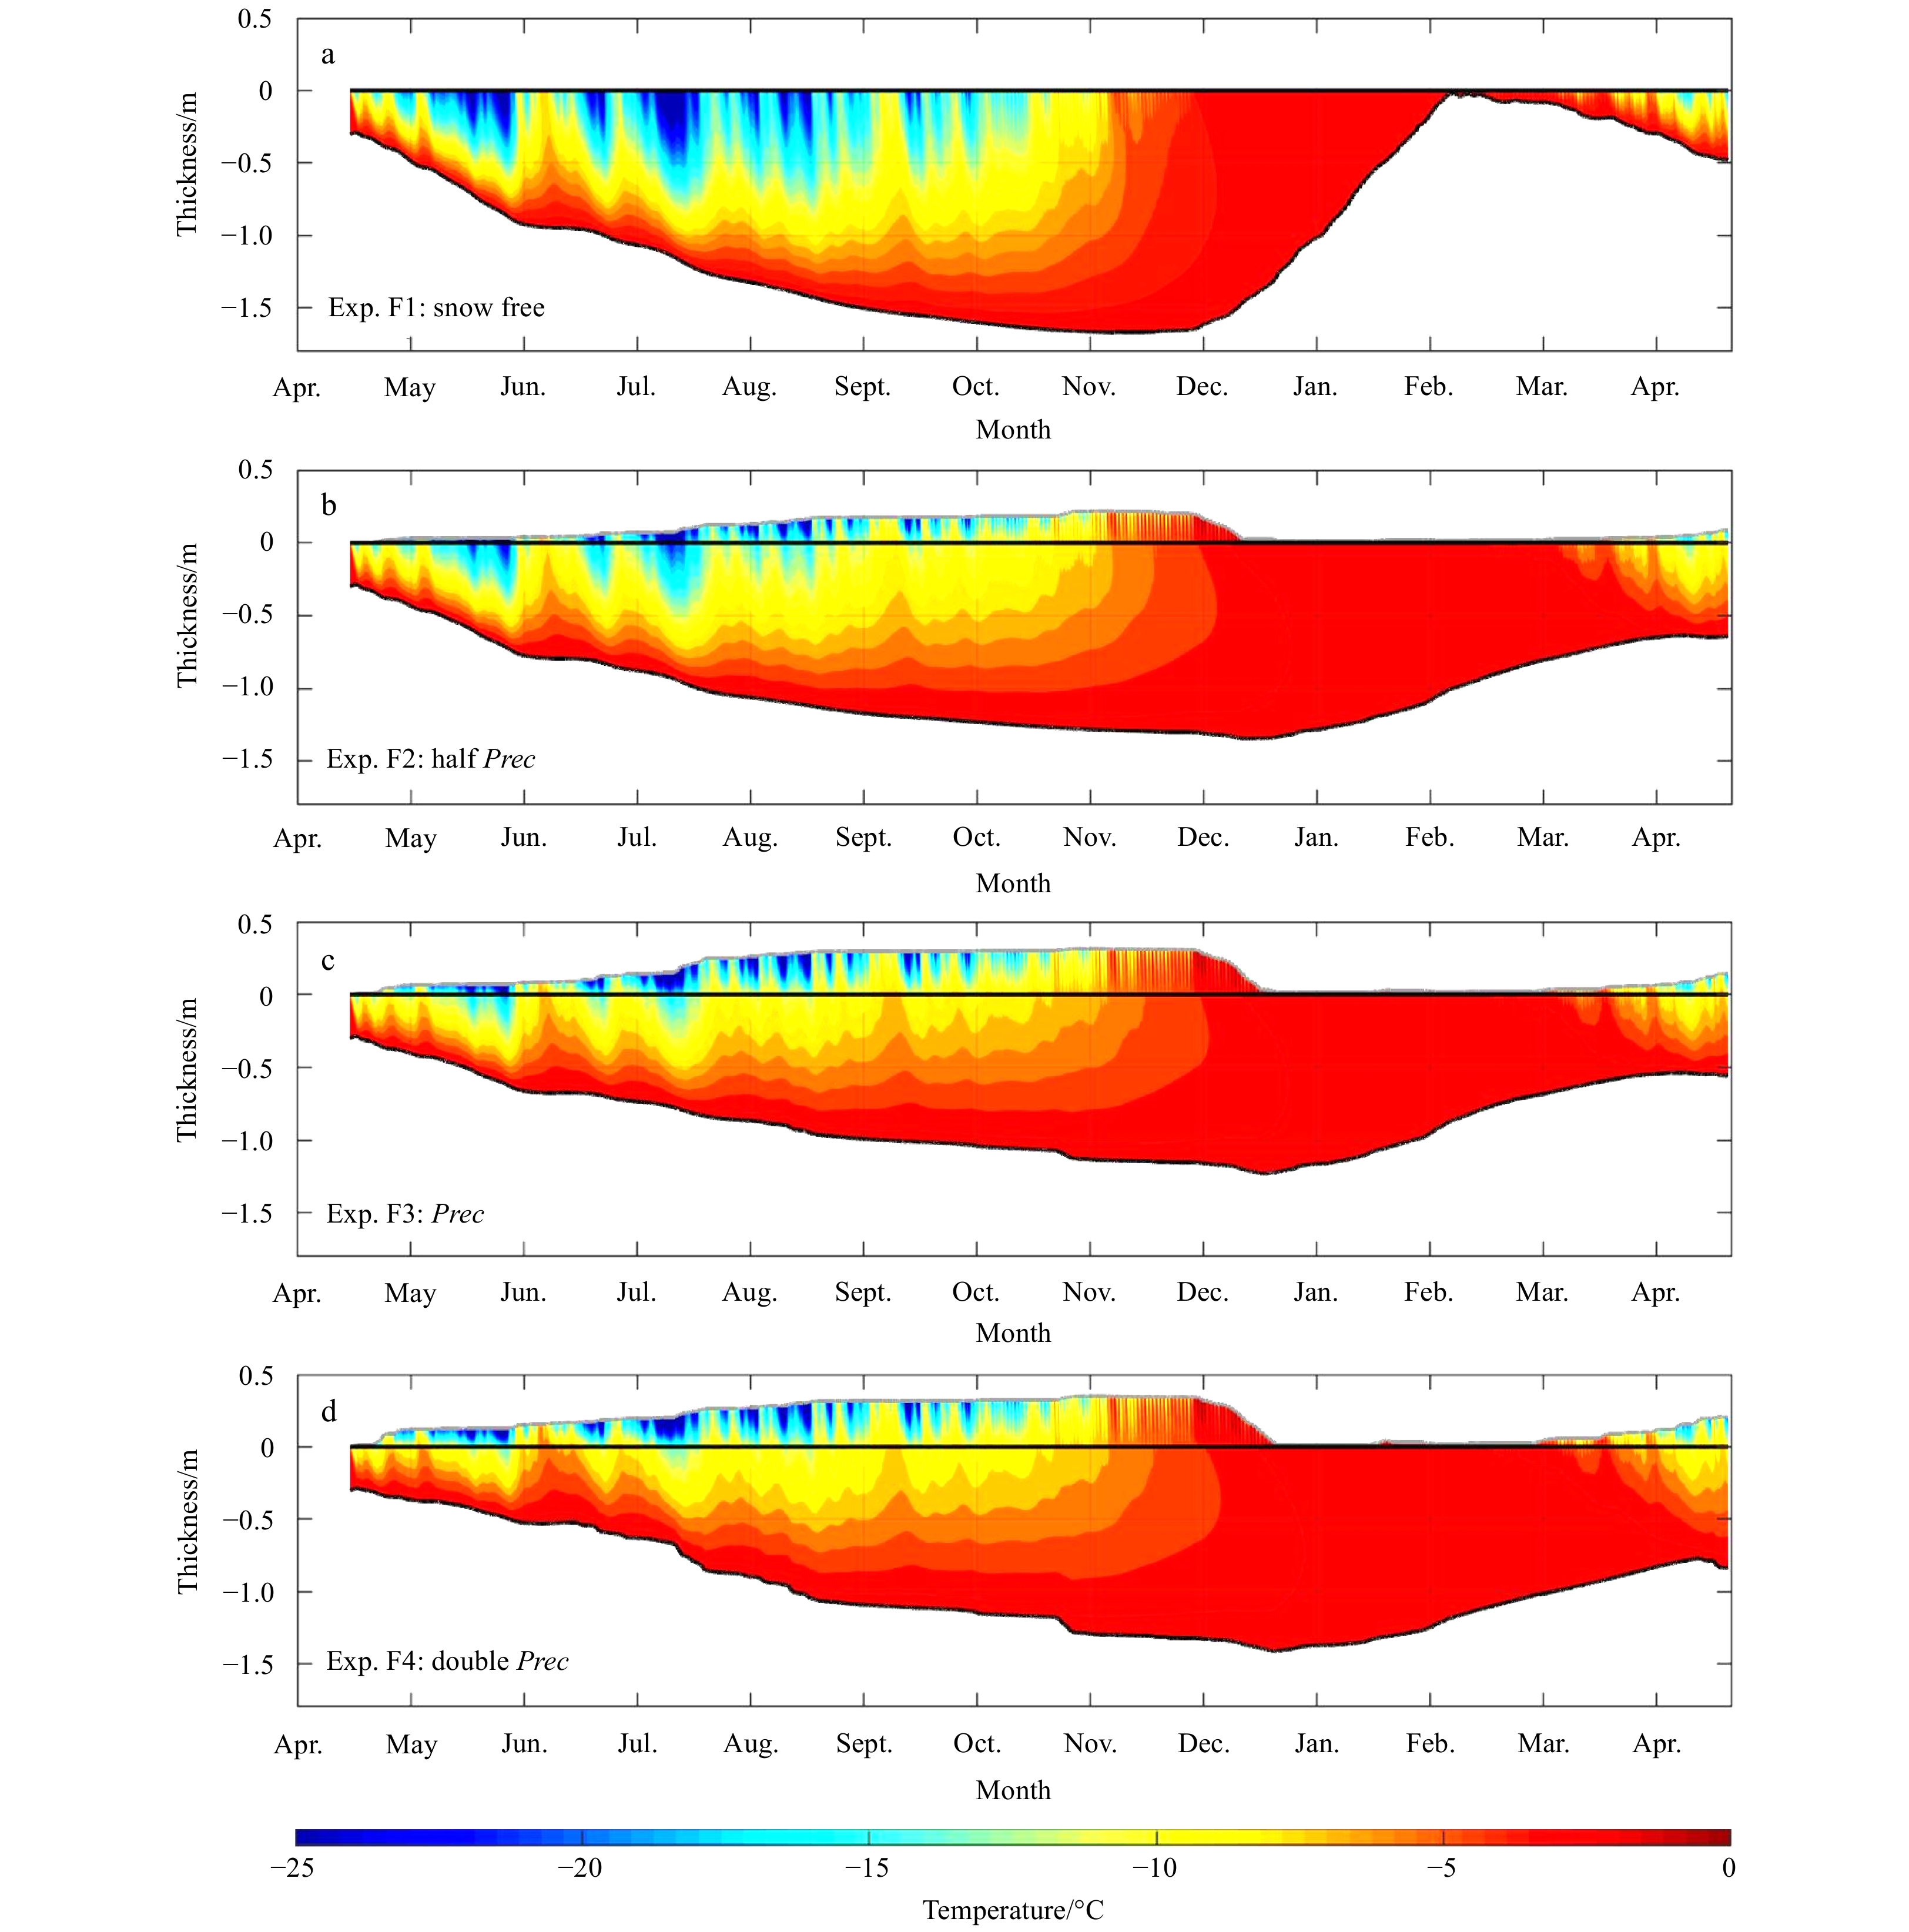
Figure 4. Snow and ice temperature profiles from April 15, 2015 to April 15, 2016 for Exp. F1 (a), Exp. F2 (b), Exp. F3 (c), and Exp. F4 (d). The zero position represents the snow/ice interface.

Figure 5. Snow thickness (a), ice thickness (b), freeboard (c), and albedo (d) simulated from April 15, 2015 to April 15, 2016.

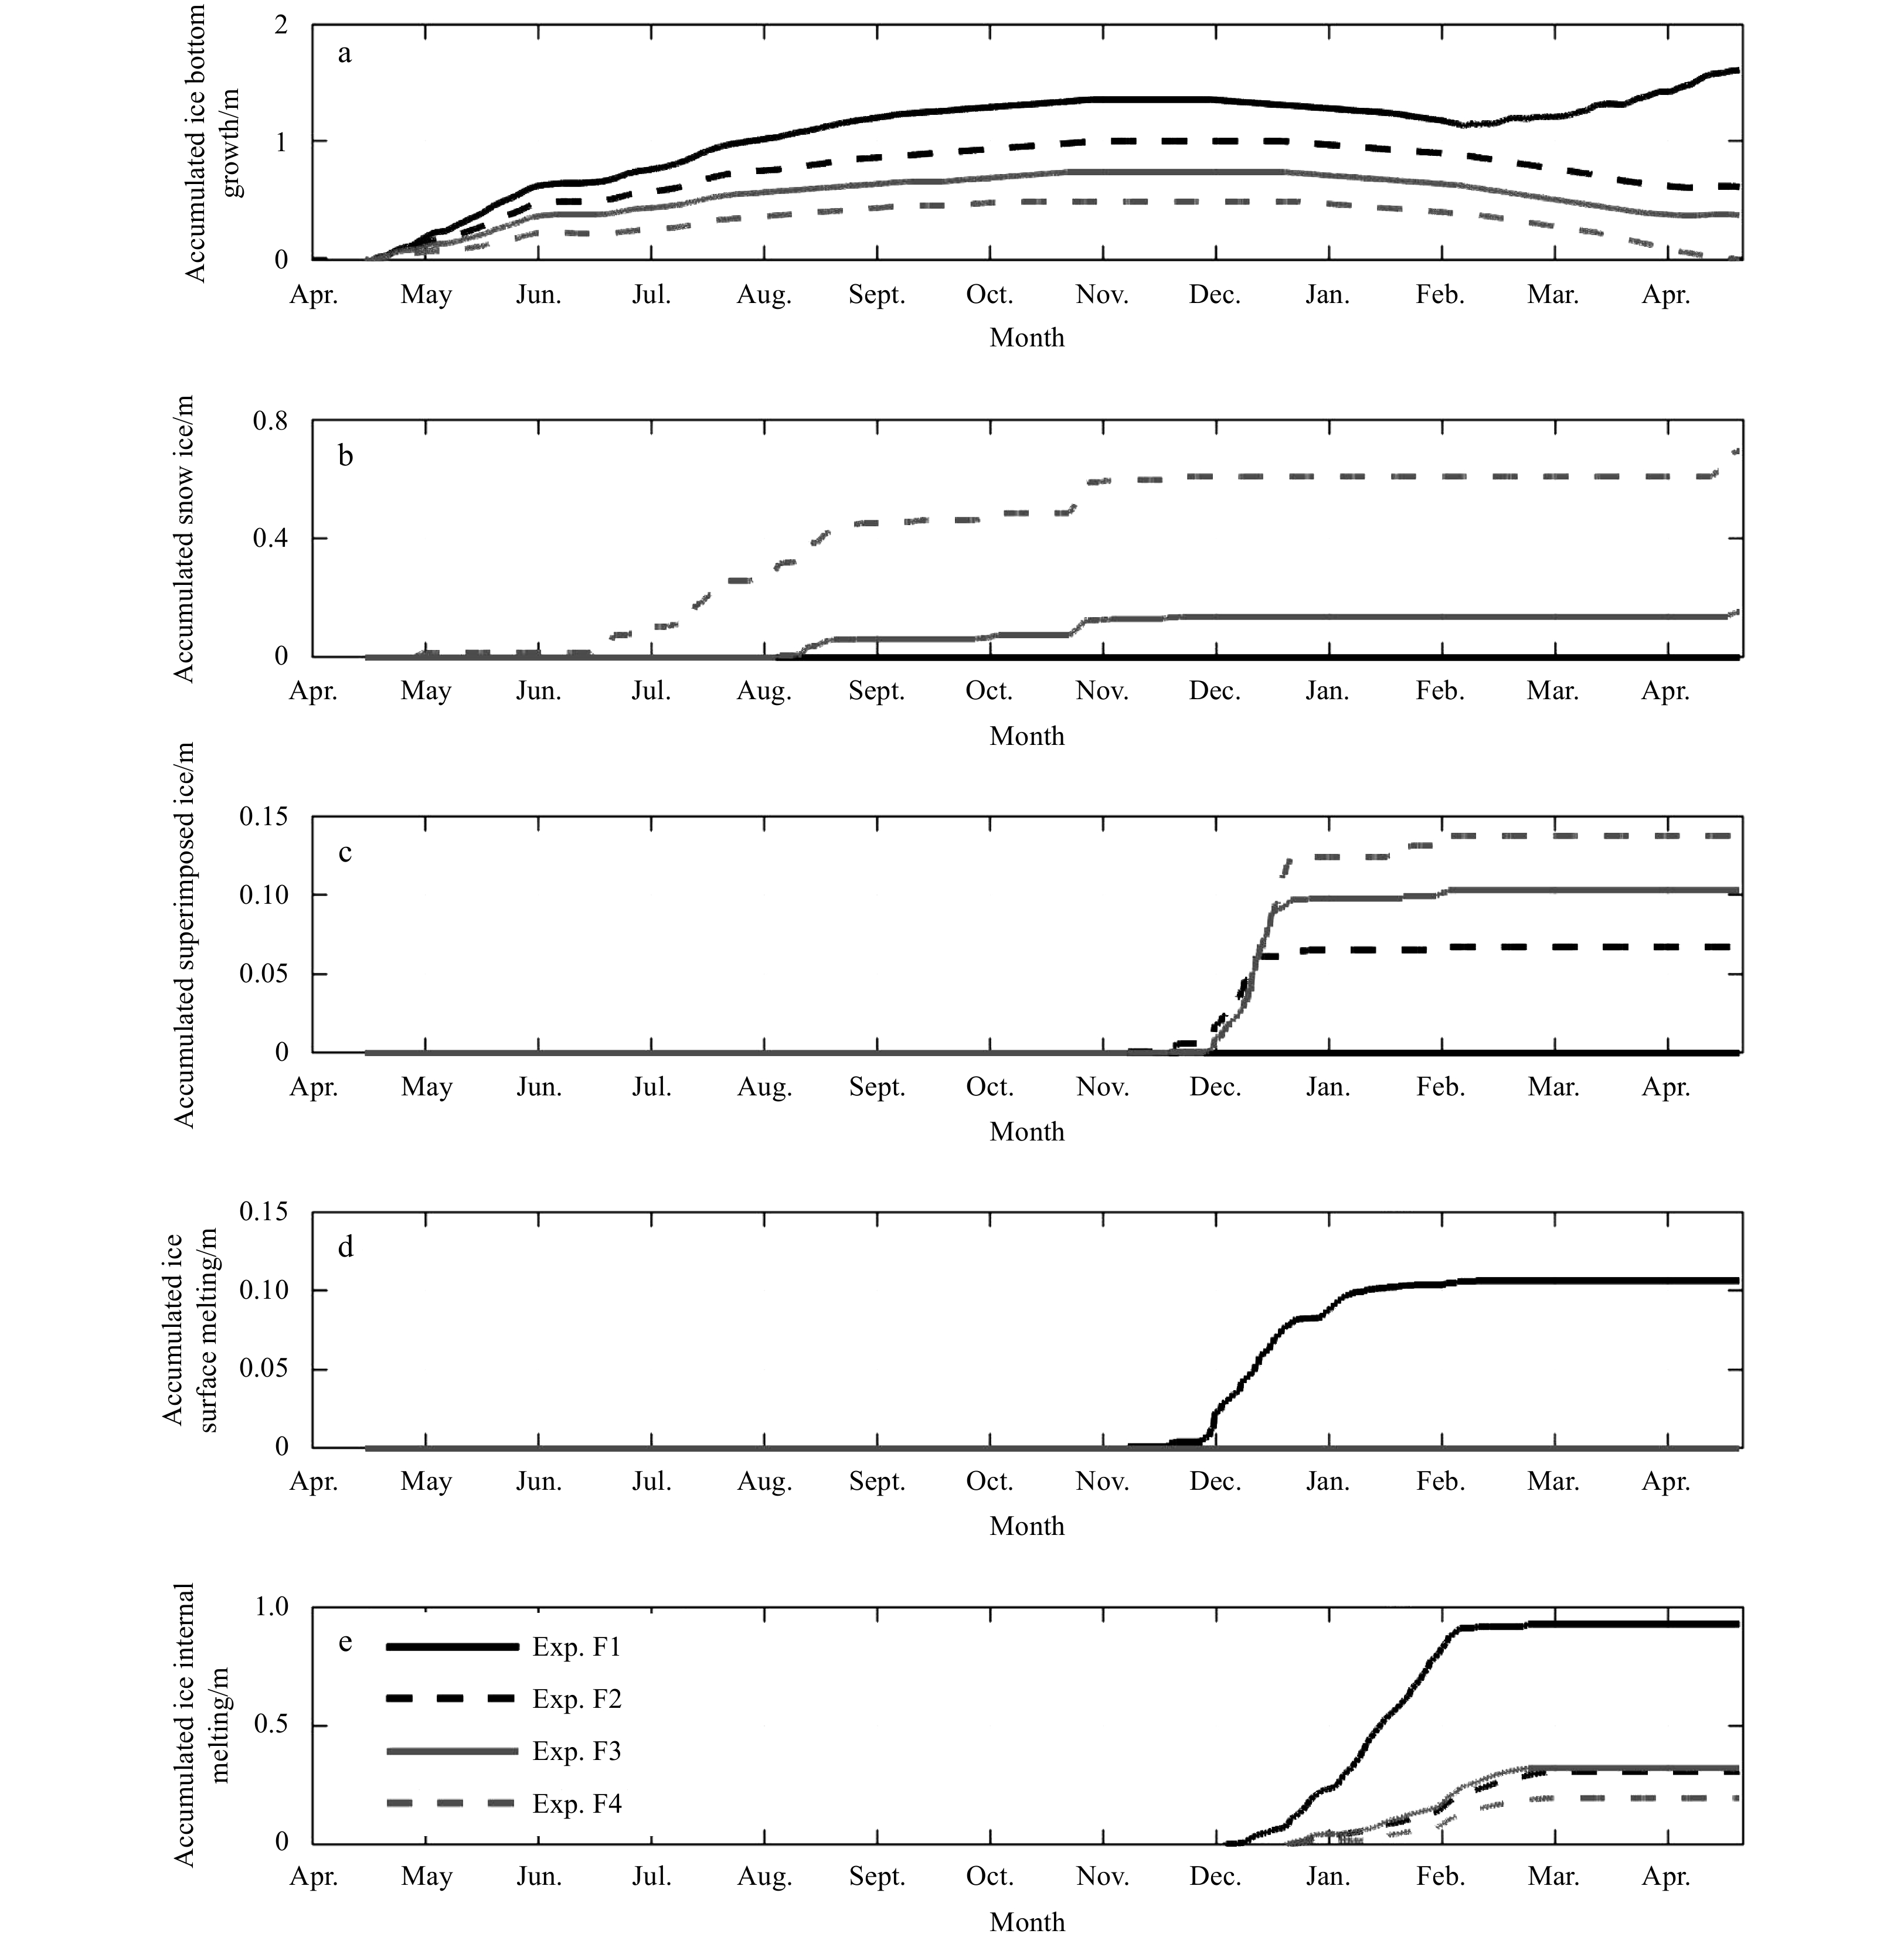
Figure 6. Accumulated ice bottom growth (a), accumulated snow ice (b), accumulated superimposed ice (c), accumulated ice surface melting (d), and accumulated ice internal melting (e) from April 15, 2015 to April 15, 2016.

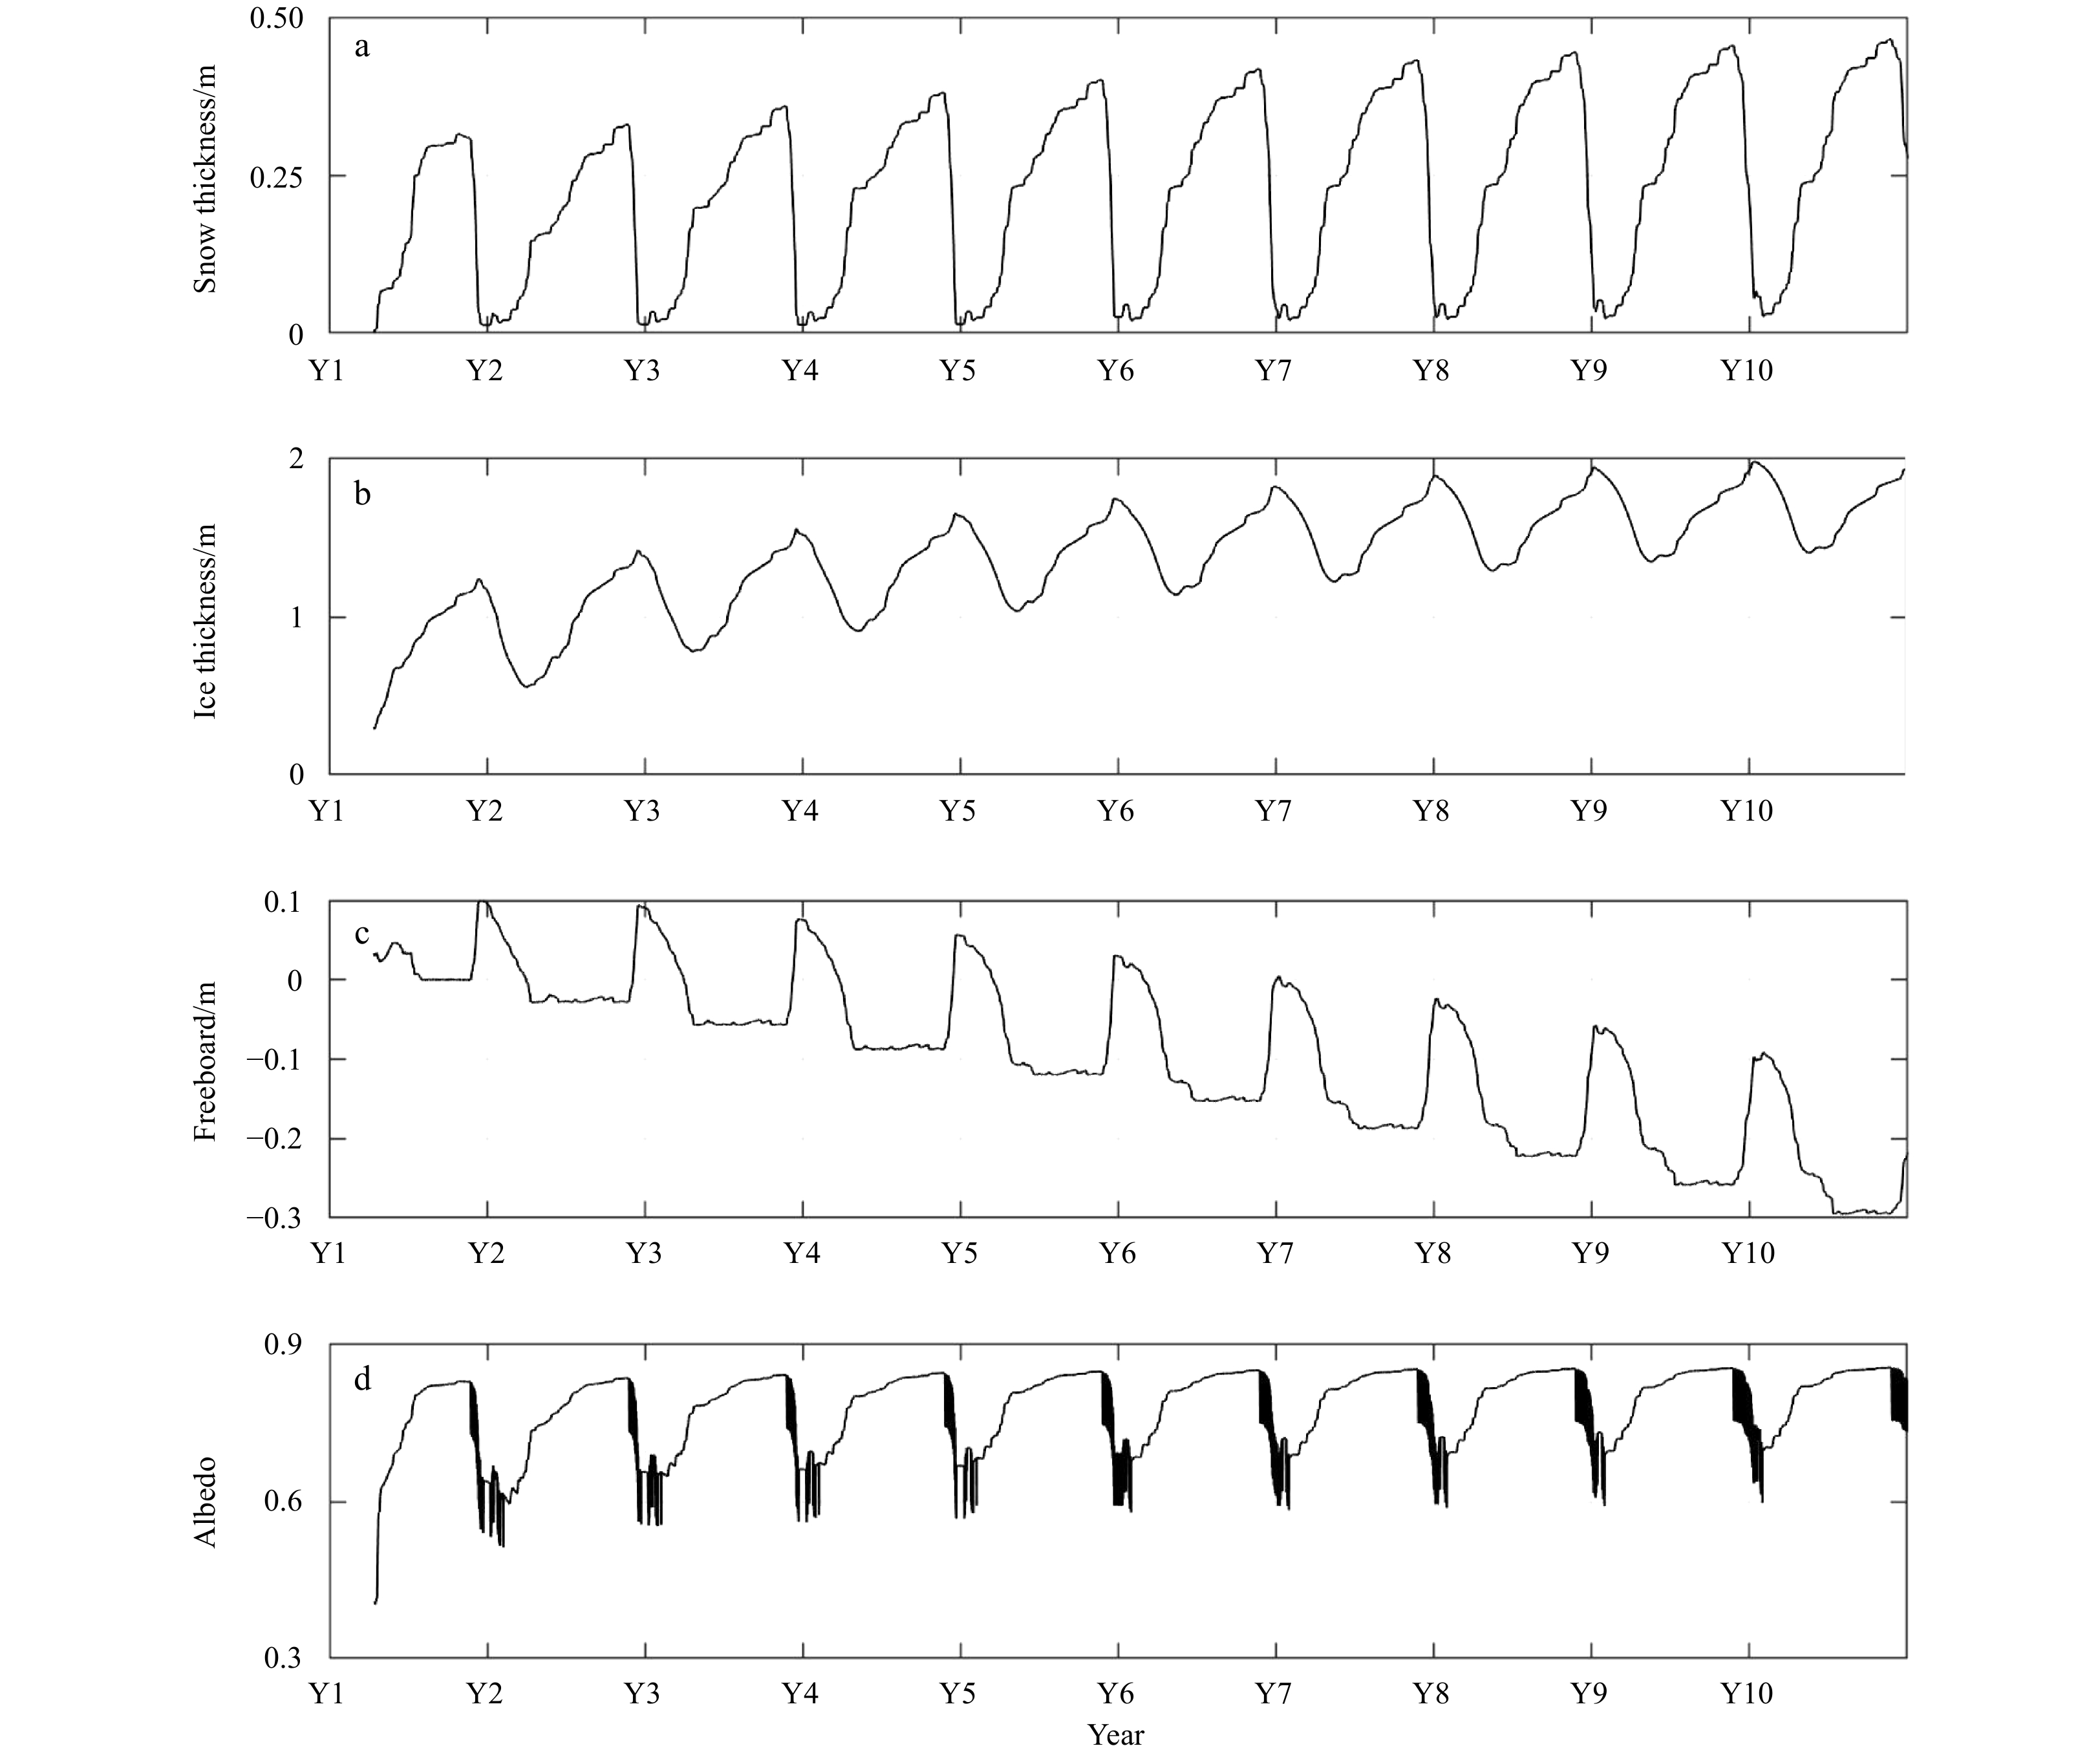
Figure 7. Snow thickness (a), ice thickness (b), freeboard (c), and albedo (d) in the 10-year simulations for Exp. MYI.

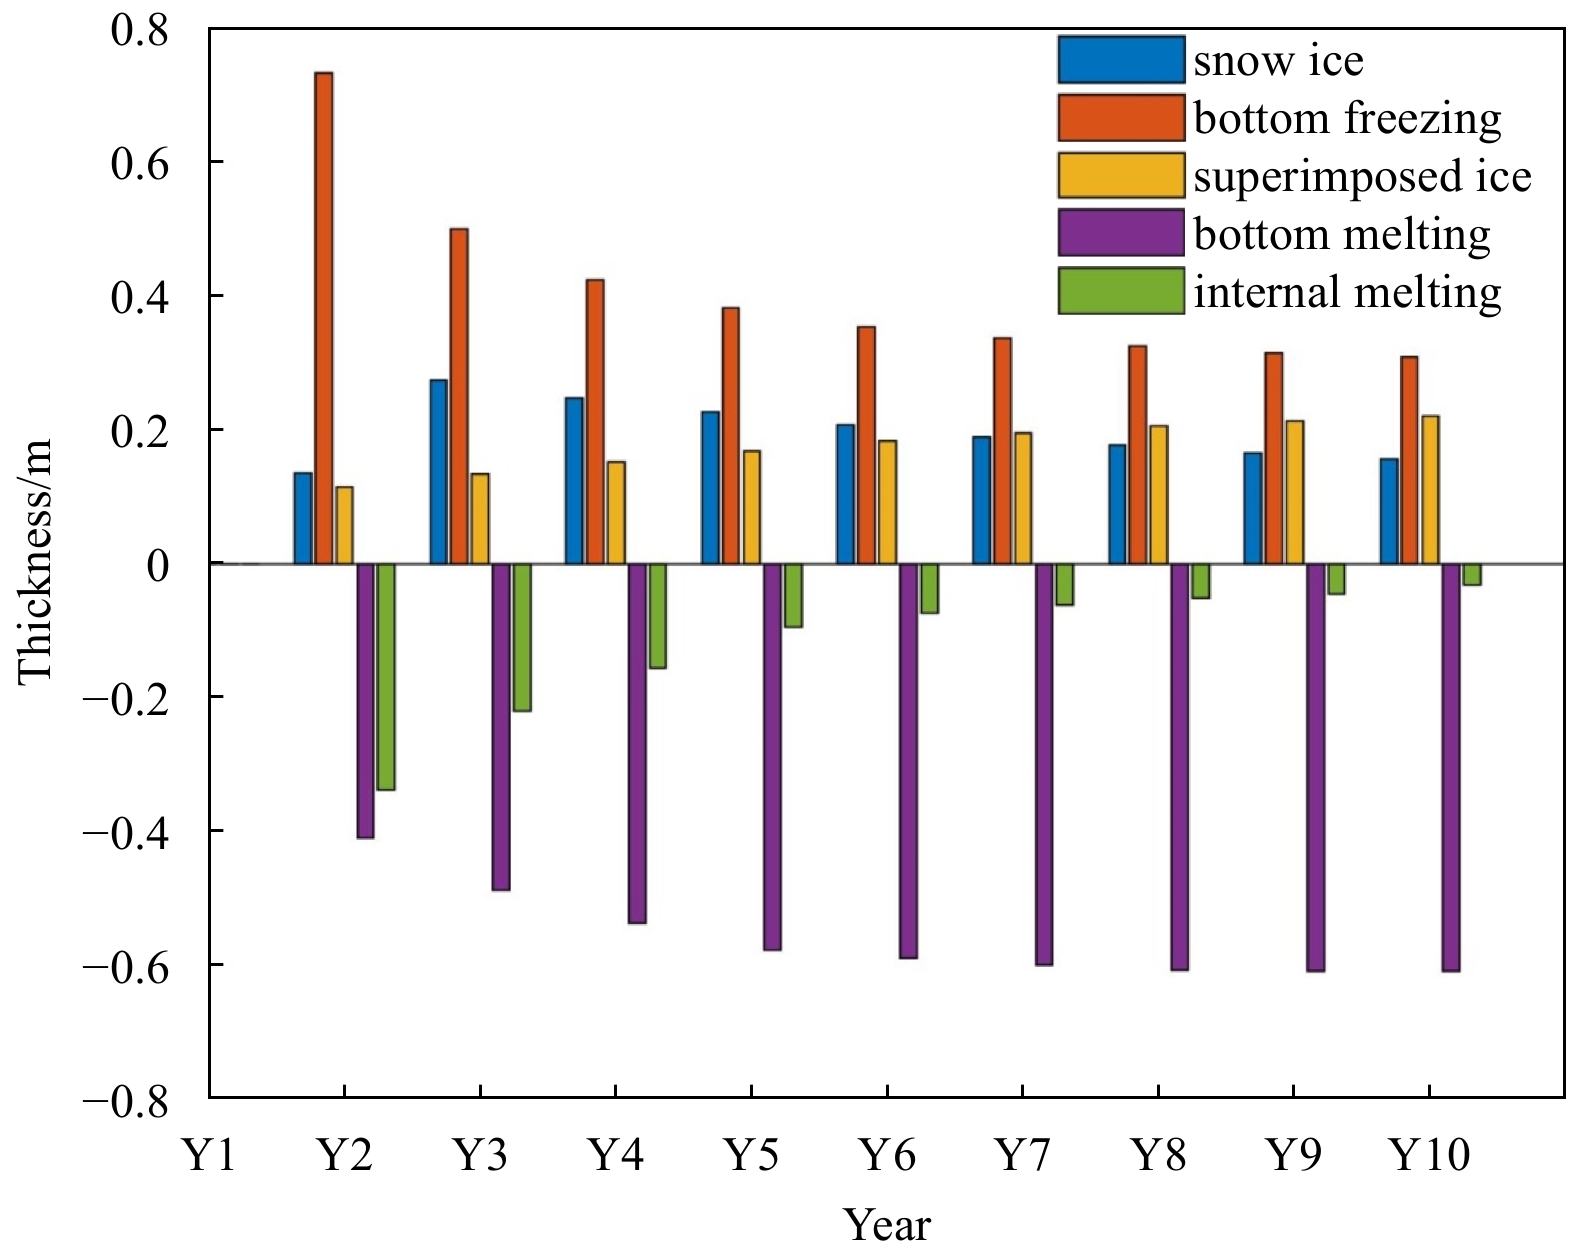
Figure 8. Yearly accumulations of snow ice, bottom freezing, superimposed ice, bottom melting and internal melting in the 10-year simulations for Exp. MYI. Ice gain was positive and ice loss was negative in this figure.

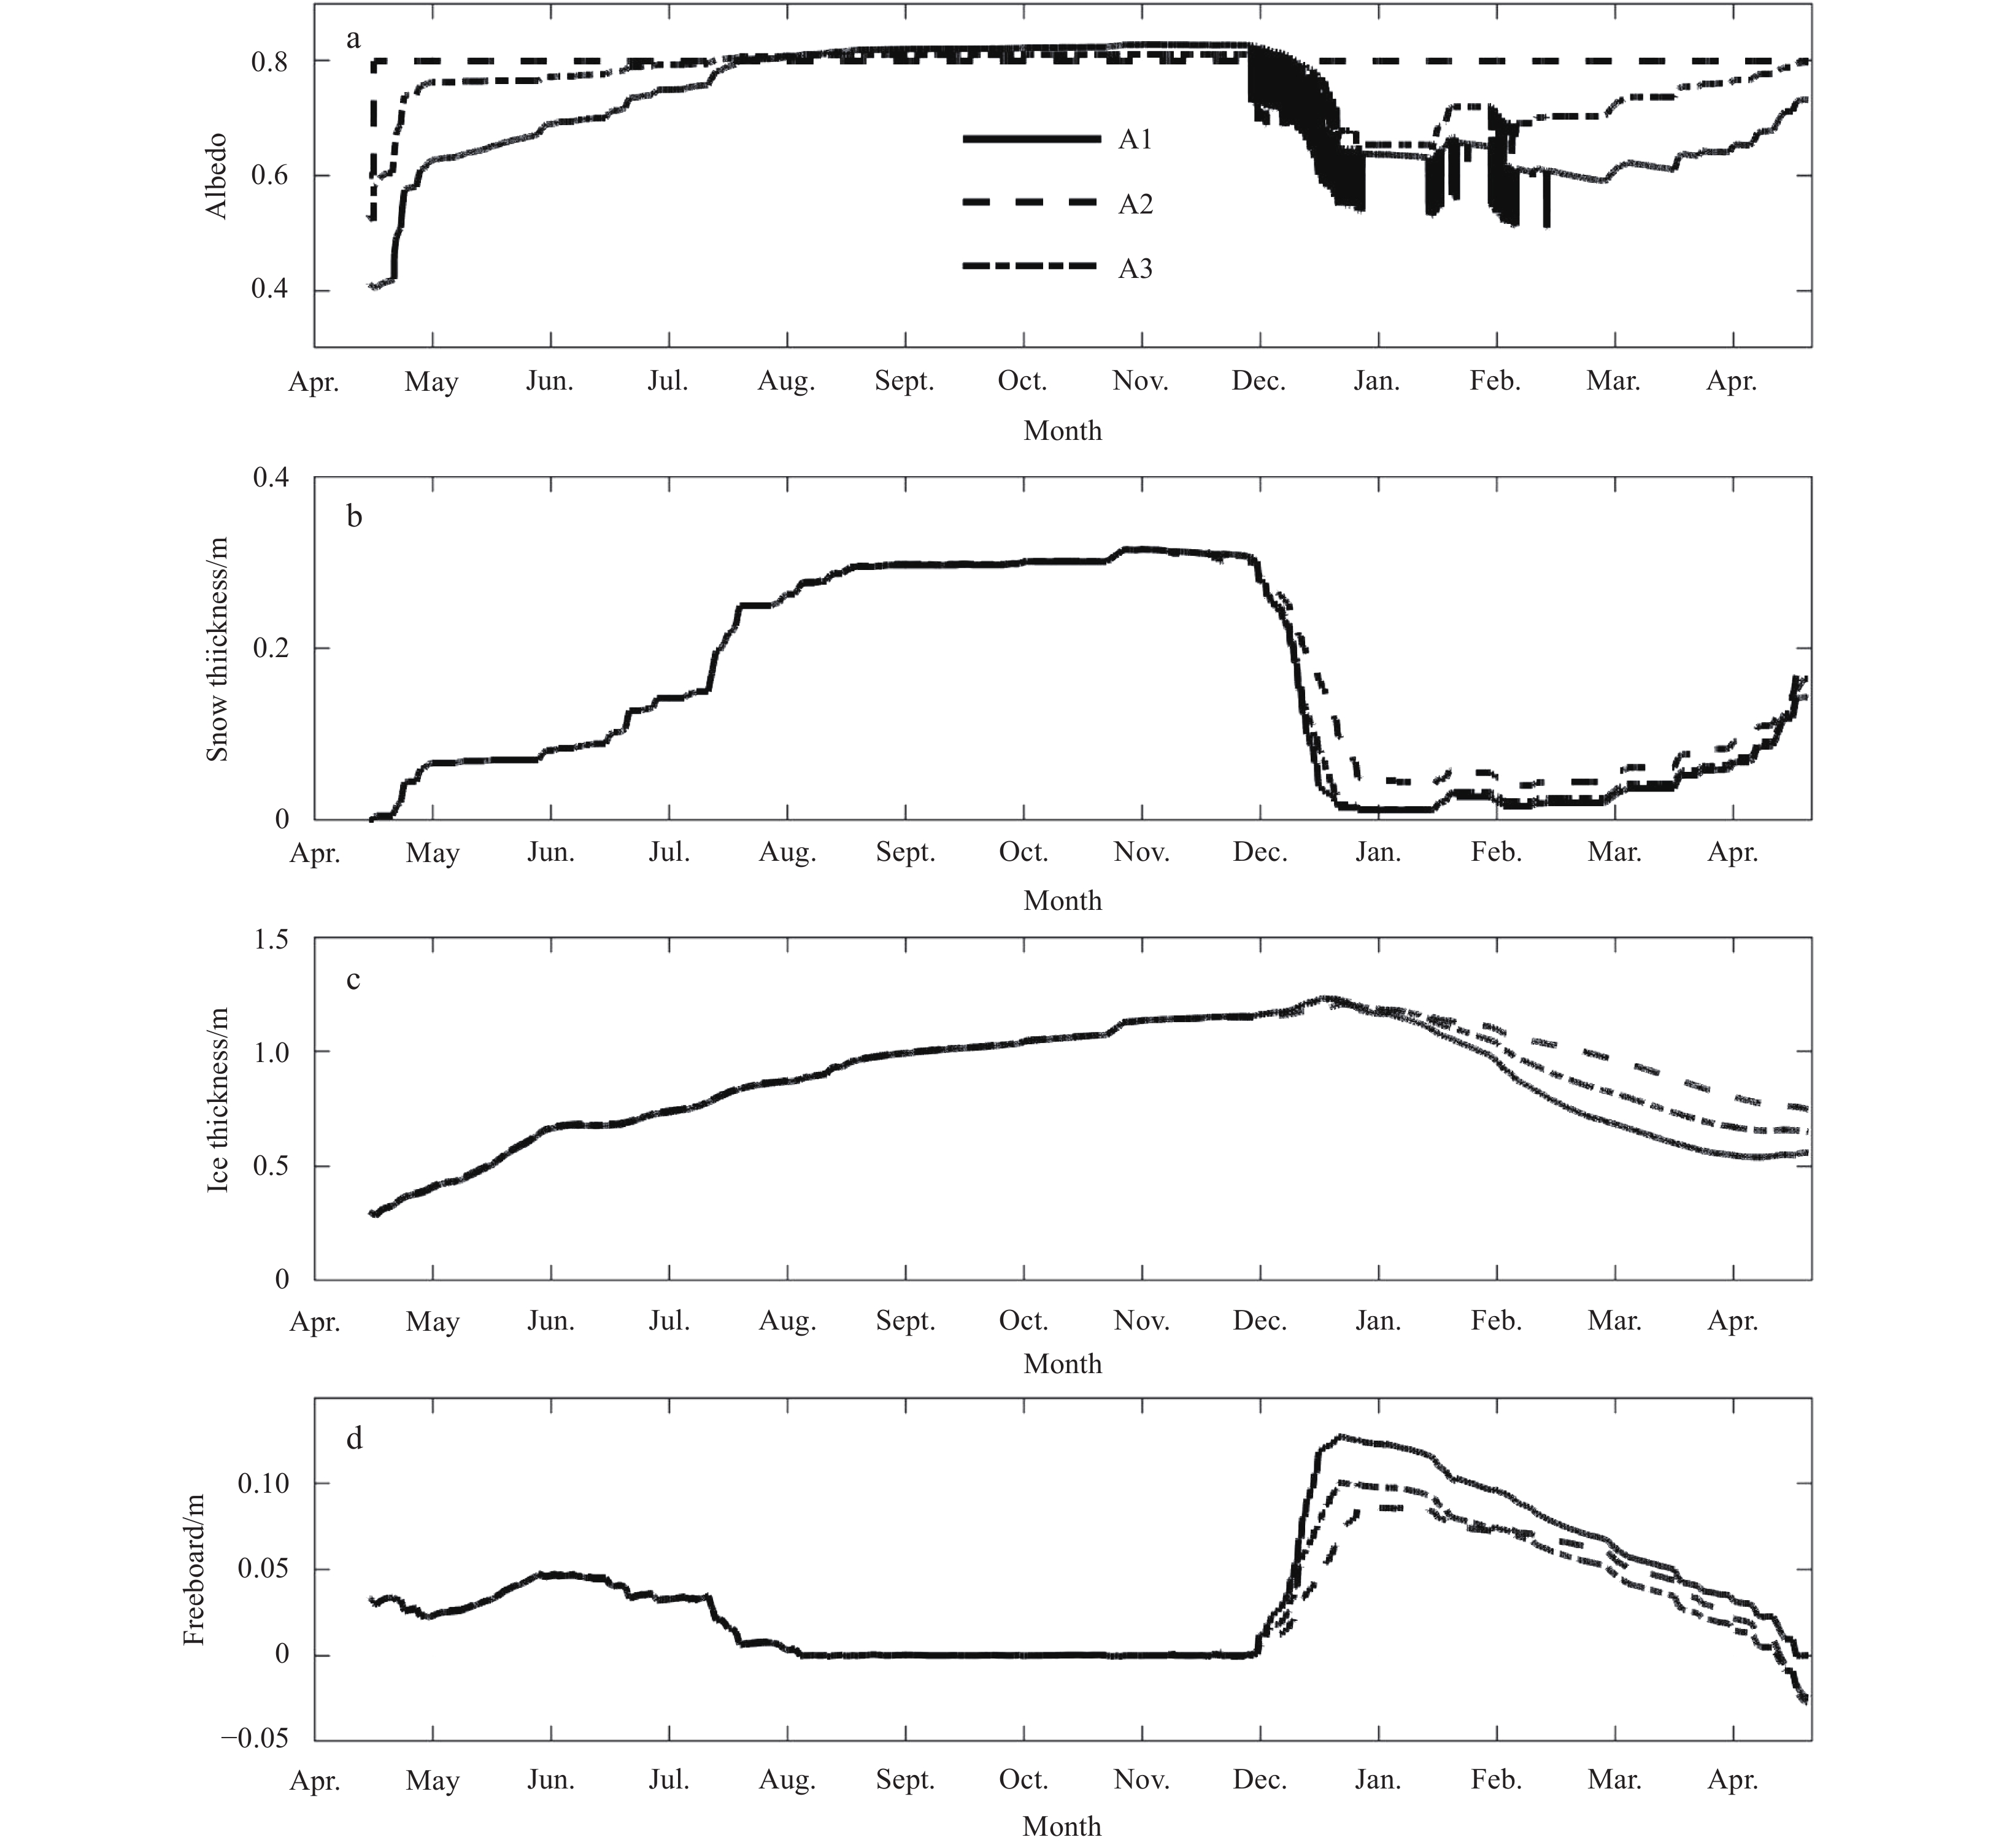
Figure 9. Results of albedo sensitivity experiments: albedo (a), snow thickness (b), ice thickness (c), and freeboard (d). The model setup and forcing was the same as Exp. F3 except for albedo schemes.

Figure 10. Sensitivity experiments of different precipitation schemes for early ice growth season (15 April−15 May): Exp. S1 (a), Exp. S2 (b), Exp. S3 (c), and Exp. S4 (d). The zero position represents the snow/ice interface.

Figure 11. Sensitivity experiments of different snow melt rate schemes for the onset of surface melt (15 November−15 December): Exp. M1 (a), Exp. M2 (b), Exp. M3 (c), and Exp. M4 (d). The zero position represents the snow/ice interface.
Table 1. Descriptions of FYI sensitivity experiments with different precipitation schemes
Exp. name Start time/a Run time/a Initial ice thickness/m Initial snow thickness Precipitation scheme F1 15 April 1 0.3 0 0 F2 15 April 1 0.3 0 half Prec F3 15 April 1 0.3 0 normal Prec F4 15 April 1 0.3 0 double Prec  下载: 导出CSV
Table 2. Detail descriptions of three albedo schemes used in the albedo sensitivity experiments. The symbols
$ {H}_{{\rm{i}}} $ and$ {H}_{{\rm{s}}} $ represent ice and snow thickness. The symbols$ {T}_{{\rm{is}}} $ and$ {T}_{{\rm{m}}} $ represent ice surface temperature and ice melt point. The symbols$ {\rm{vs}} $ and$ {\rm{ni}} $ represent visible and near-infrared albedos. The symbol${T}_{{\rm{ss}}}$ represents snow surface temperatureAlbedo scheme Formula for ice and snow albedo A1 $alb\_i\sim {(H}_{{\rm{i}}}{T}_{{\rm{is}}}{T}_{{\rm{m}}}); alb\_s\sim ({al{b}_{{\rm{i}}}H}_{{\rm{s}}}{T}_{{\rm{is}}})$ A2 $alb\_i\!\!=\!\!0.6; alb\_s\!\!=\!\!0.8$ A3 $alb\_i\sim \left({alb}_{{\rm{i}}}^{{\rm{vs}}}{alb}_{{\rm{i}}}^{{\rm{ni}}}{ {H}_{{\rm{i}}}T}_{{\rm{is}}}\right); alb\_s\sim \left({alb}_{{\rm{s}}}^{{\rm{vs}}}{alb}_{{\rm{s}}}^{{\rm{ni}}}{T}_{{\rm{ss}}}\right)$
下载: 导出CSV
Table 3. The statistic results from albedo sensitivity experiments
A1 A2 A3 Maximum snow thickness 1.23 1.21 1.23 Maximum ice thickness 0.32 0.32 0.32 Accumulated ice bottom growth 0.37 0.33 0.35 Accumulated snow ice 0.13 0.09 0.09 Accumulated superimposed ice 0.10 0.11 0.11 Accumulated ice internal melting 0.34 0.10 0.22
下载: 导出CSV
-
[1] Arndt S, Willmes S, Dierking W, et al. 2016. Timing and regional patterns of snowmelt on Antarctic sea ice from passive microwave satellite observations. Journal of Geophysical Research: Oceans, 121(8): 5916–5930. doi: 10.1002/2015JC011504 [2] Briegleb B P, Bitz C M, Hunke E C, et al. 2004. Scientific description of the sea ice component in the community climate system model, version 3. NCAR/TN-463+STR. Boulder, CO, USA: National Center for Atmospheric Research [3] Cheng Bin, Launiainen J, Vihma T. 2003. Modelling of superimposed ice formation and sub-surface melting in the Baltic Sea. Geophysica, 39(1–2): 31–50 [4] Cheng Bin, Vihma T, Pirazzini R, et al. 2006. Modelling of superimposed ice formation during the spring snowmelt period in the Baltic Sea. Annals of Glaciology, 44: 139–146. doi: 10.3189/172756406781811277 [5] Cheng Bin, Vihma T, Rontu L, et al. 2014. Evolution of snow and ice temperature, thickness and energy balance in Lake Orajärvi, northern Finland. Tellus A: Dynamic Meteorology and Oceanography, 66(1): 21564. doi: 10.3402/tellusa.v66.21564 [6] Cheng Bin, Zhang Zhanhai, Vihma T, et al. 2008. Model experiments on snow and ice thermodynamics in the Arctic Ocean with CHINARE 2003 data. Journal of Geophysical Research, 113: C09020 [7] Crocker G B, Wadhams P. 1989. Modelling Antarctic fast-ice growth. Journal of Glaciology, 35(119): 3–8. doi: 10.3189/002214389793701590 [8] Heil P. 2006. Atmospheric conditions and fast ice at Davis, East Antarctica: A case study. Journal of Geophysical Research, 111(C5): C05009 [9] Heil P, Allison I, Lytle V I. 1996. Seasonal and interannual variations of the oceanic heat flux under a landfast Antarctic sea ice cover. Journal of Geophysical Research, 101(C11): 25741–25752. doi: 10.1029/96JC01921 [10] Launiainen J, Cheng Bin. 1998. Modelling of ice thermodynamics in natural water bodies. Cold Regions Science and Technology, 27(3): 153–178. doi: 10.1016/S0165-232X(98)00009-3 [11] Lei Ruibo, Li Zhijun, Cheng Yanfeng, et al. 2009. A new apparatus for monitoring sea ice thickness based on the magnetostrictive-delay-line principle. Journal of Atmospheric & Oceanic Technology, 26(4): 818–827 [12] Lei Ruibo, Li Zhijun, Cheng Bin, et al. 2010. Annual cycle of landfast sea ice in Prydz Bay, East Antarctica. Journal of Geophysical Research, 115(C2): C02006 [13] Lynch A H, Chapman W L, Walsh J E, et al. 1995. Development of a regional climate model of the western Arctic. Journal of Climate, 8(6): 1555–1570. doi: 10.1175/1520-0442(1995)008<1555:DOARCM>2.0.CO;2 [14] Maksym T, Markus T. 2008. Antarctic Sea ice thickness and snow-to-ice conversion from atmospheric reanalysis and passive microwave snow depth. Journal of Geophysical Research, 113: C02S12 [15] Massom R A, Drinkwater M R, Haas C. 1997. Winter snow cover on sea ice in the Weddell Sea. Journal of Geophysical Research, 102(C1): 1101–1117. doi: 10.1029/96JC02992 [16] Massom R A, Eicken H, Hass C, et al. 2001. Snow on Antarctic sea ice. Reviews of Geophysics, 39(3): 413–445. doi: 10.1029/2000RG000085 [17] Nicolaus M, Haas C, Willmes S. 2009. Evolution of first-year and second-year snow properties on sea ice in the Weddell Sea during spring-summer transition. Journal of Geophysical Research, 114: D17109. doi: 10.1029/2008JD011227 [18] Parkinson C L, Washington W M. 1979. A large-scale numerical model of sea ice. Journal of Geophysical Research: Oceans, 84(C1): 311–337. doi: 10.1029/JC084iC01p00311 [19] Powell D C, Markus T, Stössel A. 2005. Effects of snow depth forcing on Southern Ocean sea ice simulations. Journal of Geophysical Research, 110: C06001 [20] Tang Shulin, Qin Dahe, Ren Jiawen, et al. 2006. Sea ice characteristics between Middle Weddell Sea and Prydz Bay, Antarctic during the 2003 Australian summer. Earth Science Frontiers (in Chinese), 13(3): 213–218 [21] Yang Yu, Leppäranta M, Cheng Bin, et al. 2012. Numerical modelling of snow and ice thicknesses in Lake Vanajavesi, Finland. Tellus A: Dynamic Meteorology and Oceanography, 64: 17202. doi: 10.3402/tellusa.v64i0.17202 [22] Yang Yu, Li Zhijun, Leppäranta M, et al. 2010. Estimation of oceanic heat flux under landfast sea ice in Prydz Bay, East Antarctica. In: Proceedings of the 20th IAHR International Symposium on Ice. Lahti, Finland, June 14 to 18, 2010 [23] Yang Yu, Li Zhijun, Leppäranta M, et al. 2016a. Modelling the thickness of landfast sea ice in Prydz Bay, East Antarctica. Antarctic Science, 28(1): 59–70. doi: 10.1017/S0954102015000449 [24] Yang Qinghua, Liu Jiping, Leppäranta M, et al. 2016b. Albedo of coastal landfast sea ice in Prydz Bay, Antarctica: Observations and parameterization. Advances in Atmospheric Sciences, 33(5): 535–543. doi: 10.1007/s00376-015-5114-7 [25] Yu Lejiang, Yang Qinghua, Vihma T, et al. 2018. Features of extreme precipitation at Progress Station, Antarctica. Journal of Climate, 31(22): 9087–9105. doi: 10.1175/JCLI-D-18-0128.1 [26] Yu Lejiang, Yang Qinghua, Zhou Mingyu, et al. 2019. The variability of surface radiation fluxes over landfast sea ice near Zhongshan Station, East Antarctica during austral spring. International Journal of Digital Earth, 12(8): 860–877. doi: 10.1080/17538947.2017.1304458 [27] Zhao Jiechen, Cheng Bin, Timo V, et al. 2020. Land-Fast Sea Ice Prediction System (FIPS) for Prydz Bay, East Antarctica: An operational service for CHINARE. Annals of Glaciology, 61(83): 271–283. doi: 10.1017/aog.2020.46 [28] Zhao Jiechen, Cheng Bin, Vihma T, et al. 2019a. Observation and thermodynamic modeling of the influence of snow cover on landfast sea ice thickness in Prydz Bay, East Antarctica. Cold Regions Science and Technology, 168: 102869. doi: 10.1016/j.coldregions.2019.102869 [29] Zhao Jiechen, Cheng Bin, Yang Qinghua, et al. 2017. Observations and modelling of first-year ice growth and simultaneous second-year ice ablation in the Prydz Bay, East Antarctica. Annals of Glaciology, 58(75pt1): 59–67. doi: 10.1017/aog.2017.33 [30] Zhao Jiechen, Yang Qinghua, Cheng Bin, et al. 2019b. Spatial and temporal evolution of landfast ice near Zhongshan Station, East Antarctica, over an annual cycle in 2011/2012. Acta Oceanologica Sinica, 38(5): 51–61. doi: 10.1007/s13131-018-1339-5 -


 点击查看大图

计量
- 文章访问数: 377
- HTML全文浏览量: 132
- PDF下载量: 9
- 被引次数: 0

