

Fluxes of riverine nutrient to the Zhujiang River Estuary and its potential eutrophication effect
-
Abstract: The Zhujiang River Estuary is becoming eutrophic due to the impact of anthropogenic activities in the past decades. To understand nutrient dynamics and fluxes to the Lingdingyang water via four outlets (Humen, Jiaomen, Hongqimen and Hengmen), we investigated the spatial distribution and seasonal variation of dissolved nutrients in the Zhujiang River Estuary, based on fourteen cruises conducted from March 2015 to October 2017, covering both wet (April to September) and dry (October to March next year) seasons. Our results showed that riverine fluxes of dissolved inorganic nitrogen (DIN) and dissolved silicate (DSi) into the Lingdingyang water through four outlets varied seasonally due to the influence of river discharge, with the highest in spring and the lowest in winter. However, riverine flux of phosphate exhibited little significant seasonal variability. Riverine nutrients into the Lingdingyang water most resulted through Humen Outlet. The estuarine export fluxes of DIN out of the Zhujiang River Estuary derived from a box model were higher than fluxes of riverine nutrients in May, likely due to the influence of local sewage, while lower than riverine flux in August. The export fluxes of phosphate were higher than the fluxes of riverine phosphate in May and August. In contrast, large amounts of DSi were buried in the estuary in May and August. Although excess DIN was delivered into the Zhujiang River Estuary, eutrophication effect was not as severe as expected in the Zhujiang River Estuary, since the light limitation restricted the utilization of nutrients by phytoplankton.
-
Key words:
- riverine nutrient /
- flux /
- Lingdingyang /
- Zhujiang River Estuary /
- eutrophication
-
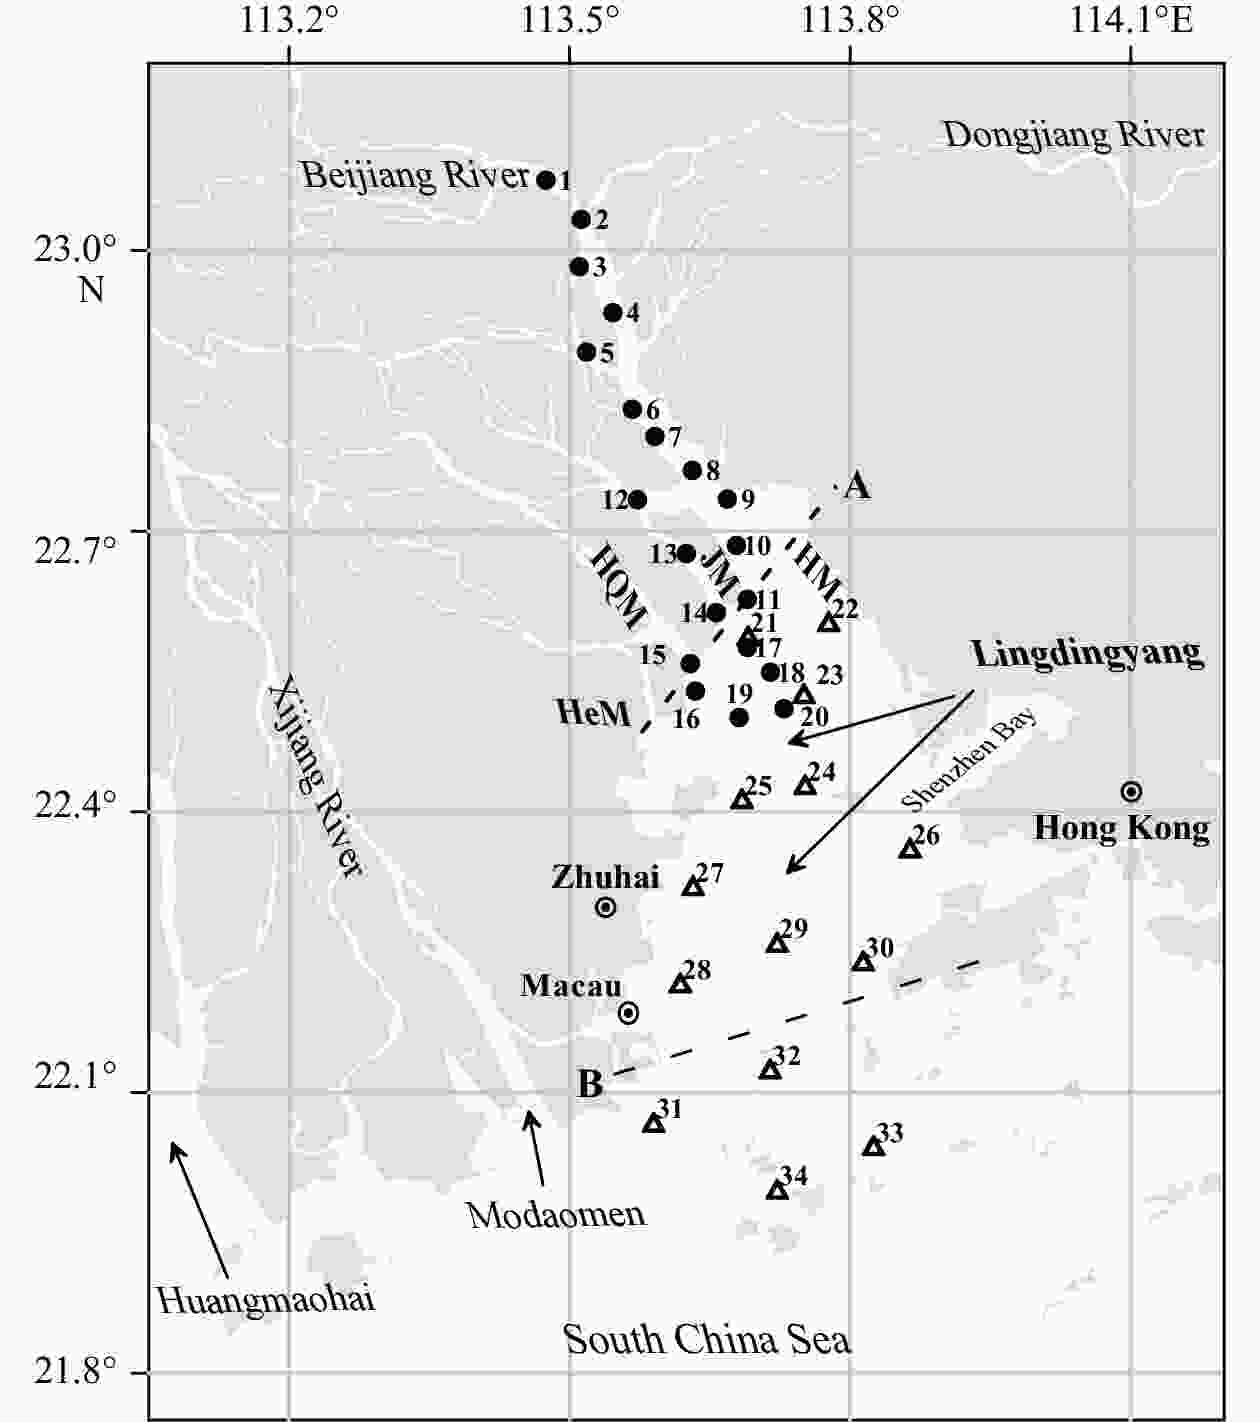
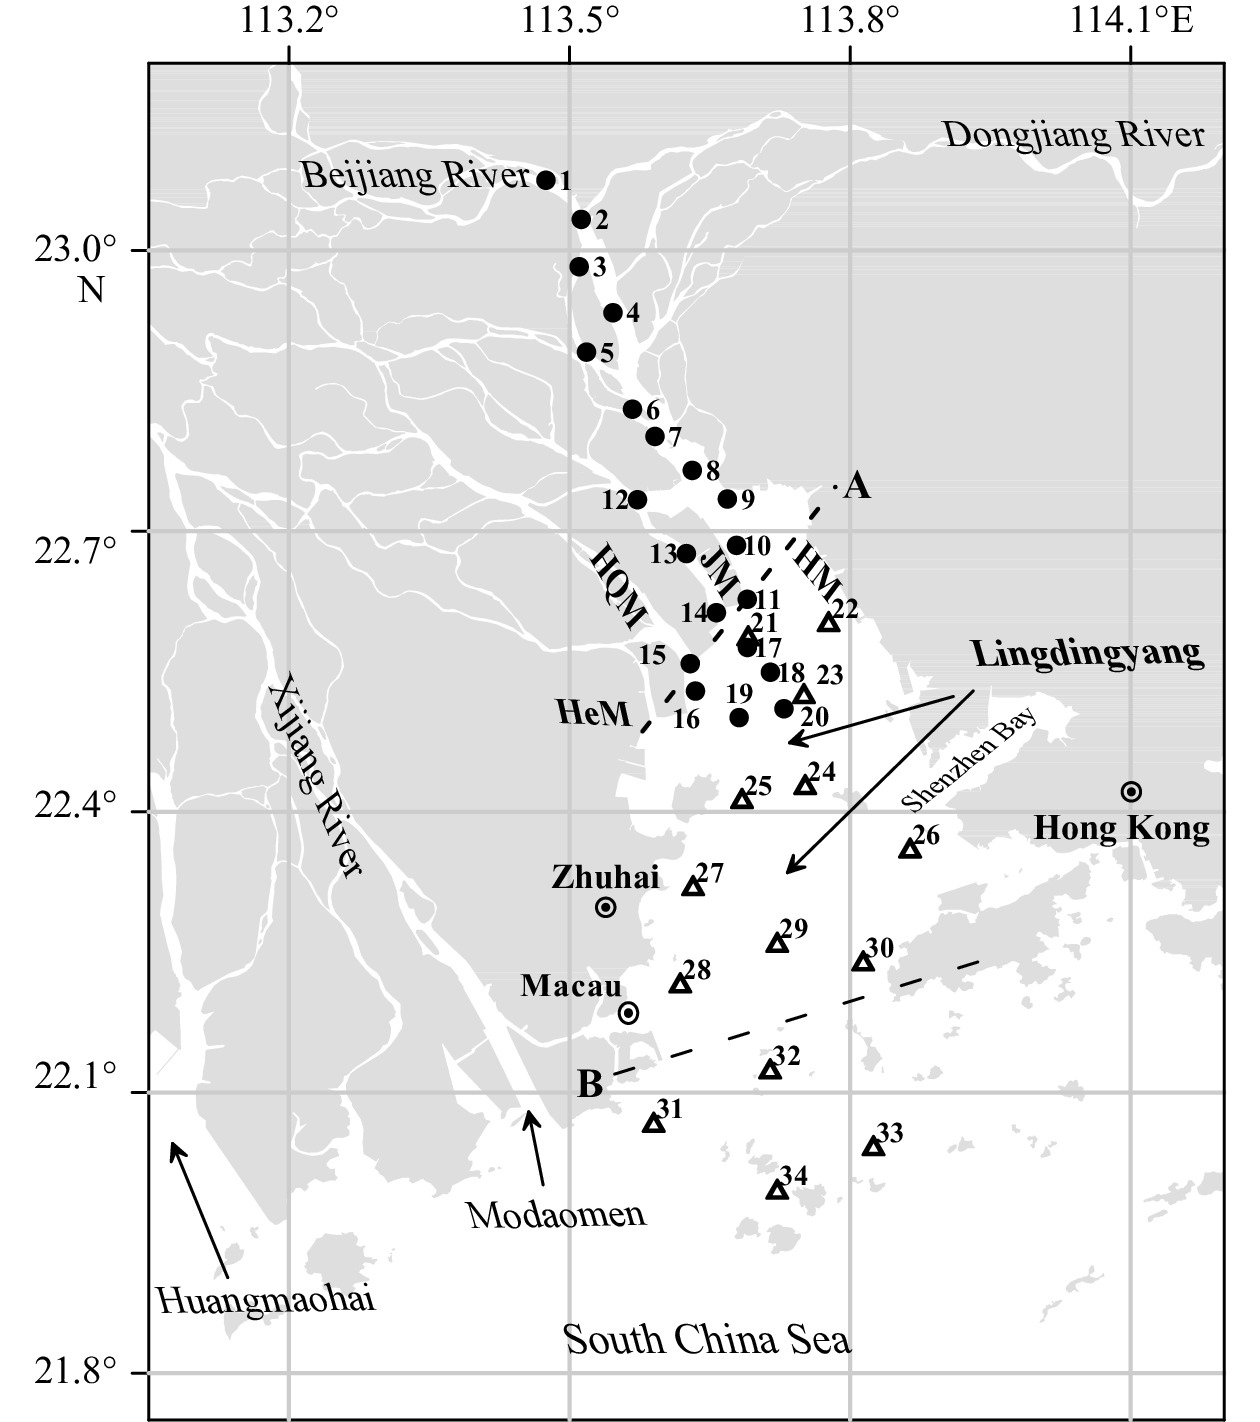
Figure 1. Location of sampling stations in the Zhujiang River Estuary during March 2015–October 2017. The solid circles denoted the sampling stations 1–20 during March 2015–October 2017; triangles, sampling stations 21–34 in May and August 2015. HM, JM, HQM and HeM represented the Humen, Jiaomen, Hongqimen and Hengmen, respectively. Dashed Line A was the boundary of riverine flux to the Lingdingyang water via four outlets; Line B showed the boundary of the budget systems as previous study (Liu et al., 2009).

Figure 2. Total Nutrient flux (residual flux (VRCR) and mixing exchange flux (VXCX)) from the Zhujiang River Estuary to the South China Sea derived from box model and riverine input (VQCQ) to the estuary.

Figure 3. Spatial and temporal variations in the surface salinity and temperature in the Zhujiang River Estuary during March 2015–October 2017. Vertical bars denoted standard deviation errors. HM, JM and HQM represented the Humen, Jiaomen and Hongqimen, respectively.

Figure 4. Spatial and temporal variations in the surface
${\rm{NO}}_3^- $ ,${\rm{NO}}_2^- $ ,${\rm{NH}}_4^+ $ , DIN, DIP and DSi concentrations in the Zhujiang River Estuary during March 2015–October 2017. Vertical bars denoted standard deviation errors. HM, JM and HQM represented the Humen, Jiaomen and Hongqimen, respectively.
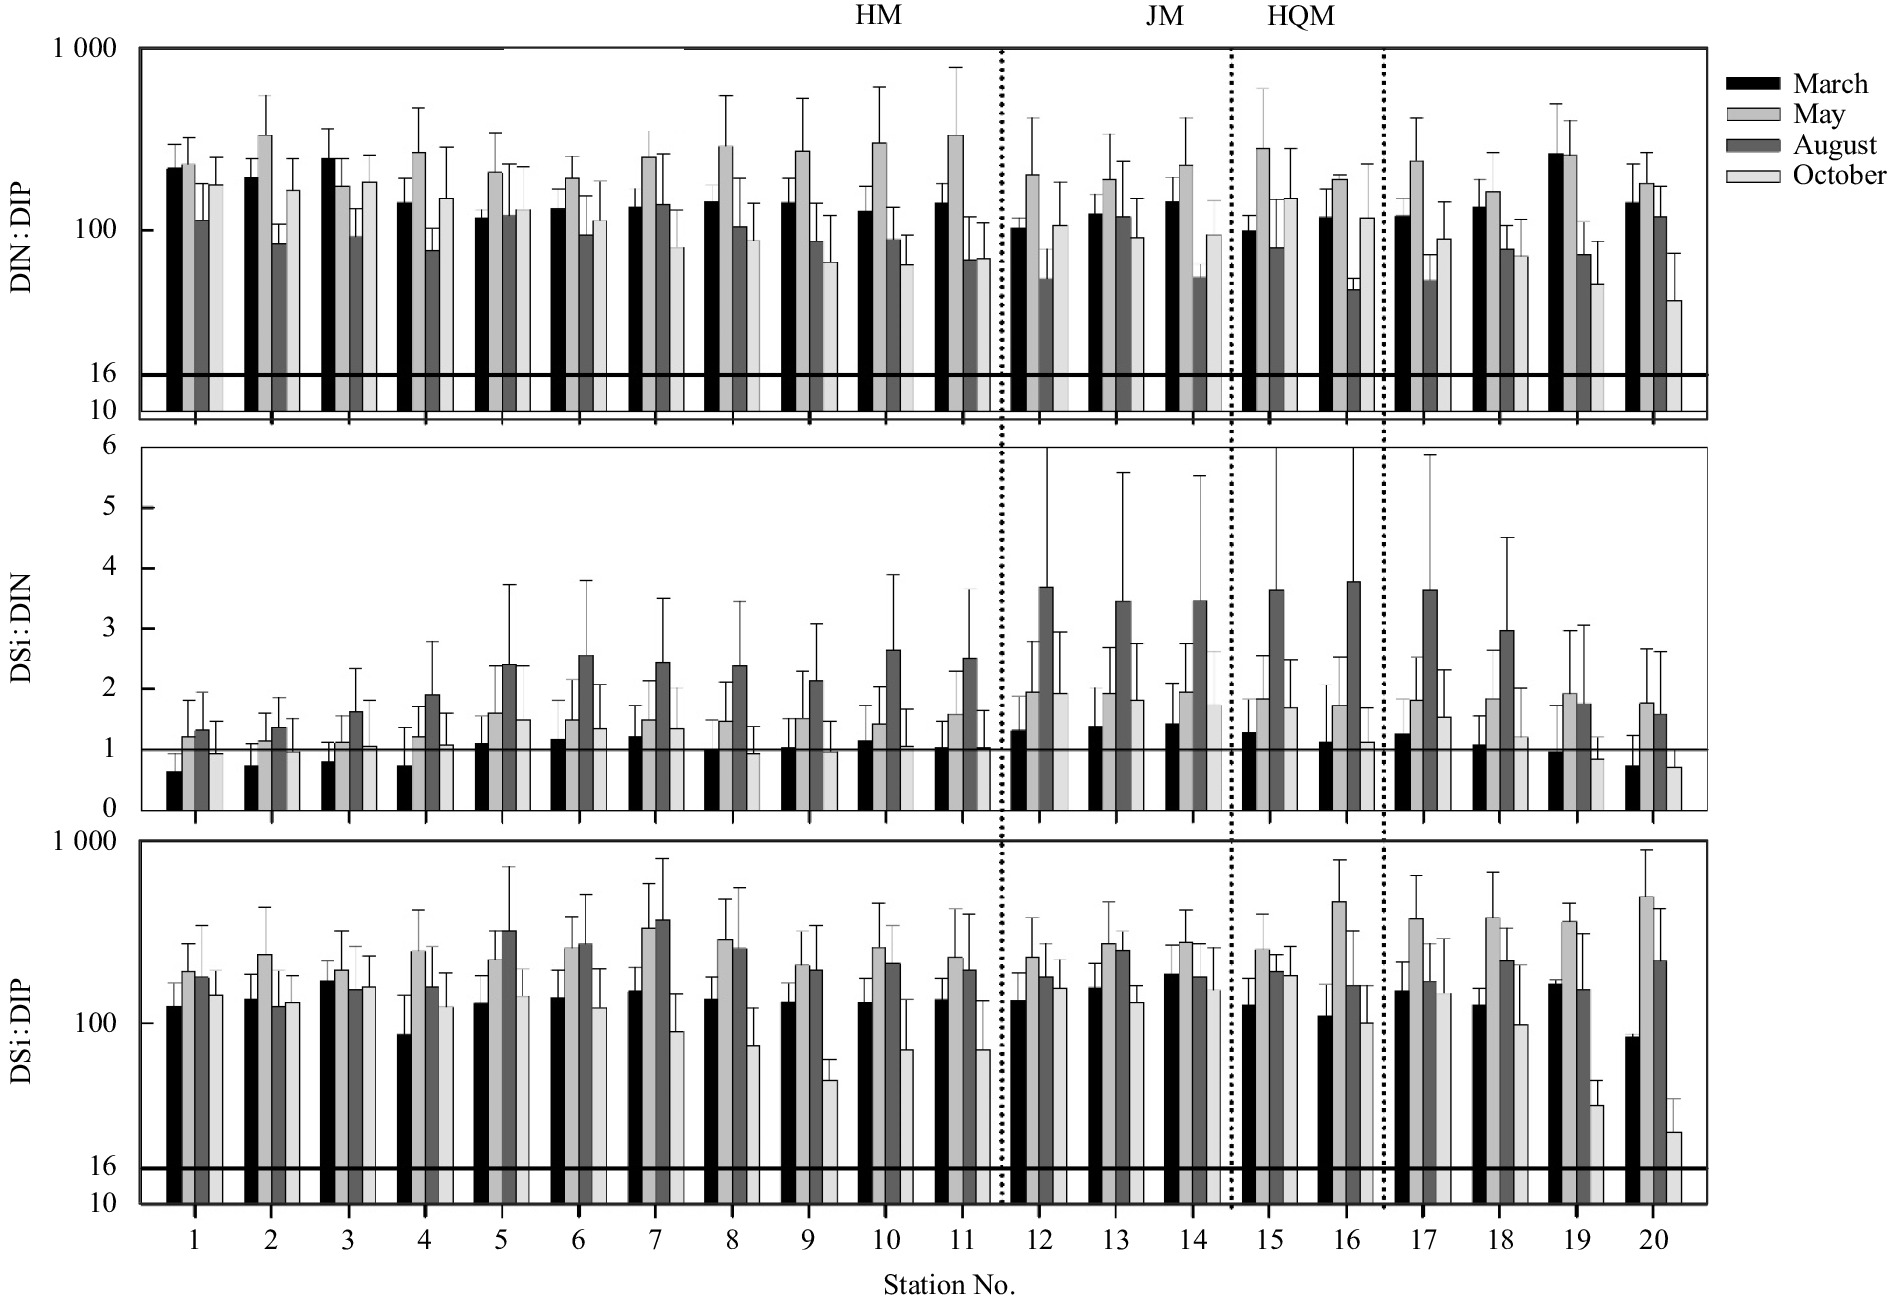
Figure 5. Monthly average concentration ratios of DIN:DIP, DSi:DIN and DSi:DIP at the sea surface at Stations 1−20 during March 2015–October 2017. Vertical bars denoted standard deviation errors. HM, JM and HQM represented the Humen, Jiaomen and Hongqimen, respectively.
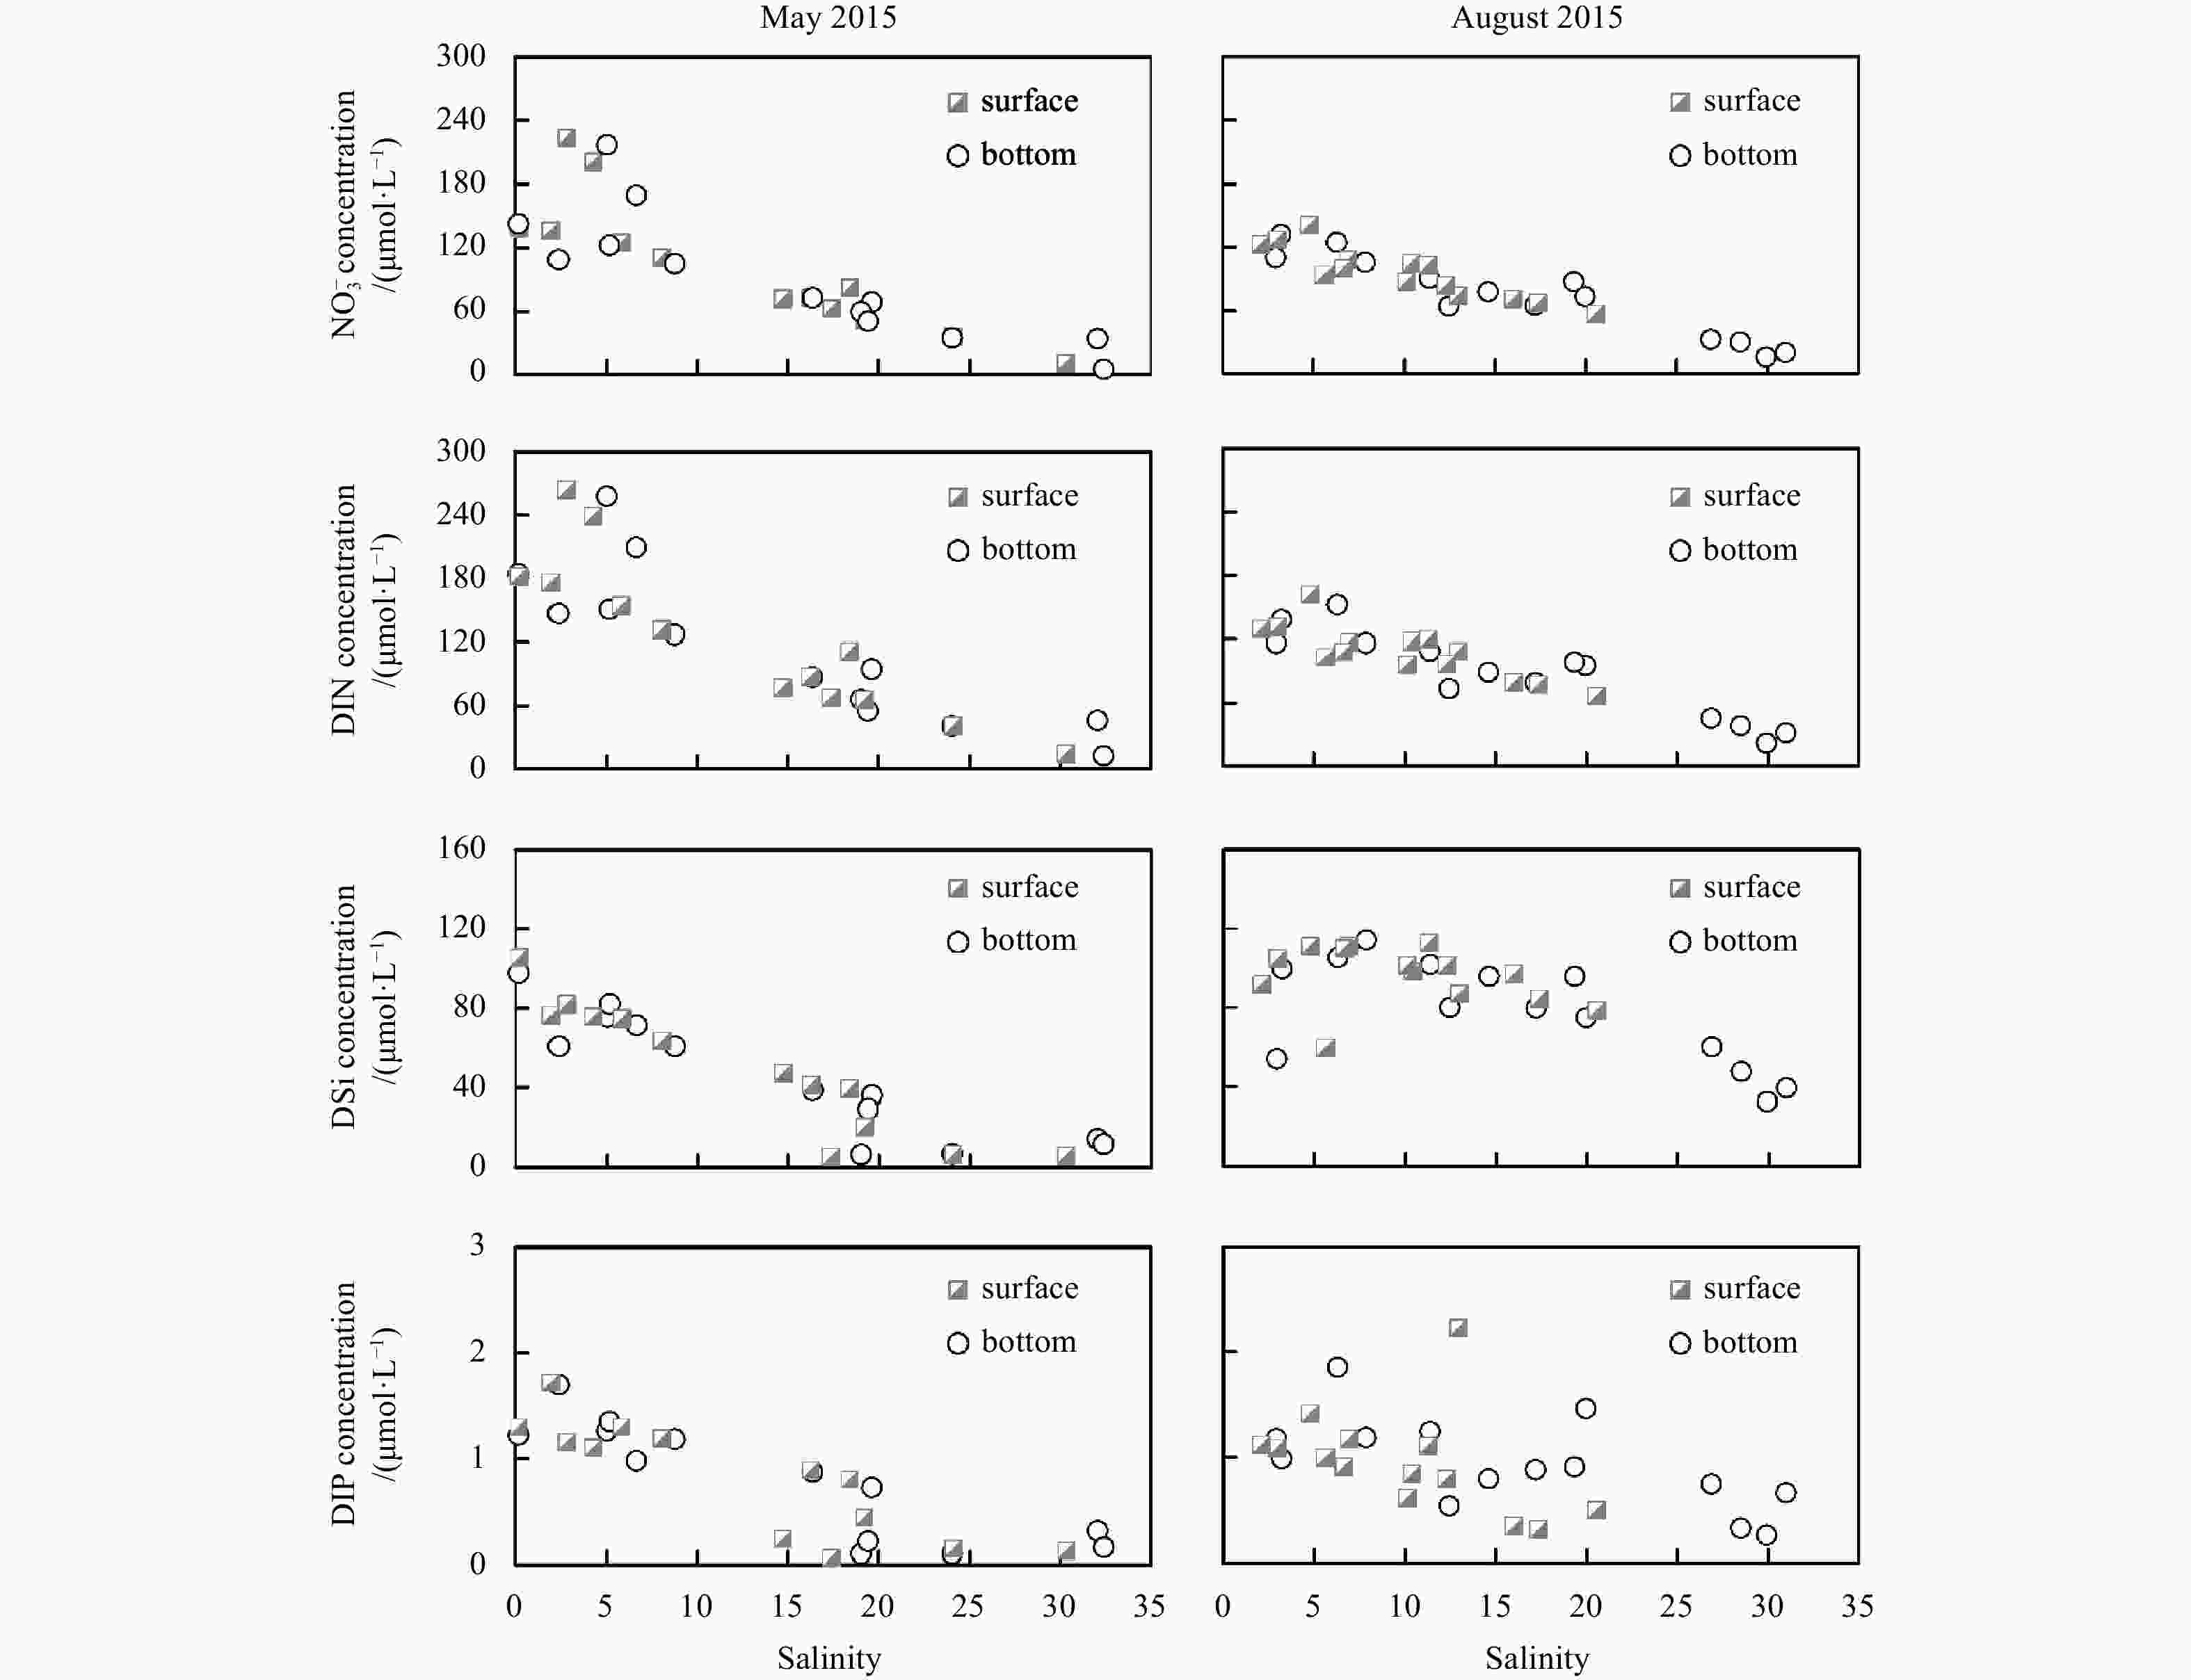
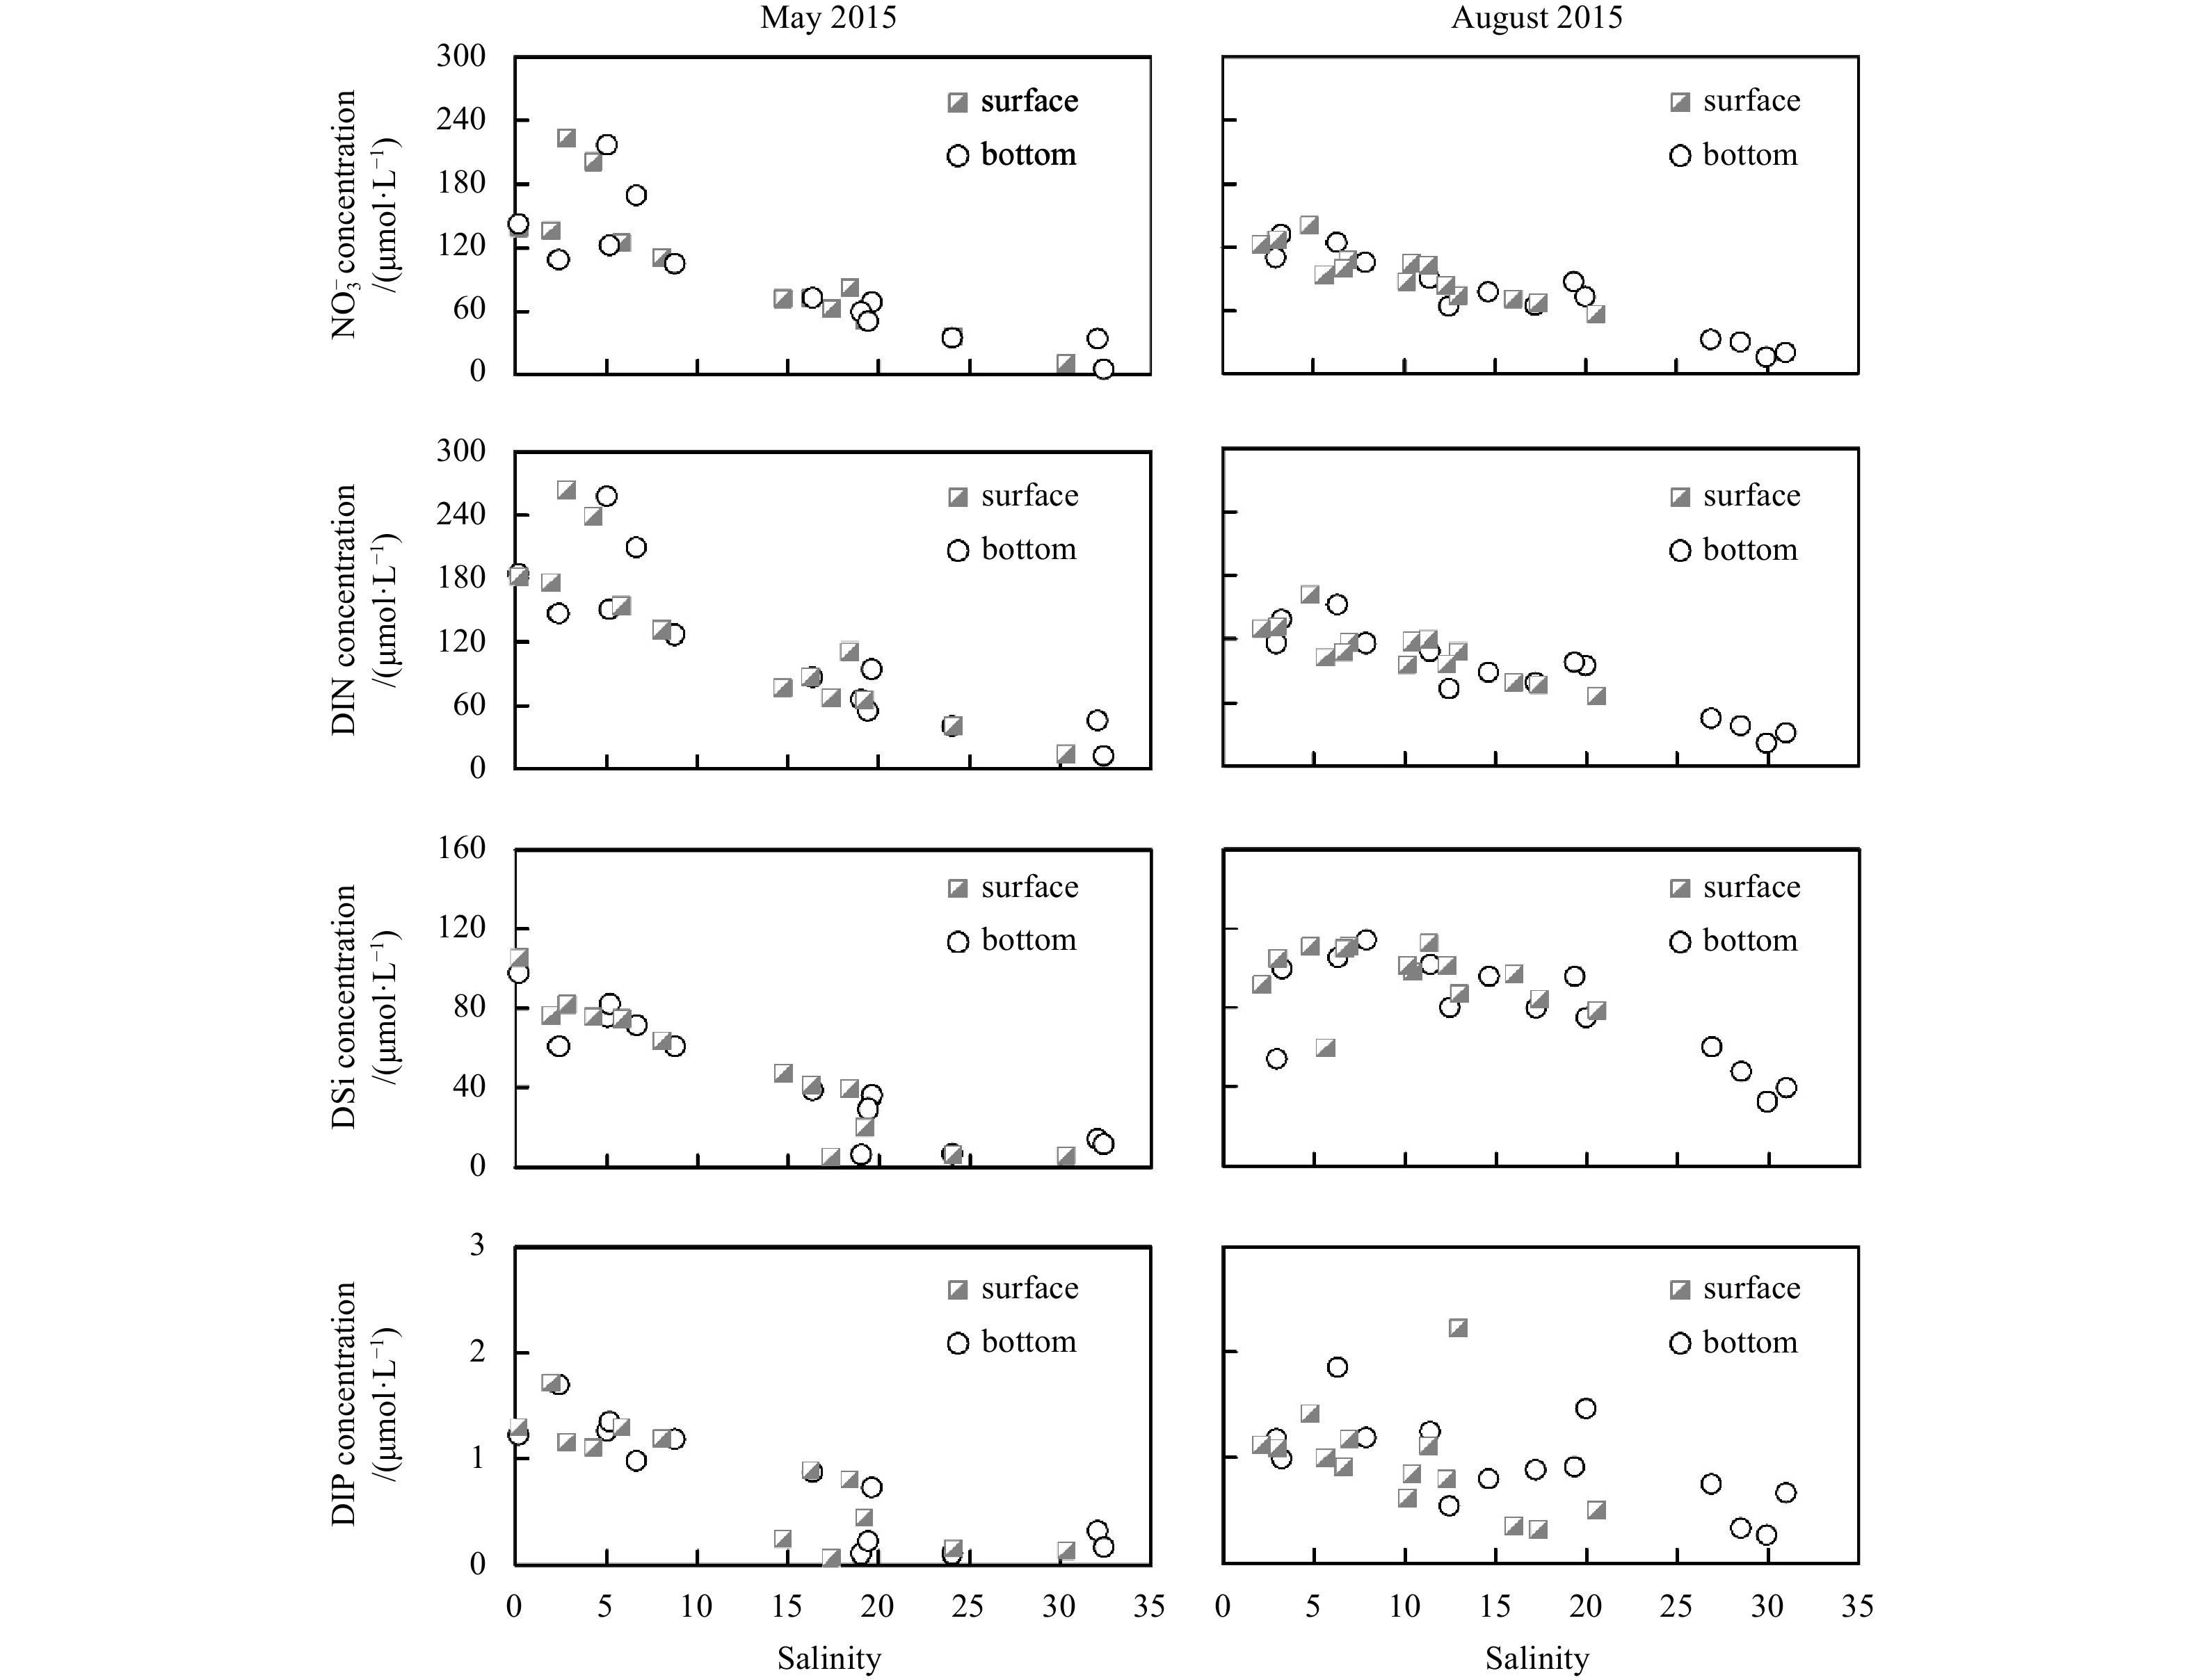
Figure 6. Variations in the concentrations of
${\rm{NO}}_3^- $ , DIN, DSi and DIP along a salinity gradient in the Zhujiang River Estuary at the sea surface and the sea bottom at Stations 21–34 in May and August 2015.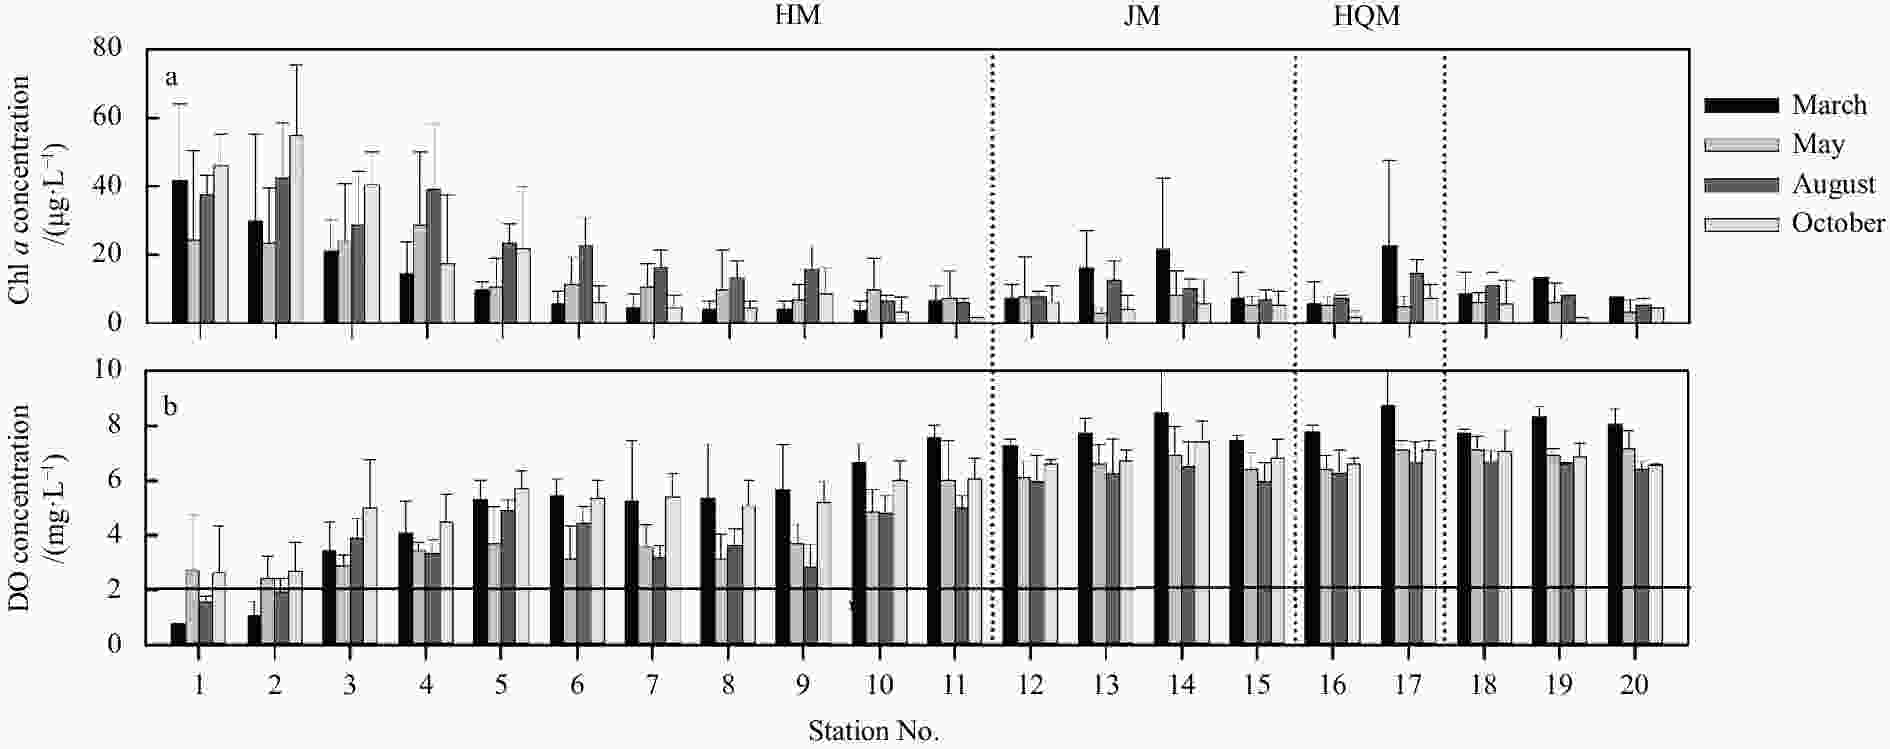
Figure 7. Spatial and temporal variations in chlorophyll a (Chl a) (a) and dissolved oxygen (DO) (b) concentrations at the sea surface during March 2015–October 2017. The solid line in b represented the value of DO equalled to 2 mg/L. Vertical bars denoted standard errors. HM, JM and HQM represented the Humen, Jiaomen and Hongqimen, respectively.
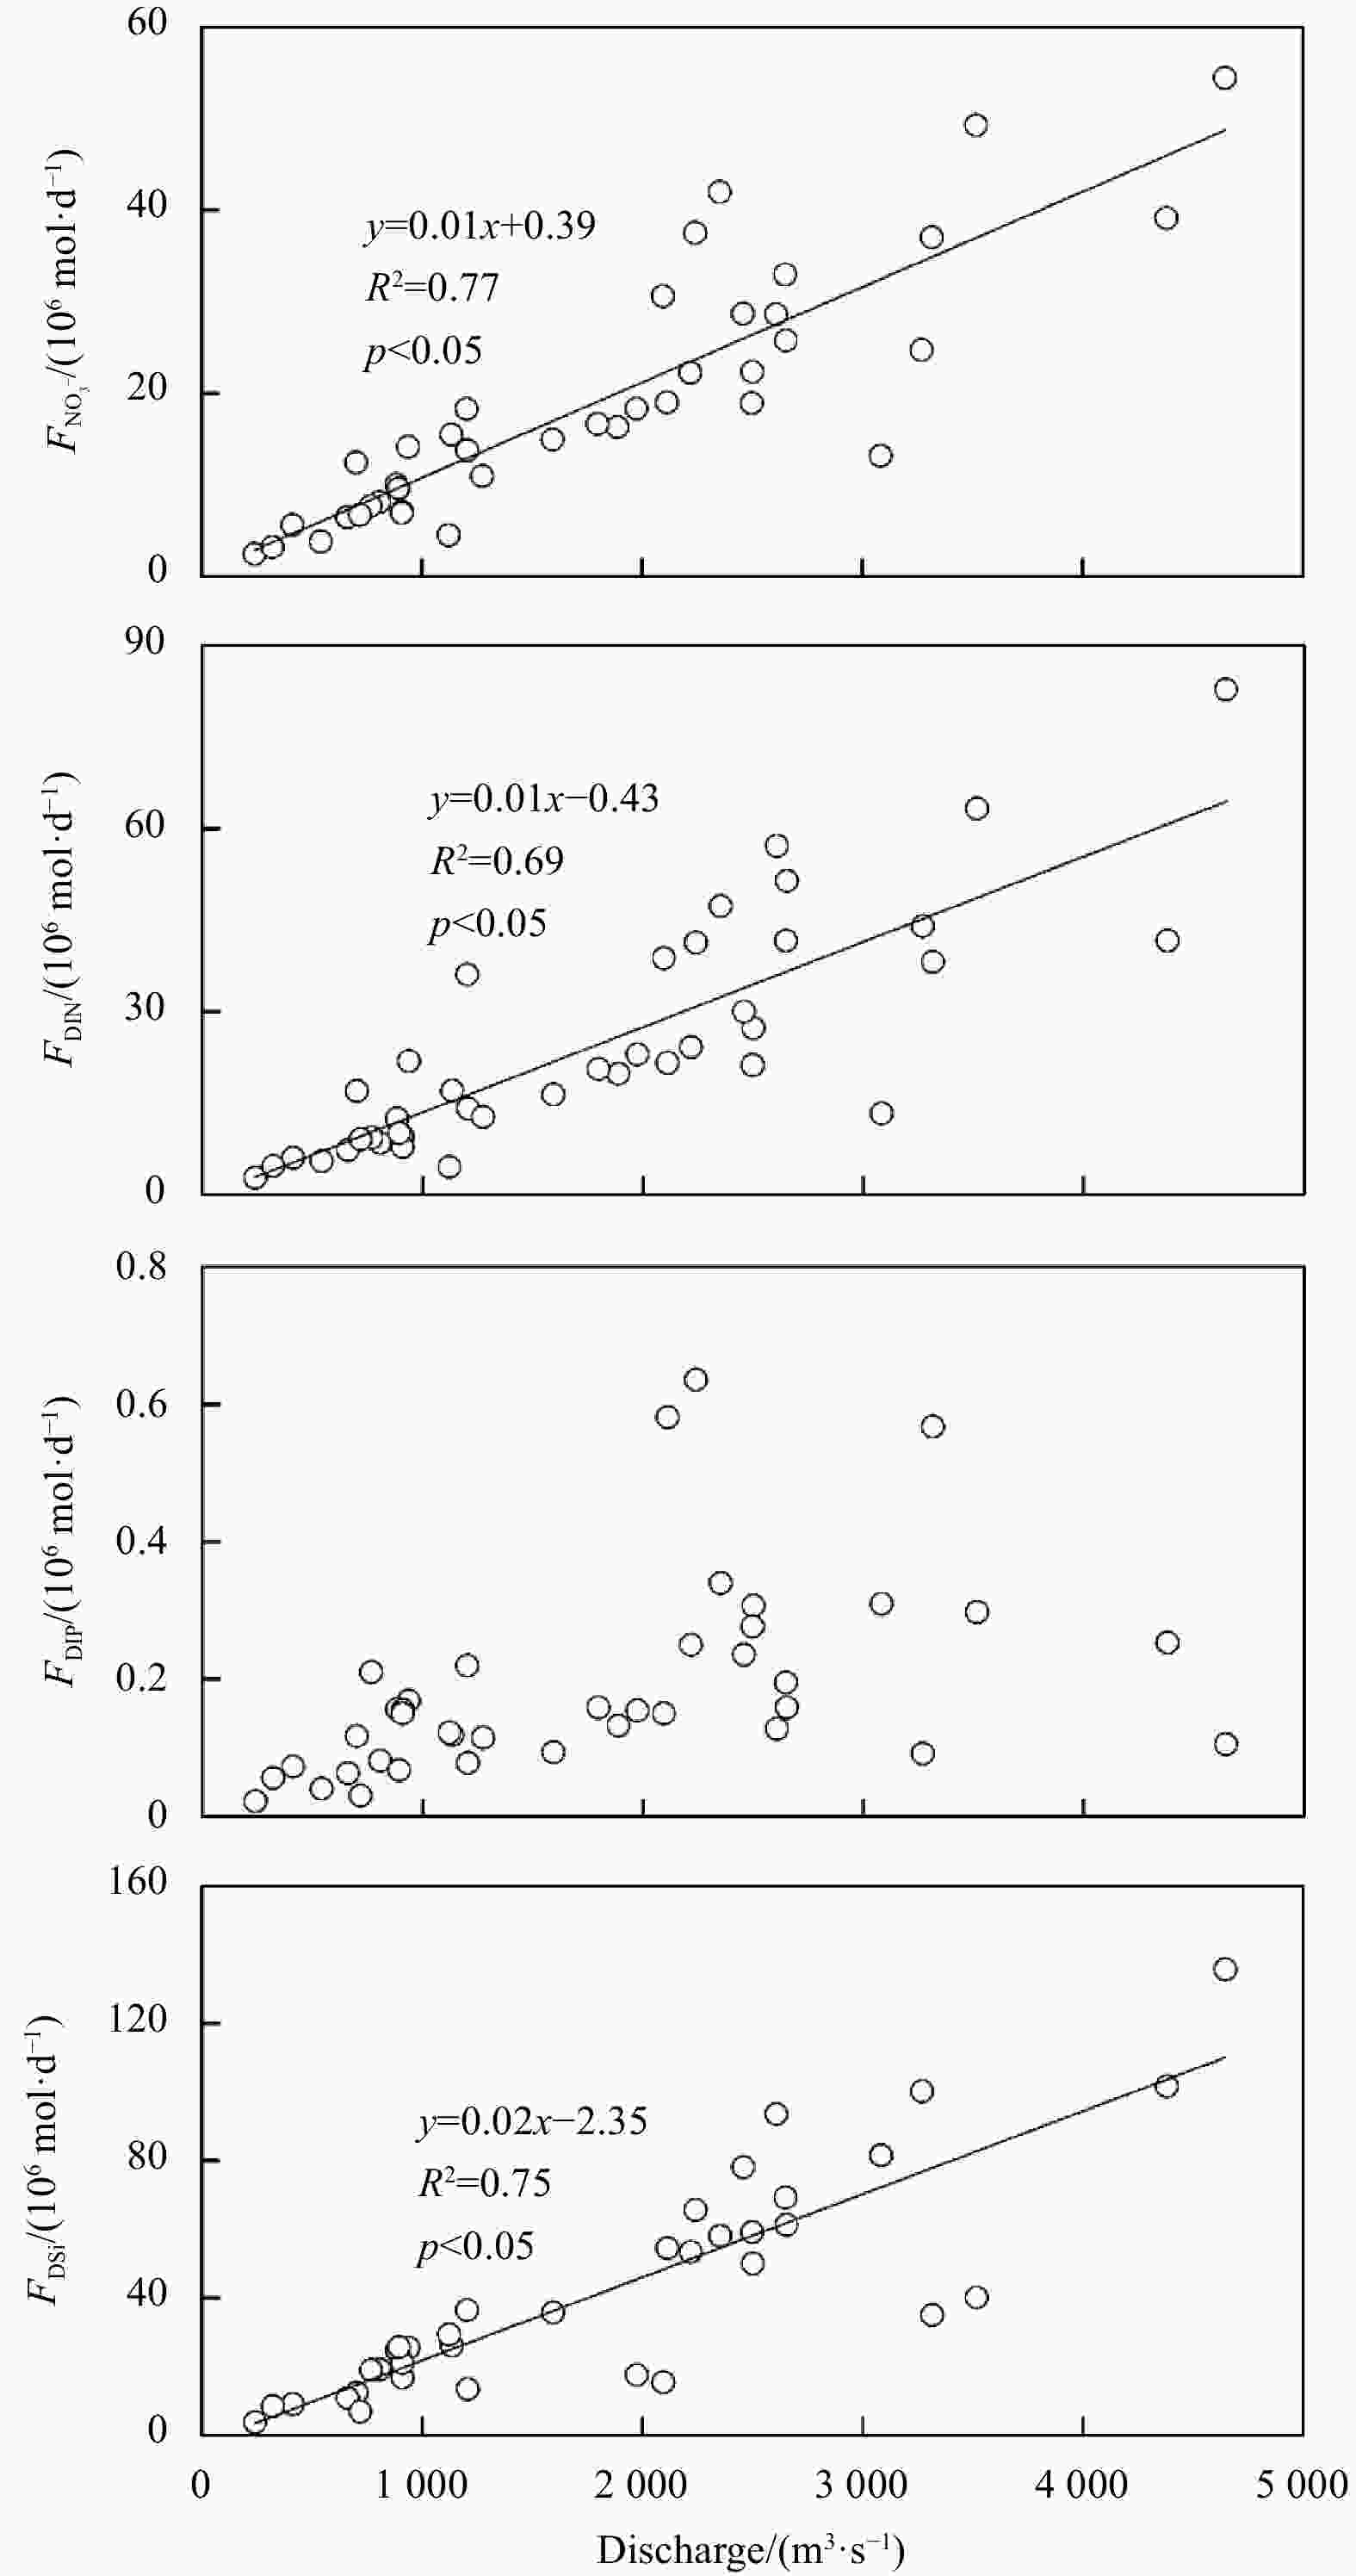
Figure 8. Relationship between riverine nutrients fluxes to the Lingdingyang water via four outlets and the river discharge at the sea surface.
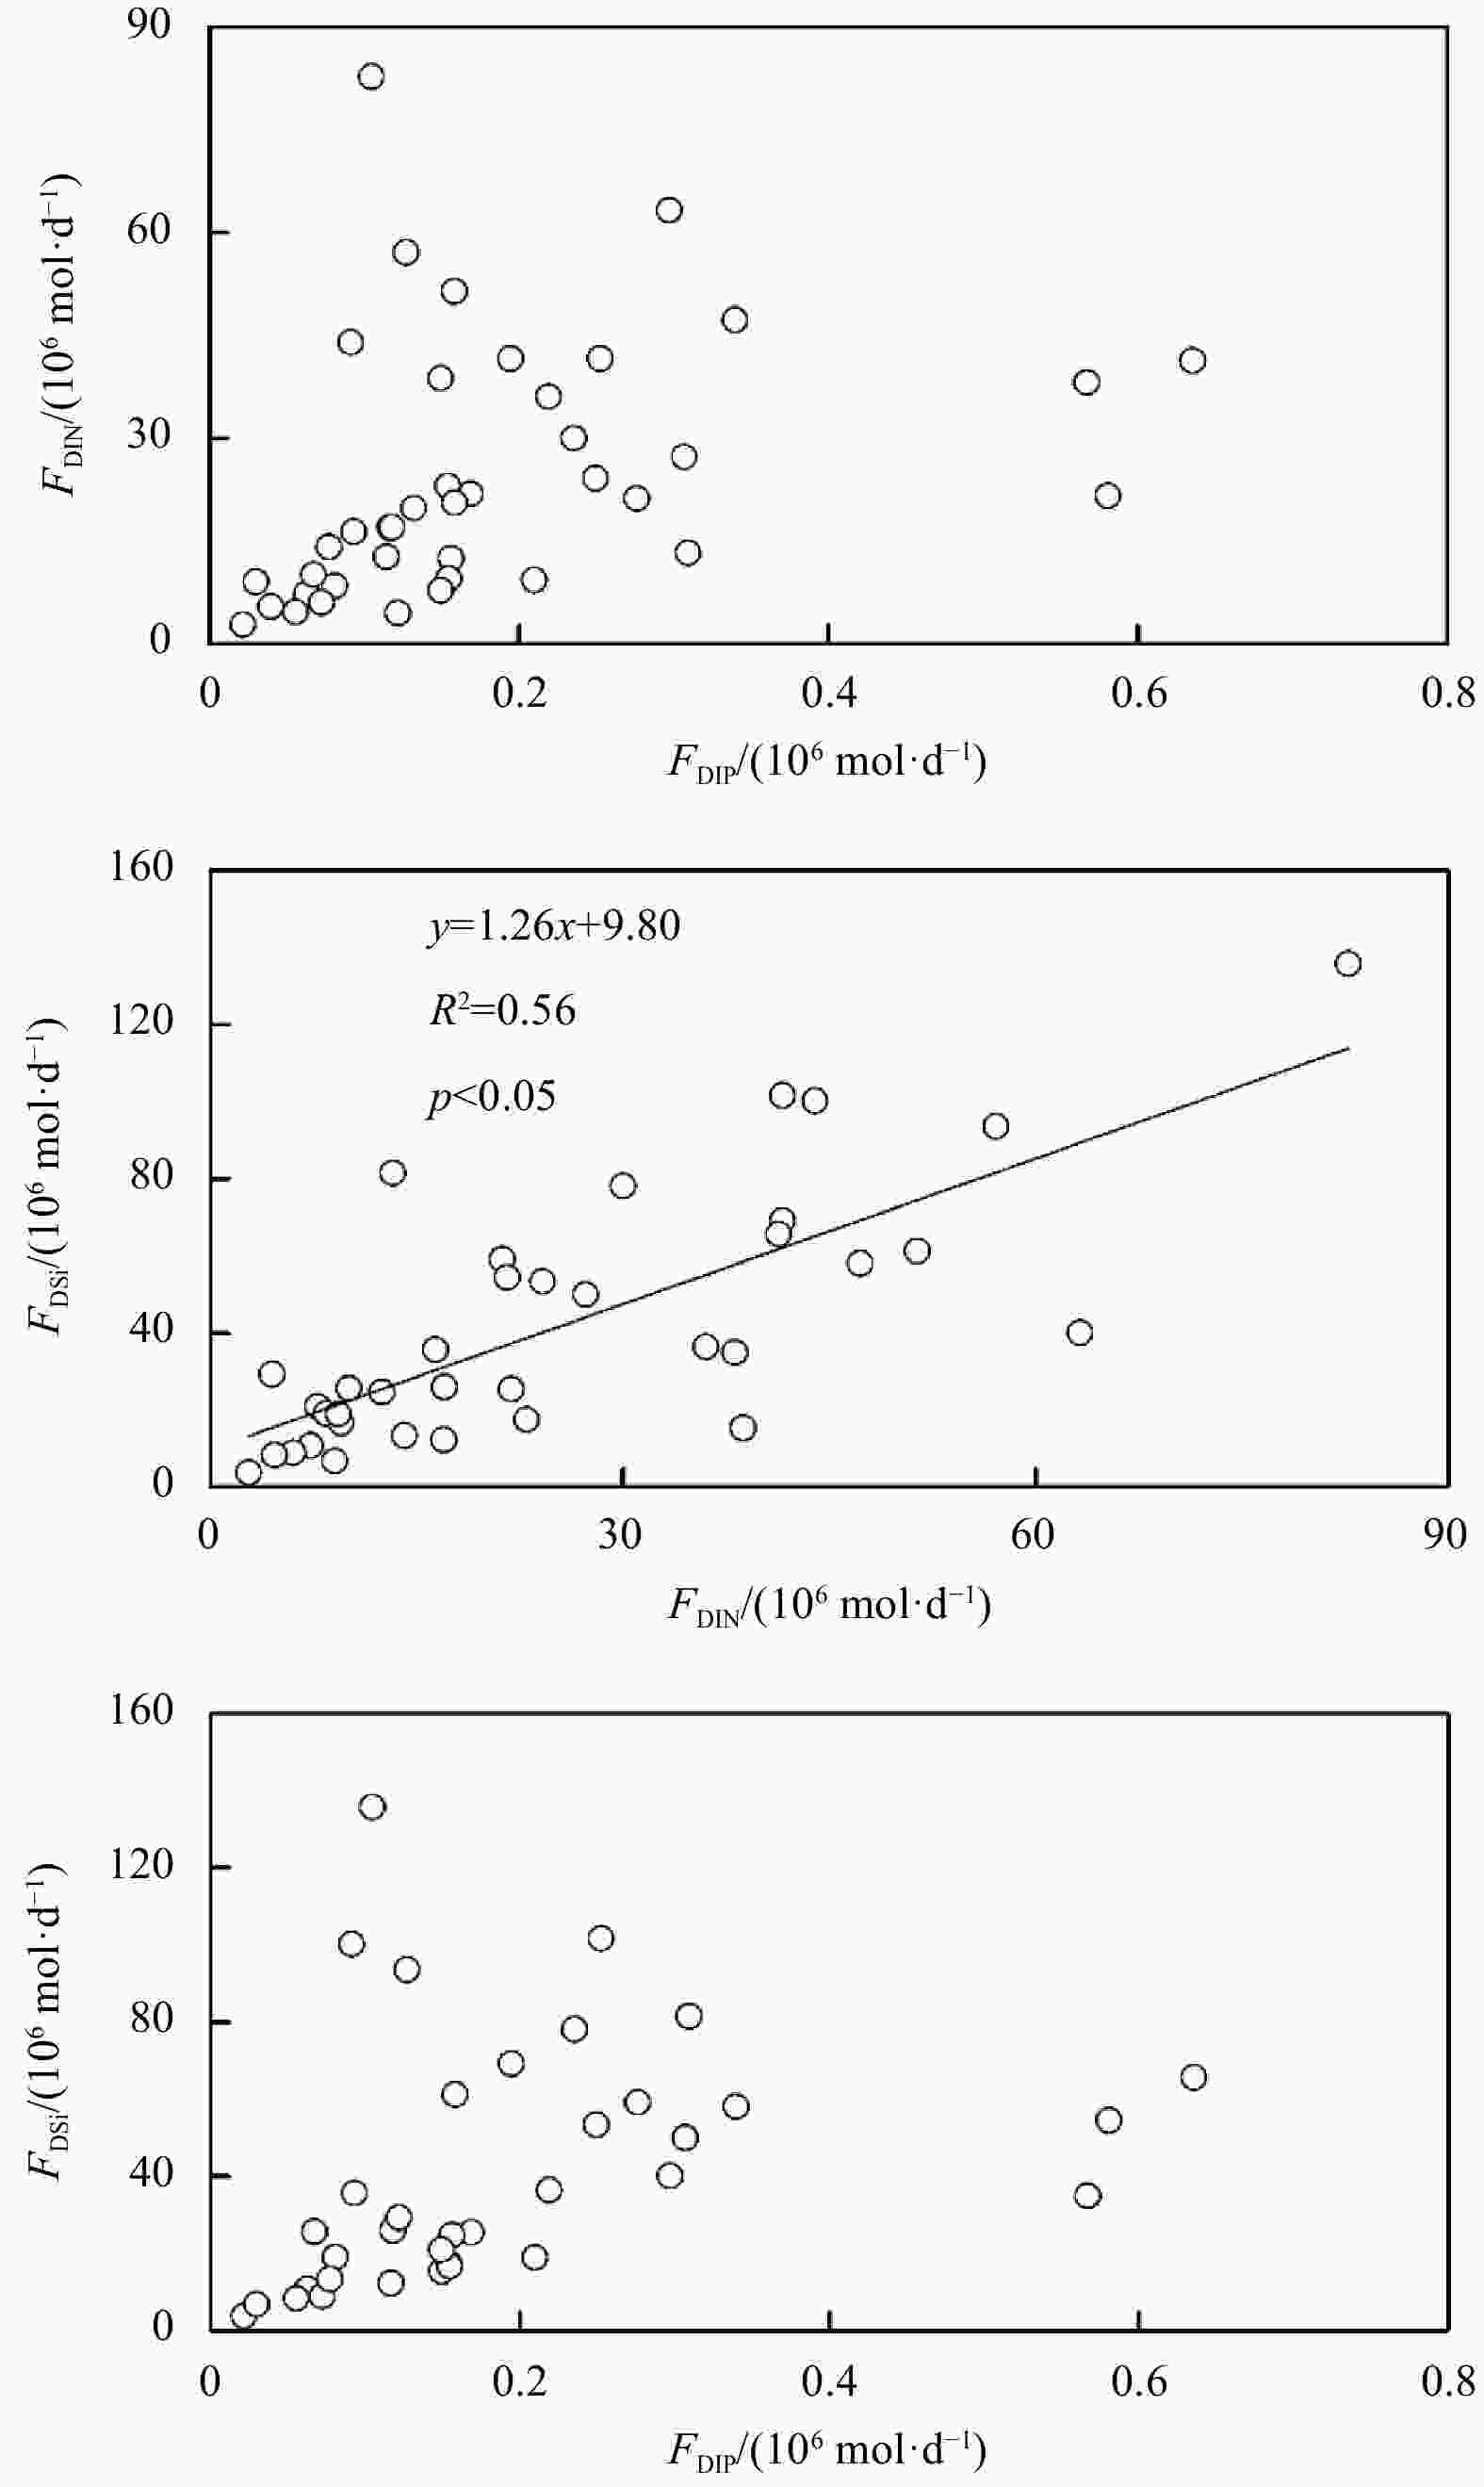
Figure 9. The relationship of riverine nutrient fluxes at the sea surface at Stations 1–20 during March 2015–October 2017.

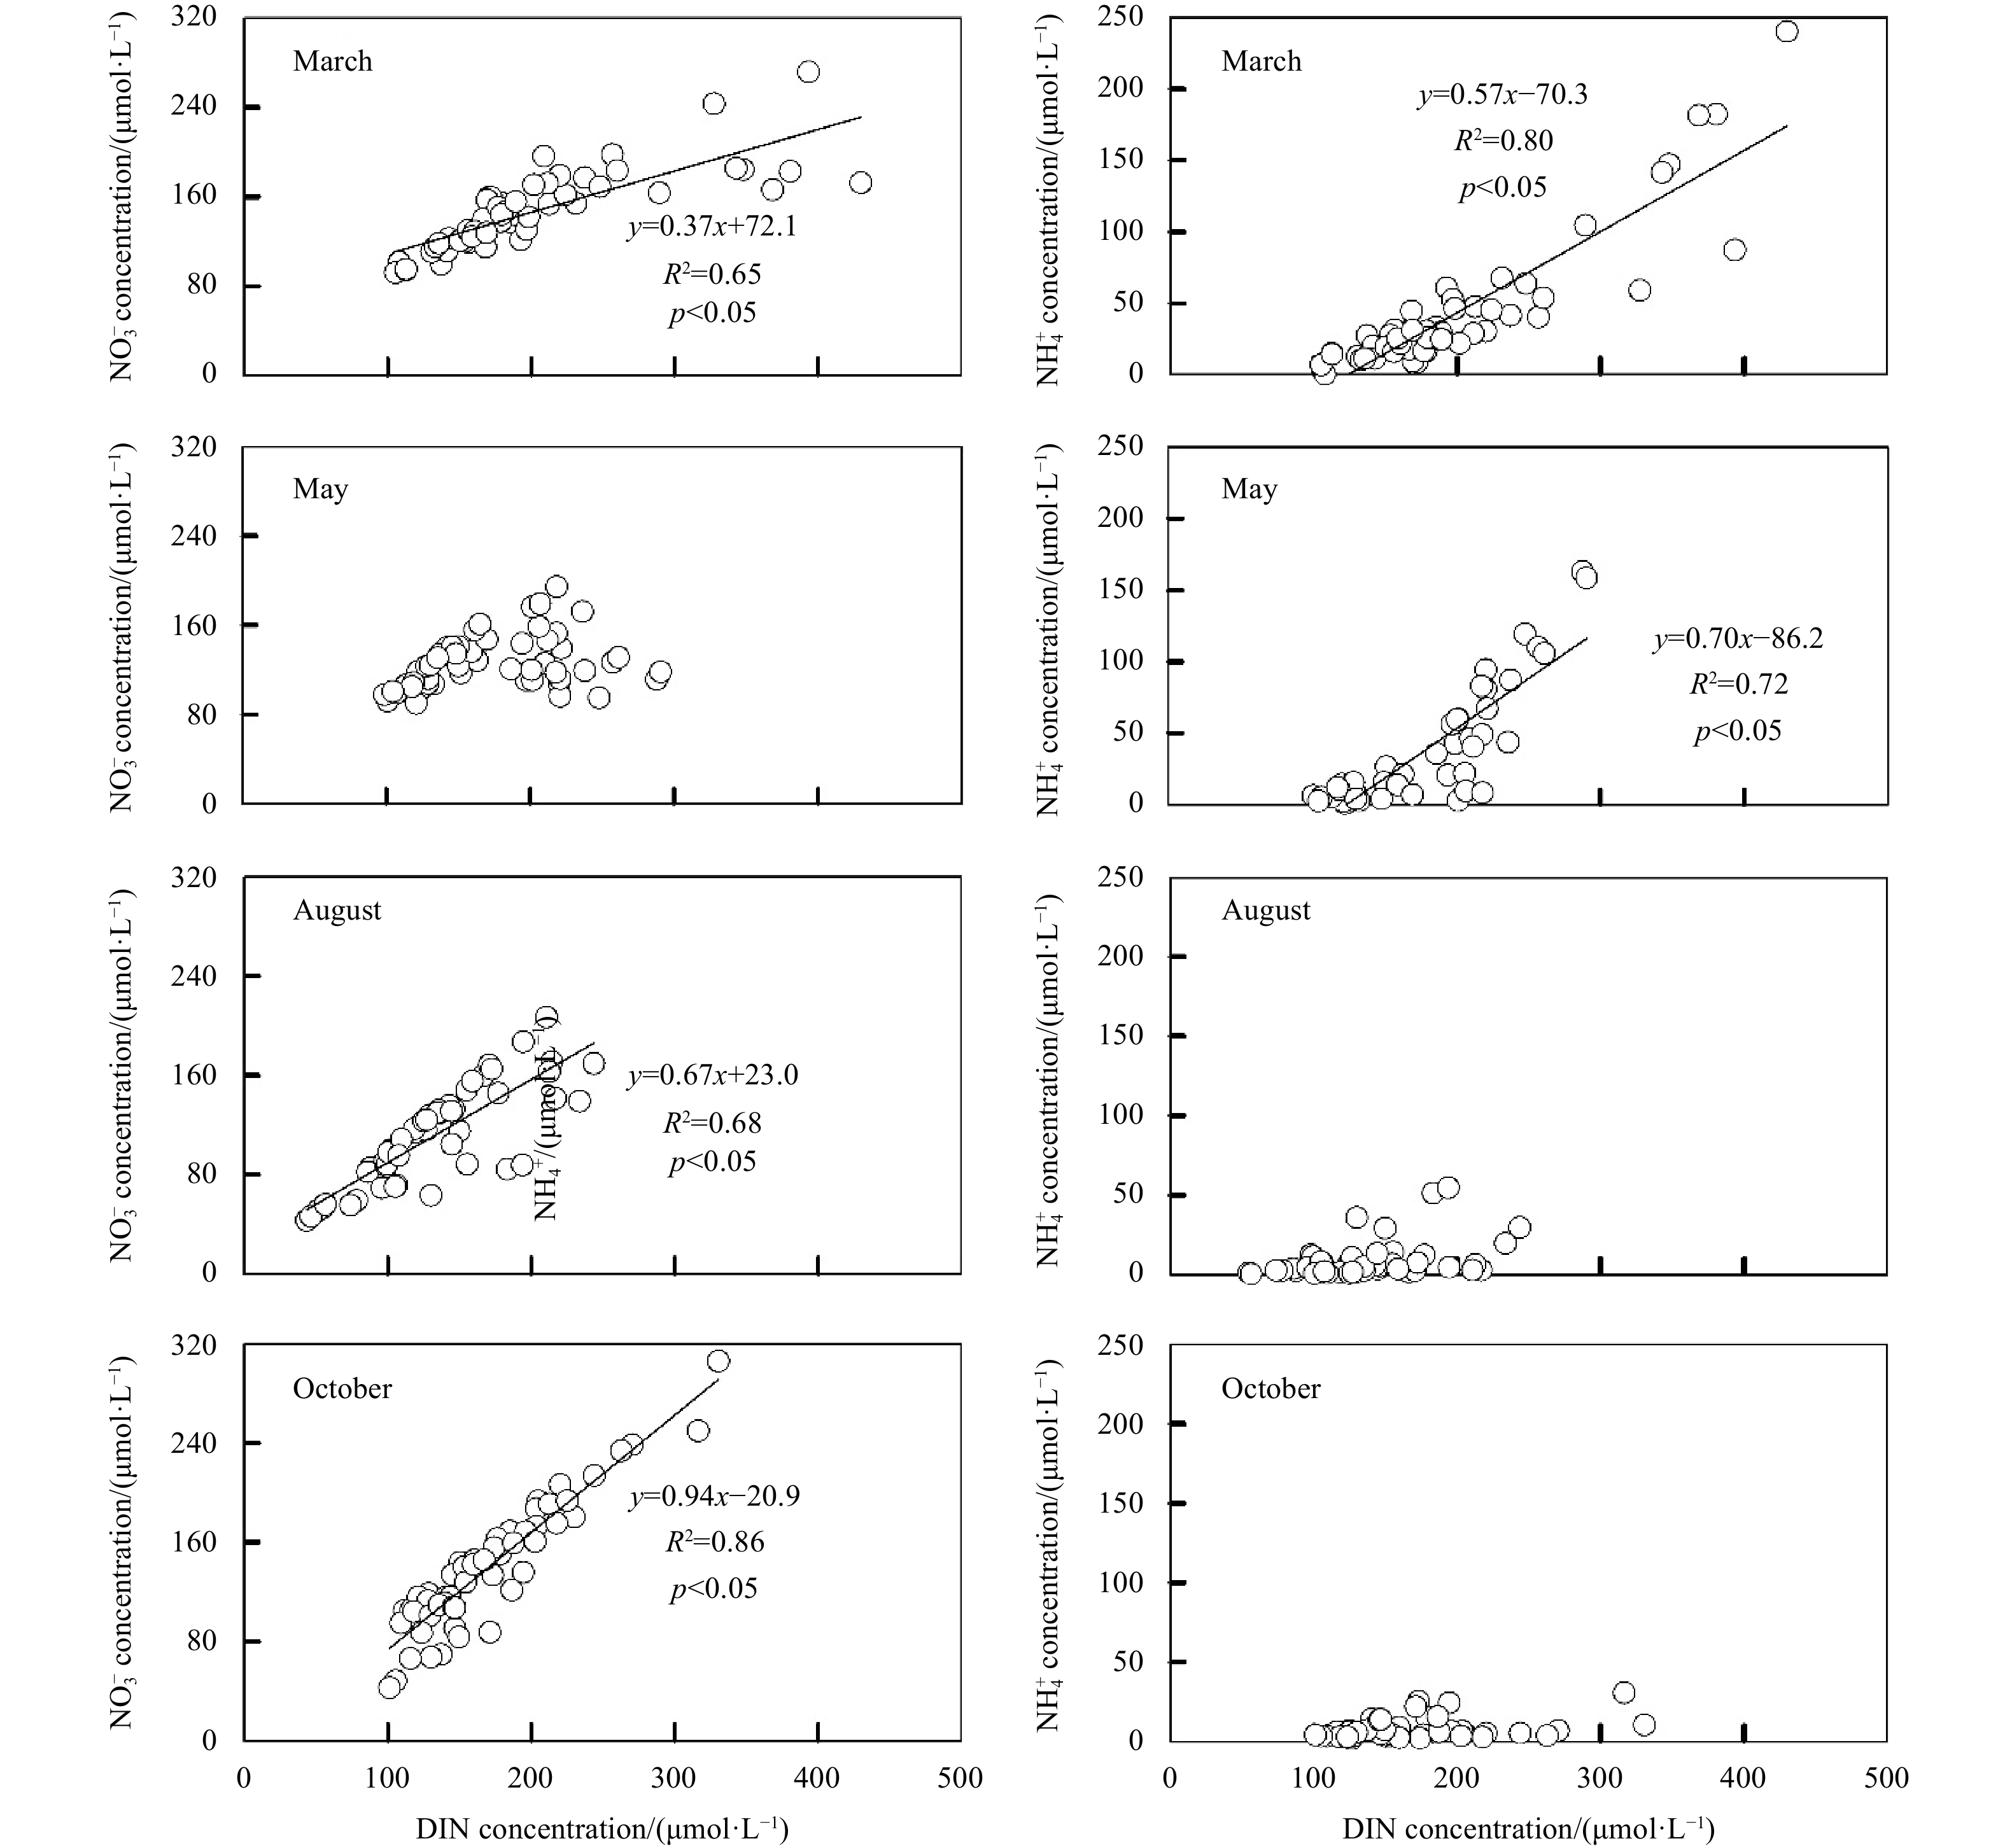
Figure 10. Relationship between
${\rm{NO}}_3^- $ and DIN and relationship between${\rm{NH}}_4^+ $ and DIN at the sea surface at Stations 1–20 from March 2015 to October 2017. The graphs with lines indicated significant correlation between the two variables, and the correlation coefficients were given in the graphs.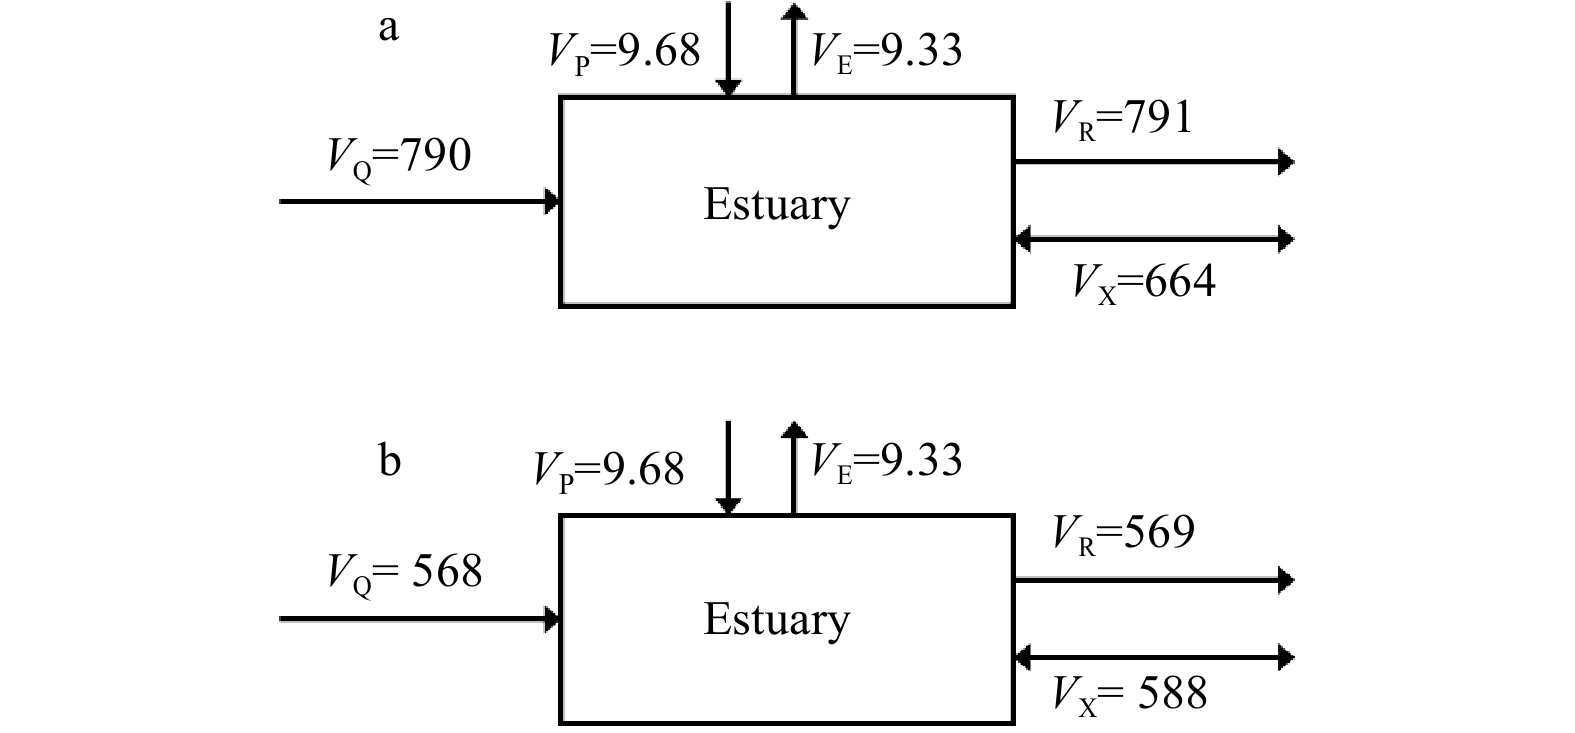
Figure 11. Water budgets for the Zhujiang River Estuary. The water flux is in 106 m3/d. VQ, VP, VE, VR and VX are the river discharge, precipitation, evaporation, the residual flow and the mixing flow between the system of interest and the adjacent system, respectively. The words a and b refer to May and August 2015 cruises, respectively.
Table 1. Discharge, temperature and salinity at Stations 1−20 during March 2015−October 2017. The average values were shown in parentheses
Month Discharge/(m3·s−1) Temperature/°C Salinity March 3669–9904 (7296) 18.7–21.6 (20.4) 0.13–16.7 (5.66) May 10383–19700 (15480) 23.6–27.9 (26.2) 0.08–1.99 (0.30) August 12866–16938 (14968) 28.6–32.1 (30.6) 0.08–7.41 (0.79) October 11855–15034 (13367) 25.8–28.6 (26.8) 0.11–21.4 (5.90)  下载: 导出CSV
Table 2. Estimation of nutrient fluxes (Mean±SD) via four outlets in four seasons
Discharge/(m3·s−1) $F_{{\rm{NO}}_3^- } $/(106 mol·d−1) FDIN/(106 mol·d−1) FDIP/(106 mol·d−1) FDSi/(106 mol·d−1) FDIN:FDIP FDSi:FDIN FDSi:FDIP Humen March 947 15.0 ± 3.01 25.0 ± 9.90 0.17 ± 0.05 24.7 ± 12.1 148 1.00 150 May 3 302 36.2 ± 15.8 63.7 ± 16.7 0.13 ± 0.03 96.8 ± 37.3 490 1.52 744 August 3 146 35.6 ± 12.5 49.6 ± 11.9 0.19 ± 0.10 69.7 ± 30.0 255 1.41 359 October 2 229 36.7 ± 5.72 42.4 ± 4.37 0.38 ± 0.24 46.3 ± 27.1 113 1.09 124 Jiaomen March 893 10.7 ± 4.54 12.3 ± 4.54 0.11 ± 0.05 20.5 ± 8.41 109 1.67 183 May 3 114 30.0 ± 8.47 33.0 ± 7.60 0.26 ± 0.04 76.5 ± 25.8 124 2.32 289 August 2 966 23.0 ± 12.4 24.2 ± 12.7 0.38 ± 0.16 58.5 ± 23.3 63.0 2.42 152 October 2 101 19.8 ± 2.10 22.9 ± 1.29 0.33 ± 0.22 41.8 ± 21.0 69.7 1.82 127 Hongqimen March 325 3.75 ± 1.65 4.51 ± 1.62 0.05 ± 0.03 7.05 ± 2.84 90.3 1.56 141 May 1 132 10.5 ± 4.02 11.0 ± 3.81 0.11 ± 0.04 26.0 ± 9.51 114 2.17 248 August 1 078 8.40 ± 4.80 8.80 ± 4.87 0.12 ± 0.04 21.2 ± 7.96 75.8 2.41 183 October 764 7.49 ± 0.70 8.93 ± 0.44 0.11 ± 0.09 14.9 ± 7.06 83.6 1.67 140 Hengmena March 541 3.80 5.48 0.04 N/A 138 N/A N/A May 1 887 16.3 19.8 0.13 N/A 150 N/A N/A August 1 797 16.6 20.5 0.16 N/A 130 N/A N/A October 1 274 10.9 12.7 0.11 N/A 111 N/A N/A Note: N/A means no data; a, data from Liu (2006).
下载: 导出CSV
Table 3. Summary of the yearly average nutrient flux (103 t/a)
$F_{{\rm{NO}}_3^-} $ FDIN FDIP FDSi Humen 157 230 1.11 303 Jiaomen 106 118 1.39 251 Hongqimen 38.4 43.6 0.48 88.2 Hengmen 60.7 74.6 0.57 N/A Riverine flux 362 466 3.55 N/A Export flux 491 585 10.8 609 Note: N/A means no data.
下载: 导出CSV
Table 4. Estimation of riverine fluxes to Zhujiang River Estuary and export nutrient fluxes (106 mol/d) of the Zhujiang River Estuary during May and August, 2015
May 2015 August 2015 $F_{{\rm{NO}}^-_3}$ FDIN FDIP FDSi $F_{{\rm{NO}}^-_3}$ FDIN FDIP FDSi Riverine flux (VC) 71.5 108 0.75 145 75.4 91.1 0.78 170 Residual flow (VRCR) –63.3 –77.6 –0.50 –31.1 –44.5 –51.1 –0.49 –47.7 Mixing exchange (VXCX) –57.5 –71.7 –0.55 –28.6 –27.3 –29.3 –0.37 –12.3 Export flux (VRCR + VXCX) 121 149 1.05 59.7 71.8 80.4 0.86 60.0 Δ = (export flux – riverine flux) –49.3 –46.7 –0.30 85.3 3.60 10.7 –0.08 110 Note: VRCR denoted residual nutrient transport out of the Zhujiang River Estuary; VXCX: mixing exchange flux of nutrients. Nutrient fluxes from the Zhujiang River Estuary to the South China Sea (seaward export flux) were estimated as the sum of the VRCR and VXCX. Positive and negative values of ∆ indicate that other processes may magnify or reduce the riverine fluxes.
下载: 导出CSV
-
[1] Beck A J, Rapaglia J P, Cochran J K, et al. 2008. Submarine groundwater discharge to Great South Bay, NY, estimated using Ra isotopes. Marine Chemistry, 109(3–4): 279–291. doi: 10.1016/j.marchem.2007.07.011 [2] Billen G, Garnier J. 2007. River basin nutrient delivery to the coastal sea: assessing its potential to sustain new production of non-siliceous algae. Marine Chemistry, 106(1–2): 148–160. doi: 10.1016/j.marchem.2006.12.017 [3] Cai Weijun, Dai Minhan, Wang Yongchen, et al. 2004. The biogeochemistry of inorganic carbon and nutrients in the Pearl River Estuary and the adjacent northern South China Sea. Continental Shelf Research, 24(12): 1301–1319. doi: 10.1016/j.csr.2004.04.005 [4] Cai Huayang, Huang Jingzheng, Niu Lixia, et al. 2018. Decadal variability of tidal dynamics in the Pearl River Delta: spatial patterns, causes, and implications for estuarine water management. Hydrological Process, 32(25): 3805–3819. doi: 10.1002/hyp.13291 [5] Cloern J E. 1987. Turbidity as a control on phytoplankton biomass and productivity in estuaries. Continental Shelf Research, 7(11–12): 1367–1381. doi: 10.1016/0278-4343(87)90042-2 [6] Cloern J E. 2001. Our evolving conceptual model of the coastal eutrophication problem. Marine Ecology Progress Series, 210: 223–253. doi: 10.3354/meps210223 [7] Dai Minhan, Gan Jianping, Han Aiqin, et al. 2014. Physical dynamics and biogeochemistry of the Pearl River plume. In: Bianchi T, Allison M, Cai Weijun, eds. Biogeochemical Dynamics at Major River-Coastal Interfaces: Linkages with Global Change. New York: Cambridge University Press, 321–352 [8] Dai Minhan, Guo Xianghui, Zhai Weidong, et al. 2006. Oxygen depletion in the upper reach of the Pearl River Estuary during a winter drought. Marine Chemistry, 102(1–2): 159–169. doi: 10.1016/j.marchem.2005.09.020 [9] David V, Sautour B, Chardy P, et al. 2005. Long-term changes of the zooplankton variability in a turbid environment: the Gironde estuary (France). Estuarine, Coastal and Shelf Science, 64(2–3): 171–184, [10] Fisher T R, Harding Jr L W, Stanley D W, et al. 1988. Phytoplankton, nutrients, and turbidity in the Chesapeake, Delaware, and Hudson estuaries. Estuarine, Coastal and Shelf Science, 27(1): 61–93 [11] Gan Jianping, Lu Zhongming, Cheung Anson, et al. 2014. Assessing ecosystem response to phosphorus and nitrogen limitation in the Pearl River plume using the Regional Ocean Modeling System (ROMS). Journal of Geophysical Research: Oceans, 119(12): 8858–8877. doi: 10.1002/2014JC009951 [12] Glibert P M, Wilkerson F P, Dugdale R C, et al. 2016. Pluses and minuses of ammonium and nitrate uptake and assimilation by phytoplankton and implications for productivity and community composition, with emphasis on nitrogen-enriched conditions. Limnology and Oceanography, 61(1): 165–197. doi: 10.1002/lno.10203 [13] Gong Wenping, Lin Zhongyuan, Chen Yunzhen, et al. 2018. Effect of winds and waves on salt intrusion in the Pearl River Estuary. Ocean Science, 14(1): 139–159. doi: 10.5194/os-14-139-2018 [14] Gordon Jr D C, Boudreau P R, Mann K H, et al. 1996. LOICZ biogeochemical modelling guidelines. LOICZ/R&S/95-5. Texel, Netherlands: LOICZ-IGBP [15] Guo Xianghui, Dai Minhan, Zhai Weidong, et al. 2009. CO2 flux and seasonal variability in a large subtropical estuarine system, the Pearl River Estuary, China. Journal of Geophysical Research: Biogeosciences, 114(G3): G03013. doi: 10.1029/2008JG000905 [16] Guo Zhanrong, Huang Lei, Liu Huatai, et al. 2008. The estimation of submarine inputs of groundwater to a coastal bay using Radium isotopes (in Chinese with English abstract). Acta Geoscientica Sinica, 29(5): 647–652 [17] Hansen H P, Koroleff F. 1999. Determination of nutrients. In: Grasshoff K, Kremling K, Ehrhardt M, eds. Methods of Seawater Analysis. Weinheim, Germany: Wiley-VCH, 159–228 [18] Harrison P J, Yin Kedong, Lee J H W, et al. 2008. Physical-biological coupling in the Pearl River Estuary. Continental Shelf Research, 28(12): 1405–1415. doi: 10.1016/j.csr.2007.02.011 [19] He Biyan, Dai Minhan, Zhai Weidong, et al. 2014. Hypoxia in the upper reaches of the Pearl River Estuary and its maintenance mechanisms: a synthesis based on multiple year observations during 2000–2008. Marine Chemistry, 167: 13–24. doi: 10.1016/j.marchem.2014.07.003 [20] Hu Jiatang, Li Shiyu. 2009. Modeling the mass fluxes and transformations of nutrients in the Pearl River Delta, China. Journal of Marine Systems, 78(1): 146–167. doi: 10.1016/j.jmarsys.2009.05.001 [21] Hu Jiatang, Li Shiyu, Geng Bingxu, et al. 2012. Modeling of CBOD, TN and TP fluxes in the river network and estuary of Pearl River Delta. Journal of Hydraulic Engineering, 43(1): 51–59 [22] Huang Xiaoping, Huang Liangmin, Yue Weizhong. 2003. The characteristics of nutrients and eutrophication in the Pearl River Estuary, South China. Marine Pollution Bulletin, 47(1–6): 30–36. doi: 10.1016/S0025-326X(02)00474-5 [23] Jickells T D. 1998. Nutrient biogeochemistry of the coastal zone. Science, 281(5374): 217–222. doi: 10.1126/science.281.5374.217 [24] Kot S C, Hu S L. 1995. Water flows and sediment transport in the Pearl River Estuary and wave in South China Sea near Hong Kong. In: Coastal Infrastructure Development in Hong Kong—A Review. Hong Kong, China: Hong Kong Government [25] Li Dou, Gan Jianping, Hui Rex, et al. 2020. Vortex and biogeochemical dynamics for the hypoxia formation within the coastal transition zone off the Pearl River Estuary. Journal of Geophysical Research: Oceans, 125(8): e2020JC016178. doi: 10.1029/2020JC016178 [26] Li Ruihuan, Xu Jie, Li Xiangfu, et al. 2017. Spatiotemporal variability in phosphorus species in the Pearl River Estuary: influence of the river discharge. Scientific Reports, 7: 13649. doi: 10.1038/s41598-017-13924-w [27] Liang Cui, Xian Weiwei. 2018. Changjiang nutrient distribution and transportation and their impacts on the estuary. Continental Shelf Research, 165: 127–145. doi: 10.1016/j.csr.2018.05.001 [28] Liu Jingqin. 2006. Investigation of distribution and influx calculation of nutrients in the Eight Pearl River Openings (in Chinese)[dissertation]. Qingdao: Ocean University of China [29] Liu Bo, de Swart H E, de Jonge V N. 2018. Phytoplankton bloom dynamics in turbid, well-mixed estuaries: a model study. Estuarine, Coastal and Shelf Science, 211: 137–151, [30] Liu Sumei, Hong G H, Zhang Jing, et al. 2009. Nutrient budgets for large Chinese estuaries. Biogeosciences, 6(10): 2245–2263. doi: 10.5194/bg-6-2245-2009 [31] Lu Zhongming, Gan Jianping. 2015. Controls of seasonal variability of phytoplankton blooms in the Pearl River Estuary. Deep-Sea Research Part II: Topical Studies in Oceanography, 117: 86–96. doi: 10.1016/j.dsr2.2013.12.011 [32] Lu Zhongming, Gan Jianping, Dai Minhan, et al. 2018. Joint effects of extrinsic biophysical fluxes and intrinsic hydrodynamics on the formation of hypoxia west off the Pearl River Estuary. Journal of Geophysical Research: Oceans, 123(9): 6241–6259. doi: 10.1029/2018JC014199 [33] Lu Fenghui, Ni Honggang, Liu Feng, et al. 2009. Occurrence of nutrients in riverine runoff of the Pearl River Delta, South China. Journal of Hydrology, 376(1–2): 107–115. doi: 10.1016/j.jhydrol.2009.07.018 [34] Malakoff D. 1998. Death by suffocation in the Gulf of Mexico. Science, 281(5374): 190–192. doi: 10.1126/science.281.5374.190 [35] McCarthy J J. 1981. The kinetics of nutrient utilization. In: Platt T, ed. Physiological Bases of Phytoplankton Ecology. Canadian Bulletin of Fisheries and Aquatic Sciences, 210: 211–233 [36] Moore W S. 1996. Large groundwater inputs to coastal waters revealed by 226Ra enrichments. Nature, 380(6575): 612–614. doi: 10.1038/380612a0 [37] Nixon S W. 1995. Coastal marine eutrophication: a definition, social causes, and future concerns. Ophelia, 41(1): 199–219. doi: 10.1080/00785236.1995.10422044 [38] Oudot C, Gerard R, Morin P, et al. 1988. Precise shipboard determination of dissolved oxygen (Winkler procedure) for productivity studies with a commercial system. Limnology and Oceanography, 33(1): 146–150. doi: 10.4319/lo.1988.33.1.0146 [39] Parsons T R, Maita Y, Lalli C M. 1984. A Manual of Chemical and Biological Methods for Seawater Analysis. Oxford: Pergamon Press, 173 [40] Qian Wei, Gan Jianping, Liu Jinwen, et al. 2018. Current status of emerging hypoxia in a eutrophic estuary: the lower reach of the Pearl River Estuary, China. Estuarine, Coastal and Shelf Science, 205: 58–67, [41] Qu Hongjuan, Kroeze C. 2010. Past and future trends in nutrients export by rivers to the coastal waters of China. Science of the Total Environment, 408(9): 2075–2086, [42] Rabalais N N, Turner R E, Sen Gupta B K, et al. 2007. Hypoxia in the northern Gulf of Mexico: does the science support the plan to reduce, mitigate, and control hypoxia?. Estuaries and Coasts, 30(5): 753–772, [43] Savchuk O P. 2005. Resolving the Baltic Sea into seven subbasins: N and P budgets for 1991–1999. Journal of Marine Systems, 56(1–2): 1–15. doi: 10.1016/j.jmarsys.2004.08.005 [44] Shen Pingping, Li Gang, Huang Liangmin, et al. 2011. Spatio-temporal variability of phytoplankton assemblages in the Pearl River Estuary, with special reference to the influence of turbidity and temperature. Continental Shelf Research, 31(16): 1672–1681. doi: 10.1016/j.csr.2011.07.002 [45] Strokal M, Kroeze C, Li Lili, et al. 2015. Increasing dissolved nitrogen and phosphorus export by the Pearl River (Zhujiang): a modeling approach at the sub-basin scale to assess effective nutrient management. Biogeochemistry, 125(2): 221–242. doi: 10.1007/s10533-015-0124-1 [46] Tang Danling, Kester D R, Ni I H, et al. 2003. In situ and satellite observations of a harmful algal bloom and water condition at the Pearl River Estuary in late autumn 1998. Harmful Algae, 2(2): 89–99. doi: 10.1016/S1568-9883(03)00021-0 [47] Turner R E, Rabalais N N. 1991. Changes in Mississippi River water quality this century: implications for coastal food webs. BioScience, 41(3): 140–147. doi: 10.2307/1311453 [48] Turner R E, Rabalais N N. 1994. Coastal eutrophication near the Mississippi River Delta. Nature, 368(6472): 619–621. doi: 10.1038/368619a0 [49] Wai O W H, Wang C H, Li Y S, et al. 2004. The formation mechanisms of turbidity maximum in the Pearl River Estuary, China. Marine Pollution Bulletin, 48(5–6): 441–448. doi: 10.1016/j.marpolbul.2003.08.019 [50] Wang Jianing, Yan Weijin, Jia Xiaodong. 2006. Modeling the export of point sources of nutrients from the Yangtze River basin and discussing countermeasures. Acta Scientiae Circumstantiae, 26(4): 658–666 [51] Wei Xing, Wu Chaoyu. 2014. Long-term process-based morphodynamic modeling of the Pearl River Delta. Ocean Dynamics, 64(12): 1753–1765. doi: 10.1007/s10236-014-0785-7 [52] Xu Jie, Ho A Y T, He Lei, et al. 2012. Effects of inorganic and organic nitrogen and phosphorus on the growth and toxicity of two Alexandrium species from Hong Kong. Harmful Algae, 16: 89–97. doi: 10.1016/j.hal.2012.02.006 [53] Xu Jie, Ho A Y T, Yin Kedong, et al. 2008a. Temporal and spatial variations in nutrient stoichiometry and regulation of phytoplankton biomass in Hong Kong waters: influence of the Pearl River outflow and sewage inputs. Marine Pollution Bulletin, 57(6–12): 335–348. doi: 10.1016/j.marpolbul.2008.01.020 [54] Xu Jie, Yin Kedong, He Lei, et al. 2008b. Phosphorus limitation in the northern South China Sea during late summer: influence of the Pearl River. Deep-Sea Research Part I: Oceanographic Research Papers, 55(10): 1330–1342. doi: 10.1016/j.dsr.2008.05.007 [55] Yin Kedong, Harrison P J. 2008. Nitrogen over enrichment in subtropical Pearl River estuarine coastal waters: possible causes and consequences. Continental Shelf Research, 28(12): 1435–1442. doi: 10.1016/j.csr.2007.07.010 [56] Yin Kedong, Harrison P J, Goldblatt R H, et al. 1996. Spring bloom in the central Strait of Georgia: interactions of river discharge, winds and grazing. Marine Ecology Progress Series, 138: 255–263. doi: 10.3354/meps138255 [57] Yin Kedong, Qian Peiyuan, Chen Jay C, et al. 2000. Dynamics of nutrients and phytoplankton biomass in the Pearl River Estuary and adjacent waters of Hong Kong during summer: preliminary evidence for phosphorus and silicon limitation. Marine Ecology Progress Series, 194: 295–305. doi: 10.3354/meps194295 [58] Zhang Jing, Huang Weiwen, Létolle R, et al. 1995. Major element chemistry of the Huanghe (Yellow River), China-weathering processes and chemical fluxes. Journal of Hydrology, 168(1–4): 173–203. doi: 10.1016/0022-1694(94)02635-O [59] Zhang Ling, Wang Lu, Yin Kedong, et al. 2014. Spatial and seasonal variations of nutrients in sediment profiles and their sediment-water fluxes in the Pearl River Estuary, Southern China. Journal of Earth Science, 25(1): 197–206. doi: 10.1007/s12583-014-0413-y [60] Zhao Yangyang, Liu Jing, Uthaipan K, et al. 2020. Dynamics of inorganic carbon and pH in a large subtropical continental shelf system: interaction between eutrophication, hypoxia, and ocean acidification. Limnology and Oceanography, 65(6): 1359–1379. doi: 10.1002/lno.11393 -


 点击查看大图
计量
- 文章访问数: 319
- HTML全文浏览量: 113
- PDF下载量: 22
- 被引次数: 0

