Influence of the Atlantic Multidecadal Oscillation and Interdecadal Pacific Oscillation on Antarctic surface air temperature during 1900 to 2015
-
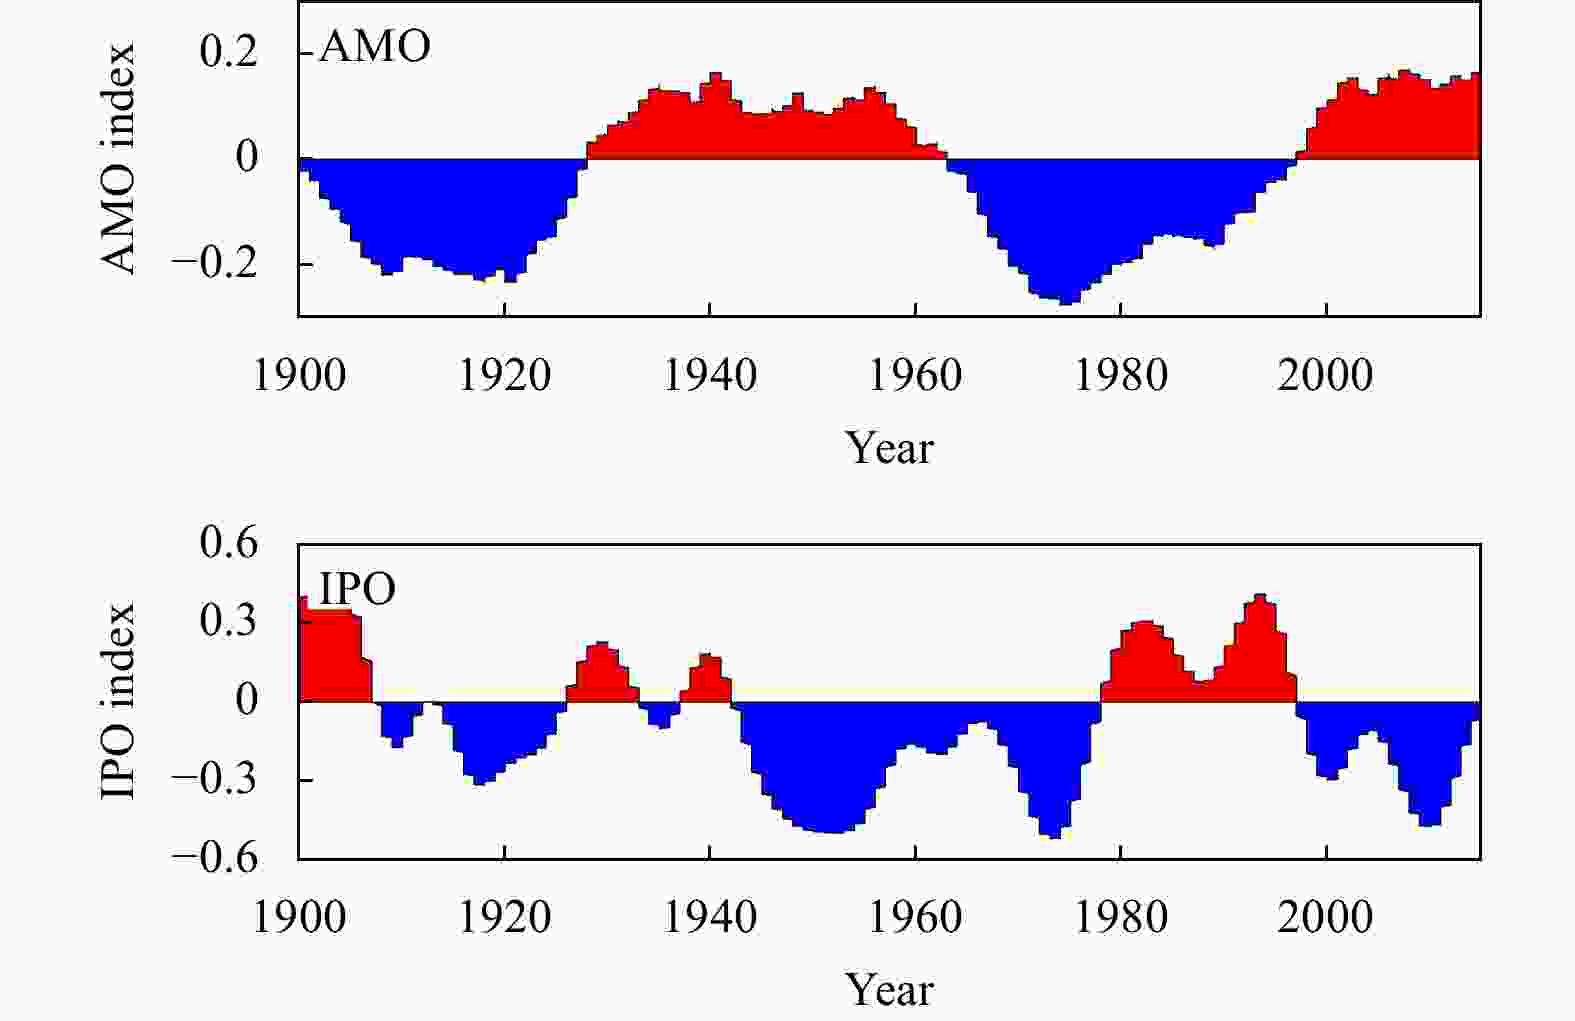
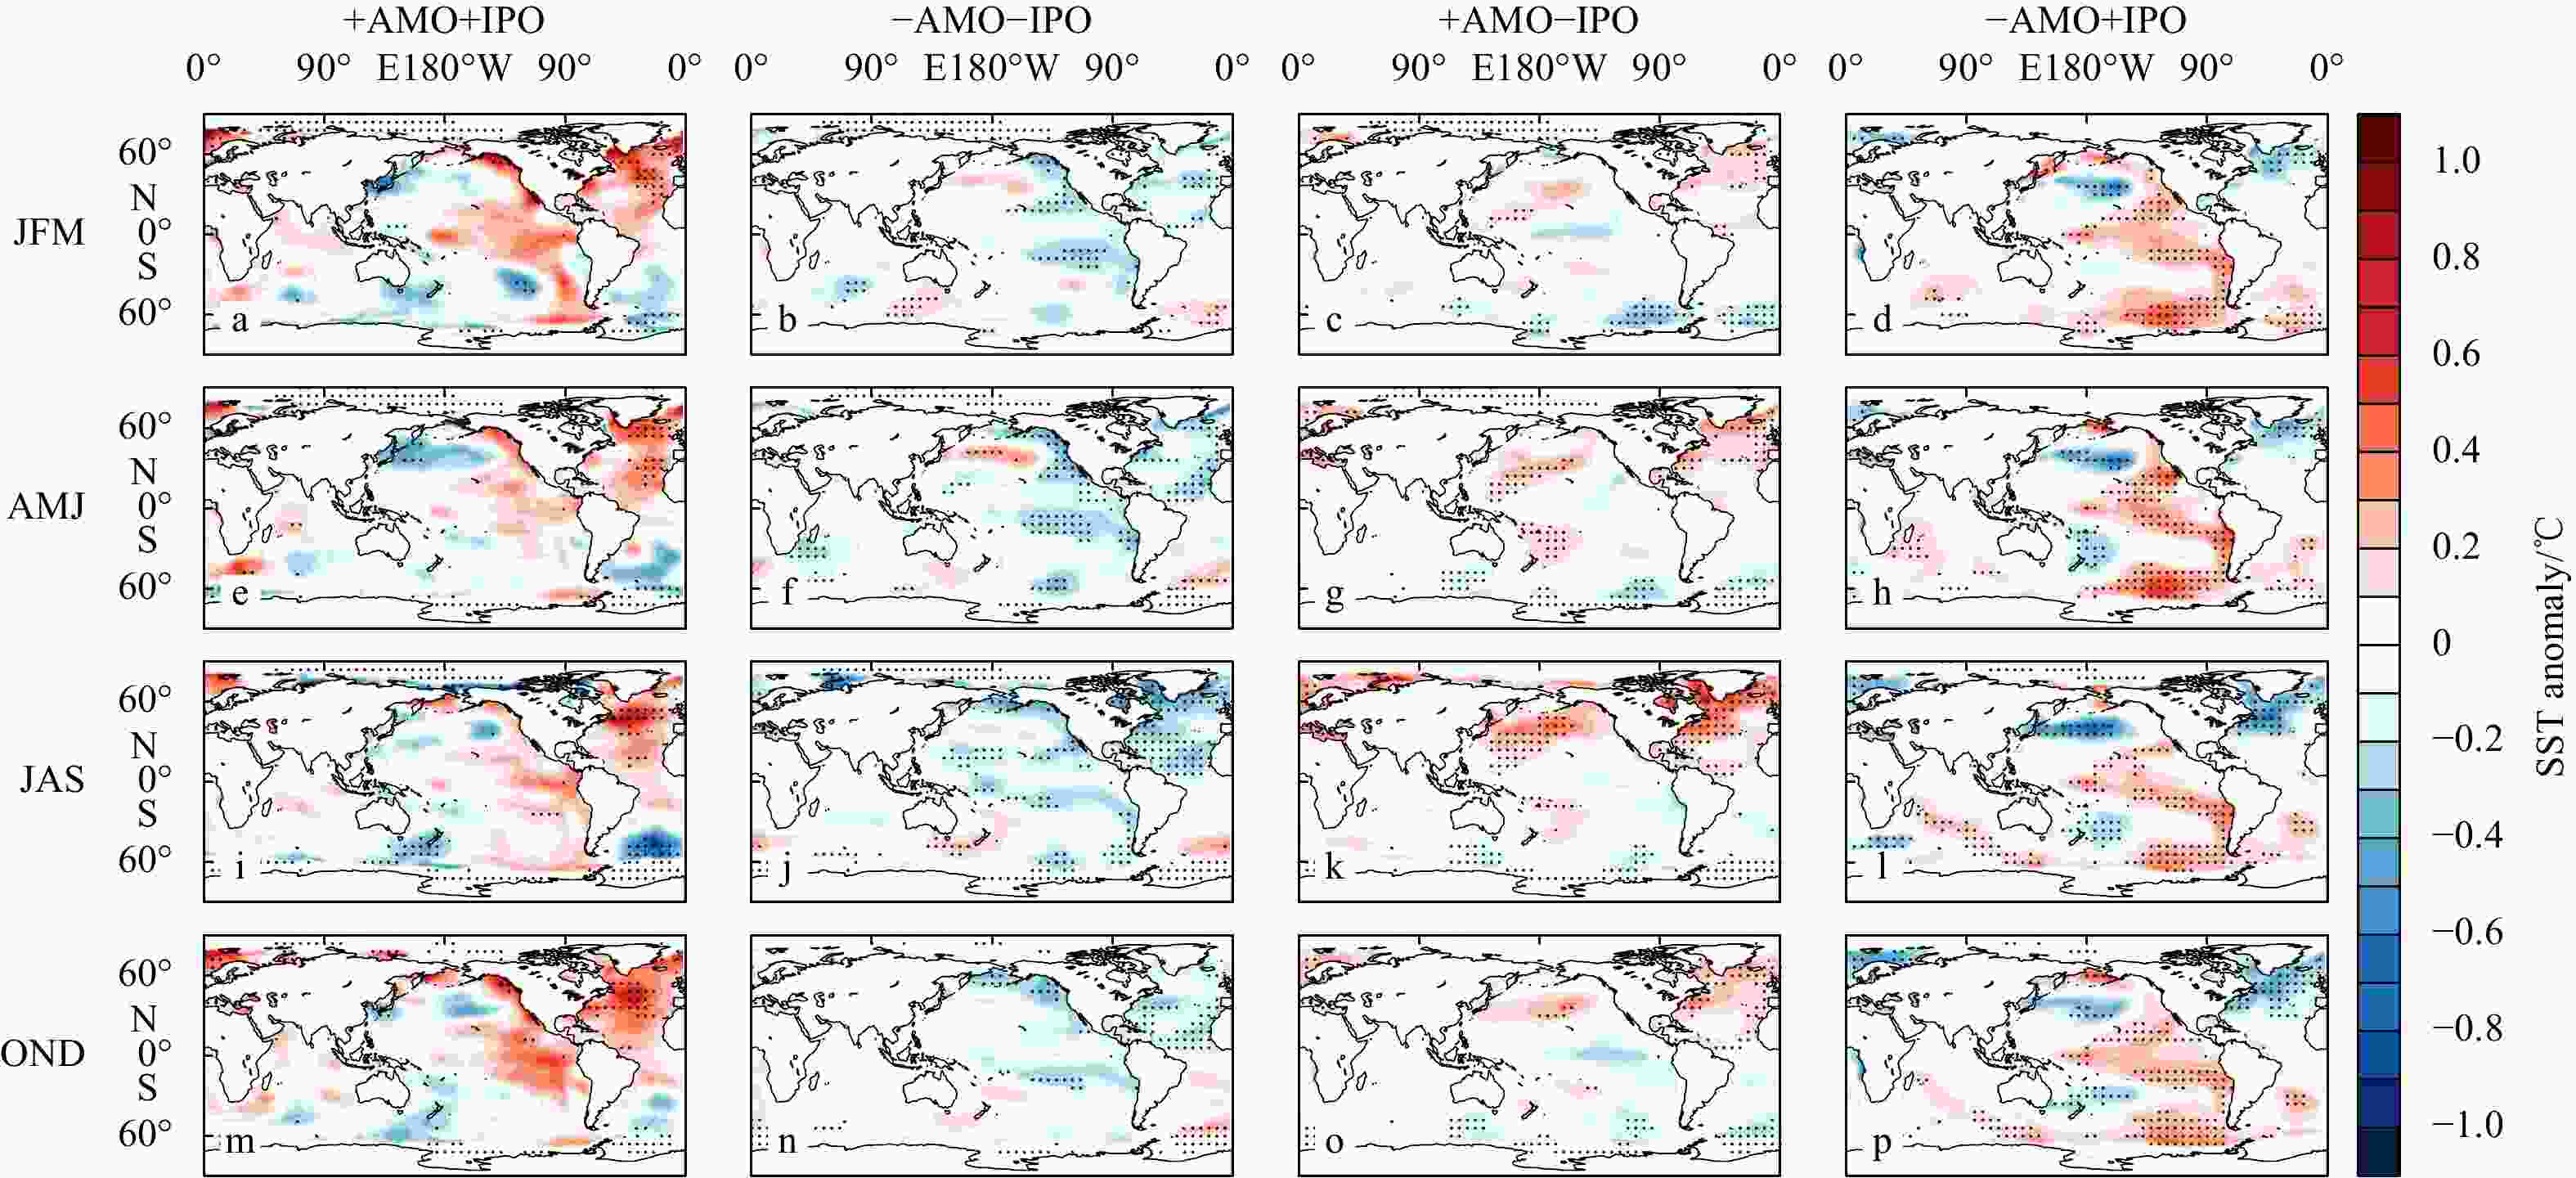
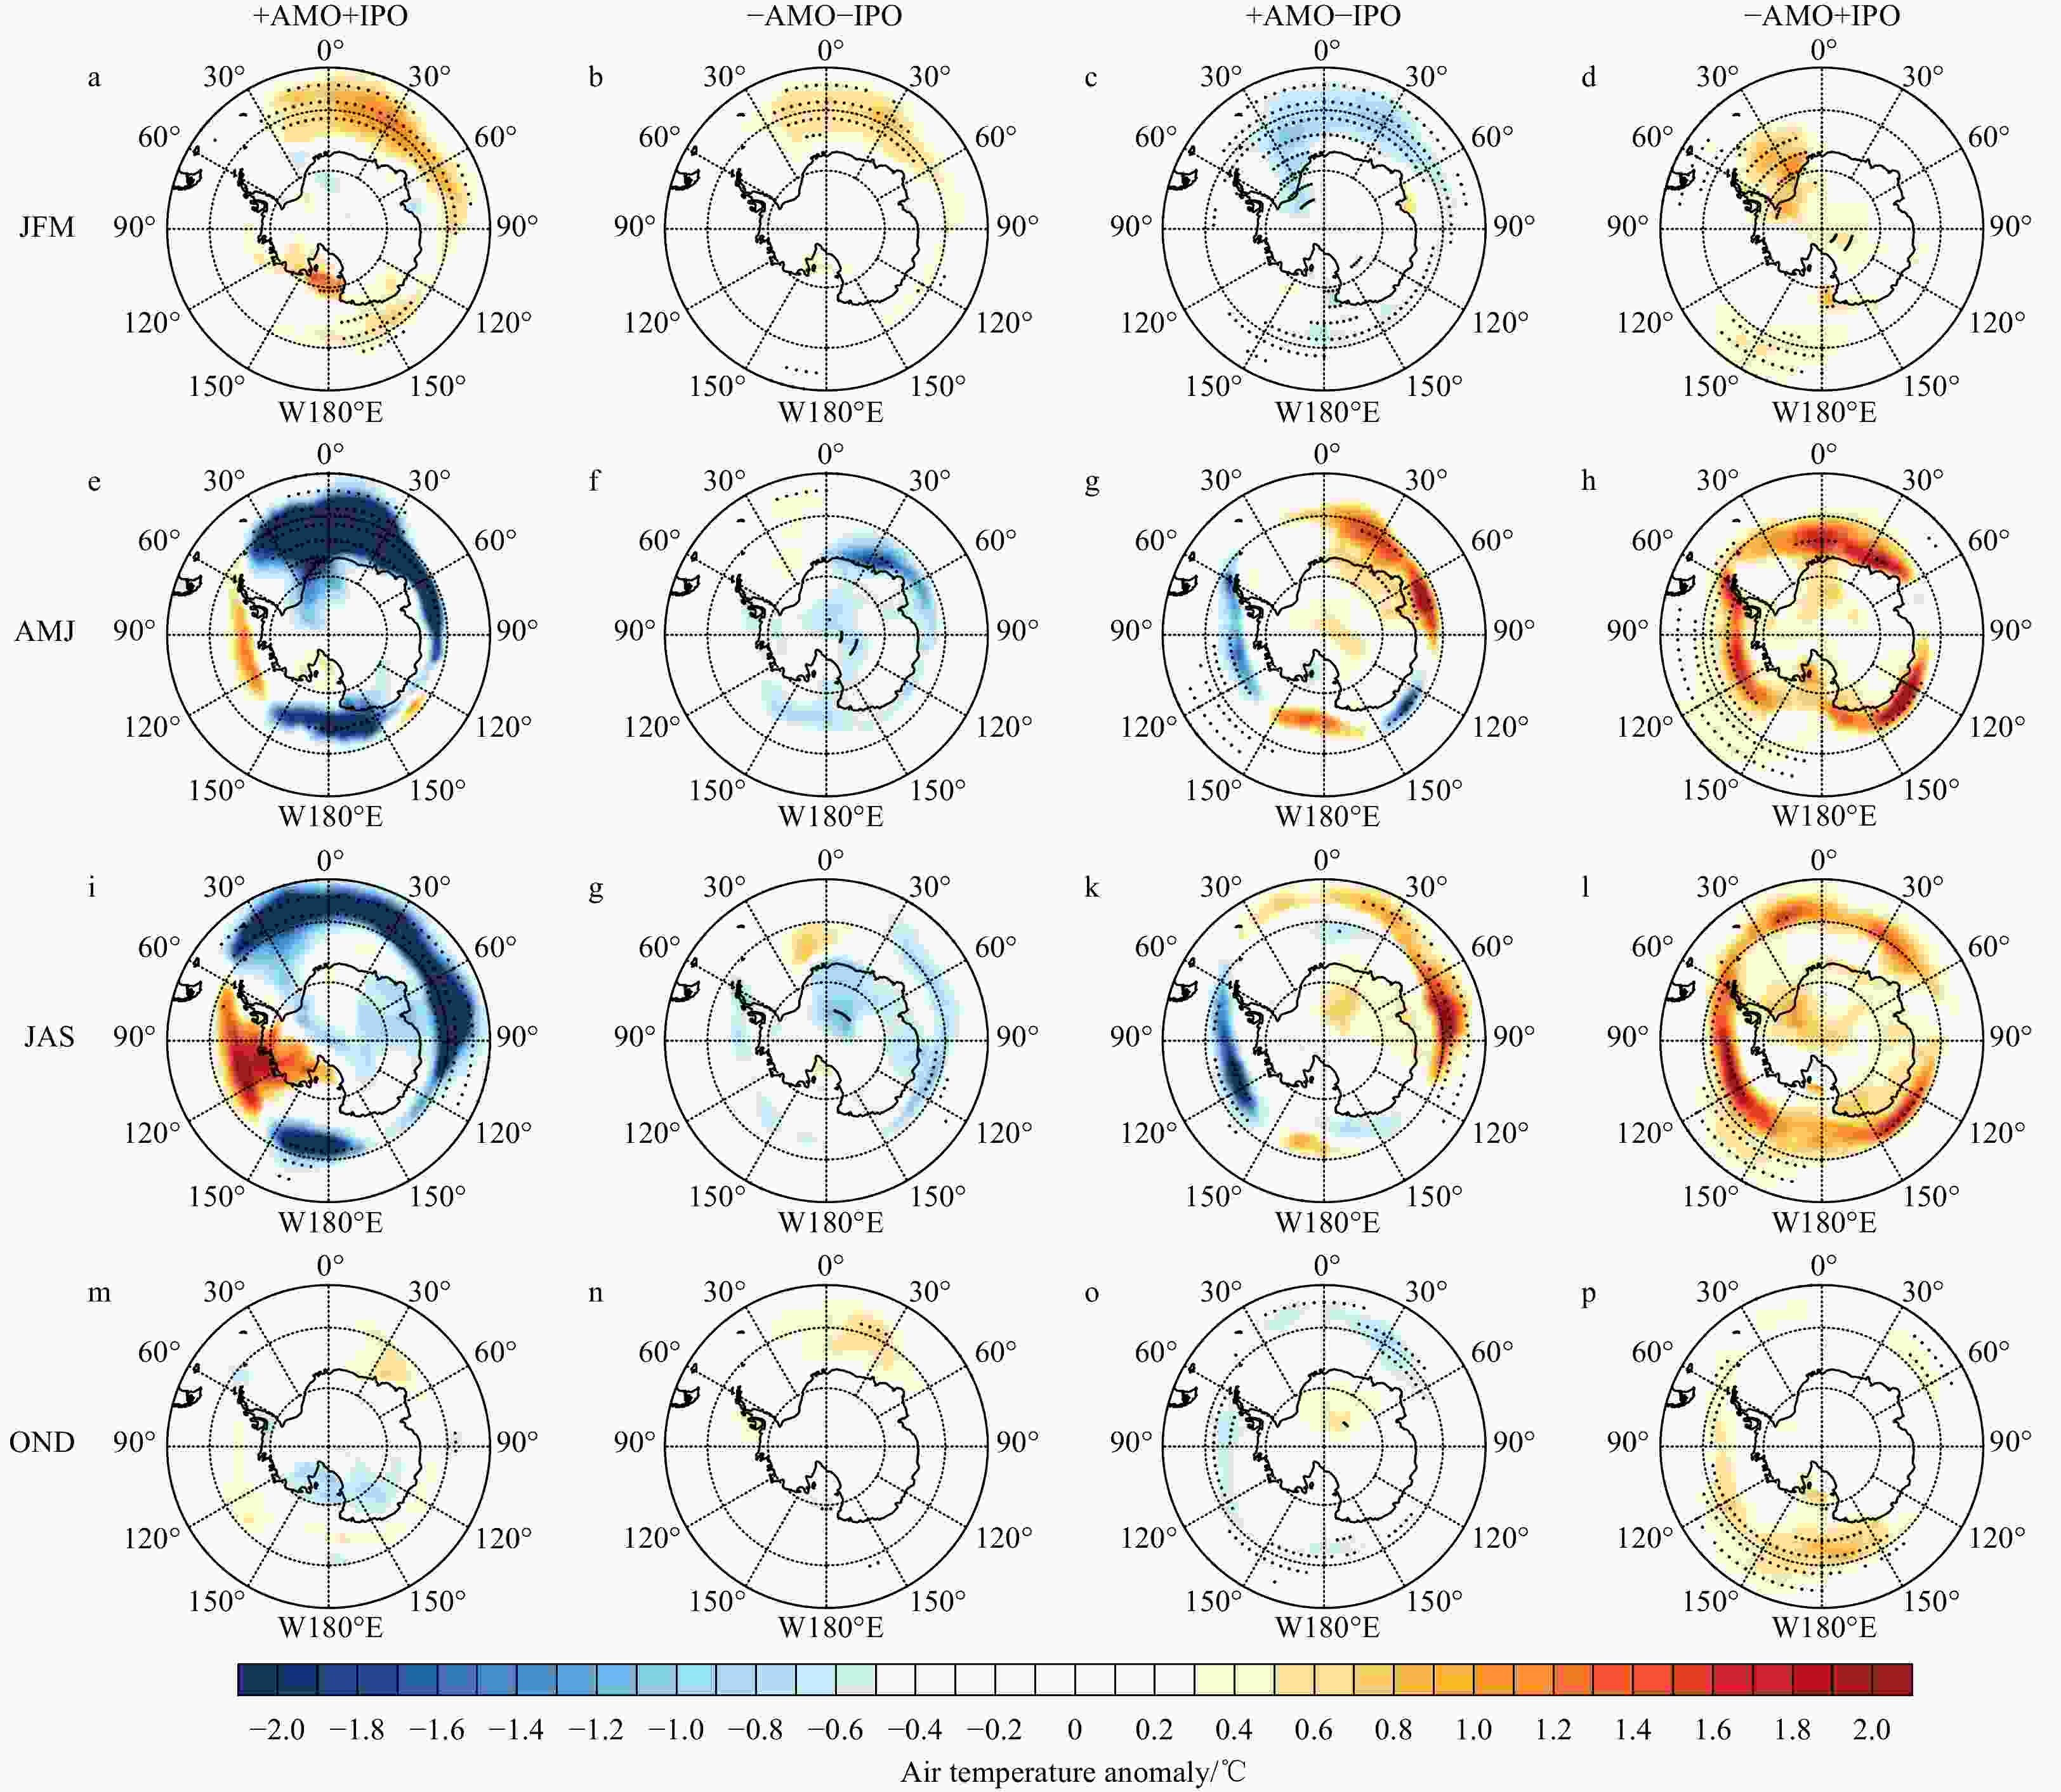
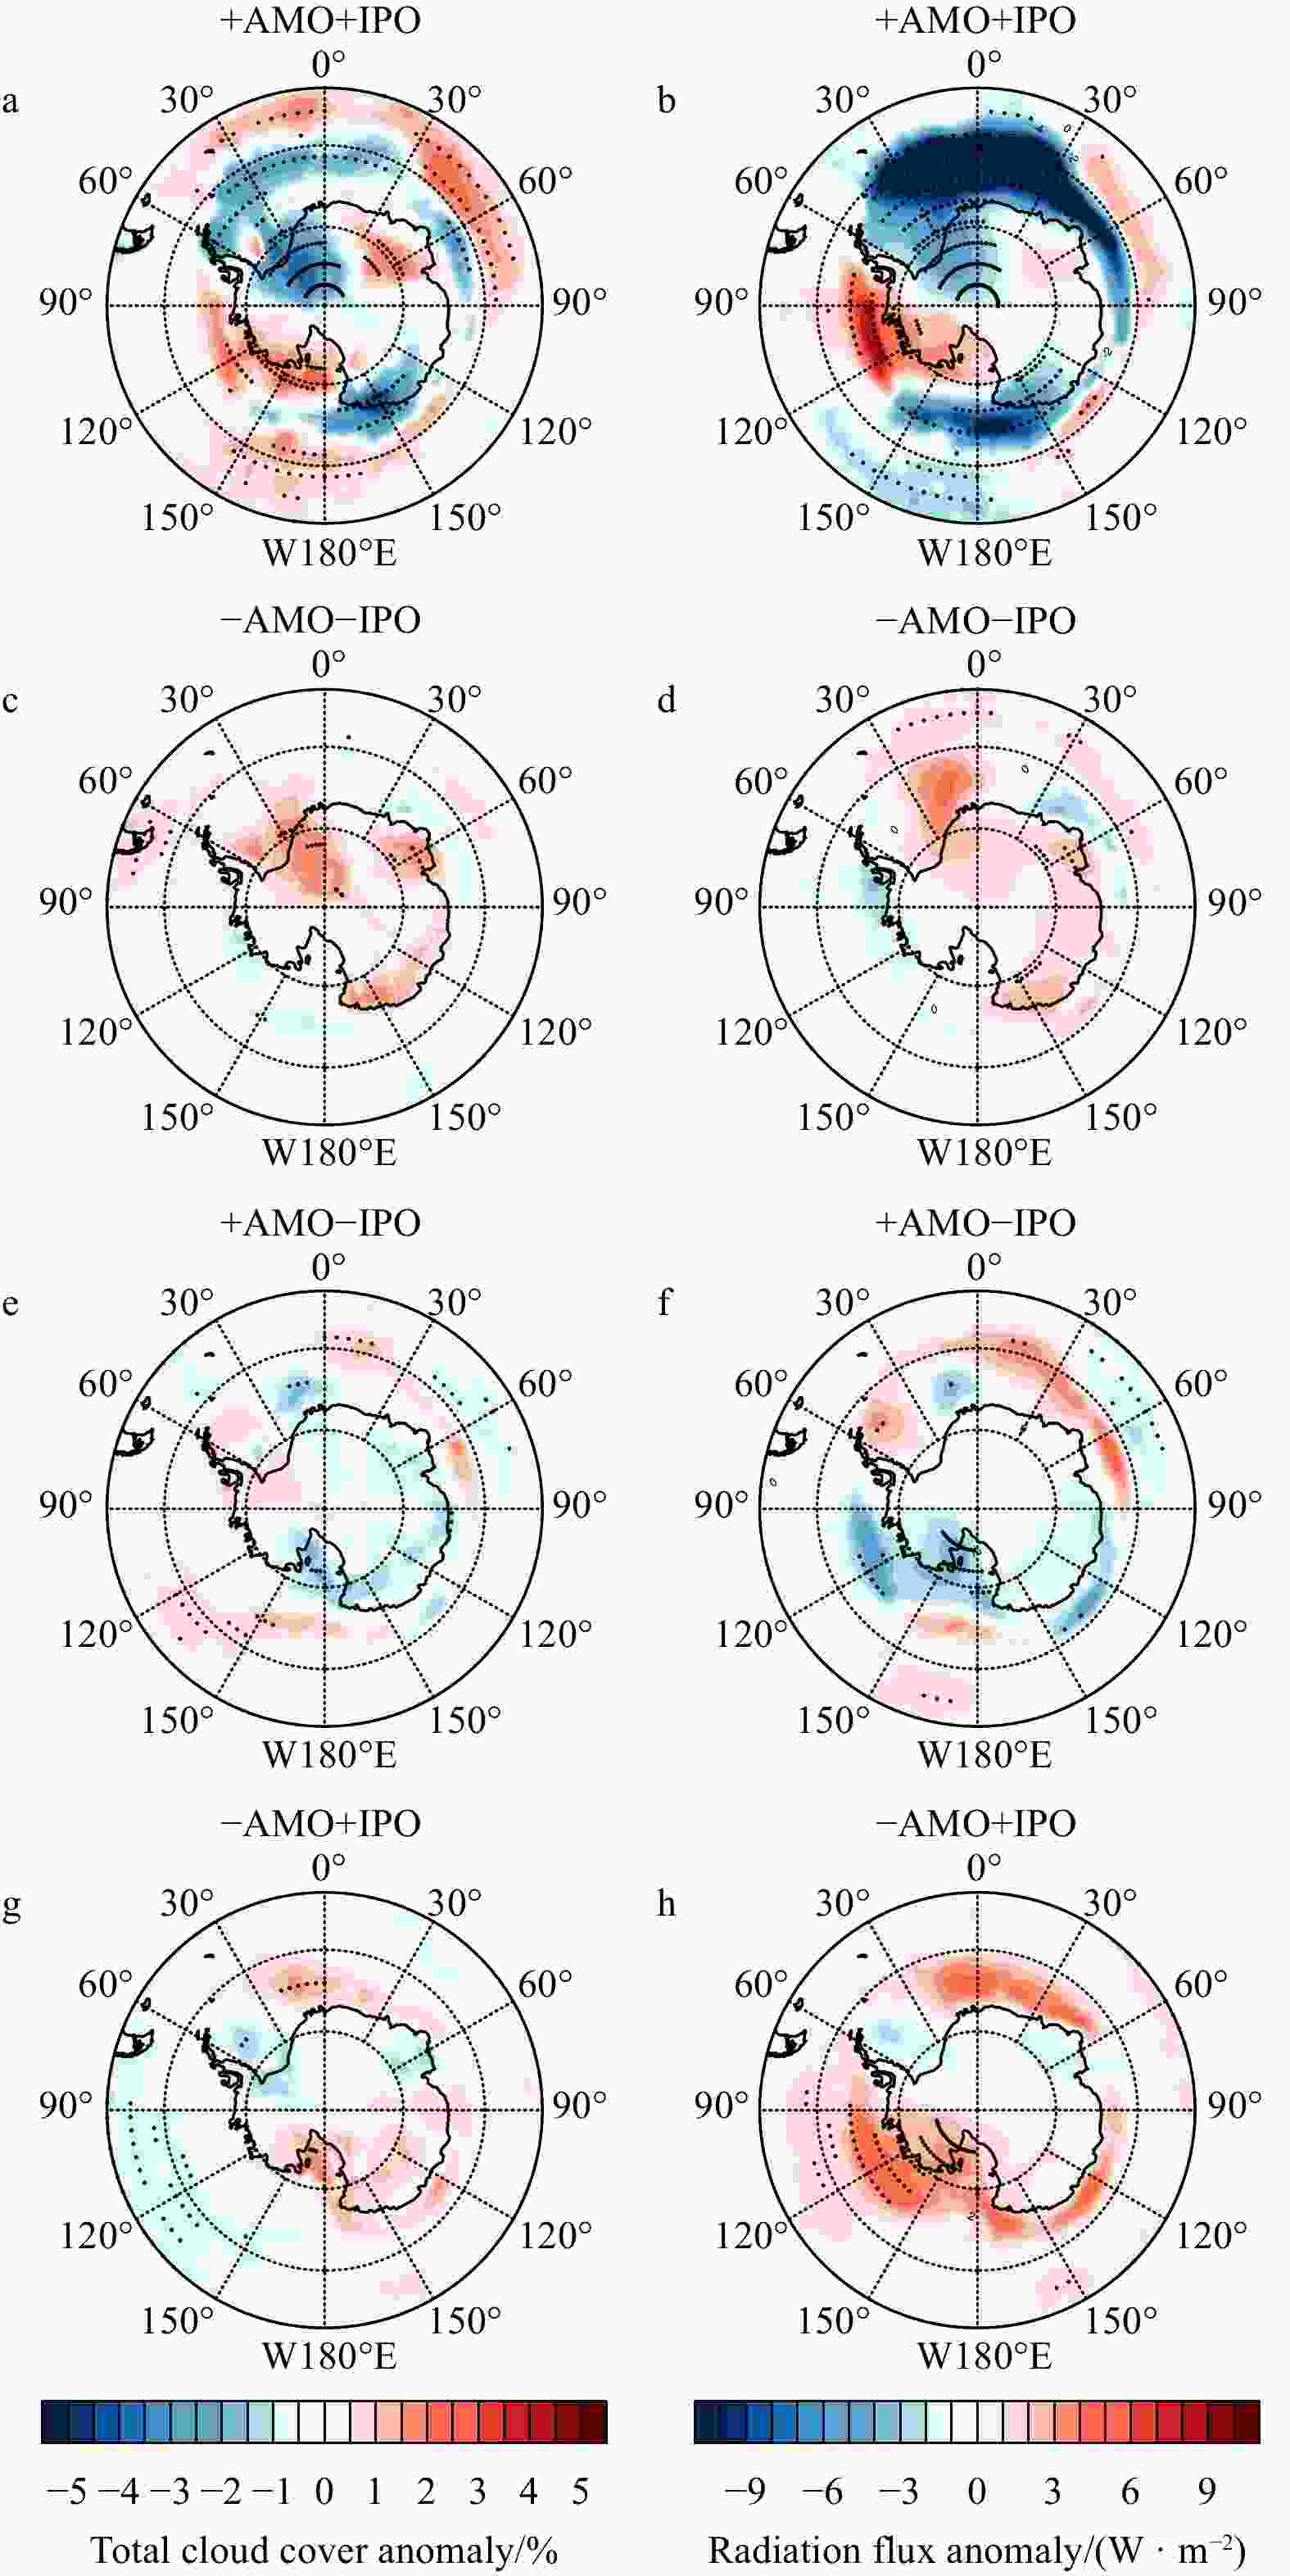
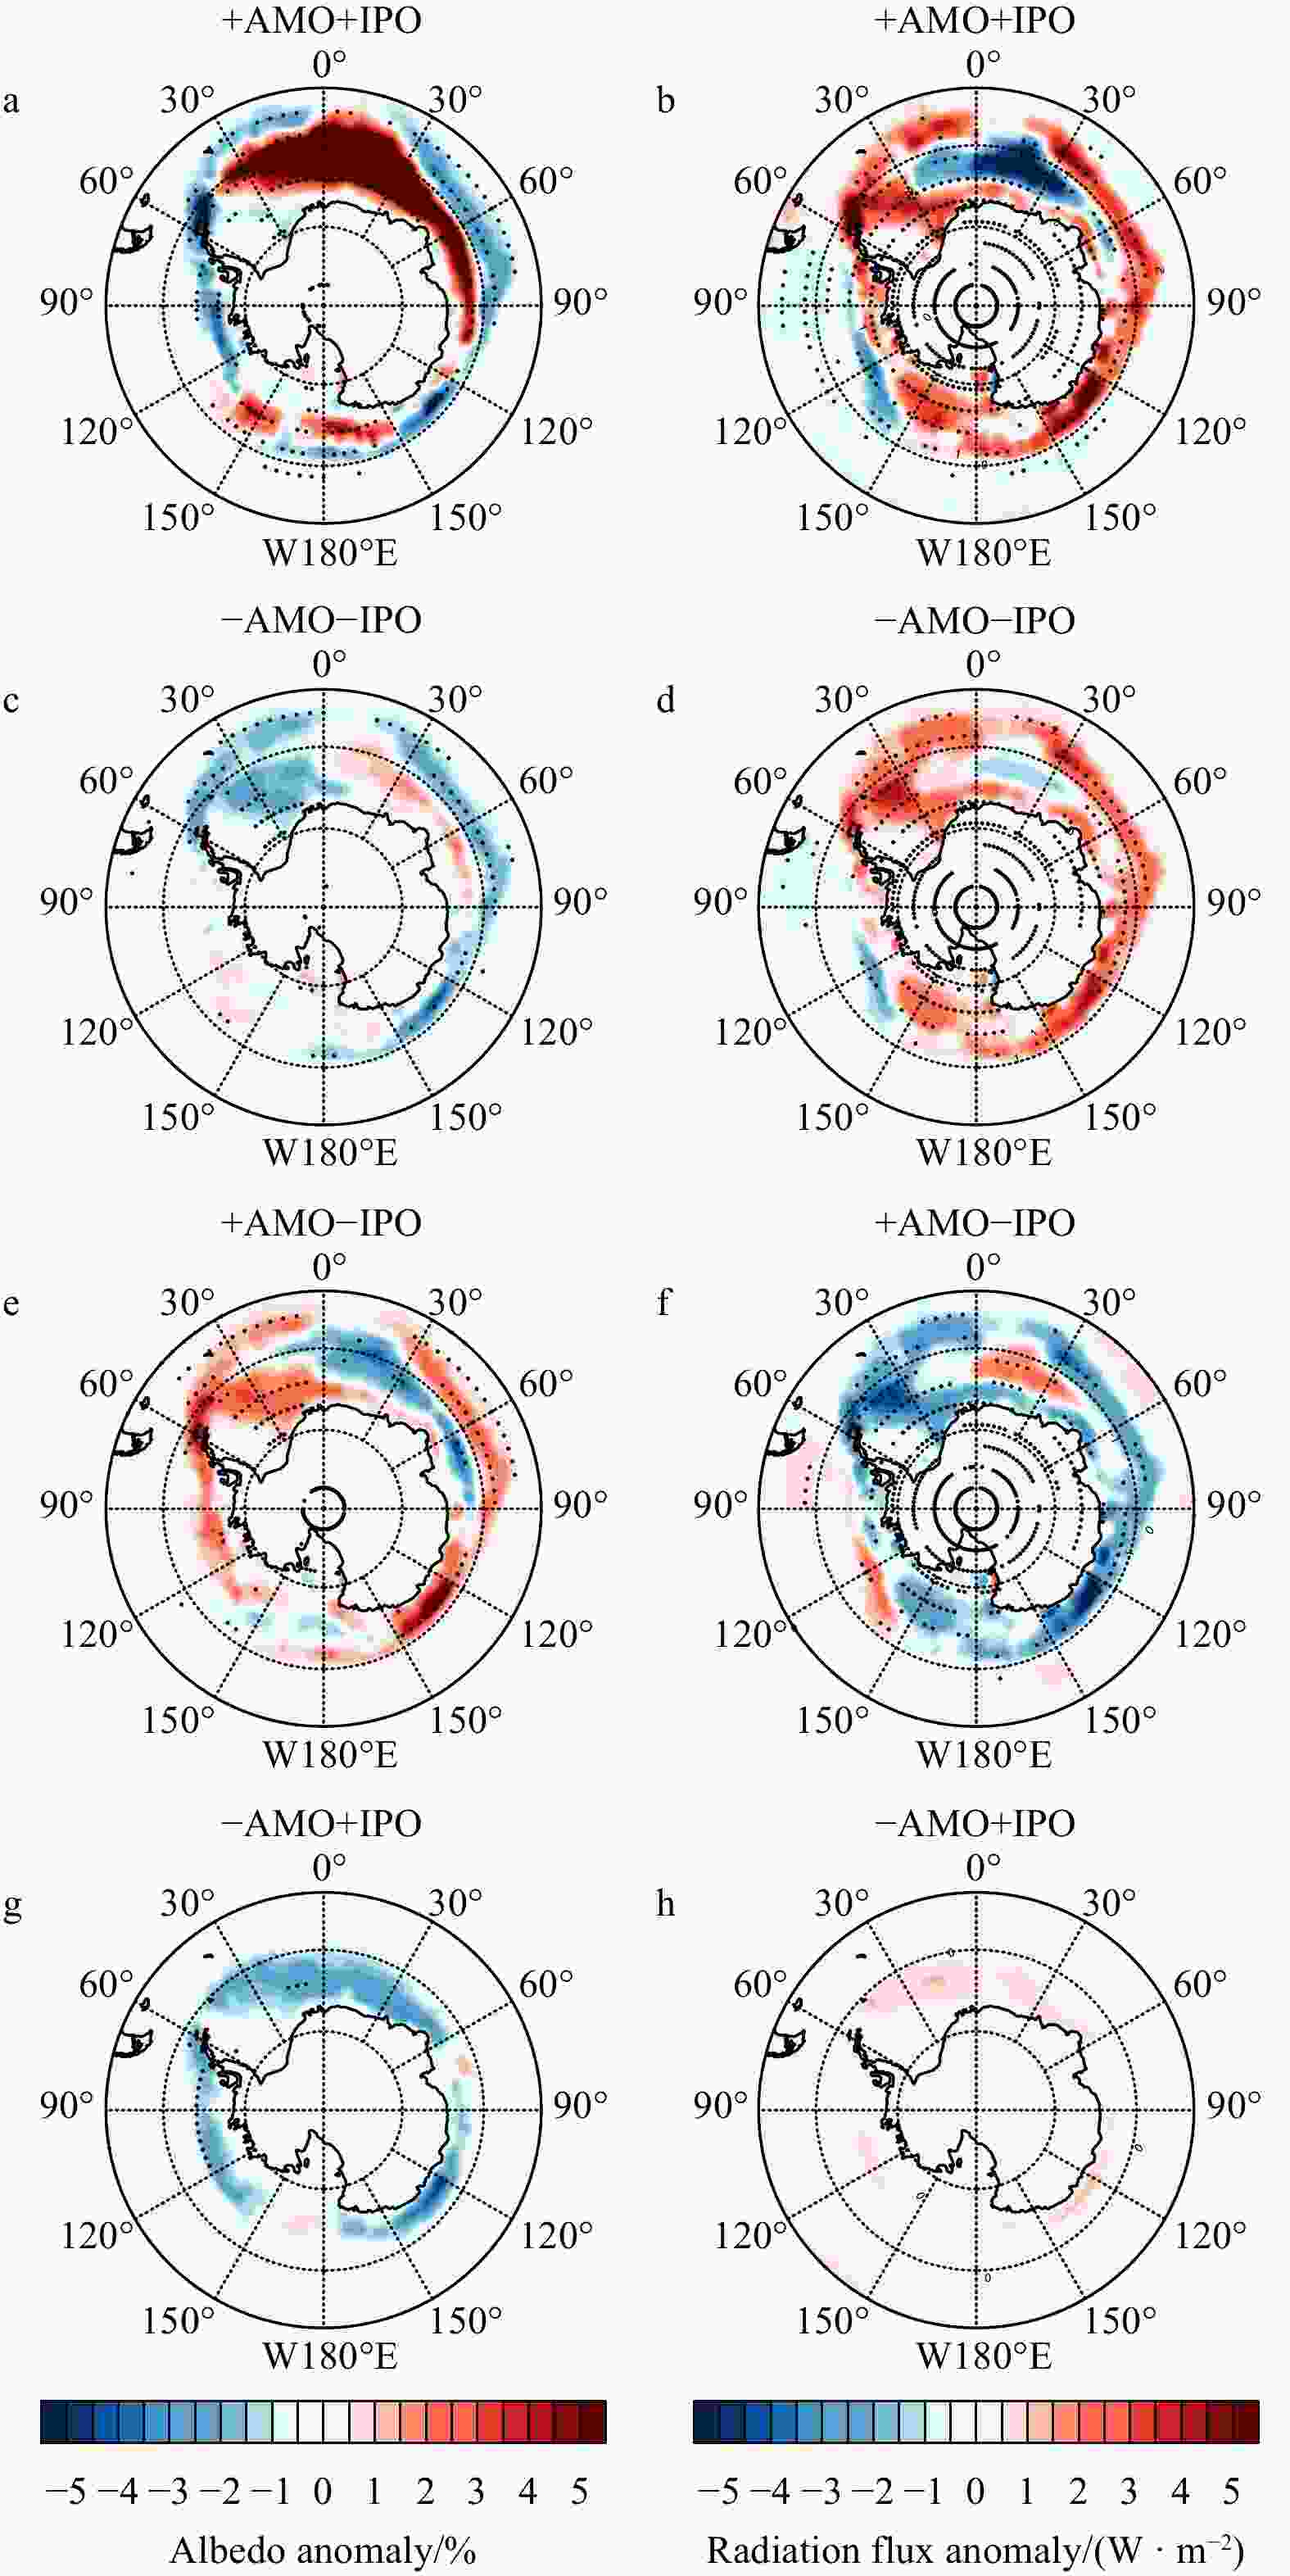
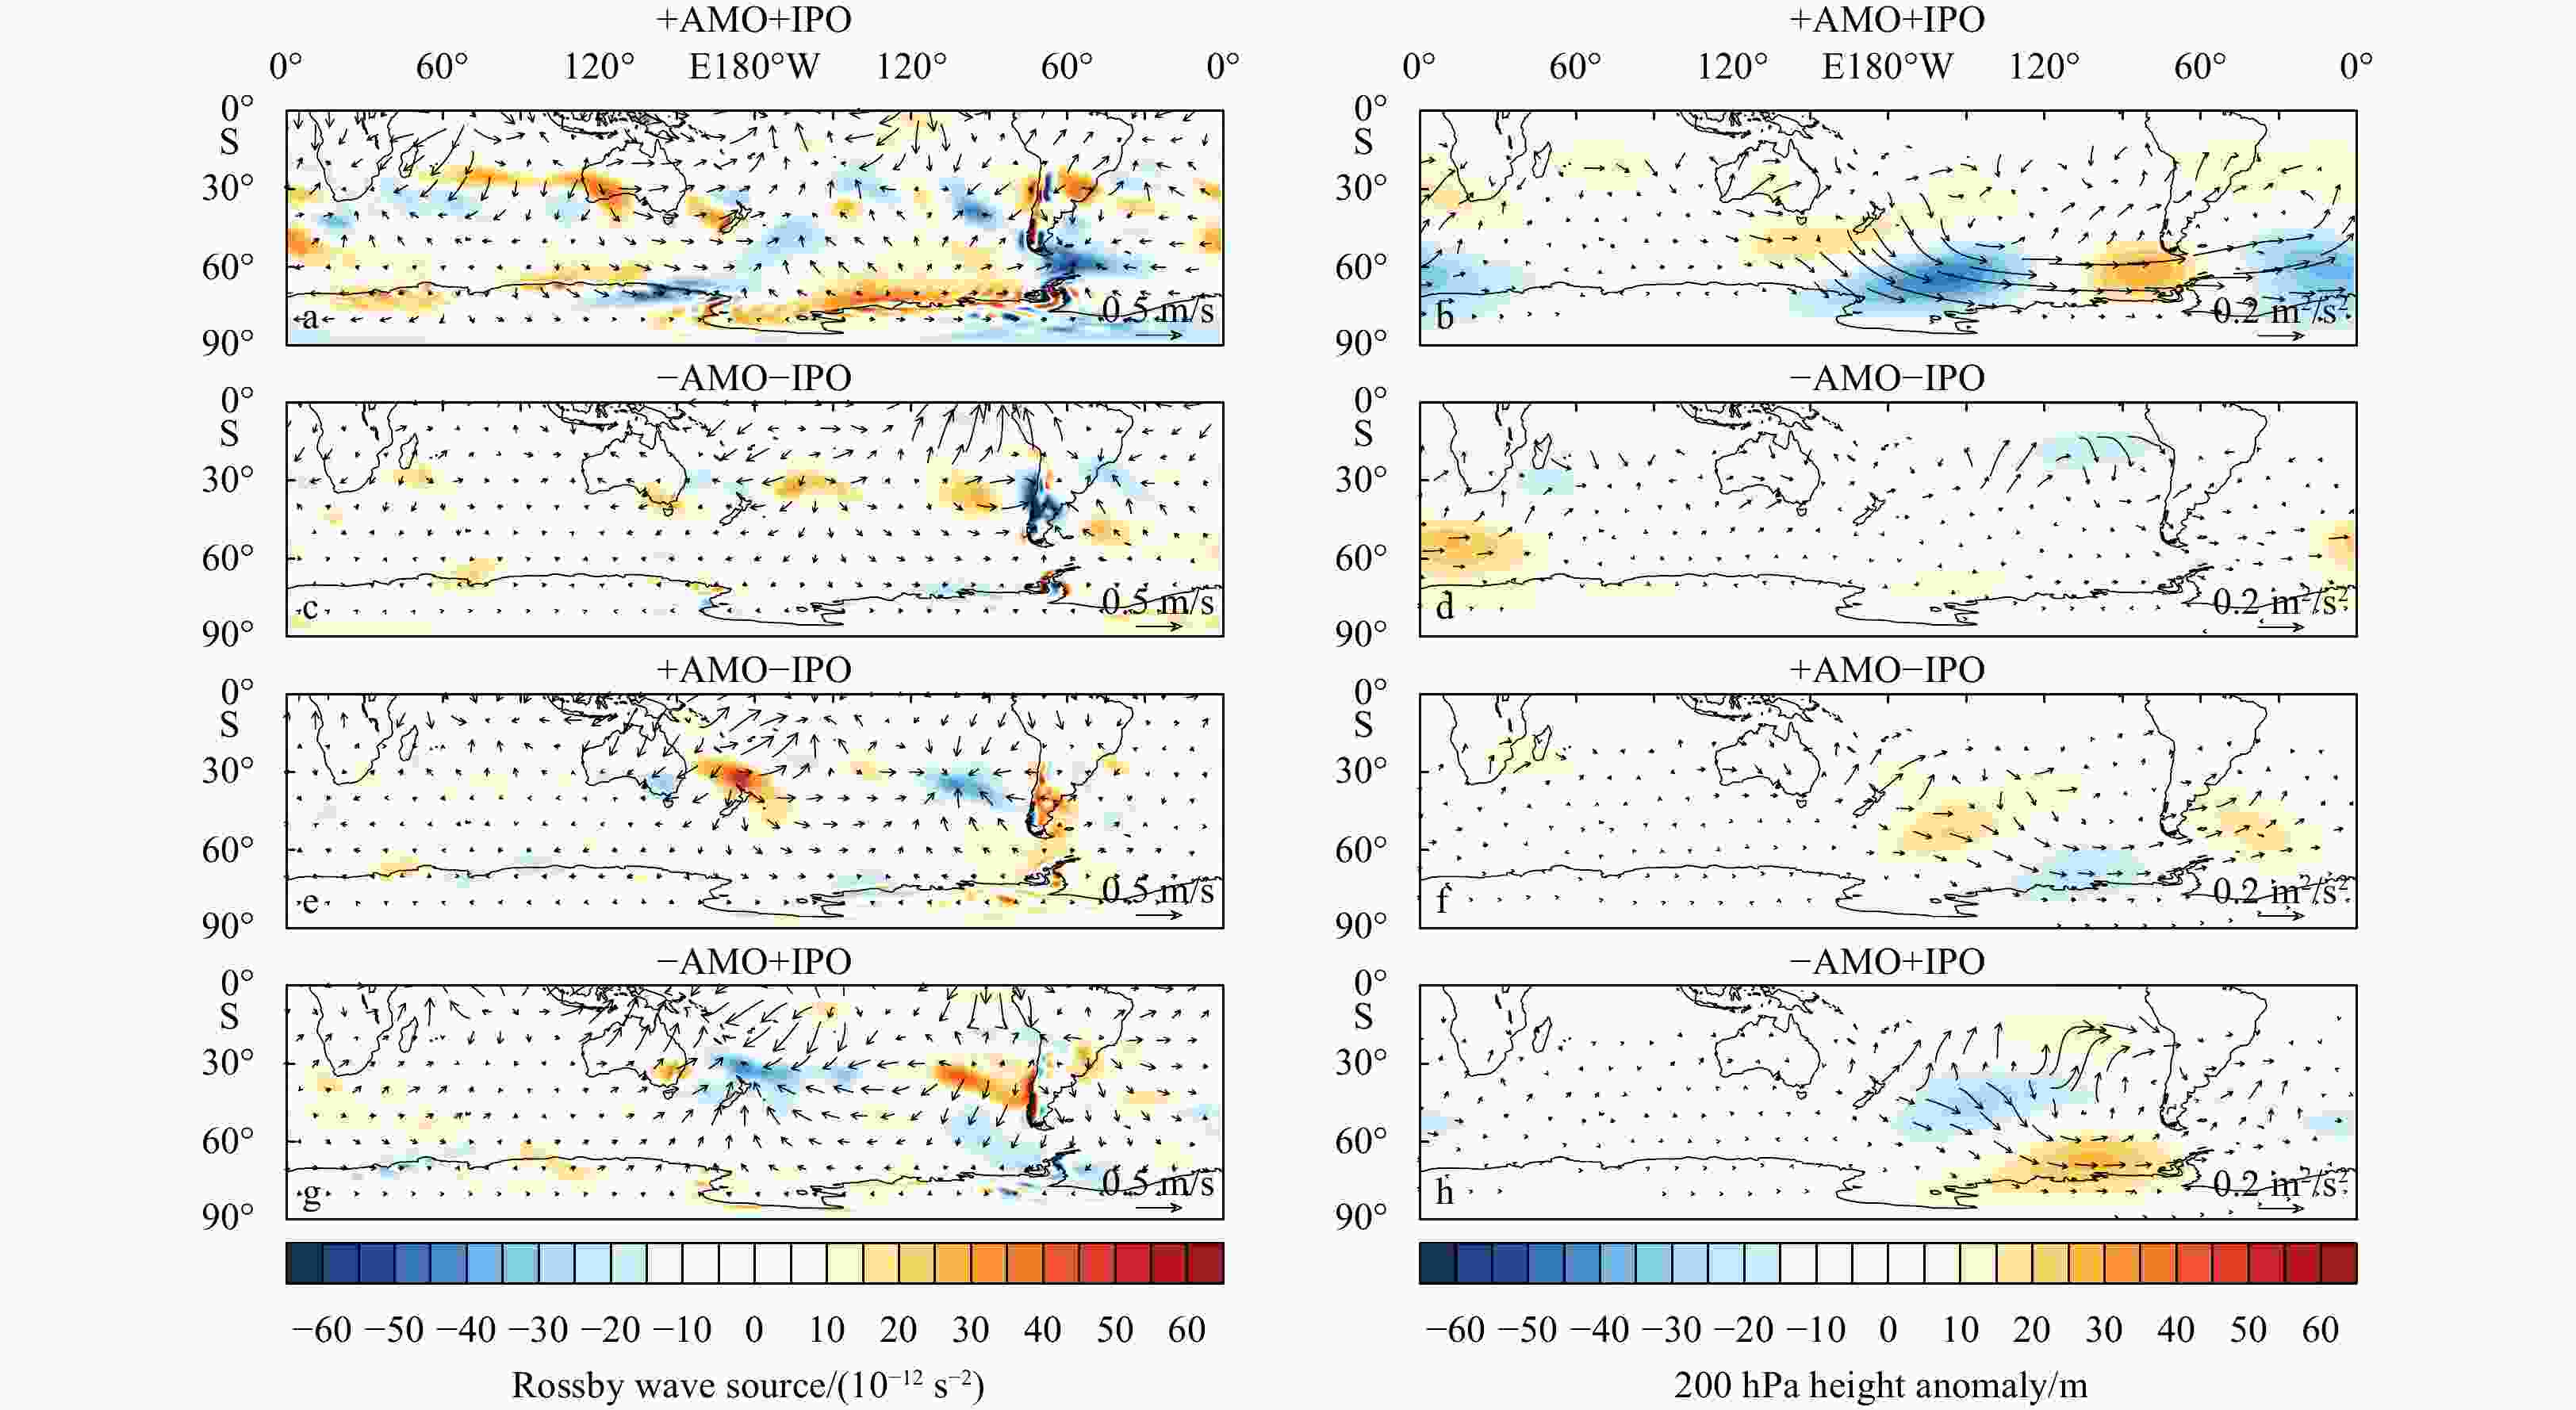
Abstract: The importance of the Atlantic Multidecadal Oscillation (AMO) and Interdecadal Pacific Oscillation (IPO) in influencing zonally asymmetric changes in Antarctic surface air temperature (SAT) has been established. However, previous studies have primarily concentrated on examining the combined impact of the contrasting phases of the AMO and IPO, which have been dominant since the advent of satellite observations in 1979. This study utilizes long-term reanalysis data to investigate the impact of four combinations of +AMO+IPO, –AMO–IPO, +AMO–IPO, and –AMO+IPO on Antarctic SAT over the past 115 years. The +AMO phase is characterized by a spatial mean temperature amplitude of up to 0.5℃ over the North Atlantic Ocean, accompanied by positive sea surface temperature (SST) anomalies in the tropical eastern Pacific and negative SST anomalies in the extratropical-mid-latitude western Pacific, which are indicative of the +IPO phase. The Antarctic SAT exhibits contrasting spatial patterns during the +AMO+IPO and +AMO–IPO periods. However, during the –AMO+IPO period, apart from the Antarctic Peninsula and the vicinity of the Weddell Sea, the entire Antarctic region experiences a warming trend. The most pronounced signal in the SAT anomalies is observed during the austral autumn, whereas the combination of –AMO and –IPO exhibits the smallest magnitude across all the combinations. The wavetrain excited by the SST anomalies associated with the AMO and IPO induces upper-level and surface atmospheric circulation anomalies, which alter the SAT anomalies. Furthermore, downward longwave radiation anomalies related to anomalous cloud cover play a crucial role. In the future, if the phases of AMO and IPO were to reverse (AMO transitioning to a negative phase and IPO transitioning to a positive phase), Antarctica could potentially face more pronounced warming and accelerated melting compared to the current observations.
-
Table 1. Years in different phases of the AMO and IPO from 1900–2015
Month Years in different phases +AMO+IPO –AMO–IPO +AMO–IPO –AMO+IPO JFM
1929–1933
1938–1942
1908–1912
1914–1926
1964–19781934–1937
1943–1963
1998–20151900–1907/1913
1927–1928
1979–1997AMJ
1928–1933
1938–1942
1908–1912
1914–1925
1963–19781934–1937
1943–1962
1998–20151900–1907/1913
1926–1927
1979–1997JAS
1928–1933
1937–1942/1997
1908–1912
1914–1925
1963–19771934–1036
1943–1962
1998–20151900–1907/1913
1926–1927
1978–1996OND
1928–1932
1937–1941
1908–1925
1963–1977
1933–1936
1942–1962
1997–20151900–1907
1926–1927
1978–1996Table 2. Correlation coefficients of surface temperature anomalies between ERA-20C and 20CR in different phases of the AMO and IPO
Month Correlation coefficient +AMO+IPO –AMO–IPO +AMO–IPO –AMO+IPO JFM 0.62* 0.77* 0.86* 0.72* AMJ 0.93* 0.01 0.63* 0.74* JAS 0.79* 0.26* 0.69* 0.72* OND 0.62* 0.41* 0.64* 0.73* Note: Asterisk (*) denotes above 99% confidence level. -
Bromwich D H, Nicolas J P, Monaghan A J, et al. 2013. Central West Antarctica among the most rapidly warming regions on Earth. Nature Geoscience, 6(2): 139–145, doi: 10.1038/ngeo1671 Ding Qinghua, Steig E J. 2013. Temperature change on the Antarctic Peninsula linked to the tropical Pacific. Journal of Climate, 26(19): 7570–7585, doi: 10.1175/JCLI-D-12-00729.1 Ding Qinghua, Steig E J, Battisti D S, et al. 2011. Winter warming in West Antarctica caused by central tropical Pacific warming. Nature Geoscience, 4(6): 398–403, doi: 10.1038/ngeo1129 Enfield D B, Mestas-Nuñez A M, Trimble P J. 2001. The Atlantic multidecadal oscillation and its relation to rainfall and river flows in the continental U.S. Geophysical Research Letters, 28(10): 2077–2080, doi: 10.1029/2000GL012745 Fogt R L, Bromwich D H. 2006. Decadal variability of the ENSO teleconnection to the high-latitude South Pacific governed by coupling with the southern annular mode. Journal of Climate, 19(6): 979–997, doi: 10.1175/Jcli3671.1 Fogt R L, Bromwich D H, Hines K M. 2011. Understanding the SAM influence on the South Pacific ENSO teleconnection. Climate Dynamics, 36(7/8): 1555–1576, doi: 10.1007/s00382-010-0905-0 Garfinkel C I, Hartmann D L. 2007. Effects of the El Niño-Southern Oscillation and the Quasi-Biennial Oscillation on polar temperatures in the stratosphere. Journal of Geophysical Research: Atmospheres, 112(D19): D19112, doi: 10.1029/2007JD00 8481, doi: 10.1029/2007JD008481 Henley B J, Gergis J, Karoly D J, et al. 2015. A tripole index for the Interdecadal Pacific Oscillation. Climate Dynamics, 45(11–12): 3077–3090, doi: 10.1007/s00382-015-2525-1 Hersbach H, Bell B, Berrisford P, et al. 2020. The ERA5 global reanalysis. Quarterly Journal of the Royal Meteorological Society, 146(730): 1999–2049, doi: 10.1002/qj.3803 Hobbs W R, Massom R, Stammerjohn S, et al. 2016. A review of recent changes in Southern Ocean sea ice, their drivers and forcings. Global and Planetary Change, 143: 228–250, doi: 10.1016/j.gloplacha.2016.06.008 Hosking J S, Orr A, Marshall G J, et al. 2013. The influence of the Amundsen-Bellingshausen seas low on the climate of West Antarctica and its representation in coupled climate model simulations. Journal of Climate, 26(17): 6633–6648, doi: 10.1175/JCLI-D-12-00813.1 Huang Boyin, Thorne P W, Banzon V F, et al. 2017. Extended Reconstructed Sea Surface Temperature, version 5 (ERSSTv5): upgrades, validations, and intercomparisons. Journal of Climate, 30(20): 8179–8205, doi: 10.1175/JCLI-D-16-0836.1 Jones M E, Bromwich D H, Nicolas J P, et al. 2019. Sixty years of widespread warming in the southern middle and high latitudes (1957–2016). Journal of Climate, 32(20): 6875–6898, doi: 10.1175/JCLI-D-18-0565.1 Klein F, Abram N J, Curran M A J, et al. 2019. Assessing the robustness of Antarctic temperature reconstructions over the past 2 millennia using pseudoproxy and data assimilation experiments. Climate of the Past, 15(2): 661–684, doi: 10.5194/cp-15-661-2019 Kren A C, Marsh D R, Smith A K, et al. 2016. Wintertime Northern Hemisphere response in the stratosphere to the Pacific decadal oscillation using the whole atmosphere community climate model. Journal of Climate, 29(3): 1031–1049, doi: 10.1175/JCLI-D-15-0176.1 Kreutz K J, Mayewski P A, Pittalwala I I, et al. 2000. Sea level pressure variability in the Amundsen Sea region inferred from a West Antarctic glaciochemical record. Journal of Geophysical Research: Atmospheres, 105(D3): 4047–4059, doi: 10.1029/1999JD901069 Li Xichen, Cai Wenju, Meehl G A, et al. 2021. Tropical teleconnection impacts on Antarctic climate changes. Nature Reviews Earth & Environment, 2(10): 680–698., doi: 10.1038/s43017-021-00204-5 Li Guangliang, Feng Licheng, Zhuang Wei, et al. 2024. Differences in spring precipitation over southern China associated with multiyear La Niña events. Acta Oceanologica Sinica, 43(2):1–10, doi: 10.1007/s13131-023-2147-0 Li Xichen, Gerber E P, Holland D M, et al. 2015. A Rossby wave bridge from the tropical Atlantic to West Antarctica. Journal of Climate, 28(6): 2256–2273, doi: 10.1175/JCLI-D-14-00450.1 Li Xichen, Holland D M, Gerber E P, et al. 2014. Impacts of the north and tropical Atlantic Ocean on the Antarctic Peninsula and sea ice. Nature, 505(7484): 538–542, doi: 10.1038/nature12945 Liu Na, Wang Hui, Ling Tiejun, et al. 2013. The influence of ENSO on sea surface temperature variations in the China seas. Acta Oceanologica Sinica, 32(9): 21–29, doi: 10.1007/s13131-013-0348-7 Marshall G J, Thompson D W J. 2016. The signatures of large-scale patterns of atmospheric variability in Antarctic surface temperatures. Journal of Geophysical Research: Atmospheres, 121(7): 3276–3289, doi: 10.1002/2015JD024665 Meehl G A, Arblaster J M, Bitz C M, et al. 2016. Antarctic sea-ice expansion between 2000 and 2014 driven by tropical Pacific decadal climate variability. Nature Geoscience, 9(8): 590–595, doi: 10.1038/ngeo2751 Nicolas J P, Bromwich D H. 2014. New reconstruction of Antarctic near-surface temperatures: multidecadal trends and reliability of global reanalyses. Journal of Climate, 27(21): 8070–8093, doi: 10.1175/JCLI-D-13-00733.1 Rao Jian, Ren Rongcai. 2018. Varying stratospheric responses to tropical Atlantic SST forcing from early to late winter. Climate Dynamics, 51(5/6): 2079–2096,doi: 10.1007/s00382-017-3998-x, doi: 10.1007/s00382-017-3998-x Raphael M N, Marshall G J, Turner J, et al. 2016. The Amundsen Sea low: variability, change, and impact on Antarctic climate. Bulletin of the American Meteorological Society, 97(1): 111–121, doi: 10.1175/BAMS-D-14-00018.1 Sardeshmukh P D, Hoskins B J. 1988. The generation of global rotational flow by steady idealized tropical divergence. Journal of the Atmospheric Sciences, 45(7): 1228–1251, doi: 10.1175/1520-0469(1988)045<1228:TGOGRF>2.0.CO;2 Schneider D P, Deser C, Okumura Y. 2012. An assessment and interpretation of the observed warming of West Antarctica in the austral spring. Climate Dynamics, 38(1/2): 323–347, doi: 10.1007/s00382-010-0985-x Schneider D P, Fogt R L. 2018. Artifacts in century-length atmospheric and coupled reanalyses over Antarctica due to historical data availability. Geophysical Research Letters, 45(2): 964–973, doi: 10.1002/2017GL076226 Simpkins G R, Mcgregor S, Taschetto A S, et al. 2014. Tropical connections to climatic change in the extratropical Southern Hemisphere: the role of Atlantic SST trends. Journal of Climate, 27(13): 4923–4936, doi: 10.1175/JCLI-D-13-00615.1 Simpkins G R, Peings Y, Magnusdottir G. 2016. Pacific influences on tropical Atlantic teleconnections to the Southern Hemisphere high latitudes. Journal of Climate, 29(18): 6425–6444, doi: 10.1175/JCLI-D-15-0645.1 Slivinski L C, Compo G P, Sardeshmukh P D, et al. 2021. An evaluation of the performance of the twentieth century reanalysis version 3. Journal of Climate, 34(4): 1417–1438, doi: 10.1175/JCLI-D-20-0505.1 Slivinski L C, Compo G P, Whitaker J S, et al. 2019. Towards a more reliable historical reanalysis: improvements for version 3 of the Twentieth Century Reanalysis system. Quarterly Journal of the Royal Meteorological Society, 145(724): 2876–2908, doi: 10.1002/qj.3598 Song K, Son S W. 2018. Revisiting the ENSO-SSW relationship. Journal of Climate, 31(6): 2133–2143, doi: 10.1175/JCLI-D-17-0078.1 Stammerjohn S E, Martinson D G, Smith R C, et al. 2008. Trends in Antarctic annual sea ice retreat and advance and their relation to El Niño-Southern Oscillation and Southern Annular Mode variability. Journal of Geophysical Research: Oceans, 113(C3): C03S90, doi: 10.1029/2007jc004269 Steig E J, Schneider D P, Rutherford S D, et al. 2009. Warming of the Antarctic ice-sheet surface since the 1957 International Geophysical Year. Nature, 457(7228): 459–462, doi: 10.1038/nature07669 Thompson D W J, Solomon S. 2002. Interpretation of recent Southern Hemisphere climate change. Science, 296(5569): 895–899, doi: 10.1126/science.1069270 Turner J, Lu Hua, White I, et al. 2016. Absence of 21st century warming on Antarctic Peninsula consistent with natural variability. Nature, 535(7612): 411–415, doi: 10.1038/nature18645 Turner J, Phillips T, Hosking J S, et al. 2013. The Amundsen sea low. International Journal of Climatology, 33(7): 1818–1829, doi: 10.1002/joc.3558 Wallace J M, Rasmusson E M, Mitchell T P, et al. 1998. On the structure and evolution of ENSO-related climate variability in the tropical Pacific: lessons from TOGA. Journal of Geophysical Research: Oceans, 103(C7): 14241–14259, doi: 10.1029/97JC02905 Wang Guomin, Hendon H H, Arblaster J M, et al. 2019. Compounding tropical and stratospheric forcing of the record low Antarctic sea-ice in 2016. Nature Communications, 10(1): 13, doi: 10.1038/s41467-018-07689-7 Wang Ya, Huang Gang, Hu Kaiming. 2020. Internal variability in multidecadal trends of surface air temperature over Antarctica in austral winter in model simulations. Climate Dynamics, 55(9–10): 2835–2847, doi: 10.1007/s00382-020-05412-1 Xie Fei, Li J, Tian Wenshou, et al. 2012. Signals of El Niño Modoki in the tropical tropopause layer and stratosphere. Atmospheric Chemistry and Physics, 12(11): 5259–5273, doi: 10.5194/acp-12-5259-2012 Yu Lejiang, Zhong Shiyuan, Sun Bo. 2022. Synchronous variation patterns of monthly sea ice anomalies at the Arctic and Antarctic. Journal of Climate, 35(9): 2823–2847, doi: 10.1175/JCLI-D-21-0756.1 Yu Lejiang, Zhong Shiyuan, Winkler J A, et al. 2017. Possible connections of the opposite trends in Arctic and Antarctic sea-ice cover. Scientific Reports, 7: 45804, doi: 10.1038/srep45804 -


 下载:
下载:

