

What induced the trend shift of mixed-layer depths in the Antarctic Circumpolar Current region in the mid-1980s?
-
Abstract: An obvious trend shift in the annual mean and winter mixed layer depth (MLD) in the Antarctic Circumpolar Current (ACC) region was detected during the 1960–2021 period. Shallowing trends stopped in mid-1980s, followed by a period of weak trends. The MLD deepening trend difference between the two periods were mainly distributed in the western areas in the Drake Passage, the areas north to Victoria Land and Wilkes Land, and the central parts of the South Indian sector. The newly formed ocean current shear due to the meridional shift of the ACC flow axis between the two periods is the dominant driver for the MLD trends shift distributed in the western areas in the Drake Passage and the central parts of the South Indian sector. The saltier trends in the regions north to Victoria Land and Wilkes Land could be responsible for the strengthening mixing processes in this region.
-
Key words:
- mixed layer depth /
- trend shift /
- Antarctic Circumpolar Current (ACC) /
- flow axis
-
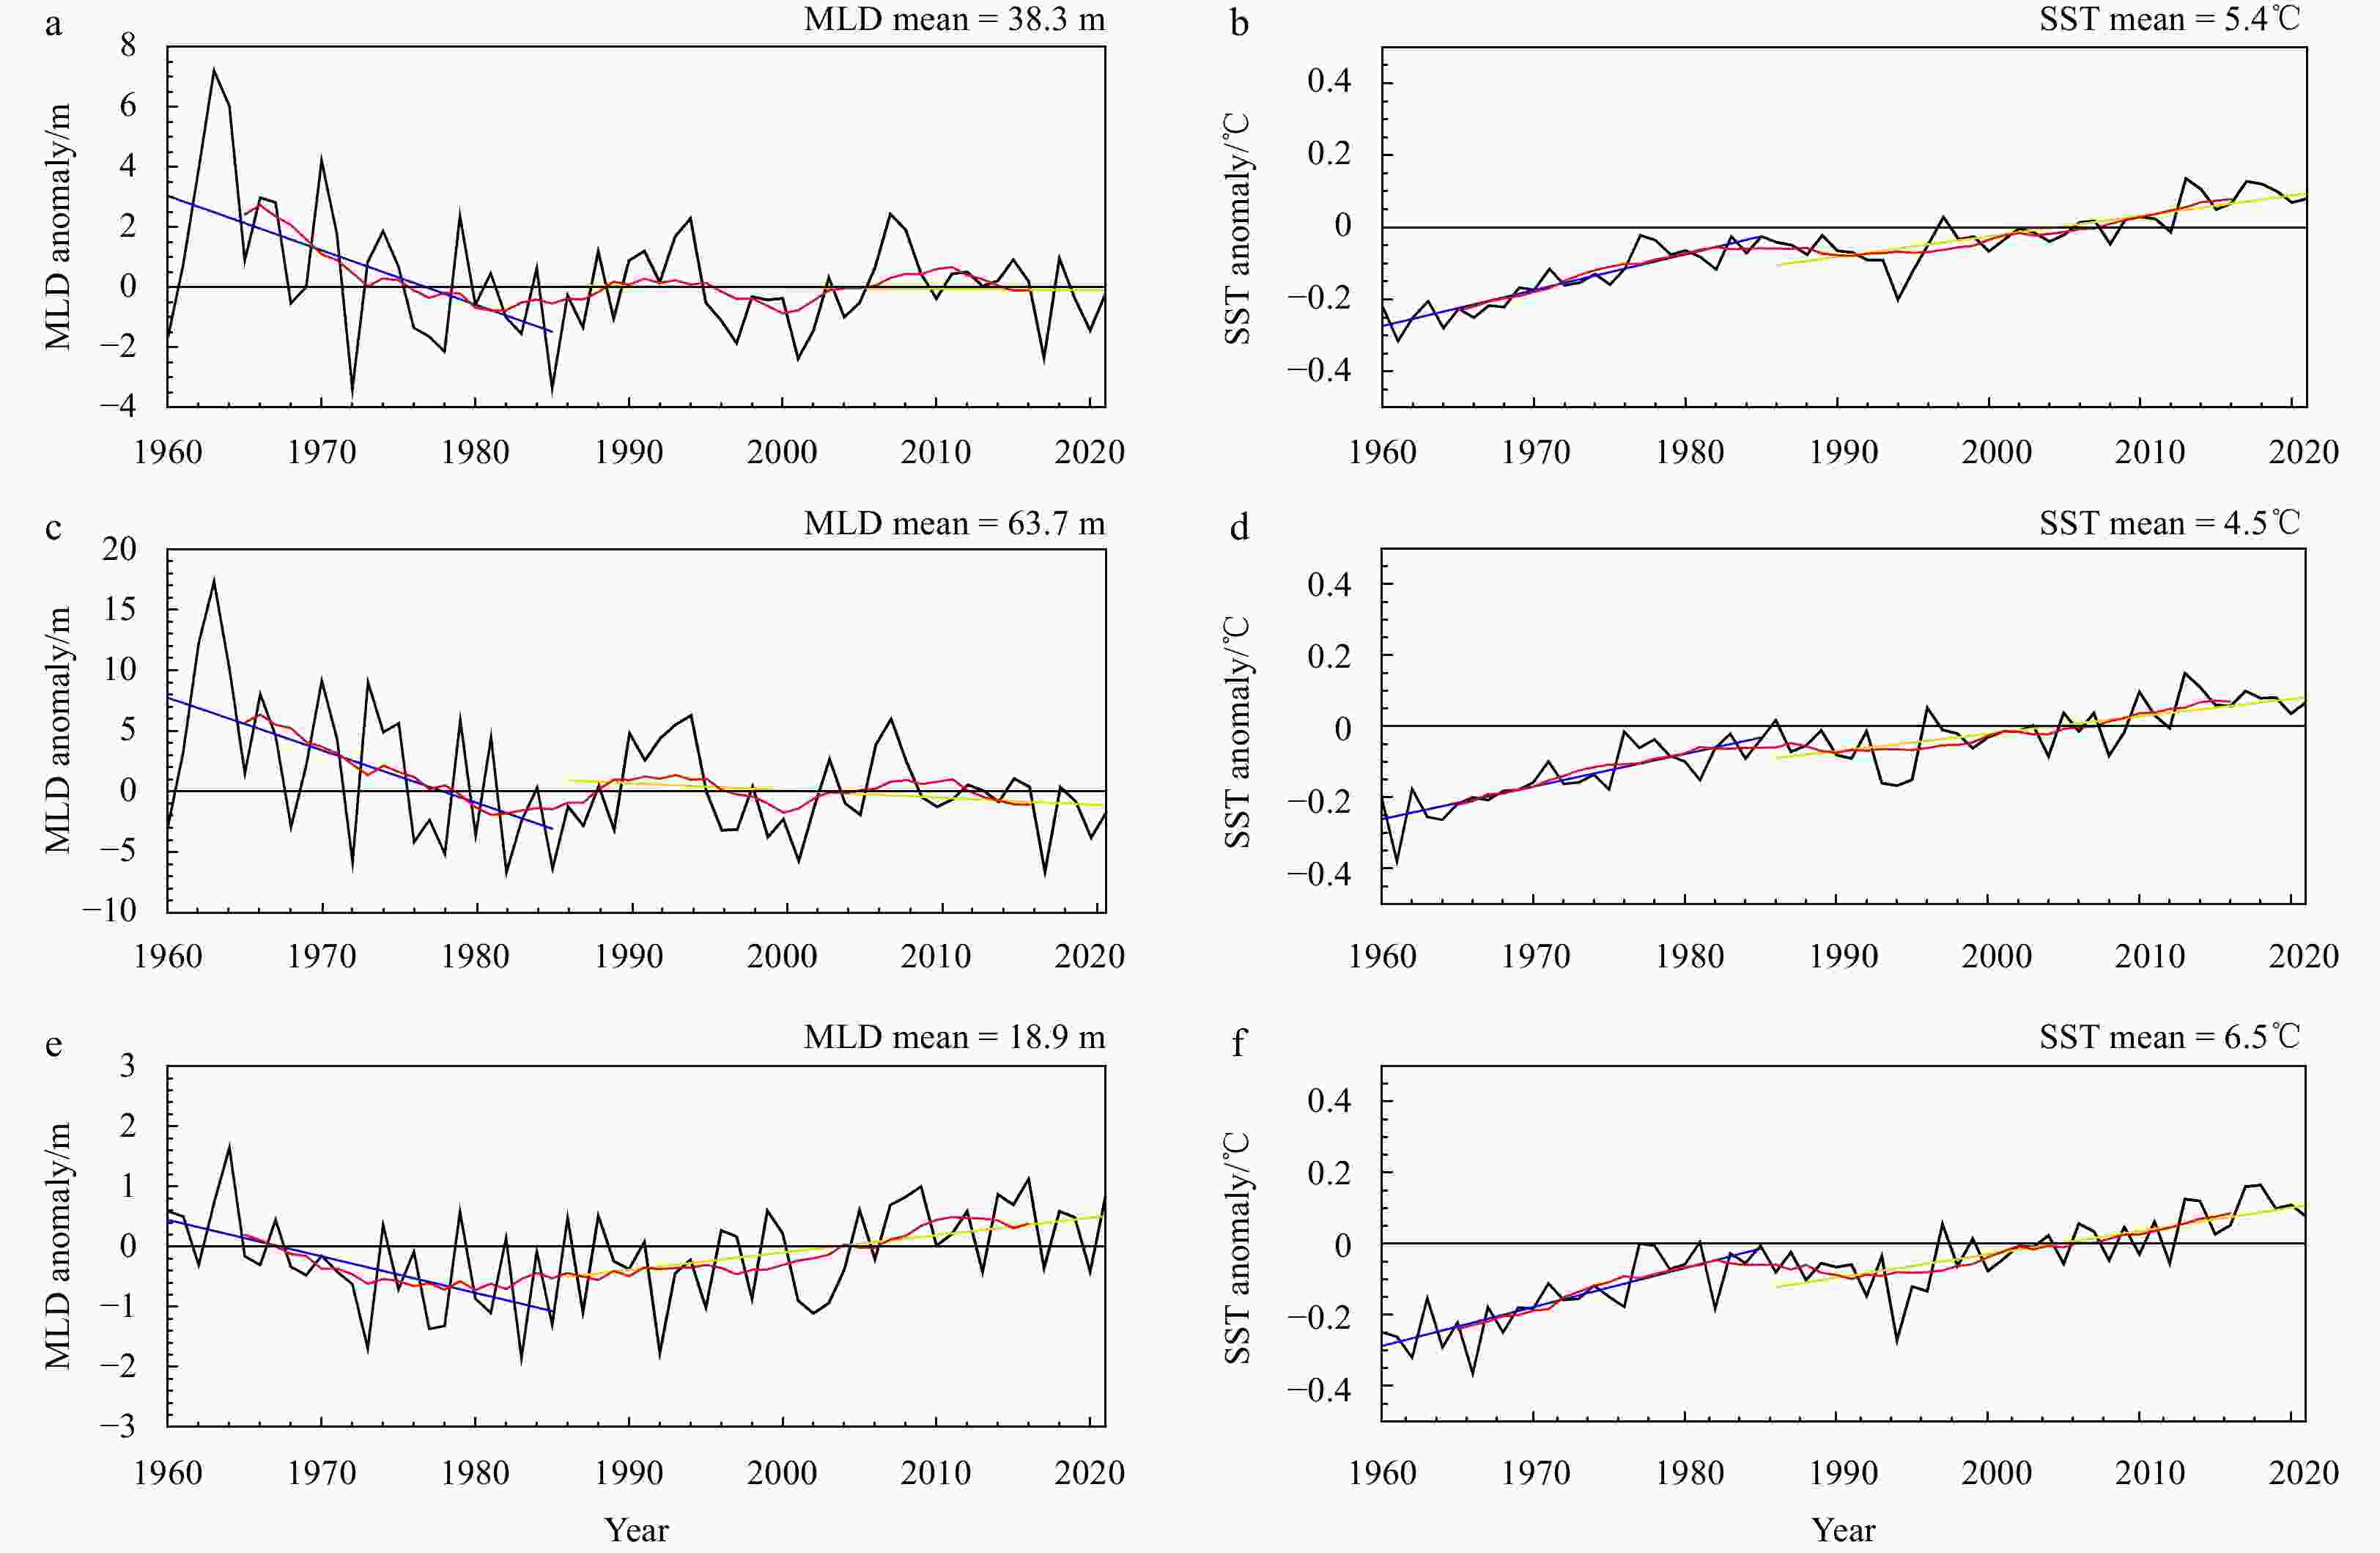
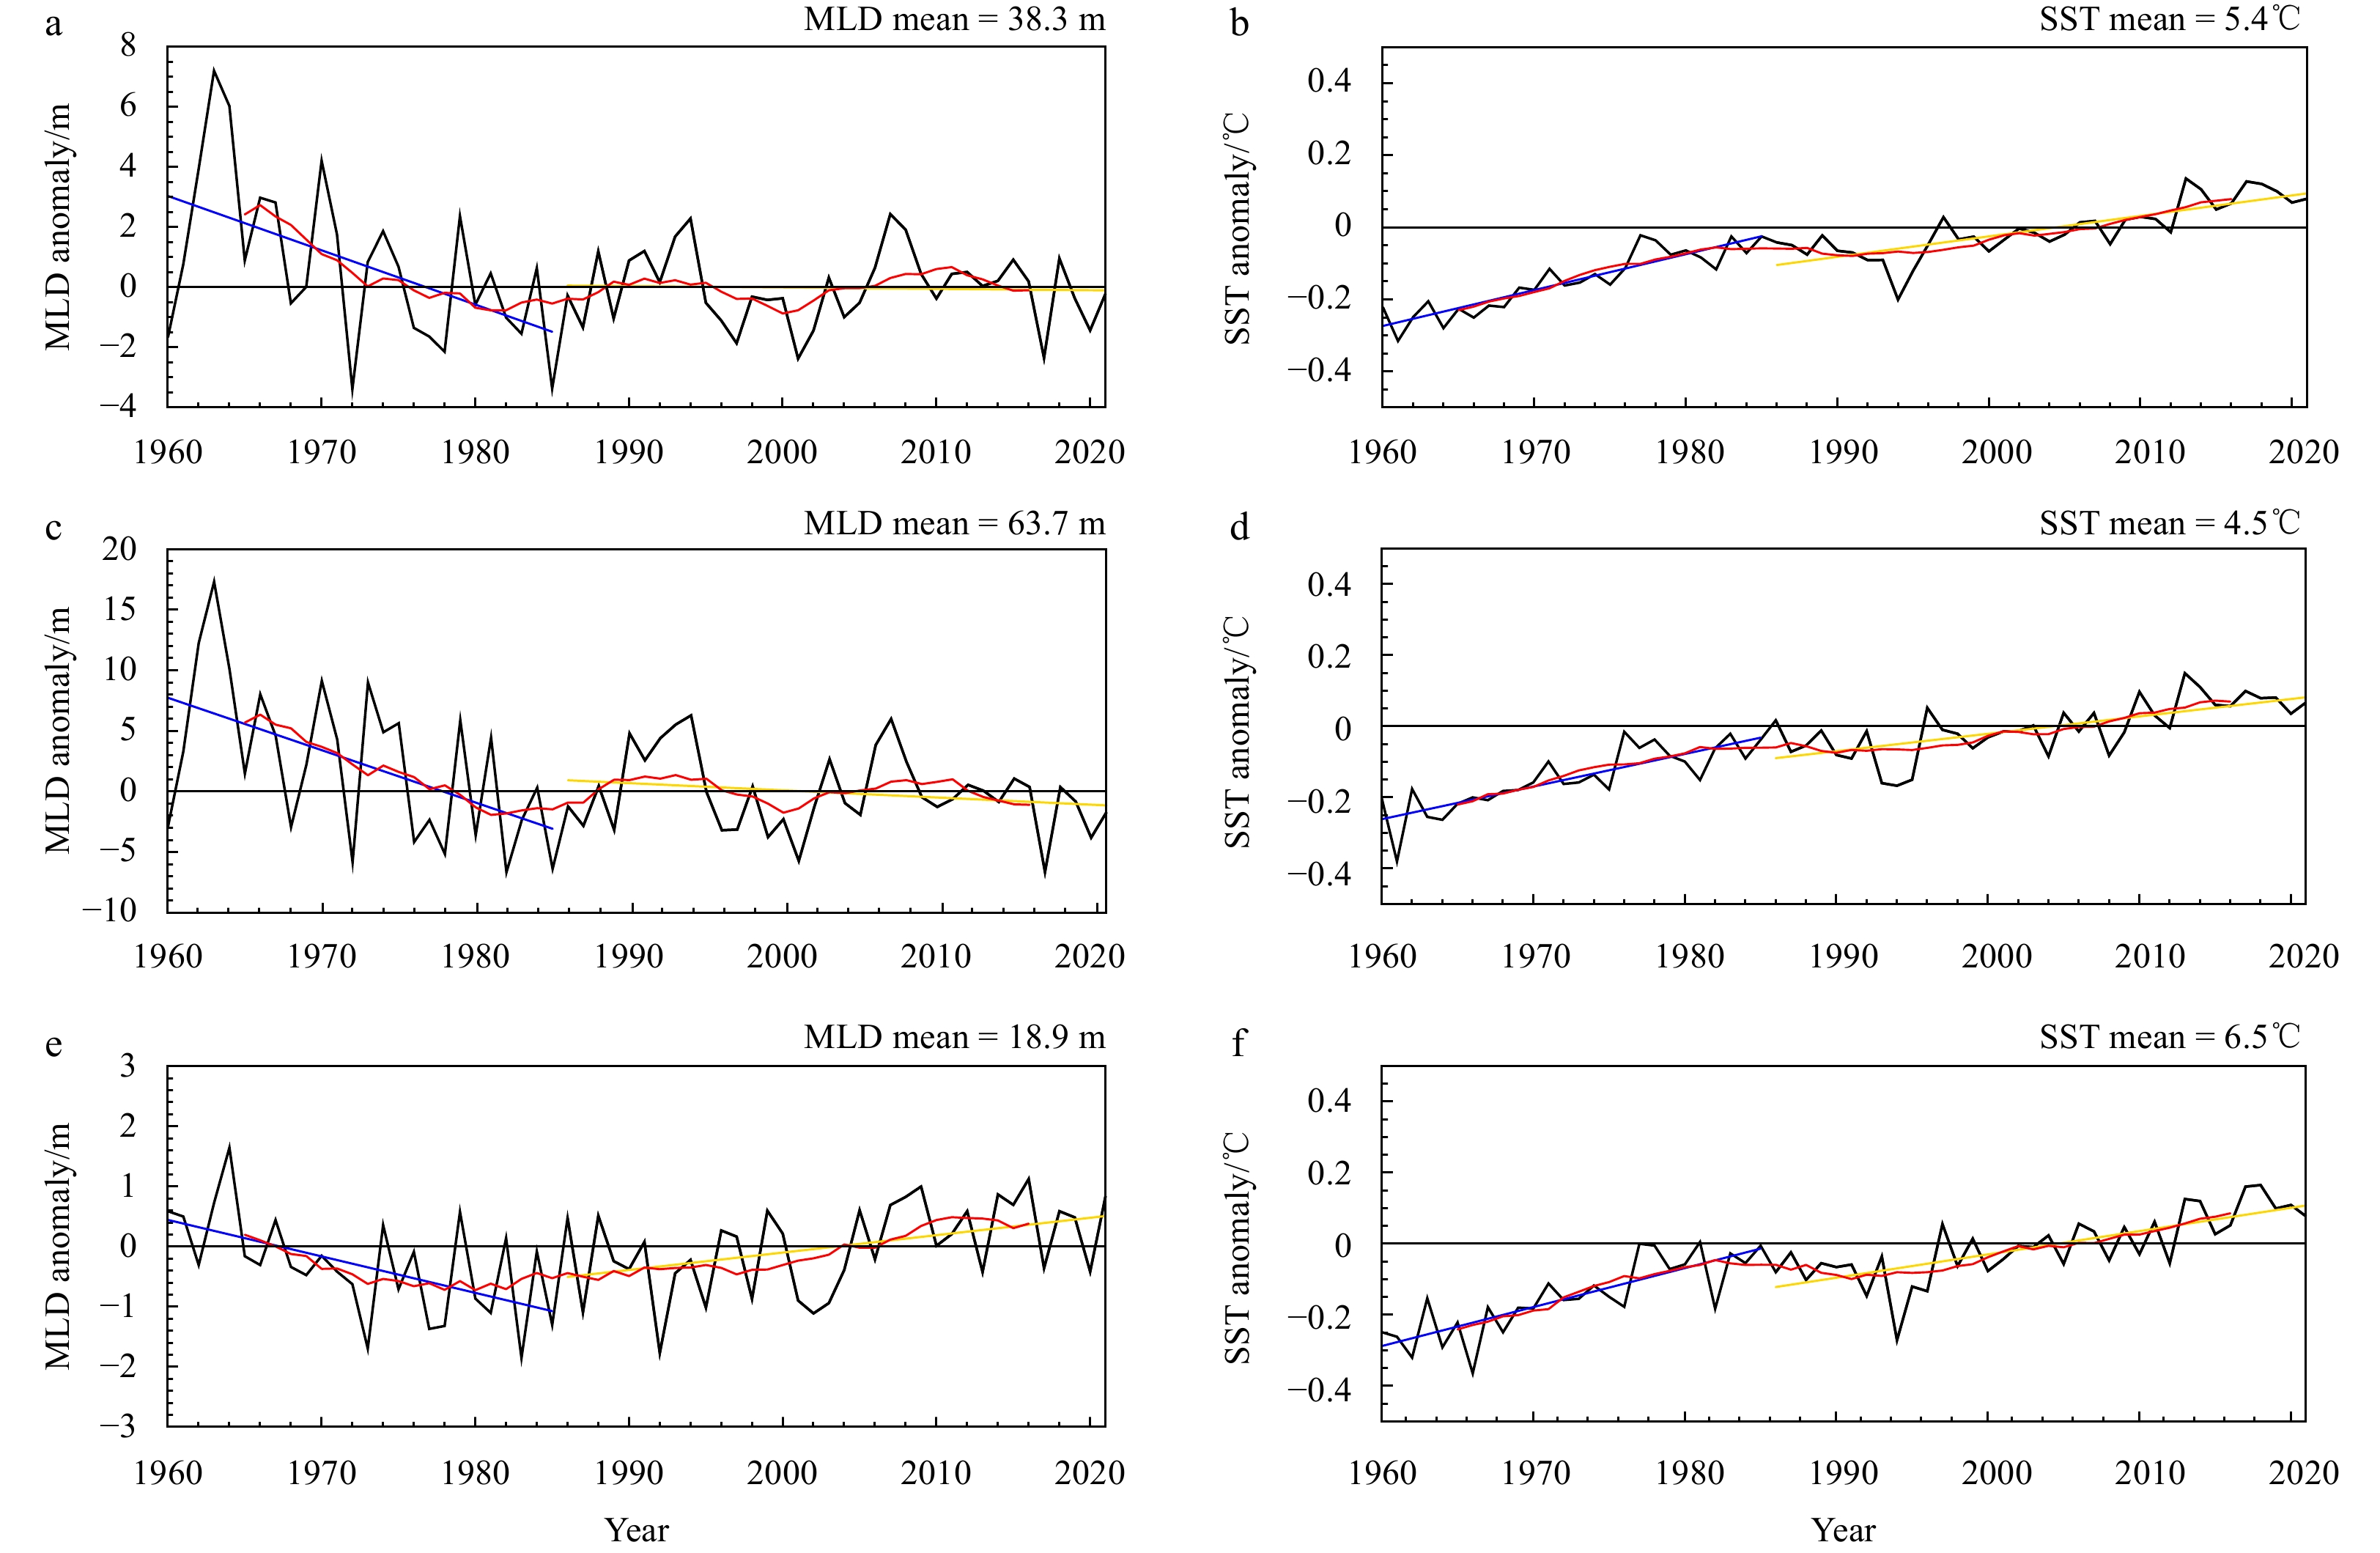
Figure 1. Annual mean MLD (unit: m) (a) and SST (unit: ℃) (b) anomaly time series in the ACC region (35°–65°S) for the period of 1960–2021 (taking 1991 to 2020 as the climatology). The blue and yellow lines are the linear trends for the periods of 1960–1985 and 1986–2021, and the red lines are the 11-year running mean of the corresponding black lines. The long-term mean (1960−2021) values are shown in the right up corners. (c, d) and (e, f) are the same as (a, b), but for austral winter (August−October) and summer (January−March) respectively.

Figure 2. Spatial patterns of the linear MLD trend (shaded areas) and the MLD long-term mean (black contours) for periods 1960–1985 (a) and 1986–2021 (b). c is the trend difference between a and b. d–f are the same as a–c, but for SST and its trends. g–i and j–l are the spatial patterns of MLD and SST in austral winter. The “ave” values are their respective trend mean. The dotted areas exceed the 95% confidence level.
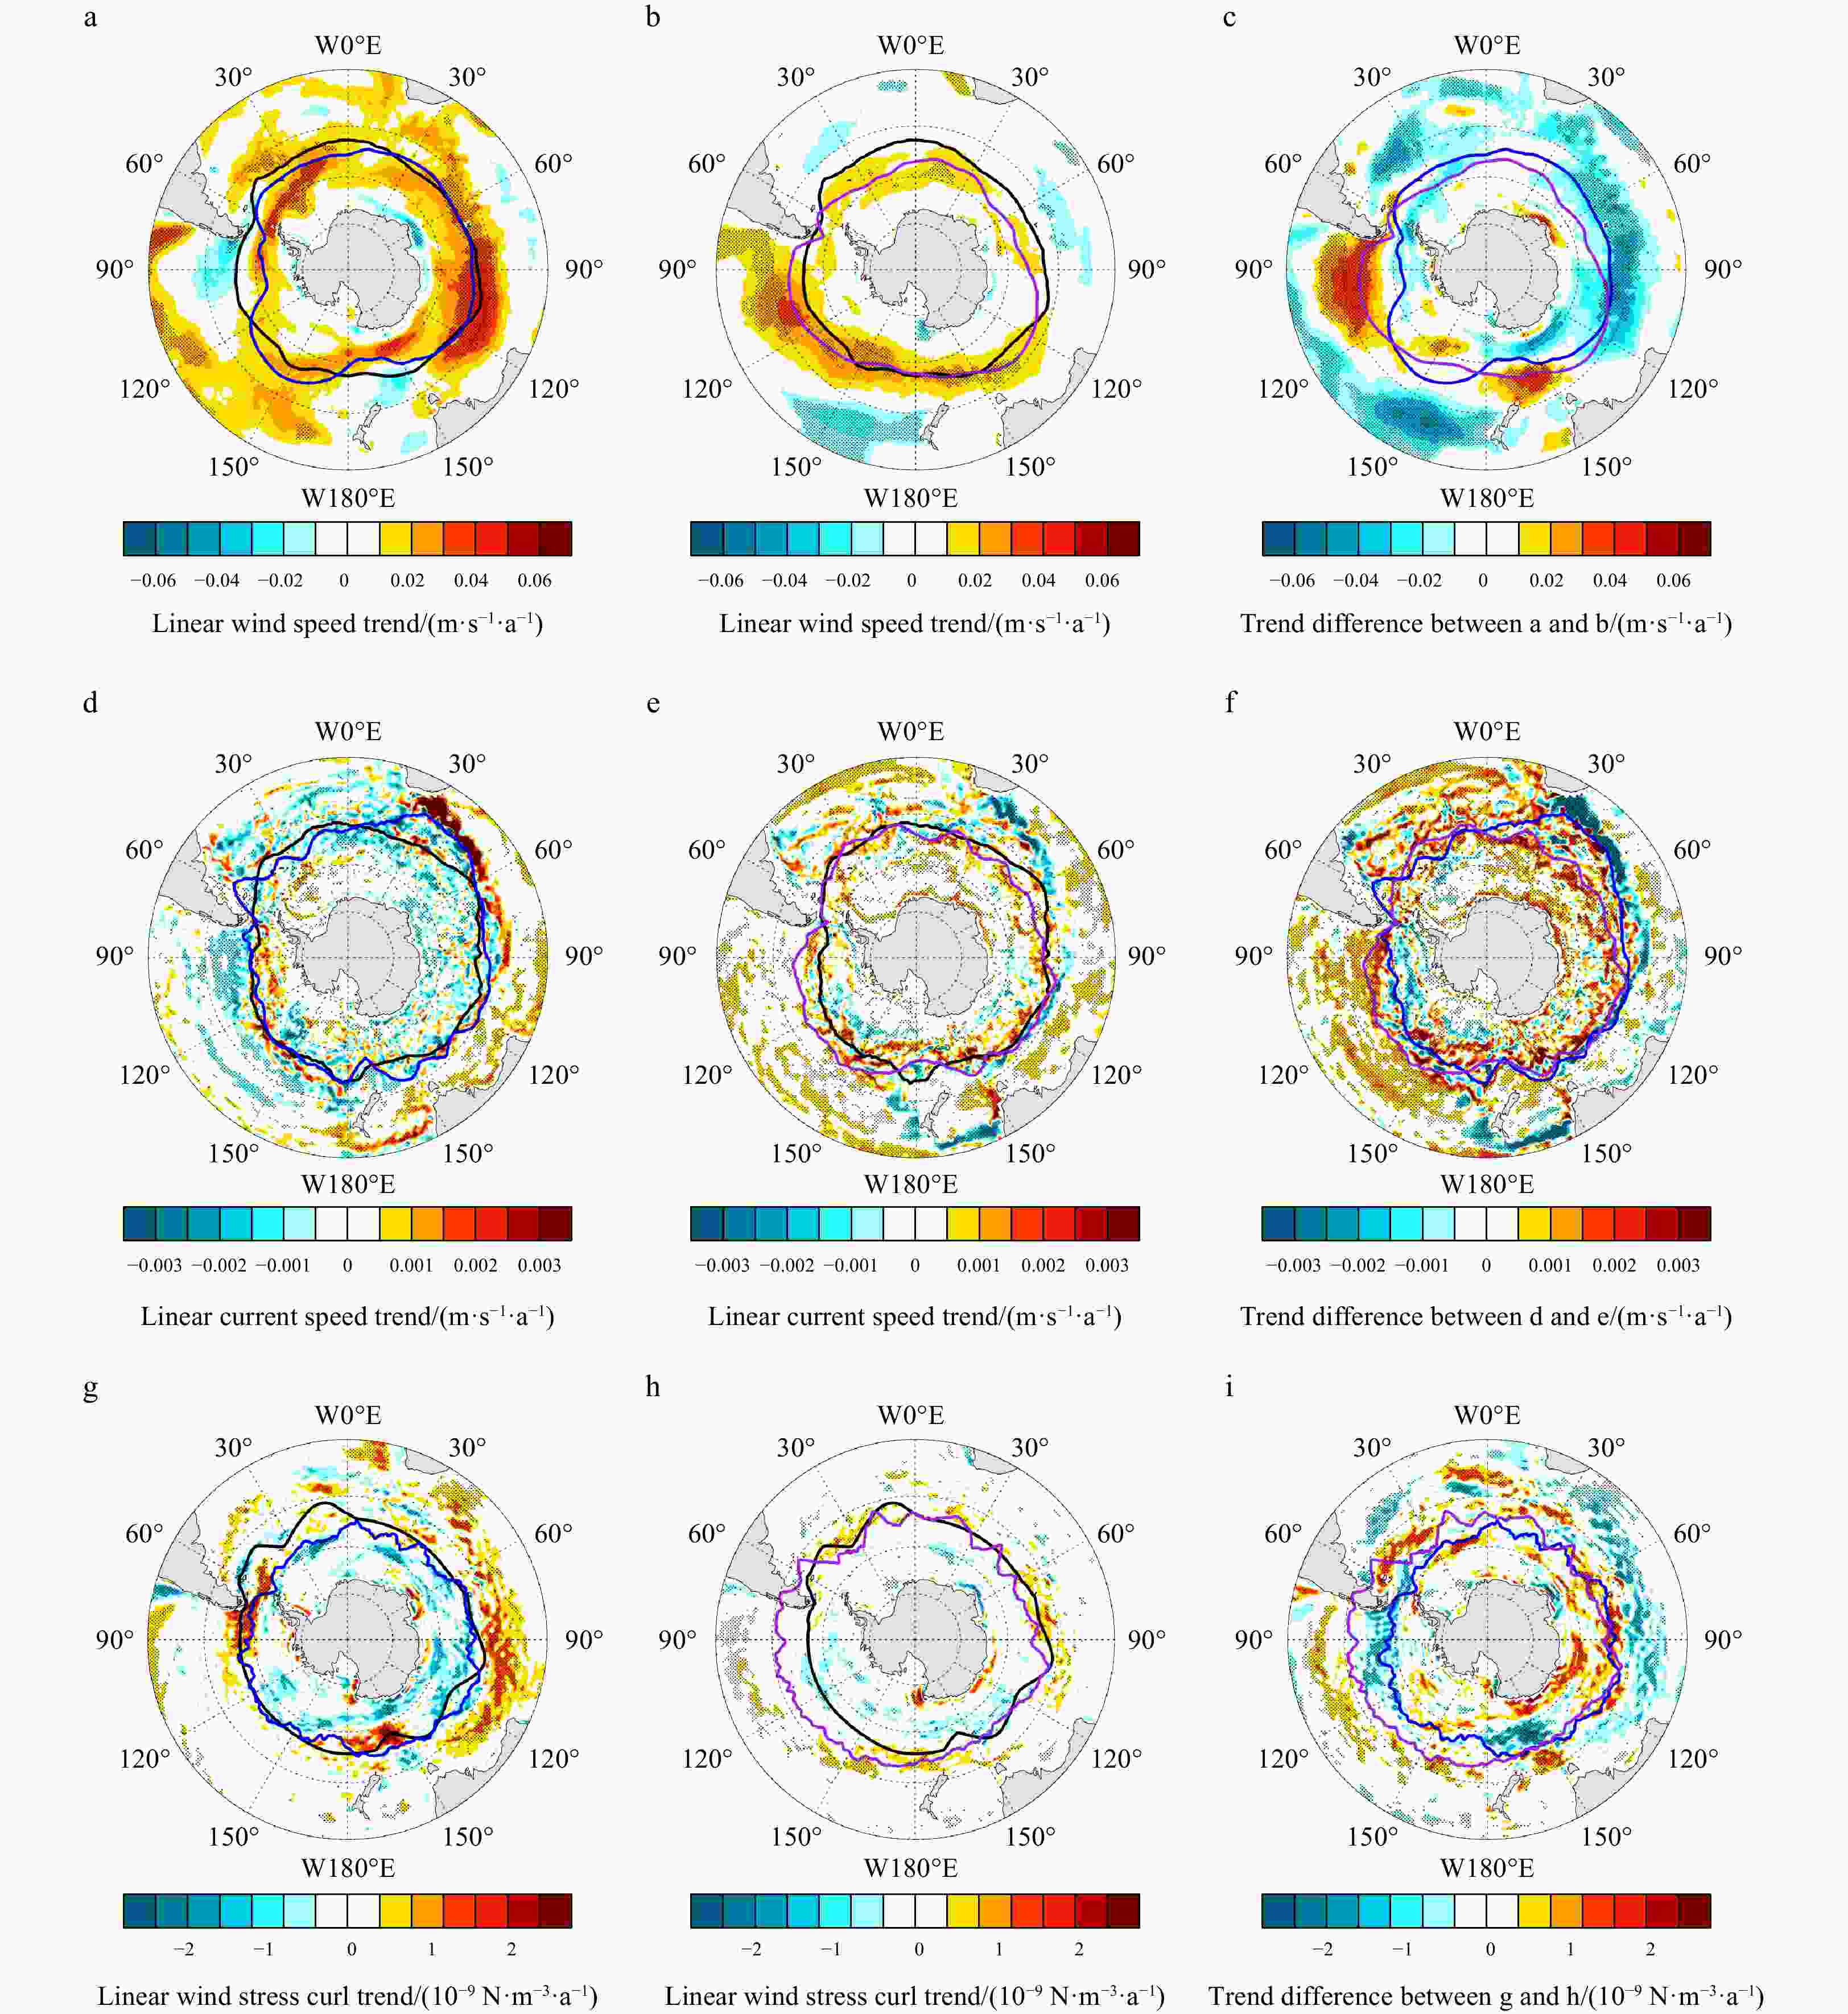
Figure 3. Spatial patterns of the linear wind speed trend in the ACC region for 1960−1985 (a) and 1986−2021 (b). c is the difference between a and b. d–f and g–i are the same as a–c but for surface ocean current speed and wind stress curl. The black contours in a and b are the climatic core position of the ACC (1991−2020). The blue and purple contours in a–c are the trends circumpolar contours for period 1960–1985 (a) and 1986–2021 (b). The contours in d–f and g–i are the same as a–c but for ocean current and wind stress vorticity.
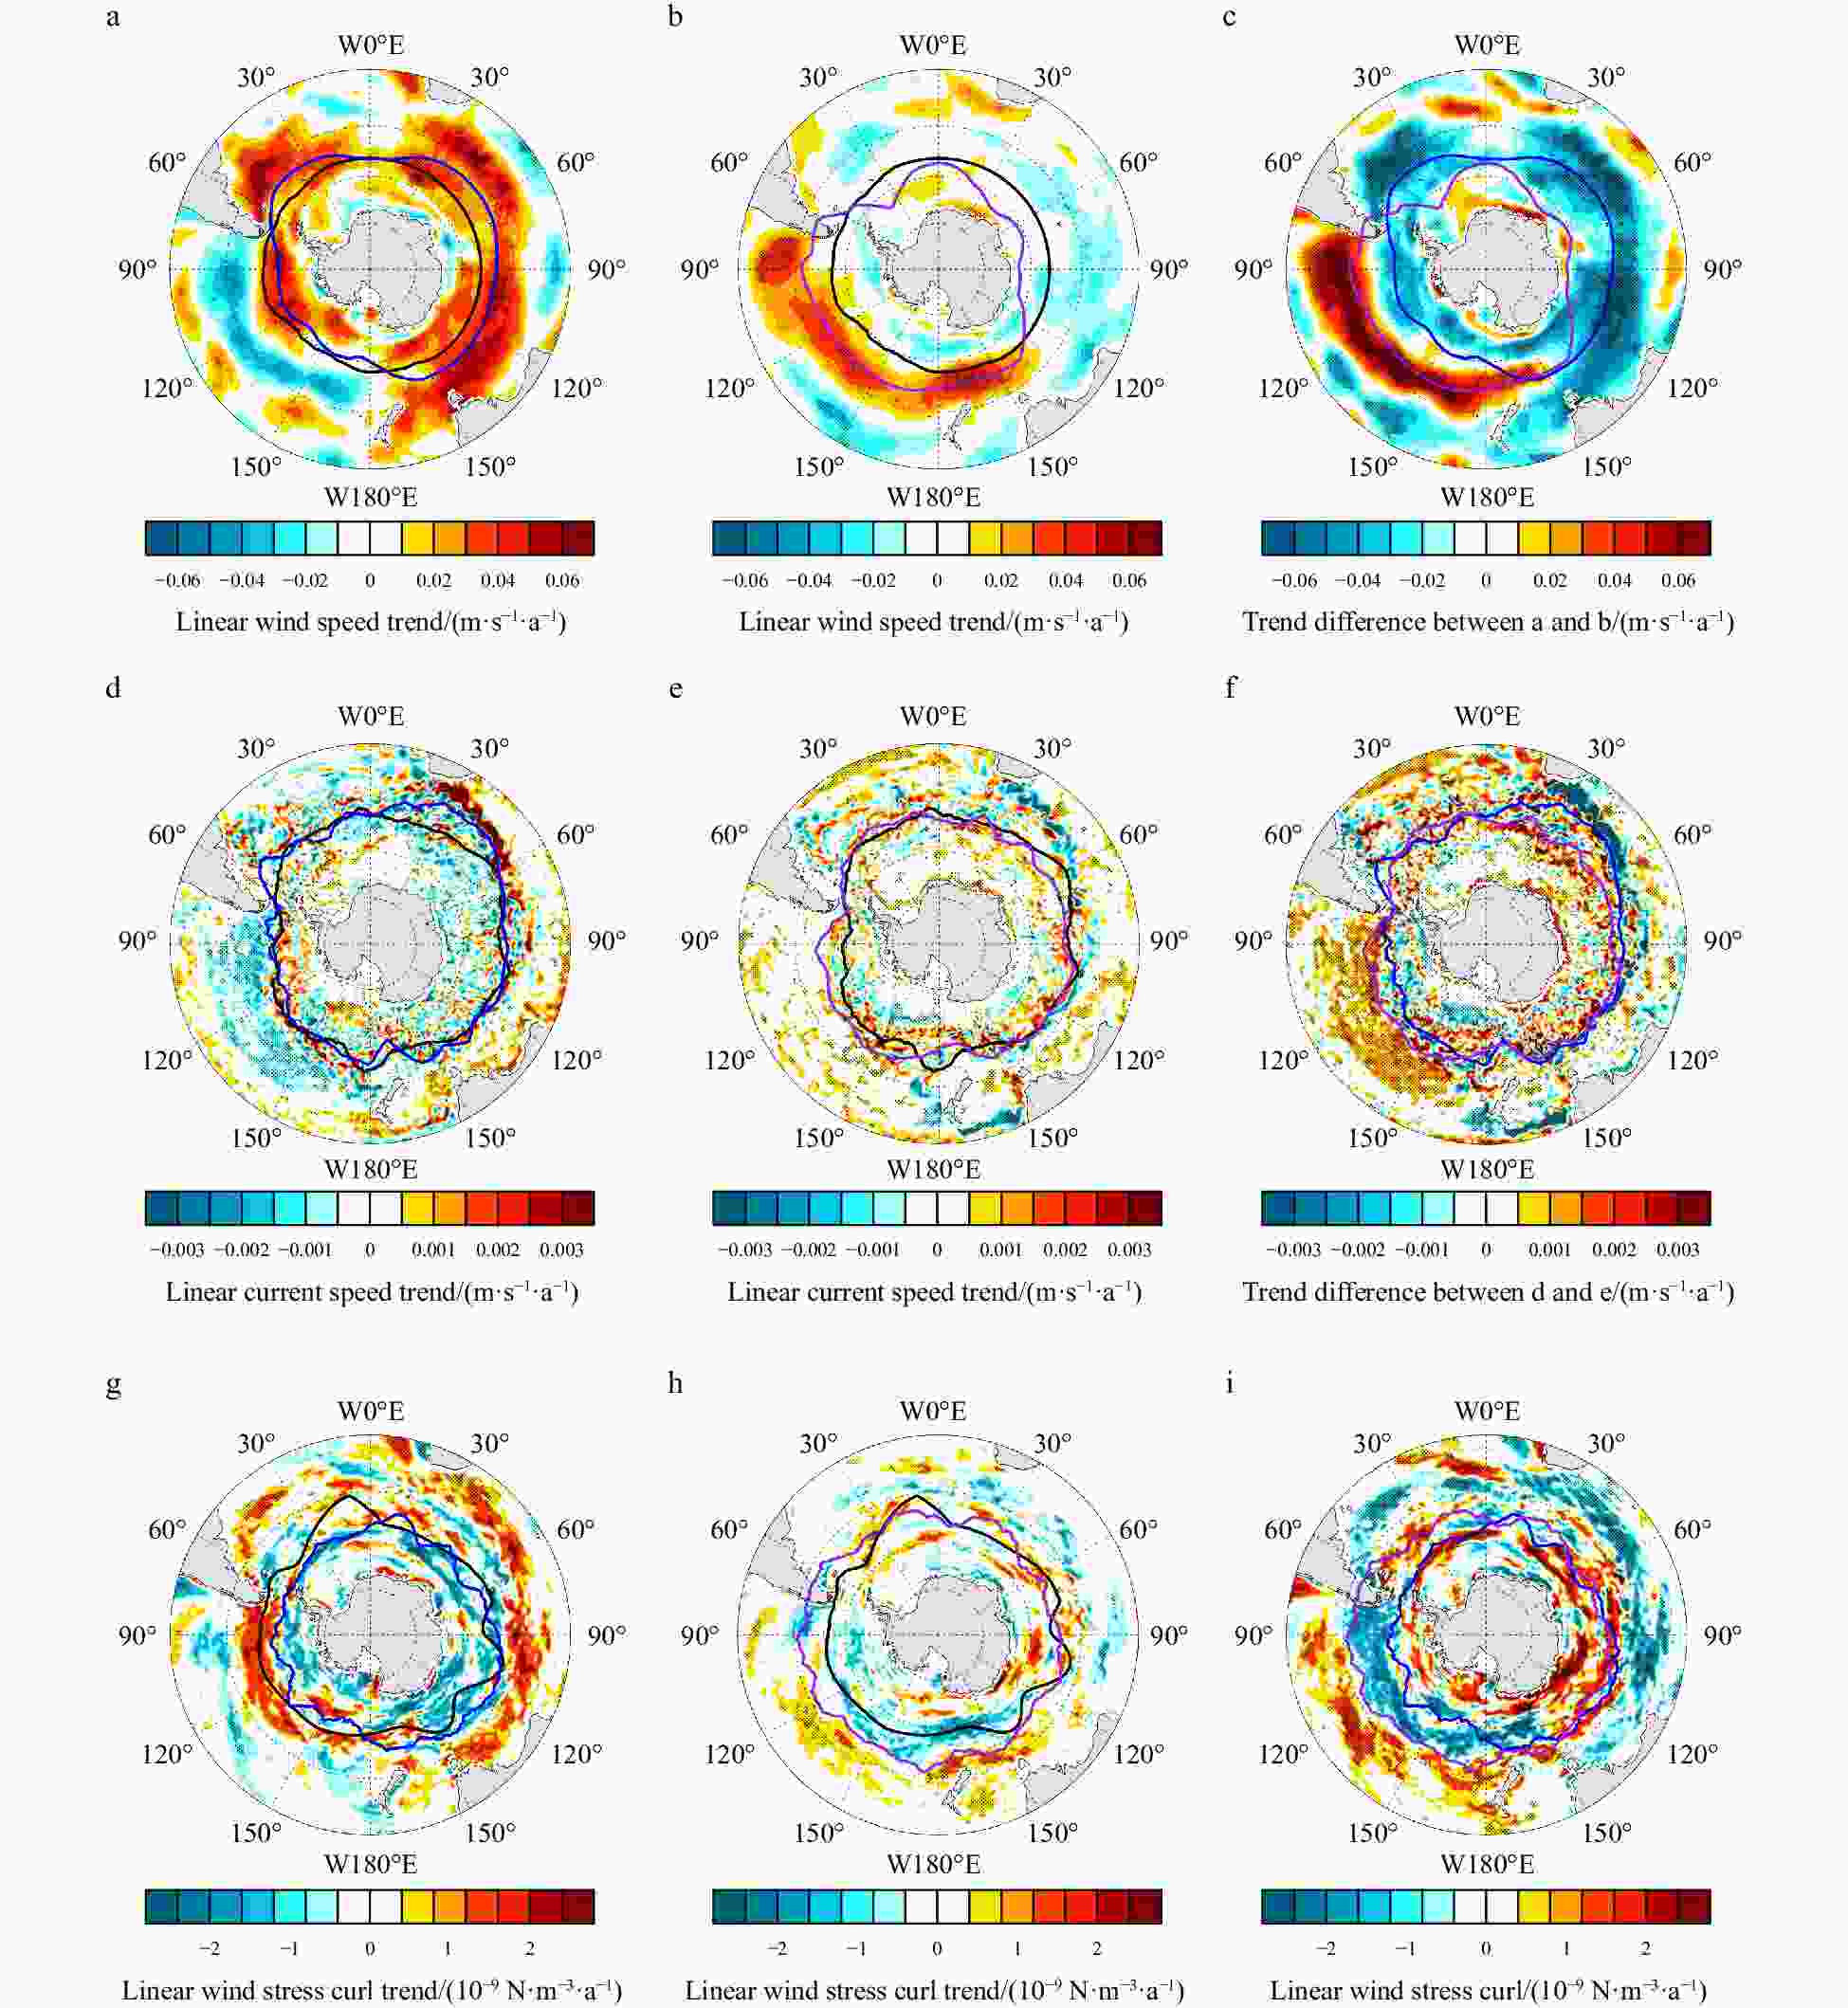
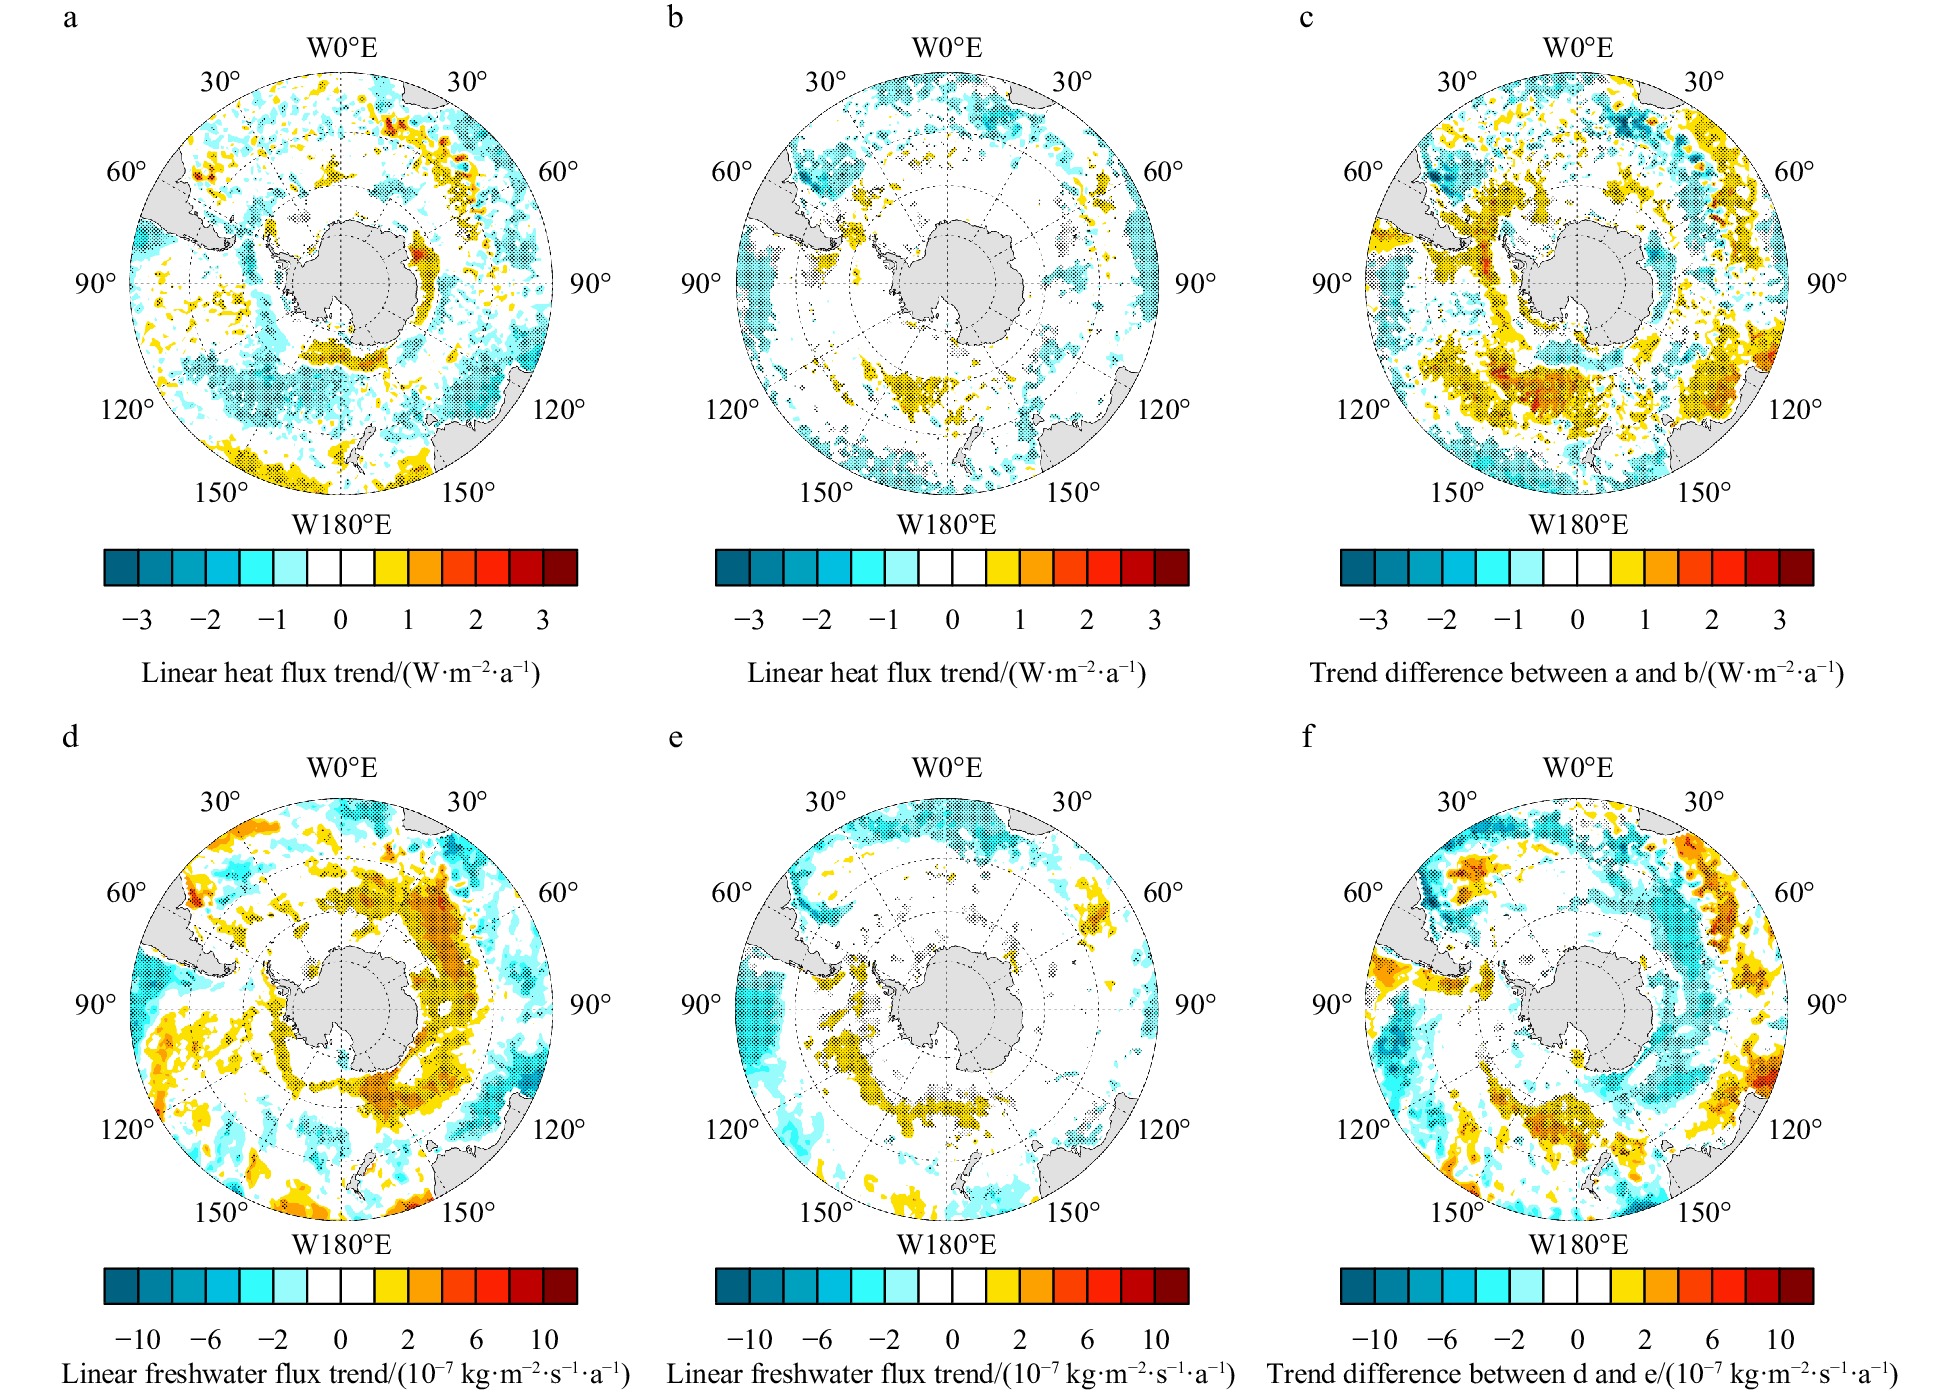
Figure 4. Spatial patterns of the linear wind speed trend in the ACC region for austral winter in 1960−1985 (a) and 1986−2021 (b). c is the difference between a and b. d–f and g–i are the same as a–c but for surface ocean current speed and wind stress curl. The black contours in a and b are the climatic core position of the ACC (1991−2020). The blue and purple contours in a, b and c are the trends circumpolar contours for austral winter in 1960–1985 (a) and 1986–2021 (b). The contours in d–f and g–i are the same as a–c but for ocean current and wind stress vorticity.
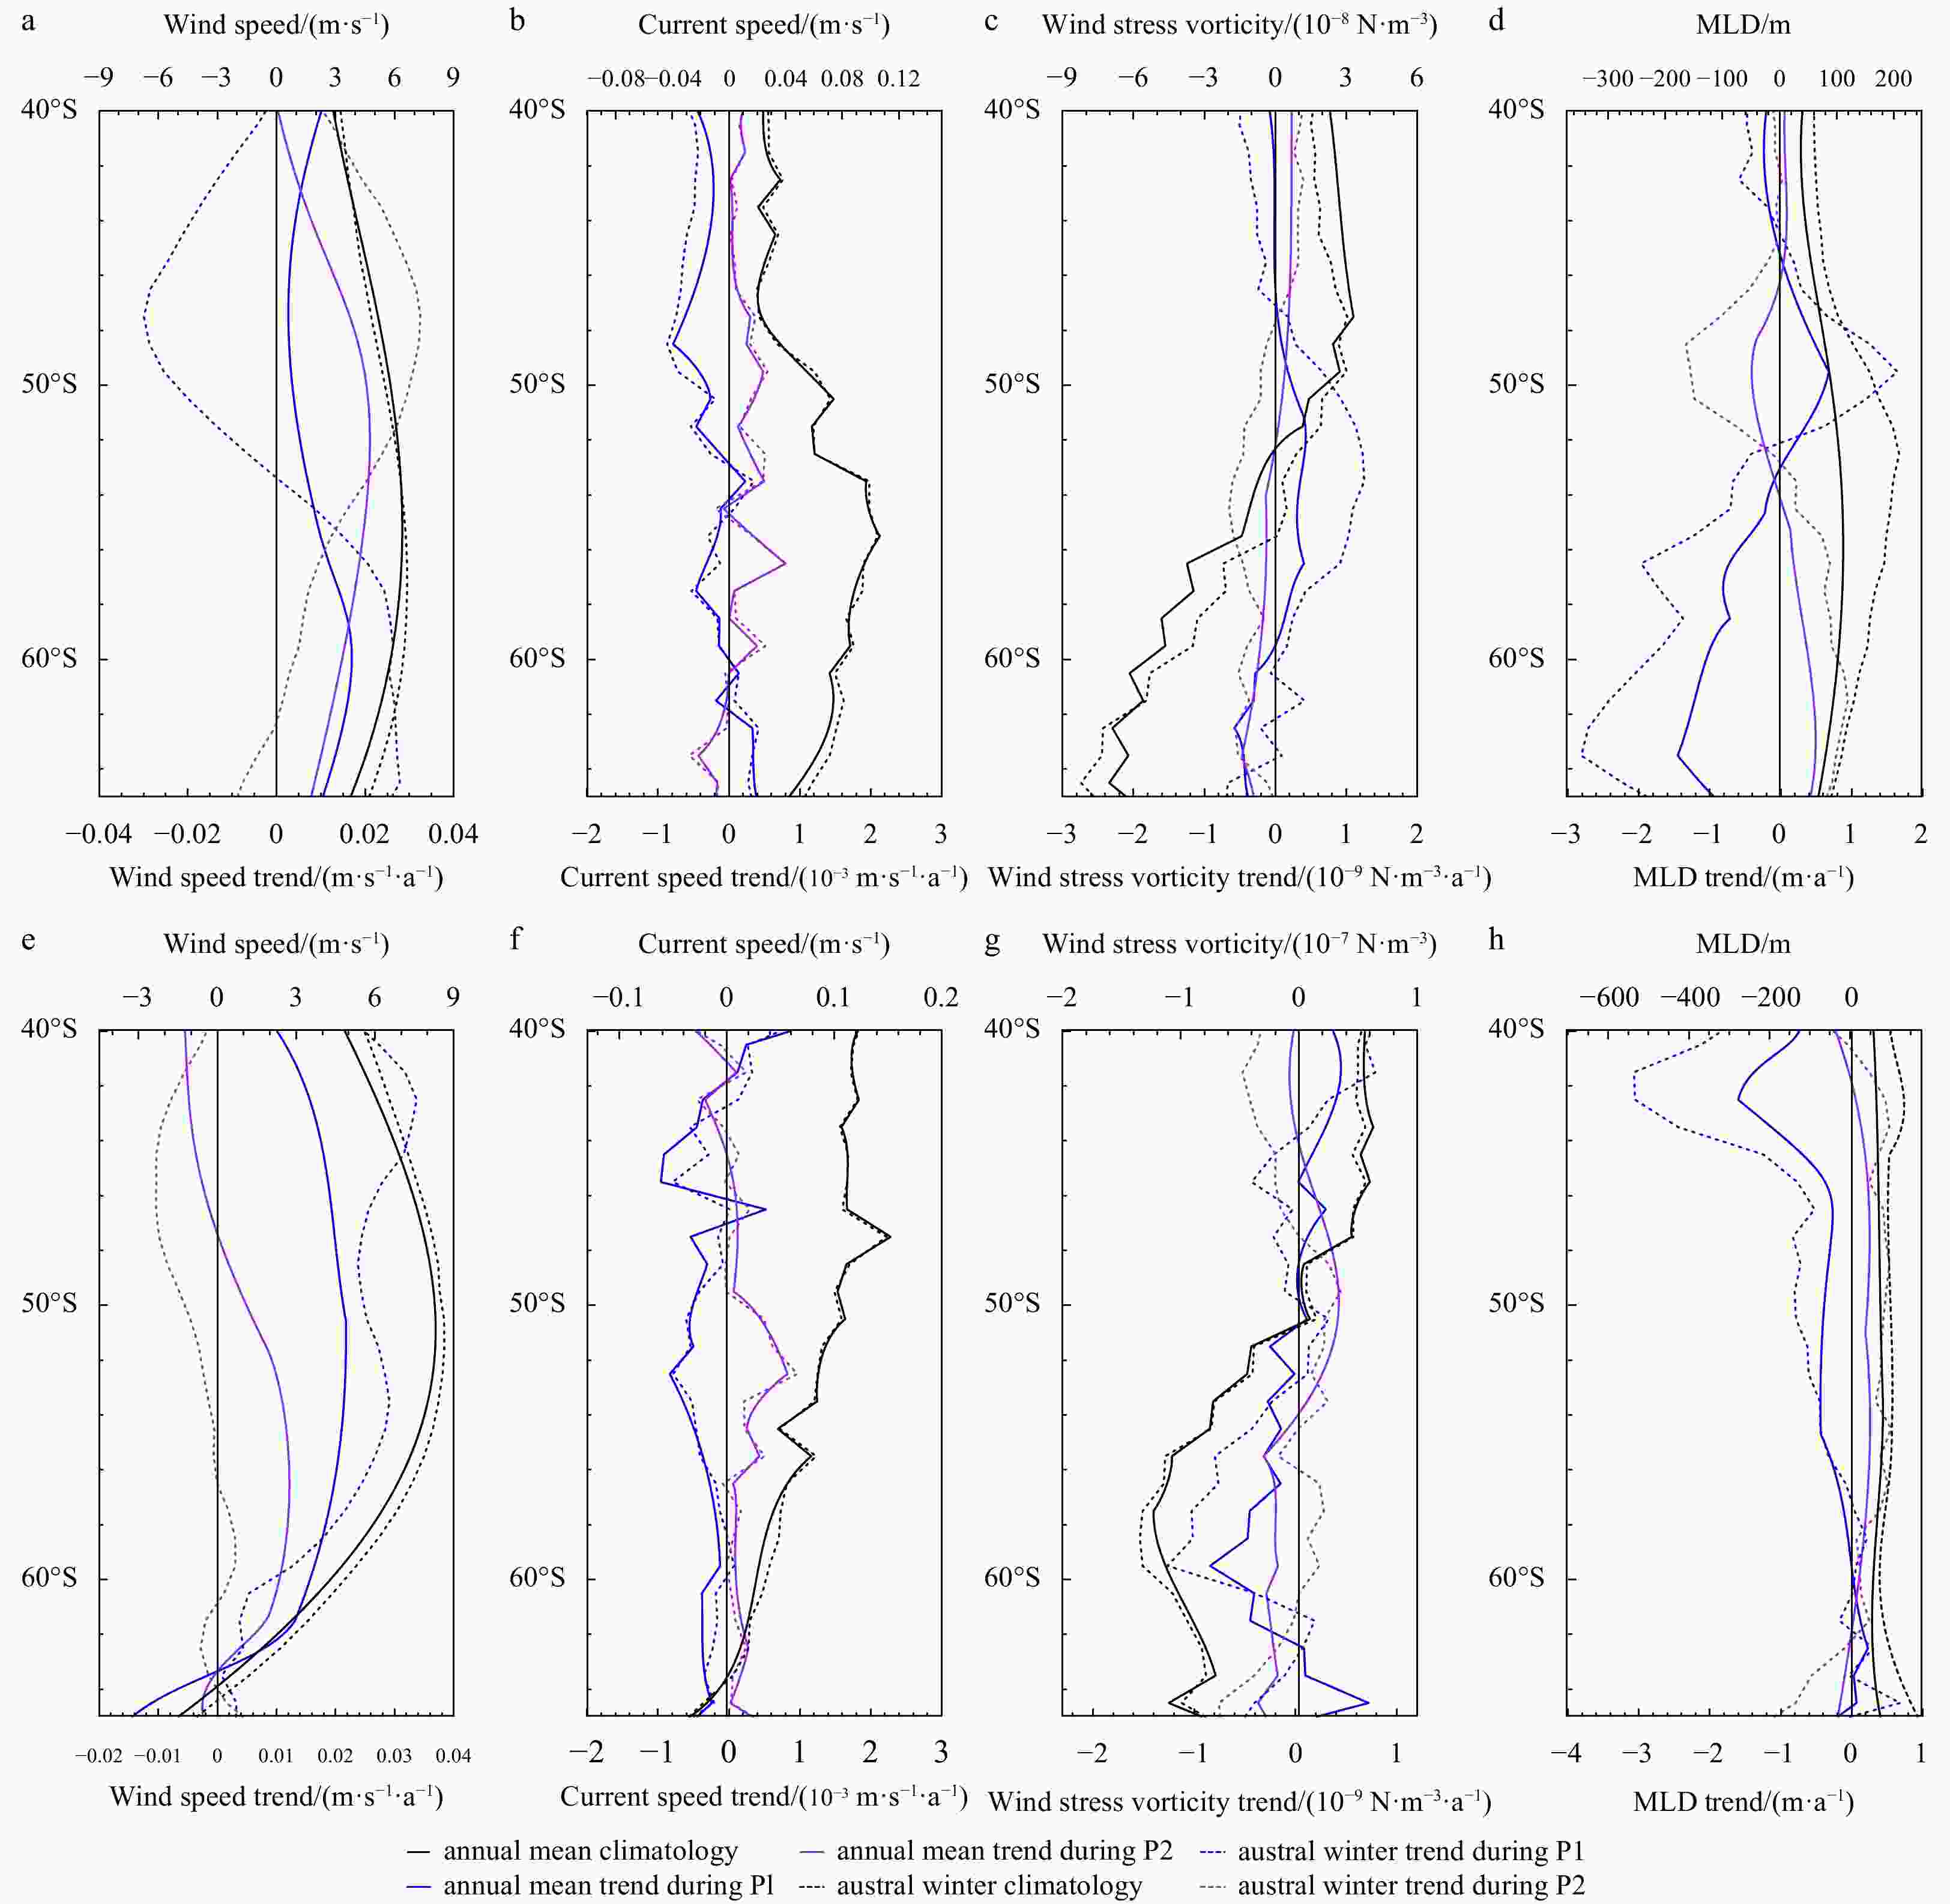
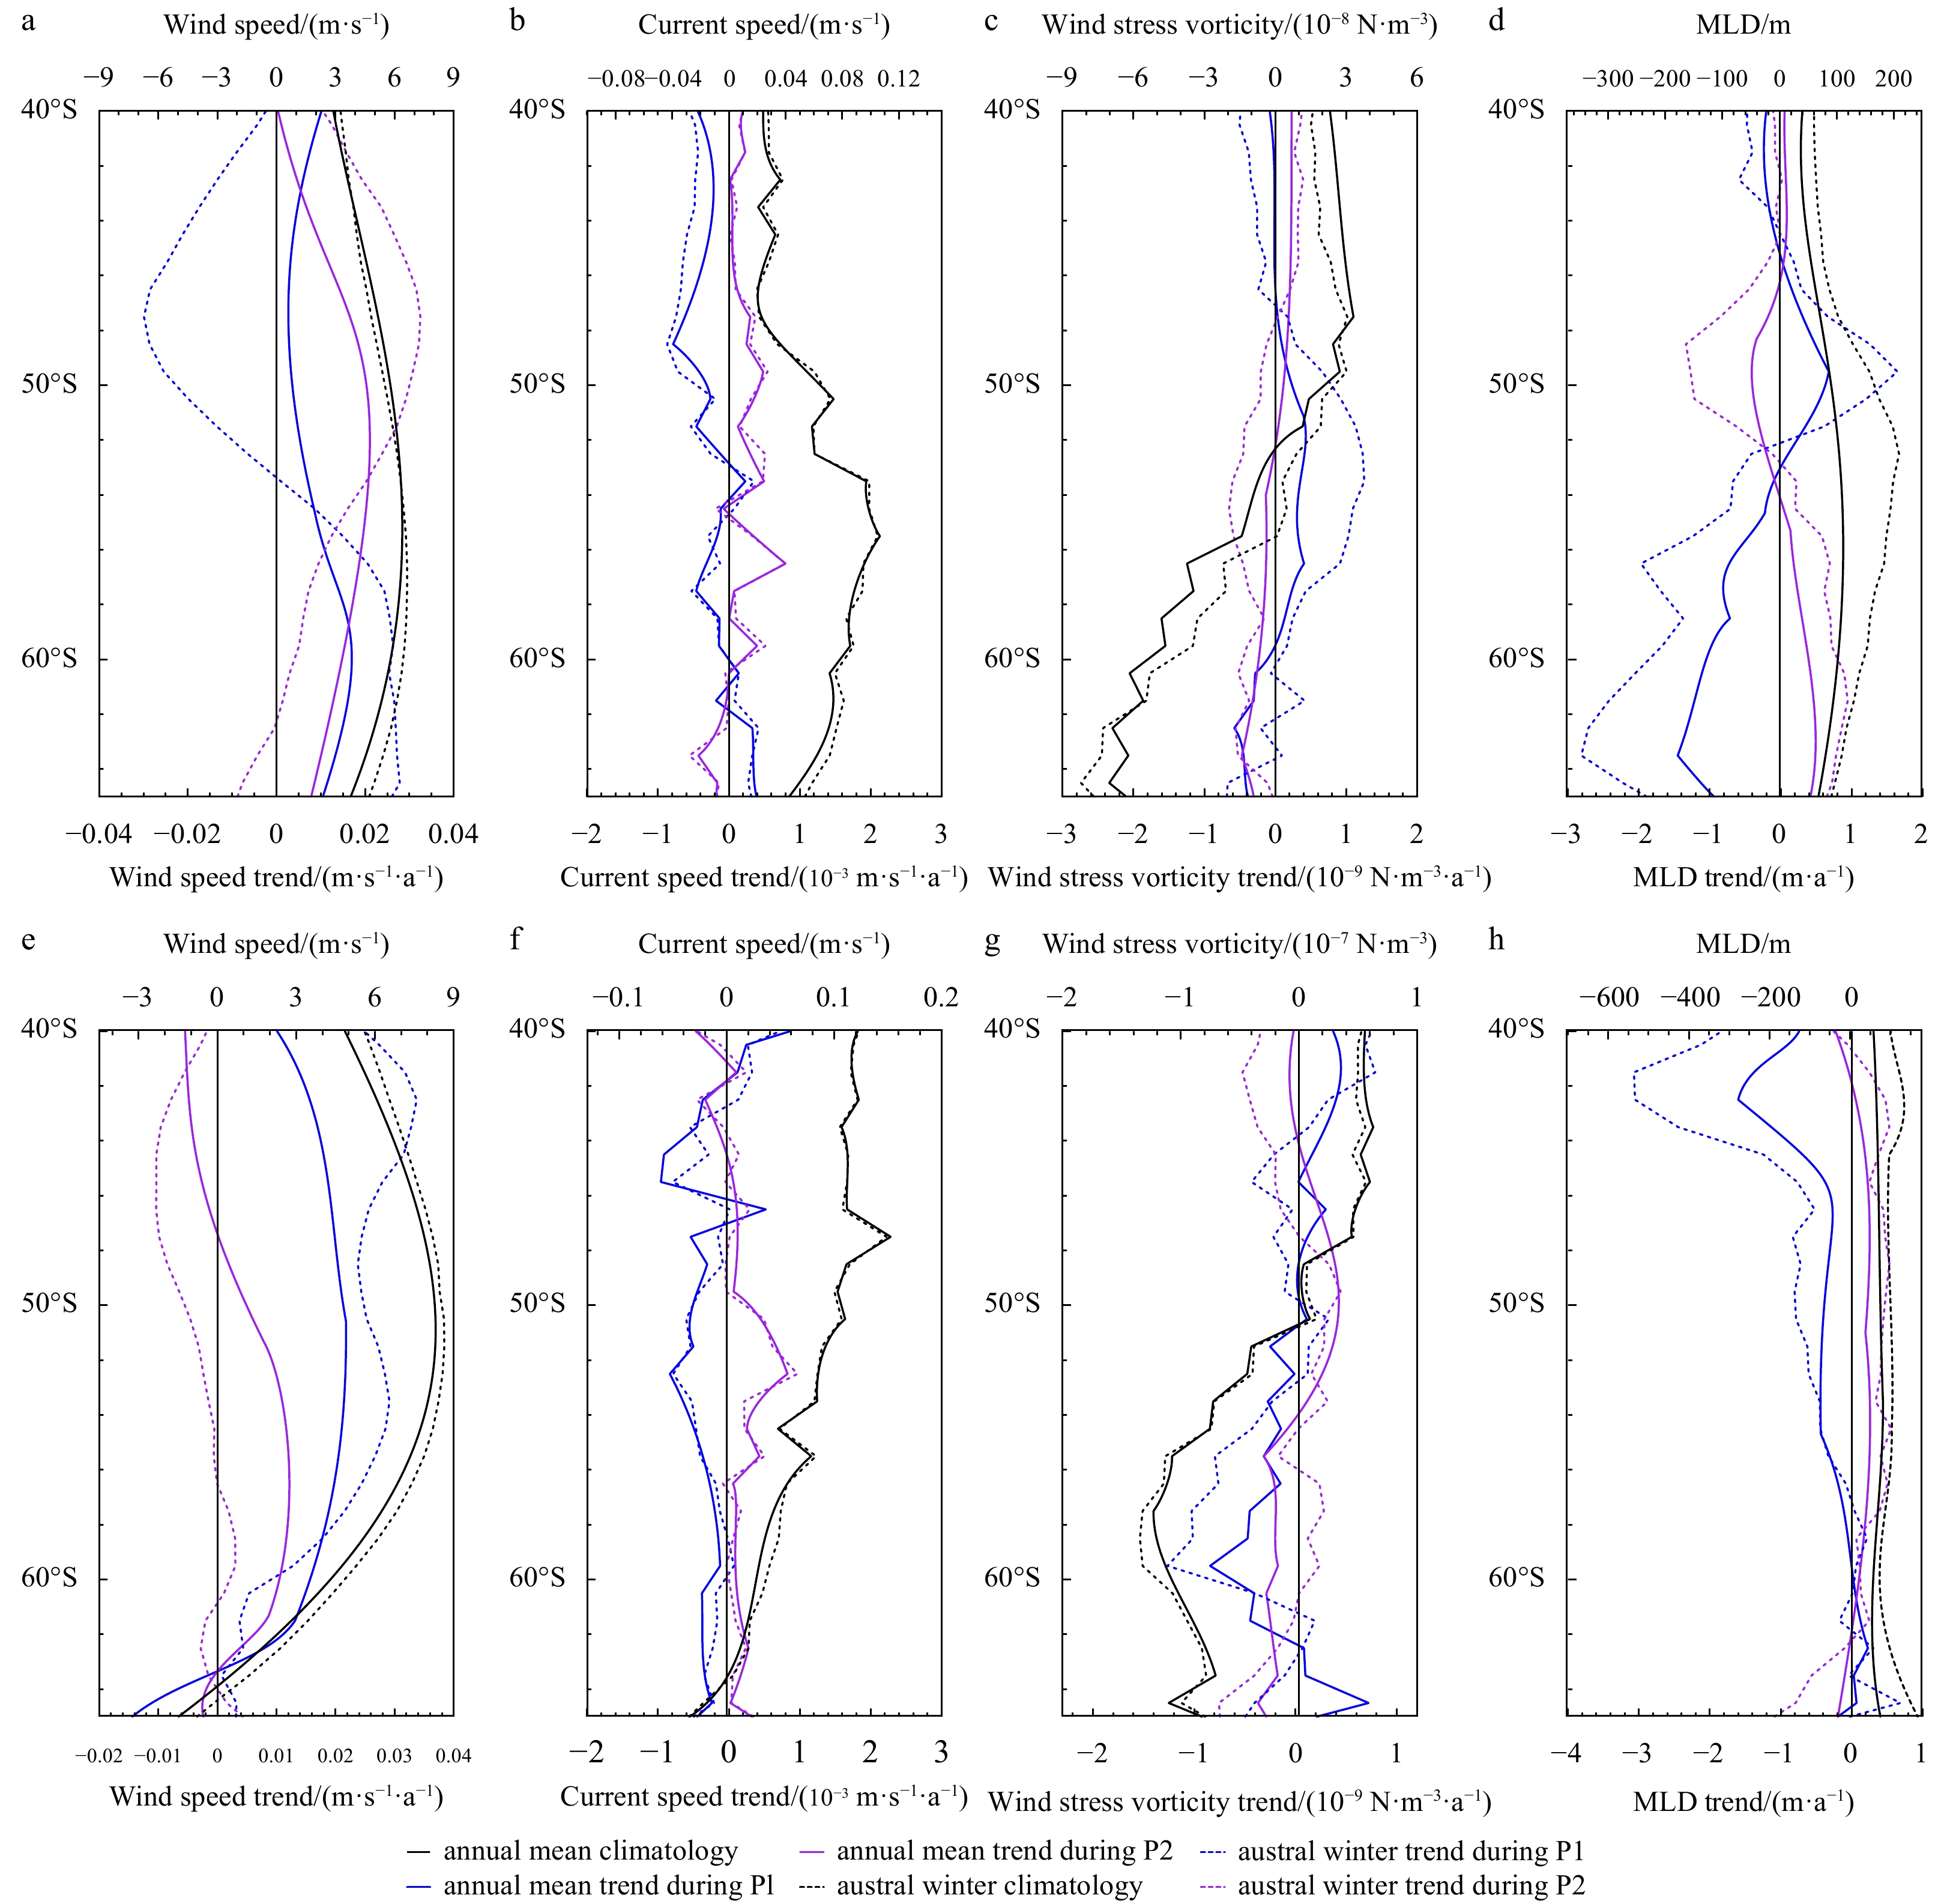
Figure 5. The annual mean (solid lines) and winter (dashed lines) zonal averaged profiles for climatology (black lines) and trends (blue and purple lines) of surface wind speed (a), ocean current speed (b), wind stress vorticity (c) and MLD (d) from 40°S to 65°S in the SP sector (70°W–180°). e, f, g and h are the same as a, b, c and d but for the SI sector (0°–90°E). The climatological values are based on the period of 1991–2020. The blue and purple lines are the corresponding zonal mean trends in the periods 1960–1985 (P1 in the legend) and 1986–2021 (P2 in the legend), respectively.
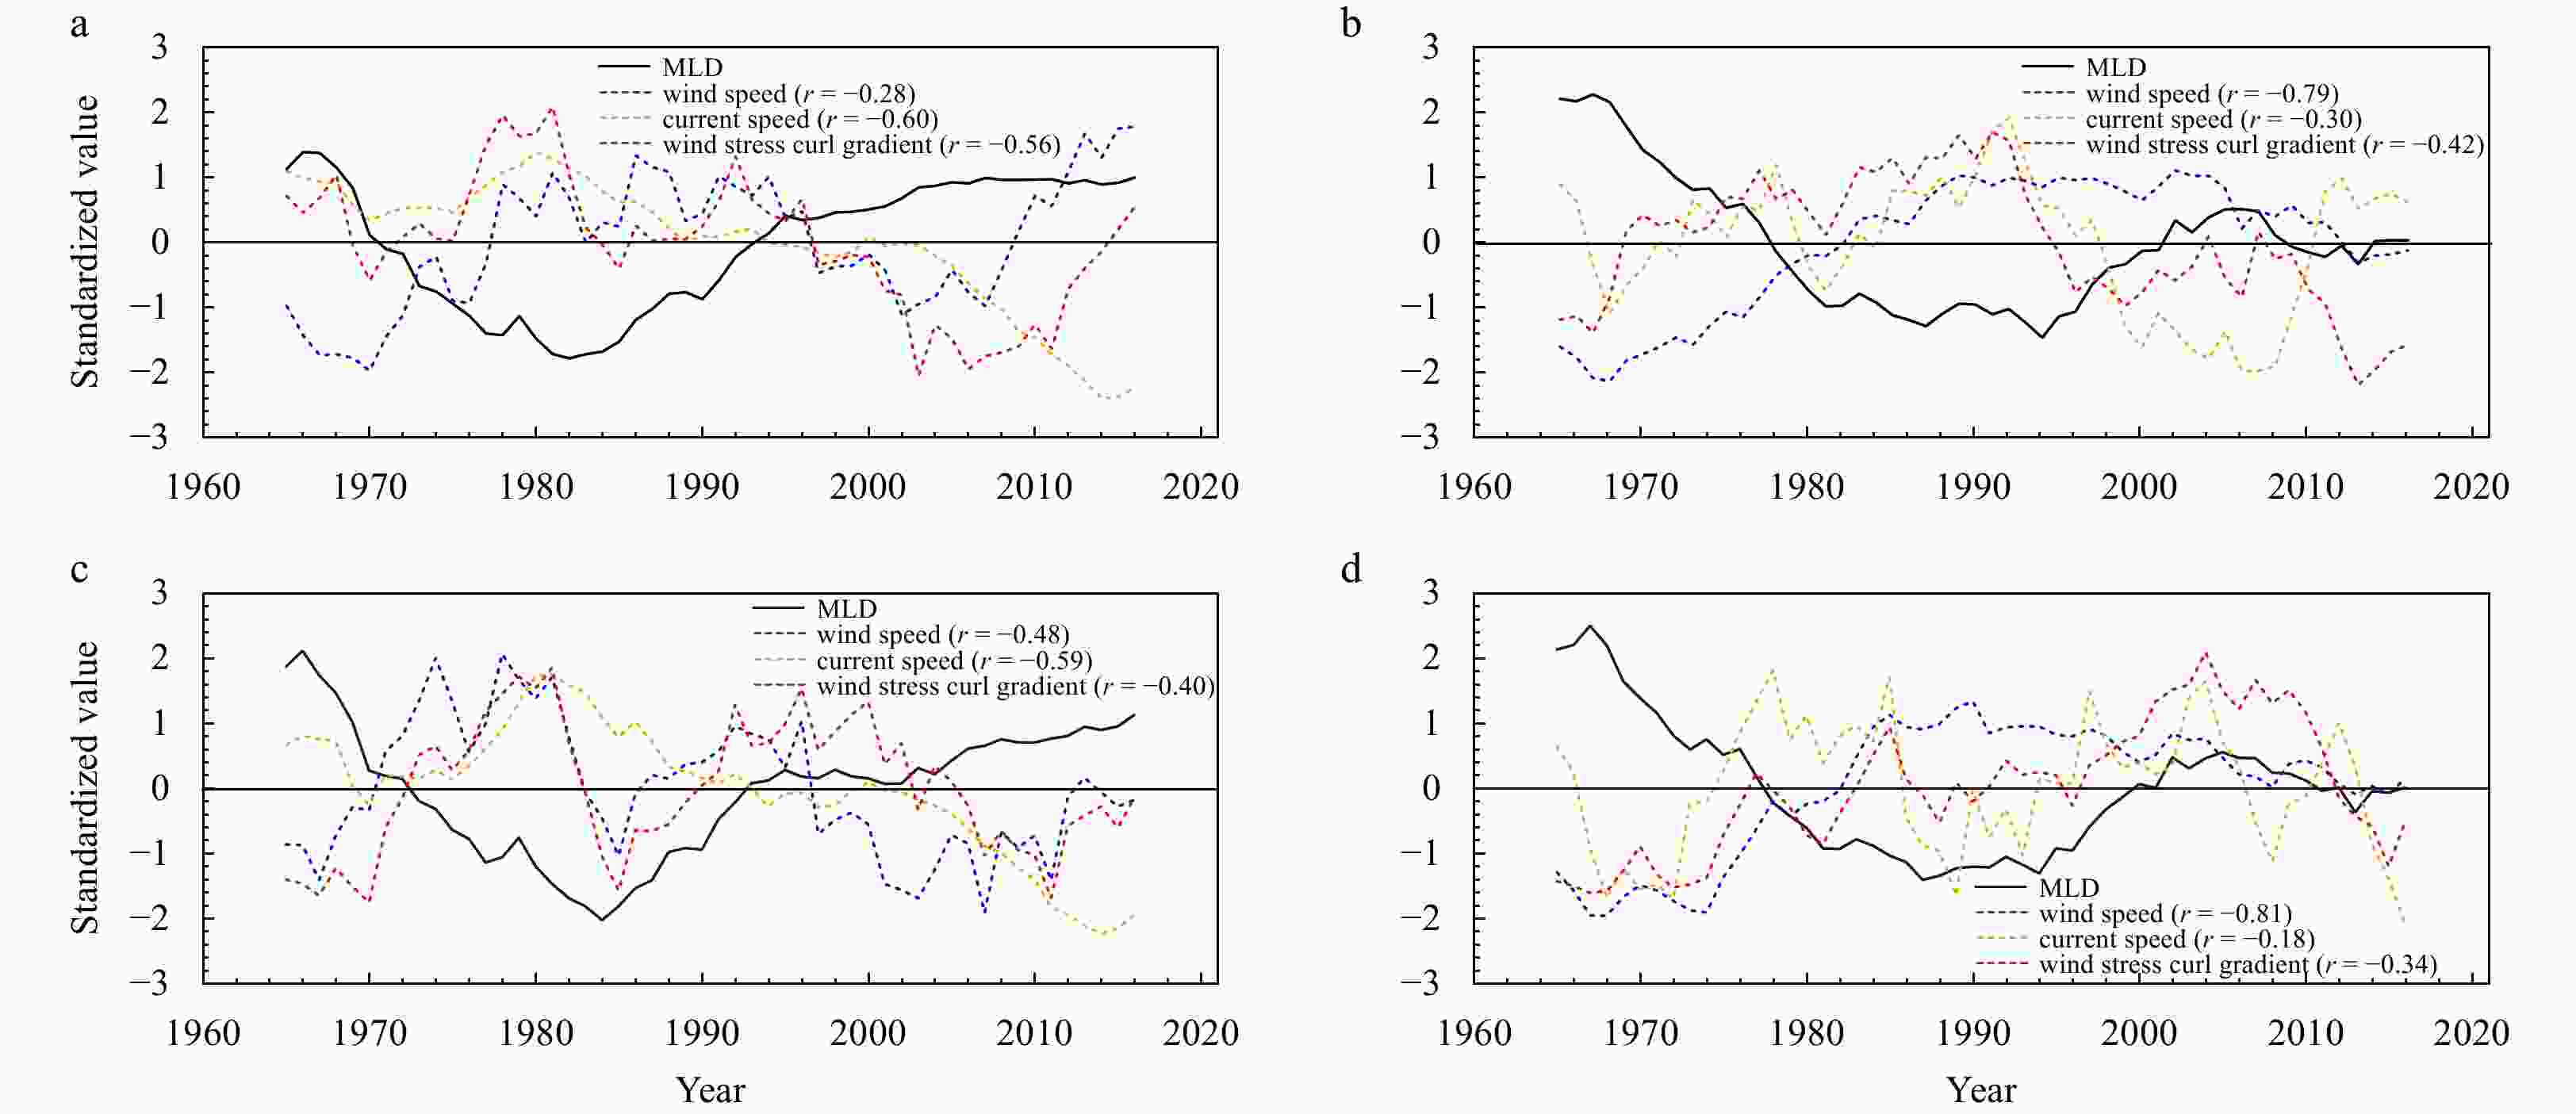
Figure 6. The annual mean and winter standardized time series of MLD (black solid line), wind speed (blue dashed line), ocean current speed (orange dashed line) and wind stress curl meridional gradient (red dashed line) in K1 (60°−68°S, 76°−150°W) (a) and K2 (40°−50°S, 50°−90°E) (b) regions. The correlations between MLD and the corresponding variables are given in the following brackets. c and d are the same as a and b, but for winter mean.
-
An Yuzhu, Zhang Ren, Wang Huizan, et al. 2012. Study on calculation and spatio-temporal variations of global ocean mixed layer depth. Chinese Journal of Geophysics (in Chinese), 55(7): 2249–2258 Barkan R, Winters K B, McWilliams J C. 2017. Stimulated imbalance and the enhancement of eddy kinetic energy dissipation by internal waves. Journal of Physical Oceanography, 47(1): 181–198, doi: 10.1175/JPO-D-16-0117.1 Böning C W, Dispert A, Visbeck M, et al. 2008. The response of the Antarctic Circumpolar Current to recent climate change. Nature Geoscience, 1(12): 864–869, doi: 10.1038/ngeo362 Buckingham C E, Lucas N S, Belcher S E, et al. 2019. The contribution of surface and submesoscale processes to turbulence in the open ocean surface boundary layer. Journal of Advances in Modeling Earth Systems, 11(12): 4066–4094, doi: 10.1029/2019MS001801 Cheng Lijing, Trenberth K, Fasullo J, et al. 2017. Improved estimates of ocean heat content from 1960 to 2015. Science Advances, 3(3): e1601545, doi: 10.1126/sciadv.1601545 de Boyer Montégut C, Gurvan M, Fischer A S, et al. 2004. Mixed layer depth over the global ocean: an examination of profile data and a profile-based climatology. Journal of Geophysical Research: Oceans, 109(C12): C12003, doi: 10.1029/2004JC002378 Deser C, Alexander M A, Timlin M S. 1996. Upper-ocean thermal variations in the North Pacific during 1970−1991. Journal of Climate, 9(8): 1840–1855, doi: 10.1175/1520-0442(1996)009<1840:UOTVIT>2.0.CO;2 Downes S M, Bindoff N L, Rintoul S R. 2009. Impacts of climate change on the subduction of mode and intermediate water masses in the Southern Ocean. Journal of Climate, 22(12): 3289–3302, doi: 10.1175/2008JCLI2653.1 Downes S M, Bindoff N L, Rintoul S R. 2010. Changes in the subduction of Southern Ocean water masses at the end of the Twenty-First century in eight IPCC models. Journal of Climate, 23(24): 6526–6541, doi: 10.1175/2010JCLI3620.1 Feng Licheng, Zhang Ronghua, Yu Bo, et al. 2020. Roles of wind stress and subsurface cold water in the second-year cooling of the 2017/18 La Niña event. Advances in Atmospheric Sciences, 37(8): 847–860, doi: 10.1007/s00376-020-0028-4 Ferrari R, Nikurashin M. 2010. Suppression of eddy diffusivity across jets in the Southern Ocean. Journal of Physical Oceanography, 40(7): 1501–1519, doi: 10.1175/2010JPO4278.1 Giunta V, Ward B. 2022. Ocean mixed layer depth from dissipation. Journal of Geophysical Research: Oceans, 127(4): e2021JC017904, doi: 10.1029/2021JC017904 Hersbach H, Bell B, Berrisford P, et al. 2020. The ERA5 global reanalysis. Quarterly Journal of the Royal Meteorological Society, 146(730): 1999–2049, doi: 10.1002/qj.3803 Huang Chuanjiang, Qiao Fangli, Dai Dejun. 2014. Evaluating CMIP5 simulations of mixed layer depth during summer. Journal of Geophysical Research: Oceans, 119(4): 2568–2582, doi: 10.1002/2013JC009535 Huang Chuanjiang, Qiao Fangli, Shu Qi, et al. 2012. Evaluating austral summer mixed-layer response to surface wave-induced mixing in the Southern Ocean. Journal of Geophysical Research: Oceans, 117(C11): C00J18, doi: 10.1029/2012JC007892 Huang Ruixin, Qiu Bo. 1998. The structure of the wind-driven circulation in the subtropical South Pacific Ocean. Journal of Physical Oceanography, 28(6): 1173–1186, doi: 10.1175/1520-0485(1998)028<1173:TSOTWD>2.0.CO;2 Li Guancheng, Cheng Lijing, Zhu Jiang, et al. 2020. Increasing ocean stratification over the past half-century. Nature Climate Change, 10(12): 1116–1123, doi: 10.1038/s41558-020-00918-2 Liu Shan, Jing Xueyi, Chen Xingrong, et al. 2023. An assessment of the subduction rate in the CMIP6 historical experiment. Acta Oceanologica Sinica, 42(1): 44–60, doi: 10.1007/s13131-022-2108-z Liu Chengyan, Wu Lixin. 2012. An intensification trend of South Pacific Mode Water subduction rates over the 20th century. Journal of Geophysical Research: Oceans, 117(C7): C07009, doi: 10.1029/2011JC007755 Munday D R, Johnson H L, Marshall D P. 2013. Eddy saturation of equilibrated circumpolar currents. Journal of Physical Oceanography, 43(3): 507–532, doi: 10.1175/JPO-D-12-095.1 Ohno Y, Iwasaka N, Kobashi F, et al. 2009. Mixed layer depth climatology of the North Pacific based on Argo observations. Journal of Oceanography, 65(1): 1–16, doi: 10.1007/s10872-009-0001-4 Rintoul S R. 2018. The global influence of localized dynamics in the Southern Ocean. Nature, 558(7709): 209–218, doi: 10.1038/s41586-018-0182-3 Russell J L, Dixon K W, Gnanadesikan A, et al. 2006. The Southern Hemisphere westerlies in a warming world: propping open the door to the deep ocean. Journal of Climate, 19(24): 6382–6390, doi: 10.1175/JCLI3984.1 Sallée J B, Pellichero V, Akhoudas C, et al. 2021. Summertime increases in upper-ocean stratification and mixed-layer depth. Nature, 591(7851): 592–598, doi: 10.1038/s41586-021-03303-x Sallée J B, Shuckburgh E, Bruneau N, et al. 2013. Assessment of Southern Ocean mixed-layer depths in CMIP5 models: historical bias and forcing response. Journal of Geophysical Research: Oceans, 118(4): 1845–1862, doi: 10.1002/jgrc.20157 Sallée J B, Speer K G, Rintoul S R. 2010. Zonally asymmetric response of the Southern Ocean mixed-layer depth to the Southern Annular Mode. Nature Geoscience, 3(4): 273–279, doi: 10.1038/ngeo812 Shi Jiarui, Talley L D, Xie Shangping, et al. 2021. Ocean warming and accelerating Southern Ocean zonal flow. Nature Climate Chang, 11: 1090–1097, doi: 10.1038/s41558-021-01212-5 Somavilla R, González-Pola C, Fernández-Diaz J. 2017. The warmer the ocean surface, the shallower the mixed layer. How much of this is true?. Journal of Geophysical Research: Oceans, 122(9): 7698–7716, doi: 10.1002/2017JC013125 Stewart A L. 2021. Warming spins up the Southern Ocean. Nature Climate Change, 11(12): 1022–1024, doi: 10.1038/s41558-021-01227-y Toggweiler J R, Russell J. 2008. Ocean circulation in a warming climate. Nature, 451(7176): 286–288, doi: 10.1038/nature06590 Yamaguchi R, Suga T. 2019. Trend and variability in global upper-ocean stratification since the 1960s. Journal of Geophysical Research: Oceans, 124(12): 8933–8948, doi: 10.1029/2019JC015439 Yang Xiaoyi, Huang Ruixin, Wang Dongxiao. 2007. Decadal changes of wind stress over the Southern Ocean associated with Antarctic ozone depletion. Journal of Climate, 20(14): 3395–3410, doi: 10.1175/JCLI4195.1 Zhang Yutong, Xu Haiming, Qiao Fangli, et al. 2018. Seasonal variation of the global mixed layer depth: comparison between Argo data and FIO-ESM. Frontiers of Earth Science, 12(1): 24–36, doi: 10.1007/s11707-017-0631-6 -

 下载:
下载:


 点击查看大图
计量
- 文章访问数: 163
- HTML全文浏览量: 73
- PDF下载量: 10
- 被引次数: 0

