Gas Hydrate Engineering and Technology Center, Guangzhou Marine Geological Survey, Guangzhou 510075, China
2.
MLR Key Laboratory of Marine Mineral Resources, Guangzhou Marine Geological Survey, Guangzhou 510075, China
Funds:
The National Key Research and Development Plan under contract Nos 2018YFC0310000 and 2016YFC0304905-03; the National Natural Science Foundation of China under contract No. 41602149; China Geological Survey Project under contract Nos DD20190582, DD20191009 and DD20160214.
The amount of methane leaked from deep sea cold seeps is enormous and potentially affects the global warming, ocean acidification and global carbon cycle. It is of great significance to study the methane bubble movement and dissolution process in the water column and its output to the atmosphere. Methane bubbles produce strong acoustic impedance in water bodies, and bubble strings released from deep sea cold seeps are called “gas flares” which expressed as flame-like strong backscatter in the water column. We characterized the morphology and movement of methane bubbles released into the water using multibeam water column data at two cold seeps. The result shows that methane at site I reached 920 m water depth without passing through the top of the gas hydrate stability zone (GHSZ, 850 m), while methane bubbles at site II passed through the top of the GHSZ (597 m) and entered the non-GHSZ (above 550 m). By applying two methods on the multibeam data, the bubble rising velocity in the water column at sites I and II were estimated to be 9.6 cm/s and 24 cm/s, respectively. Bubble velocity is positively associated with water depth which is inferred to be resulted from decrease of bubble size during methane ascending in the water. Combined with numerical simulation, we concluded that formation of gas hydrate shells plays an important role in helping methane bubbles entering the upper water bodies, while other factors, including water depth, bubble velocity, initial kinetic energy and bubble size, also influence the bubble residence time in the water and the possibility of methane entering the atmosphere. We estimate that methane gas flux at these two sites is 0.4×10⁶–87.6×10⁶ mol/a which is extremely small compared to the total amount of methane in the ocean body, however, methane leakage might exert significant impact on the ocean acidification considering the widespread distributed cold seeps. In addition, although methane entering the atmosphere is not observed, further research is still needed to understand its potential impact on increasing methane concentration in the surface seawater and gas-water interface methane exchange rate, which consequently increase the greenhouse effect.
At present, the major directions and corresponding methods used in studying methane leakage in deep sea cold seeps are as follows. (1) Based on the numerical simulation and experiments (Rehder et al., 2009), the motion and dissolution rate of single methane bubble in water are investigated (Olsen et al., 2017; Rehder et al., 2002a; Sauter et al., 2006). However, high intensity leakage and corresponding movement of massive methane bubbles are poorly constrained. (2) Using long term in-situ seafloor observation to study the periodic activity of the cold seeps and the controlling factors of methane leakage (Tréhu et al., 2003; Tryon et al., 1999). (3) Acoustic methods (multibeam echosounder and single beam echosounder) were applied to detect methane seepage in vast areas and semi-quantify the amount of leaked methane gas (Greinert, 2008; Li et al., 2016; Muyakshin and Sauter, 2010; Nikolovska et al., 2008; Römer et al., 2012). Seismic survey and sub-bottom profiling were also conducted to study the fluid flow beneath the cold seeps (Bourry et al., 2009; Riedel, 2007). (4) Comprehensive comparison between in situ observation and geophysical data acquired from multiple expeditions were conducted to study the temporal and spatial variation of cold seep methane leakage and the corresponding controlling factors (Berndt et al., 2014; Boles et al., 2001; Klaucke et al., 2010; Tréhu et al., 1999).
Gaseous methane released from the seabed experienced complicated physical, chemical and biological process during its movement in the water column. Methane gas bubbles from cold seeps in shallow water areas, such as Svalbard waters (Berndt et al., 2014), can partially pass through the water body and enter the atmosphere, contributing to the global warming. In contrast to shallow water, methane bubbles released from deep sea cold seeps experience longer time, and are more likely to be completely dissolved without entering the atmosphere. However, oil were observed on the surface of methane bubbles in some areas (such as Gulf of Mexico) (Mcneil, 2009), which help methane entering the atmosphere by greatly reducing the contact of methane gas with seawater and decrease the dissolution rate. Experimental and numerical simulation studies have shown that gas hydrate shells may form on the bubble surface within the GHSZ, which also reduce the methane dissolution rate (Greinert et al., 2006a; McGinnis et al., 2006). However, after passing through the GHSZ, methane gas dissolve rapidly due to the decomposition of the gas hydrate shells, therefore, little methane can enter the upper water body and the atmosphere. Knowledge of characteristics of methane bubble movement in water and its controlling factors are prerequisites for understanding the environmental impact of methane from deep sea cold seeps. Methane bubble strings exhibit strong reflections in multibeam water column data which are known as “gas flares” due to its similar shape to a flame (Römer et al., 2012). Multibeam echosounding is an efficient method to detect methane leakage and cold seep distribution in a large area (Chen et al., 2019; Myhre et al., 2016). It is also an important way to study the characteristics of gas flares and bubble movement. However, little work has been conducted in studying the motion characteristics of methane gas in the water column by using acoustic water column data.
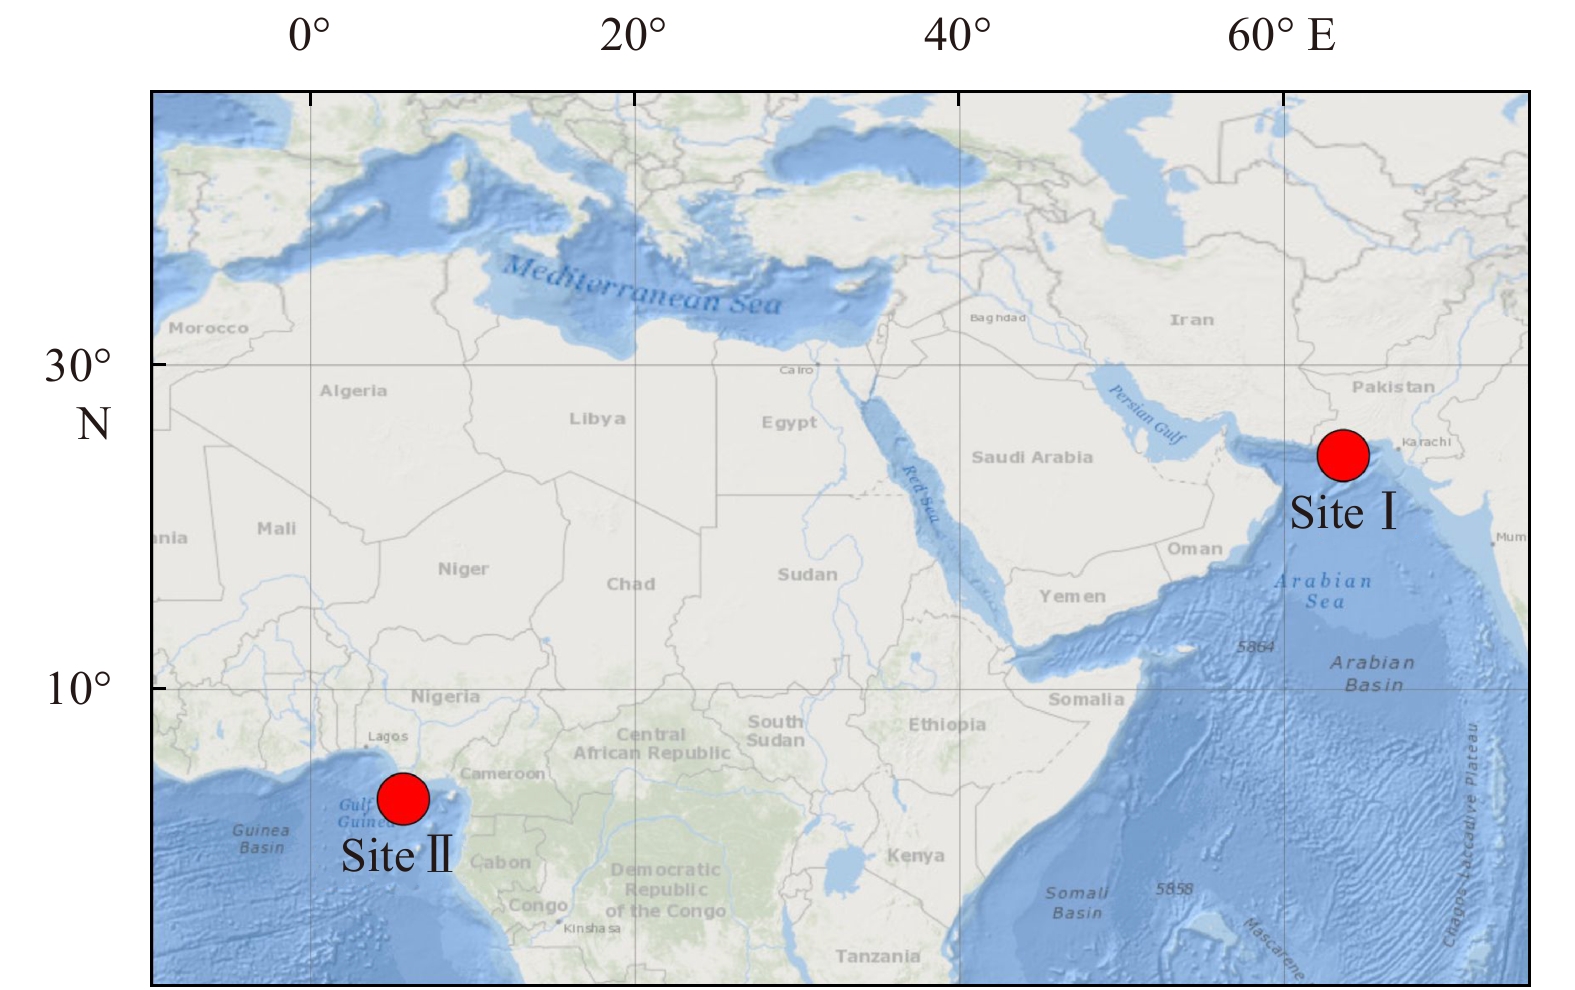
In this study, based on the multibeam water data and CTD data, we described the characteristics of gas flares and bubble movement in the water column at two seep sites at the Nigeria continental margin and Makran accretion wedge, respectively (Fig. 1). We also provided two methods for calculating bubble rising rate from multibeam water column data. Combined with numerical simulation, we further discussed the major factors that control the behavior of bubble motion and the potential environment impact of cold seep methane leakage.
Figure
1.
Location of two deep sea cold seep sites. Site I is located at 1 832 m water depth on the Makran accretion wedge offshore Pakistan. Site II is located at 1 140 m water depth on the Nigeria continental Margin, Gulf of Guinea.
The multibeam data of two seep sites used in this study were collected during two research expeditions. Site I is located within the Makran accretion wedge at 1 832 m water depth. The multibeam survey was conducted by using EM302 multibeam system on R/V Haiyangdizhi 10 during a joint research cruise between China and Pakistan in 2018. Four independent acoustic investigations were conducted at site I with keeping ship static by dynamic positioning system. The maximum open angle is 150° and the acoustic frequency is 26–34 kHz. Site II is located within the Nigeria continental slope at 1 140 m water depth (Wei et al., 2015). The data was obtained using Seabat 7150 multibeam system on R/V Pourquoi pas? during the joint “GUINECO-MeBo” cruise between IFREMER and MARUM in 2011 (Sultan et al., 2014). The maximum opening angle is 150° and the frequency is 12–24 kHz.
2.2
Multibeam water data processing
For site I, the raw data (wcd and all files) was converted to gwc files using FMMidwater module in the Fledermaus software. The gwc files were loaded in the Fledermaus and high reflection gas flares were picked out by adjusting the beam, range and depth in the fan mode. By switching the mode from fan to stacked, the selected beams were shown with water depth (vertical axis) and time (horizontal axis). Video files at site II, which are a series of fan-shaped images with time (video time) and depth information, were recorded during the multibeam survey.
2.3
Calculation of bubble rising velocity
Based on the multibeam water data, two methods were proposed to calculate the rising velocity of the bubbles. The first method was applied on the stacked images of site I to depict the oblique lines with high backscatters which represent the bubble movement in the water body. The water depth, time period (x length) and rising height (y length) of the lines were recorded. By calculating the slopes of the lines, the bubble rising velocities at different depths of site I were obtained, and the average value and standard deviation were calculated. The second method was applied on the time-series fan-shaped images of site II to estimate the velocity of a sudden released large amount of methane gas. The velocity is estimated by linear regression of manually tracked vertical position (y) of the gas plume center (strong reflection) and time (video time).
2.4
Methane hydrate phase equilibrium
Gas composition analysis shows that hydrate-bound gas consists of >99.9% (Römer et al., 2012) and 98.31%–99.62% (unpublished data) methane at site I and II, respectively. Therefore, it is reasonable to assume the presence of structure I gas hydrate. The phase boundaries of methane hydrate in the seawater of 3.5% salinity were calculated using CSMHYD software (Sloan and Koh, 2007) for each site. Water temperature was obtained by CTD deployment. The measured CTD temperature of site II only reached 760 m (5.35°C). Based on the known seabed temperature (4.5°C), the values between 760 m and 1 140 m were filled by linear interpolation.
2.5
Numerical simulation of bubble dissolution
Based on the basic environment parameters at each site, diameter variation and volume attenuation of methane bubbles discharged from the seabed within initial diameters of 10–16 mm (2 mm interval) were simulated using SiBu-GUI software (Greinert and McGinnis, 2009). Water temperature data were obtained via CTD deployment. Salinity, oxygen and carbon dioxide concentrations were assumed to be 3.5%, 0.3 mmol/L and 0.01 mmol/L, respectively. Methane concentration obtained using sensors at site I ranged between 3–5 nmol/L. Therefore, 4 nmol/L were used as the input parameter to simplify the simulation.
3.
Results
3.1
Acoustic characteristics of methane bubbles
The multibeam water column data were obtained when the orientation and position of the ship was kept constant by dynamic positioning. The fan-shaped water data were used to express the static characteristics of the gas flares, while the fan-shaped water data over time (video) can express the dynamic changes of the gas plumes. The stacked water data show the dynamic changes of a single plume over time.
3.1.1
Fan-shaped multibeam water data
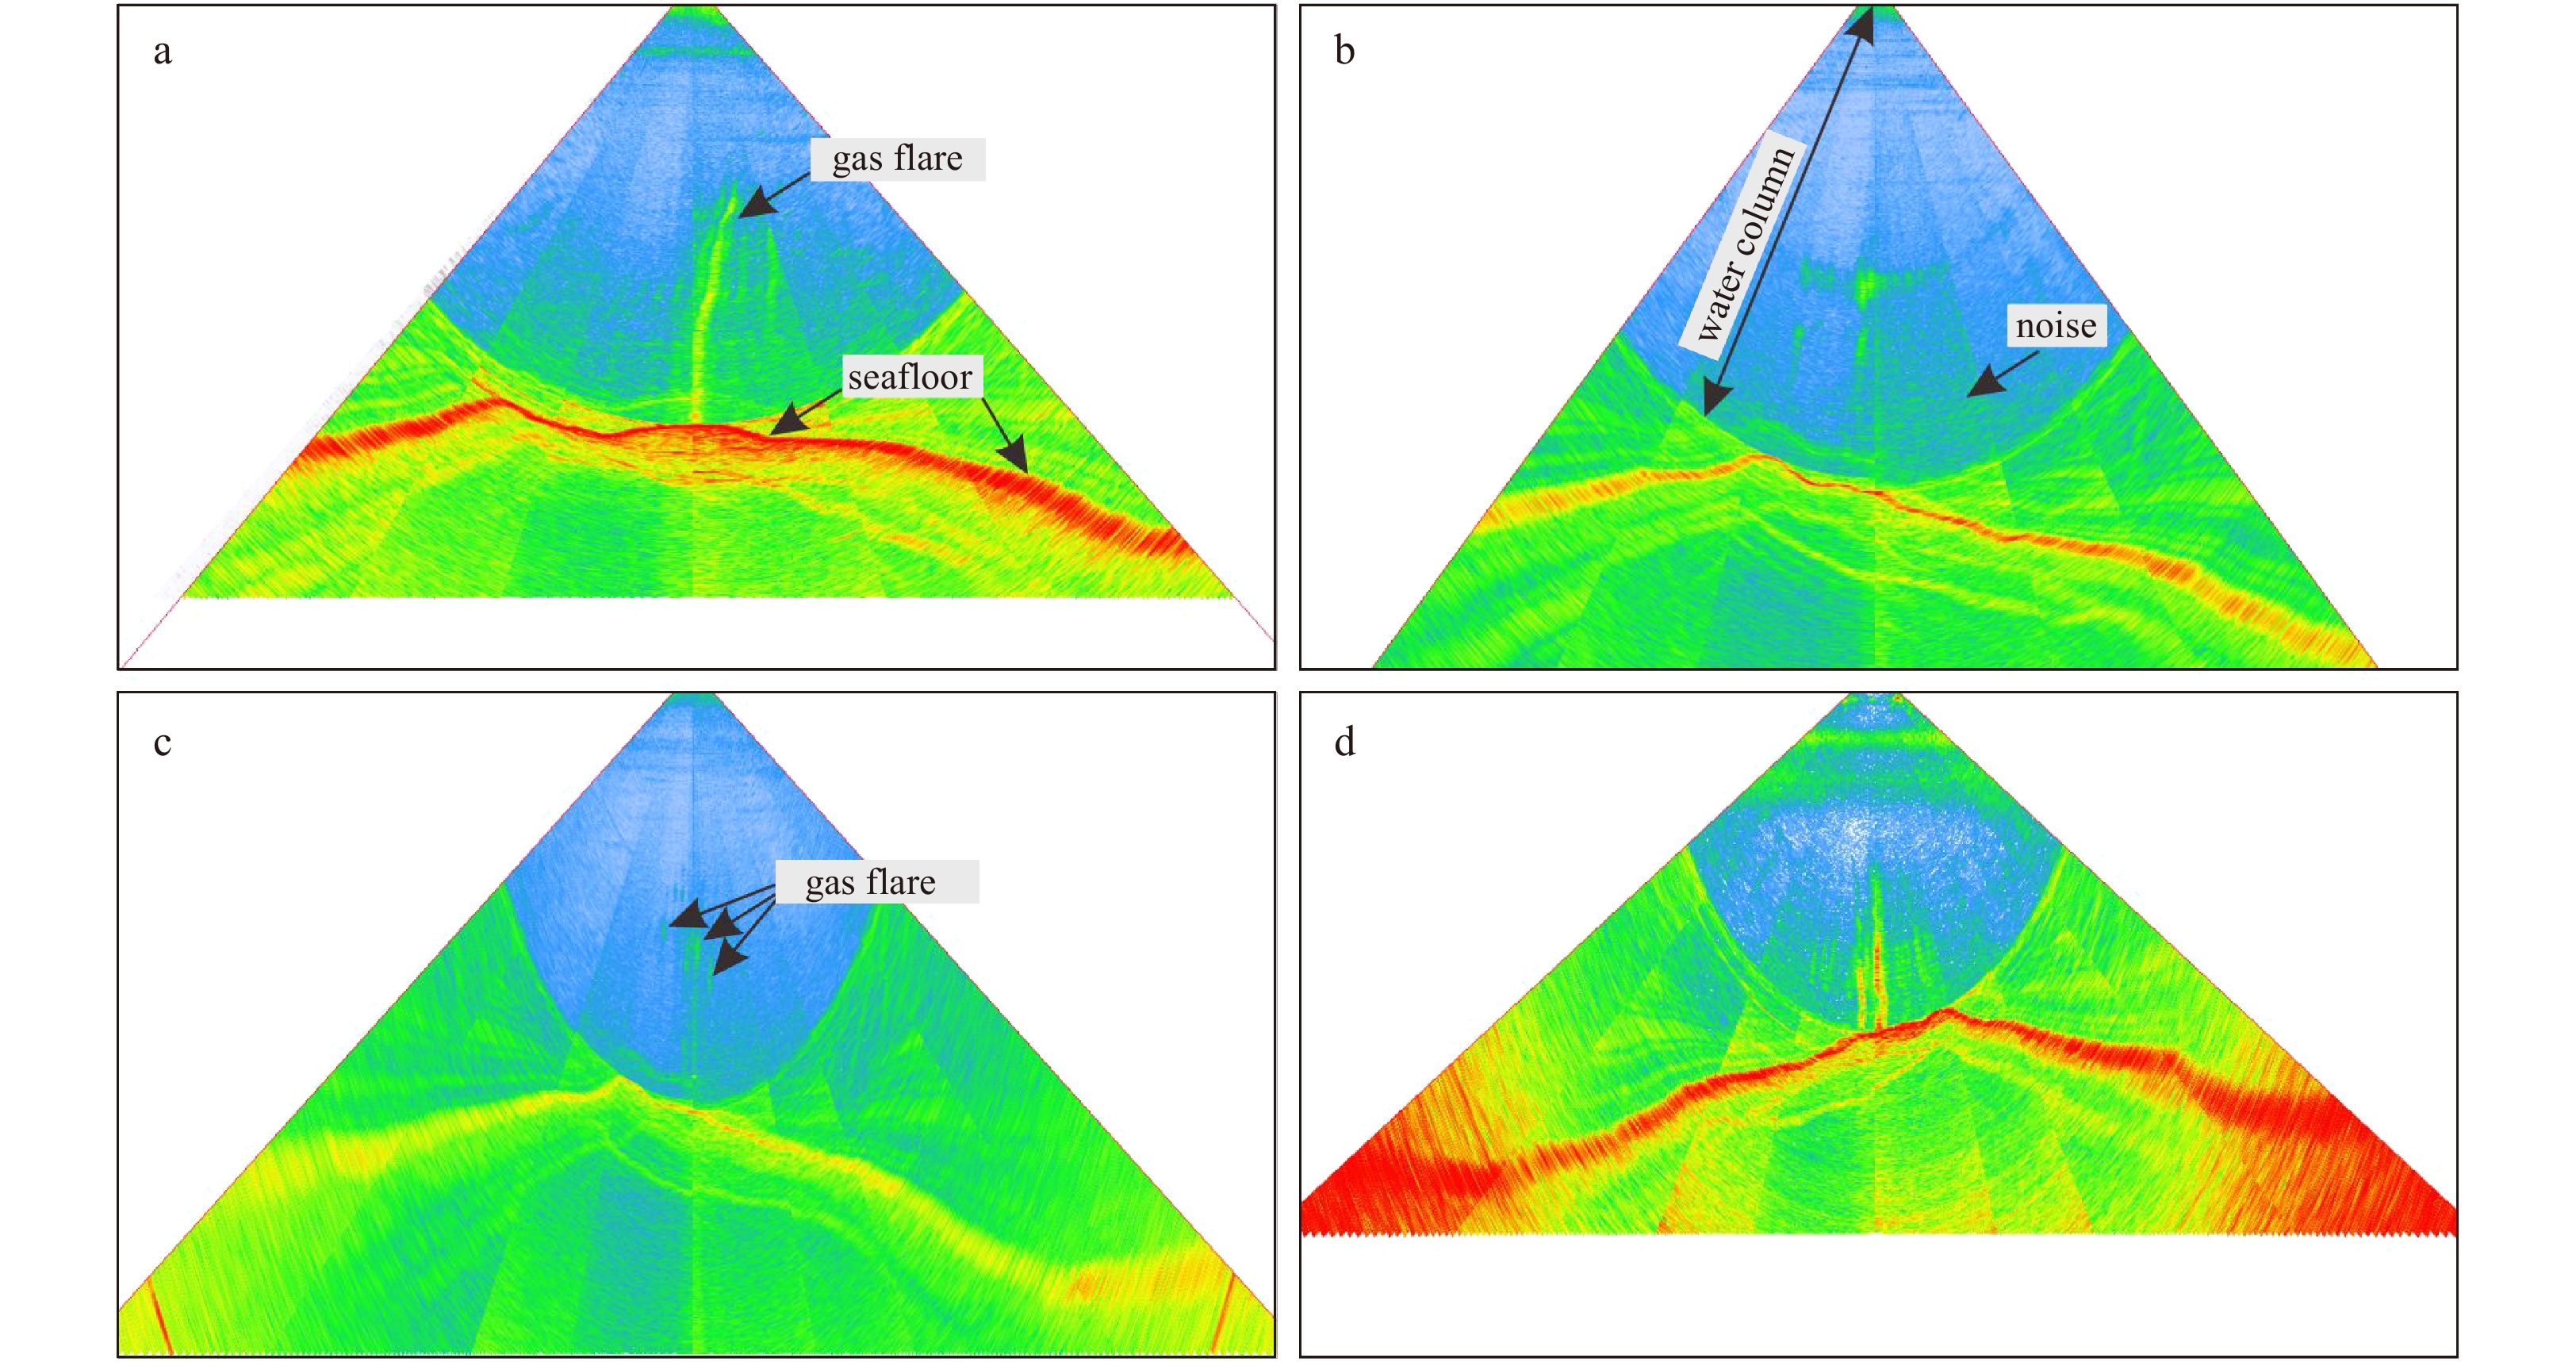
Multibeam water column data at site I was obtained for four times with slightly changing positions (27–110 m) (Fig. 2, Figs 4a–c, e). The seabed was not disturbed during the observation process. A continuous single plume which exhibits strong reflection was observed during the first investigation (Fig. 2a). Multiple non-continuous plumes with weak signals were observed during the second and third surveys (Figs 2b, c). Two gas flares with strong continuous reflection were observed in the fourth observation (Fig. 2d). All the gas flares observed at site I disappeared at around 920 m.
Figure
2.
Fan-shaped multibeam water column data showing gas flares in high reflections from seafloor at site I. a–d. Four independent multibeam investigations at site I with research vessel static by dynamic positioning. The colors represent the intensity of the acoustic impendence (red: high, green: medium, blue: low).
Figure
4.
Stacked multibeam water column data and manually drawn dashed lines for calculating bubble velocity using the first method. White lines represent the top of GHSZ at site I, red line at 920 m illustrates the depth where most gas bubbles disappeared. a–c and e correspond to the Fan-shaped images in Figs 2a–d in time series; d and f are enlarged images of c.
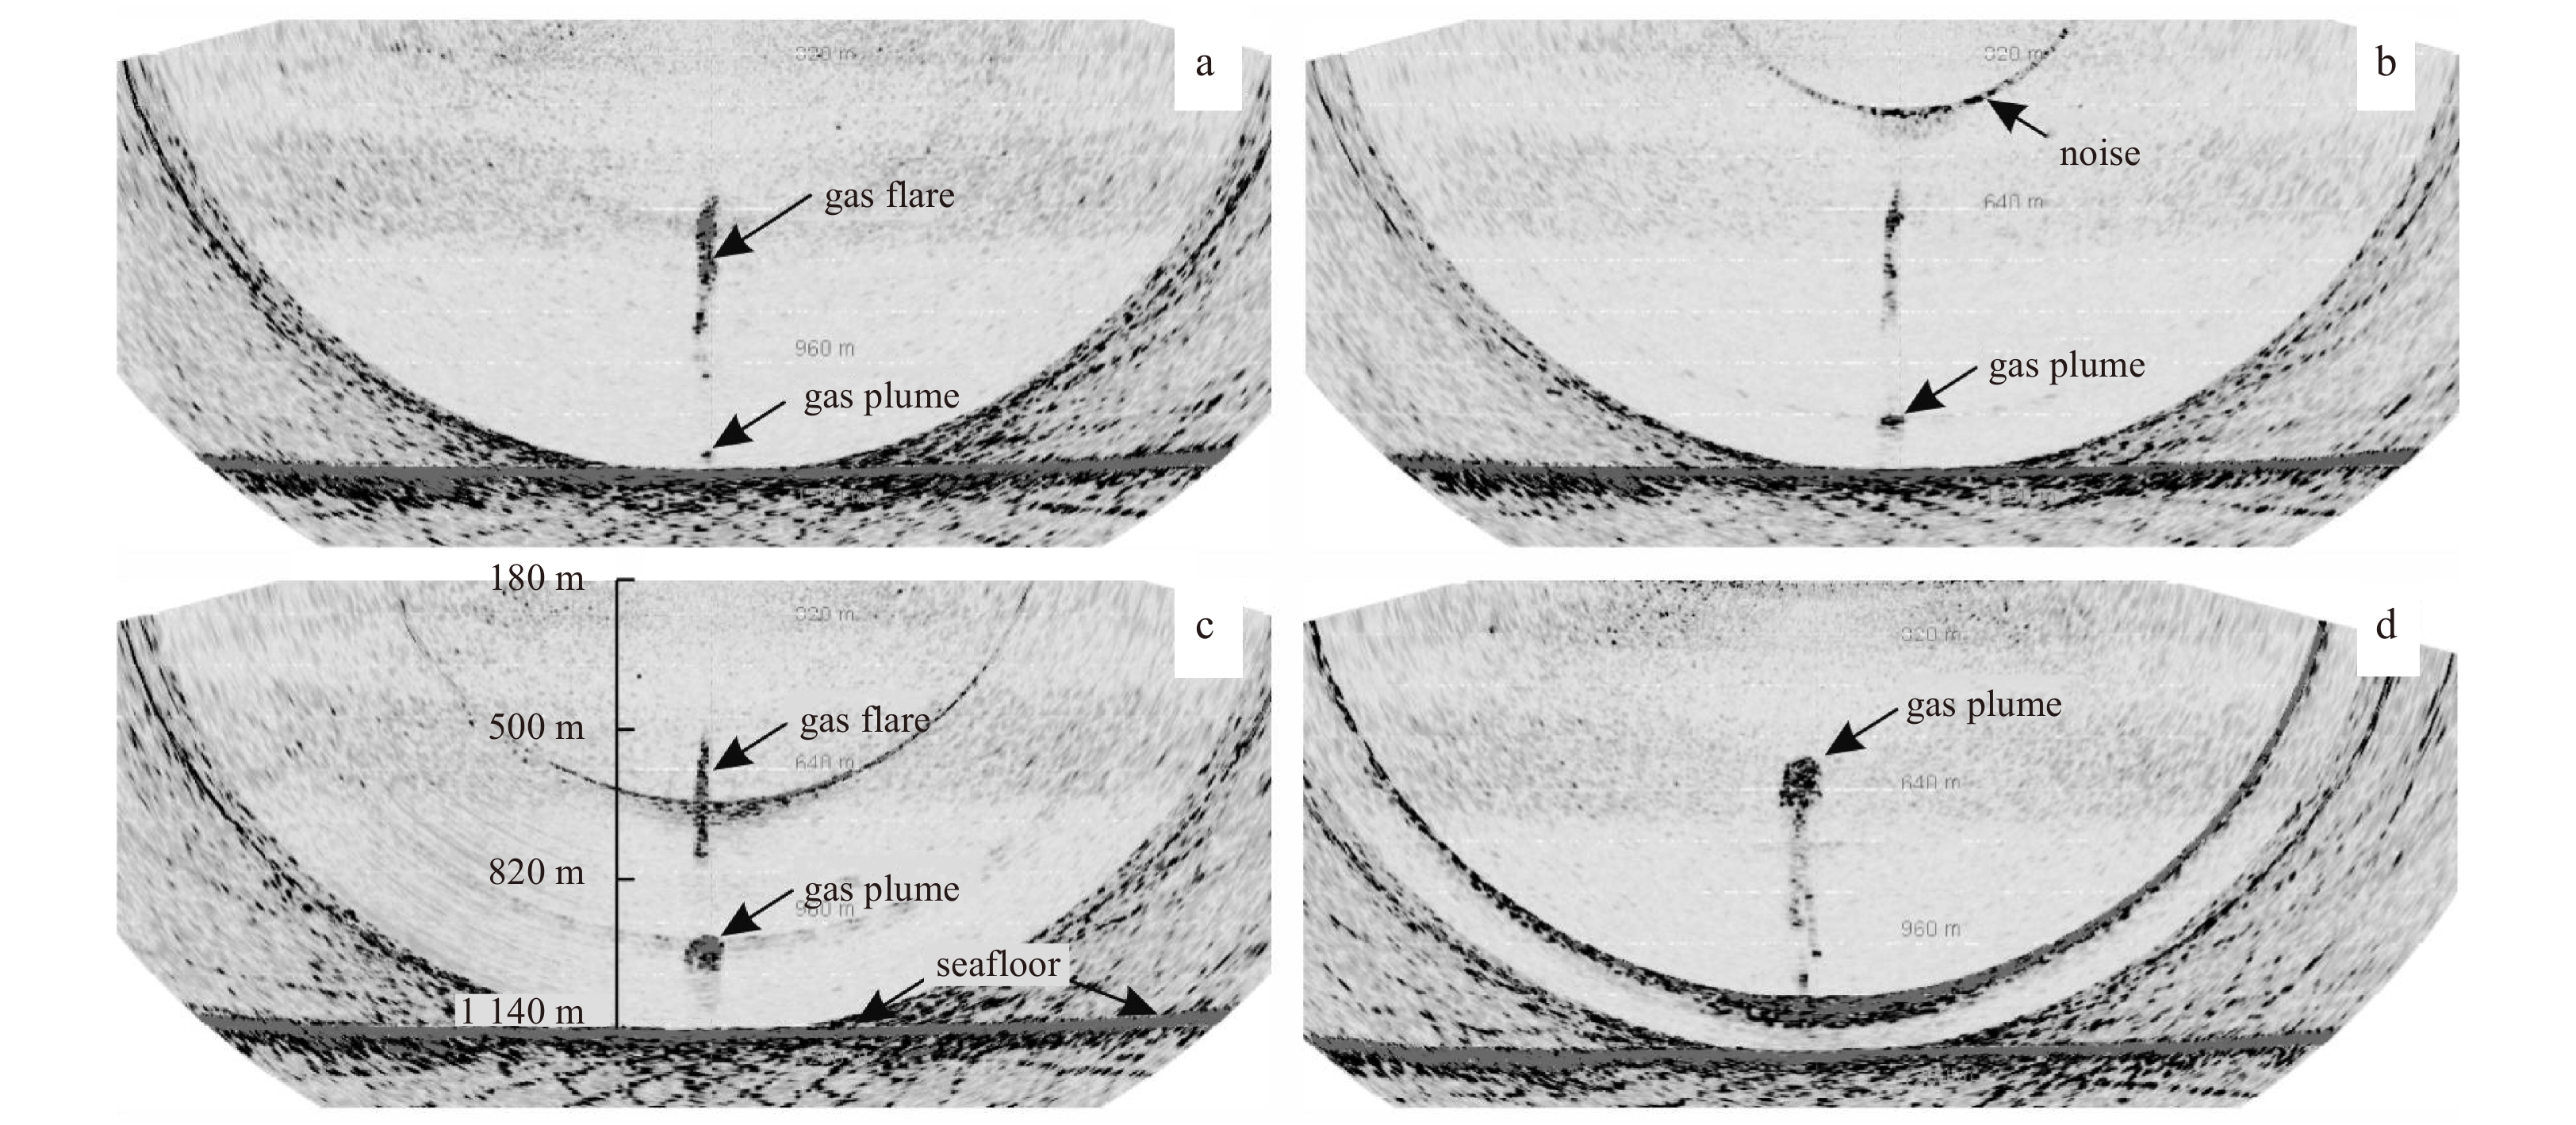
We analyzed the Fan-shaped water data of the two videos at site II and found two distinct gas plumes (Fig. 3). Although a ~5 min piece of data was missing between the two videos, it is speculated that these two gas plumes represent the same one based on the rising velocity. The strong reflection area was significantly enlarged (Figs 3a–d) and many point-like strong reflections appeared underneath during bubble plume ascent (Fig. 3d). The gas flares finally disappeared at ~550 m water depth.
Figure
3.
Fan-shaped multibeam water column data showing gas flares in high reflections from seafloor at site Ⅱ. a–d. Dynamic changes of the gas flares and gas plumes in time series for one investigation with ship dynamic positioned.
Stacked multibeam water data at site I showed dynamic change of a single bubble string in the water. We performed ascent and descent operations of instruments in the water at site I, but the seabed was not disturbed during the observation. The surface layer (0–320 m) showed high reflections which were mainly resulted from the plankton in the light transmitting layer (Fig. 4a). The thickness changed during the four investigations. The middle layer (320–920 m) was weak reflection water body. The bottom layer (920–1 830 m), which showed high backscatter (orange and reddish), is the major depth interval that we focused in this study. The bottom red line illustrates the seafloor which is at 1 832 m. Instruments ascending and descending, which expressed as oblique lines of strong reflection, were also observed (Figs 4a–c). In addition, oblique lines which represent bubble movement were observed mainly below 850 m and are the major basis for calculating the bubble rising velocity (Figs 3a–c).
3.2
Gas hydrate phase boundaries and methane bubbles entering the non-GHSZ
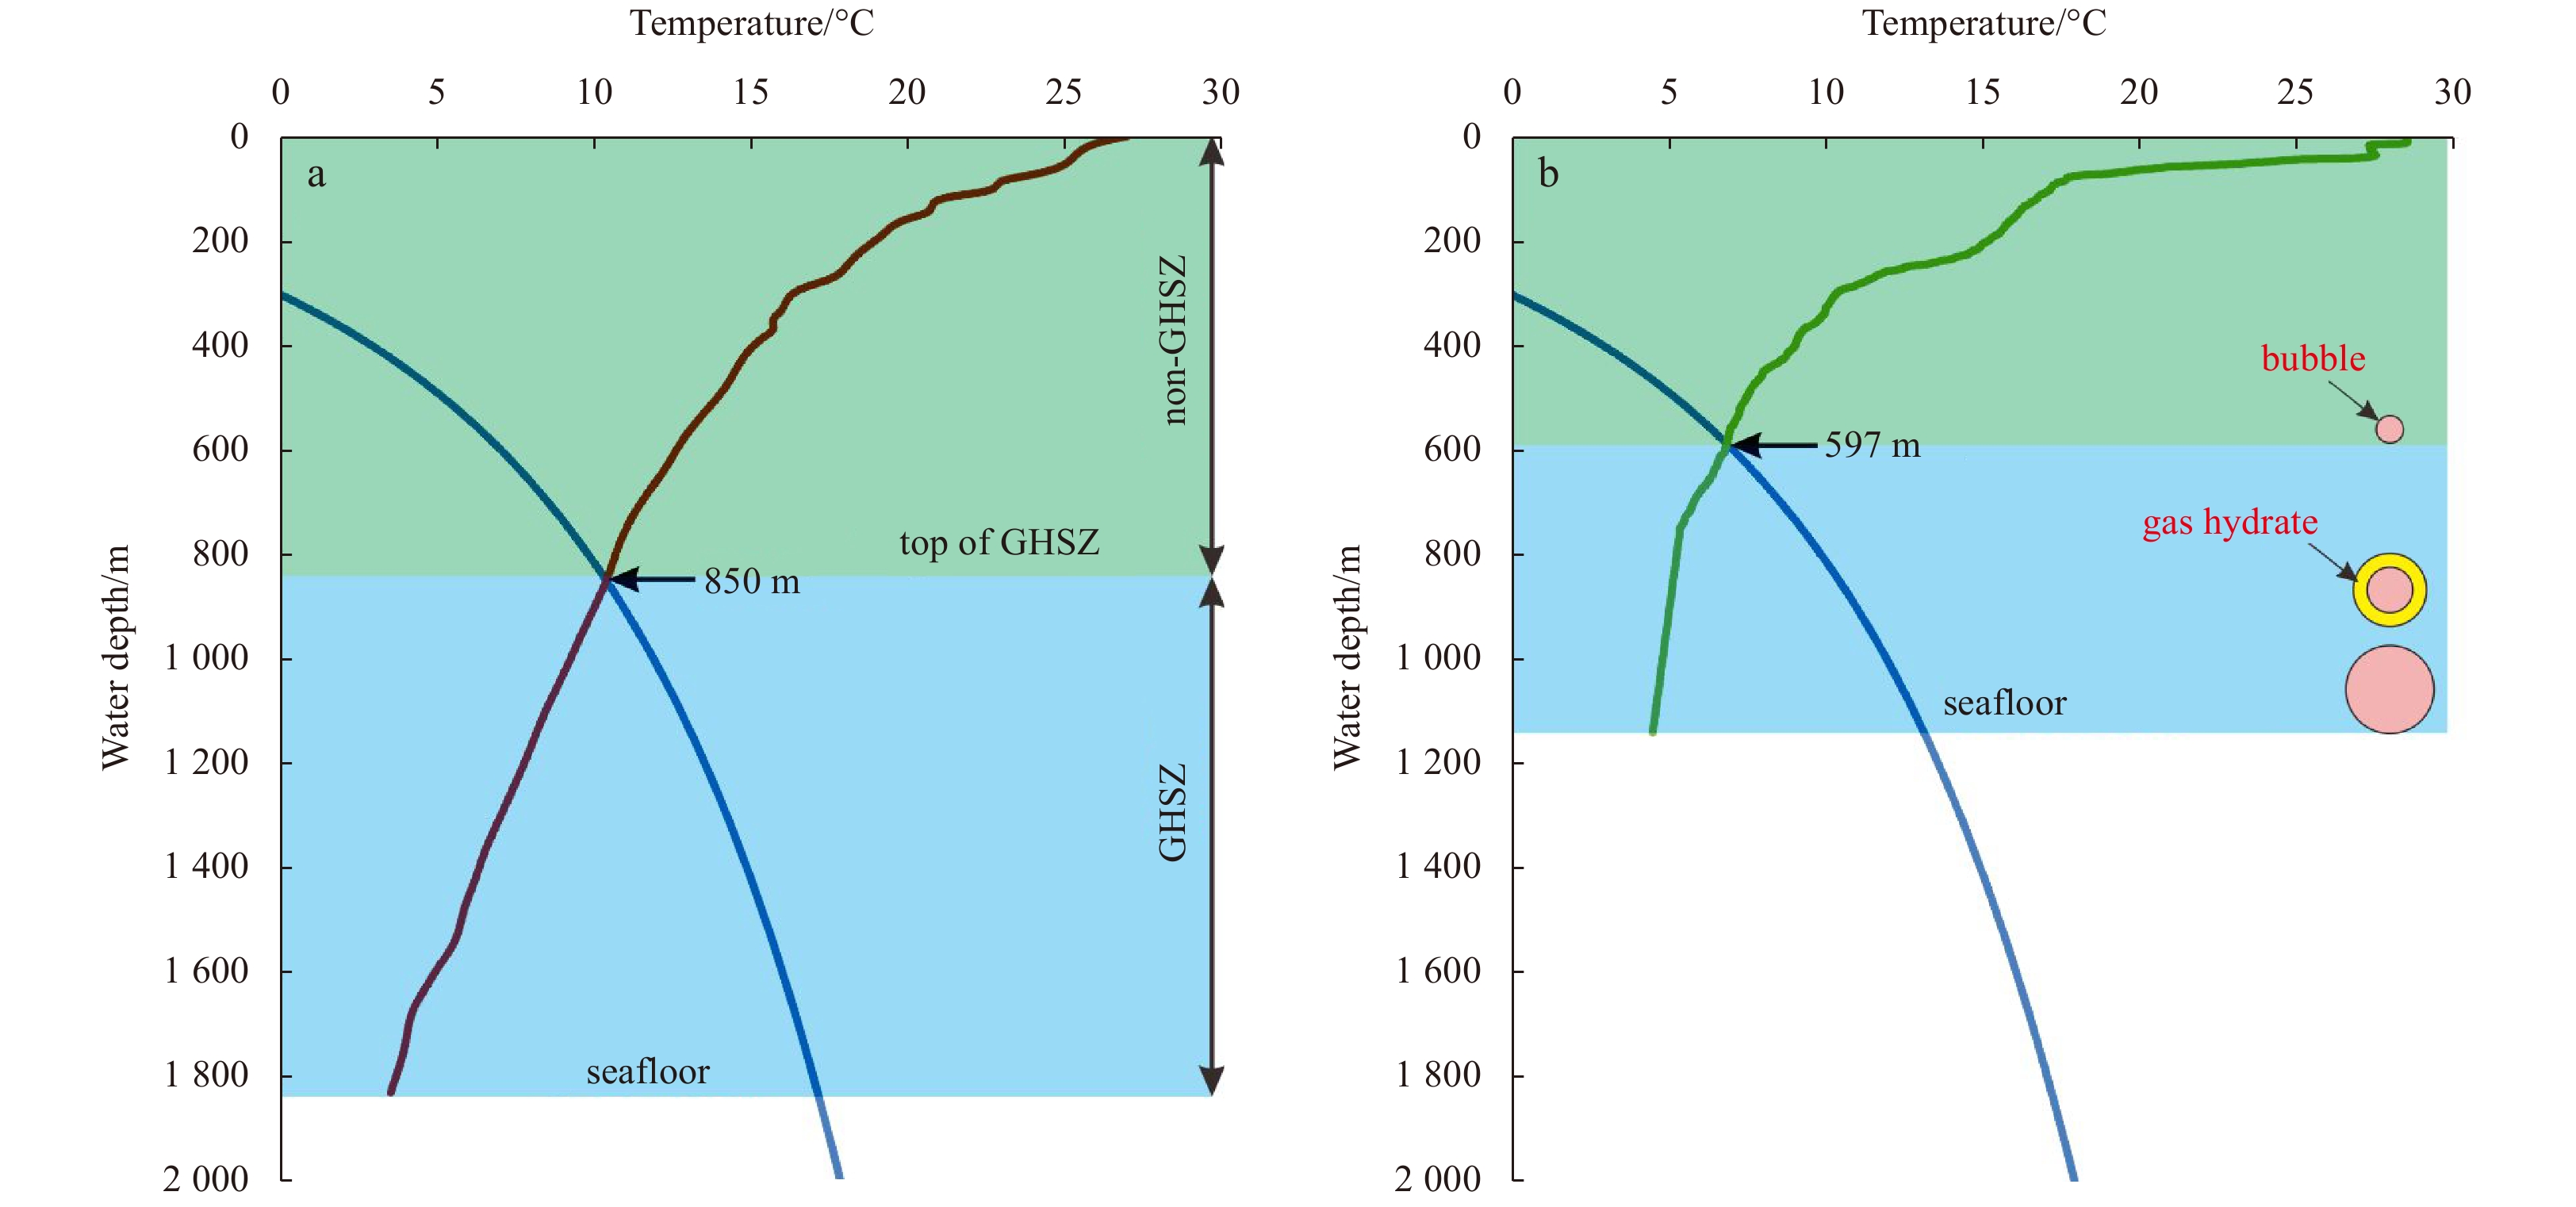
The top of the GHSZ were calculated to be located at 850 m (site I) and 597 m (site II), respectively (Figs 5a, b). Based on the stacked images, we found that most of the gas bubbles did not reach the gas hydrate phase boundary at 850 m at site I (Fig. 6a), only with a few exceptions (Fig. 4a, last ~10 min). Small oblique lines were widely developed at 100–200 m below phase boundary. In contrast to site I, gas flares at site II reached the top of the GHSZ (597 m) and disappeared at 550 m (Fig. 3).
Figure
5.
Gas hydrate phase boundaries estimated at sites I (a) and II (b). The top of the GHSZ is at 850 and 597 m at site I and site II, respectively. The right images illustrate the major gas hydrate formation and decomposition during ascending.
Figure
6.
Height of bubble velocity changed with time at site II. The height of the gas plume is represented by the centre of the manually drawn cycle. The corresponding liner regressions of depth and time in a and b are denoted in c. “Time break” in Fig. 5a shows the point where a piece of video is missing.
We calculated the rising velocity of methane bubbles at site I and II by applying two methods. At site I, bubble rising velocities estimated using the first method show similar values (9.1 cm/s, 10 cm/s, and 9.7 cm/s) during three investigations (Table 1). Two independent line drawings on the images of the third observation (Fig. 4c: 0–1 900 m, Fig. 4d: 800–1 900 m) were performed. The standard deviations were 0.9 cm/s and 0.8 cm/s which did not show significant scattering (Table 1). Statistical analysis showed an average bubble rising velocity of 9.6 cm/s with standard deviation of 1.2 cm/s (Table 1). The second method was applied at site II and the corresponding bubble rising velocities are 28 cm/s and 20 cm/s, respectively (Figs 5a–c).
Table
1.
Basic information and estimated bubble rising velocity at site I
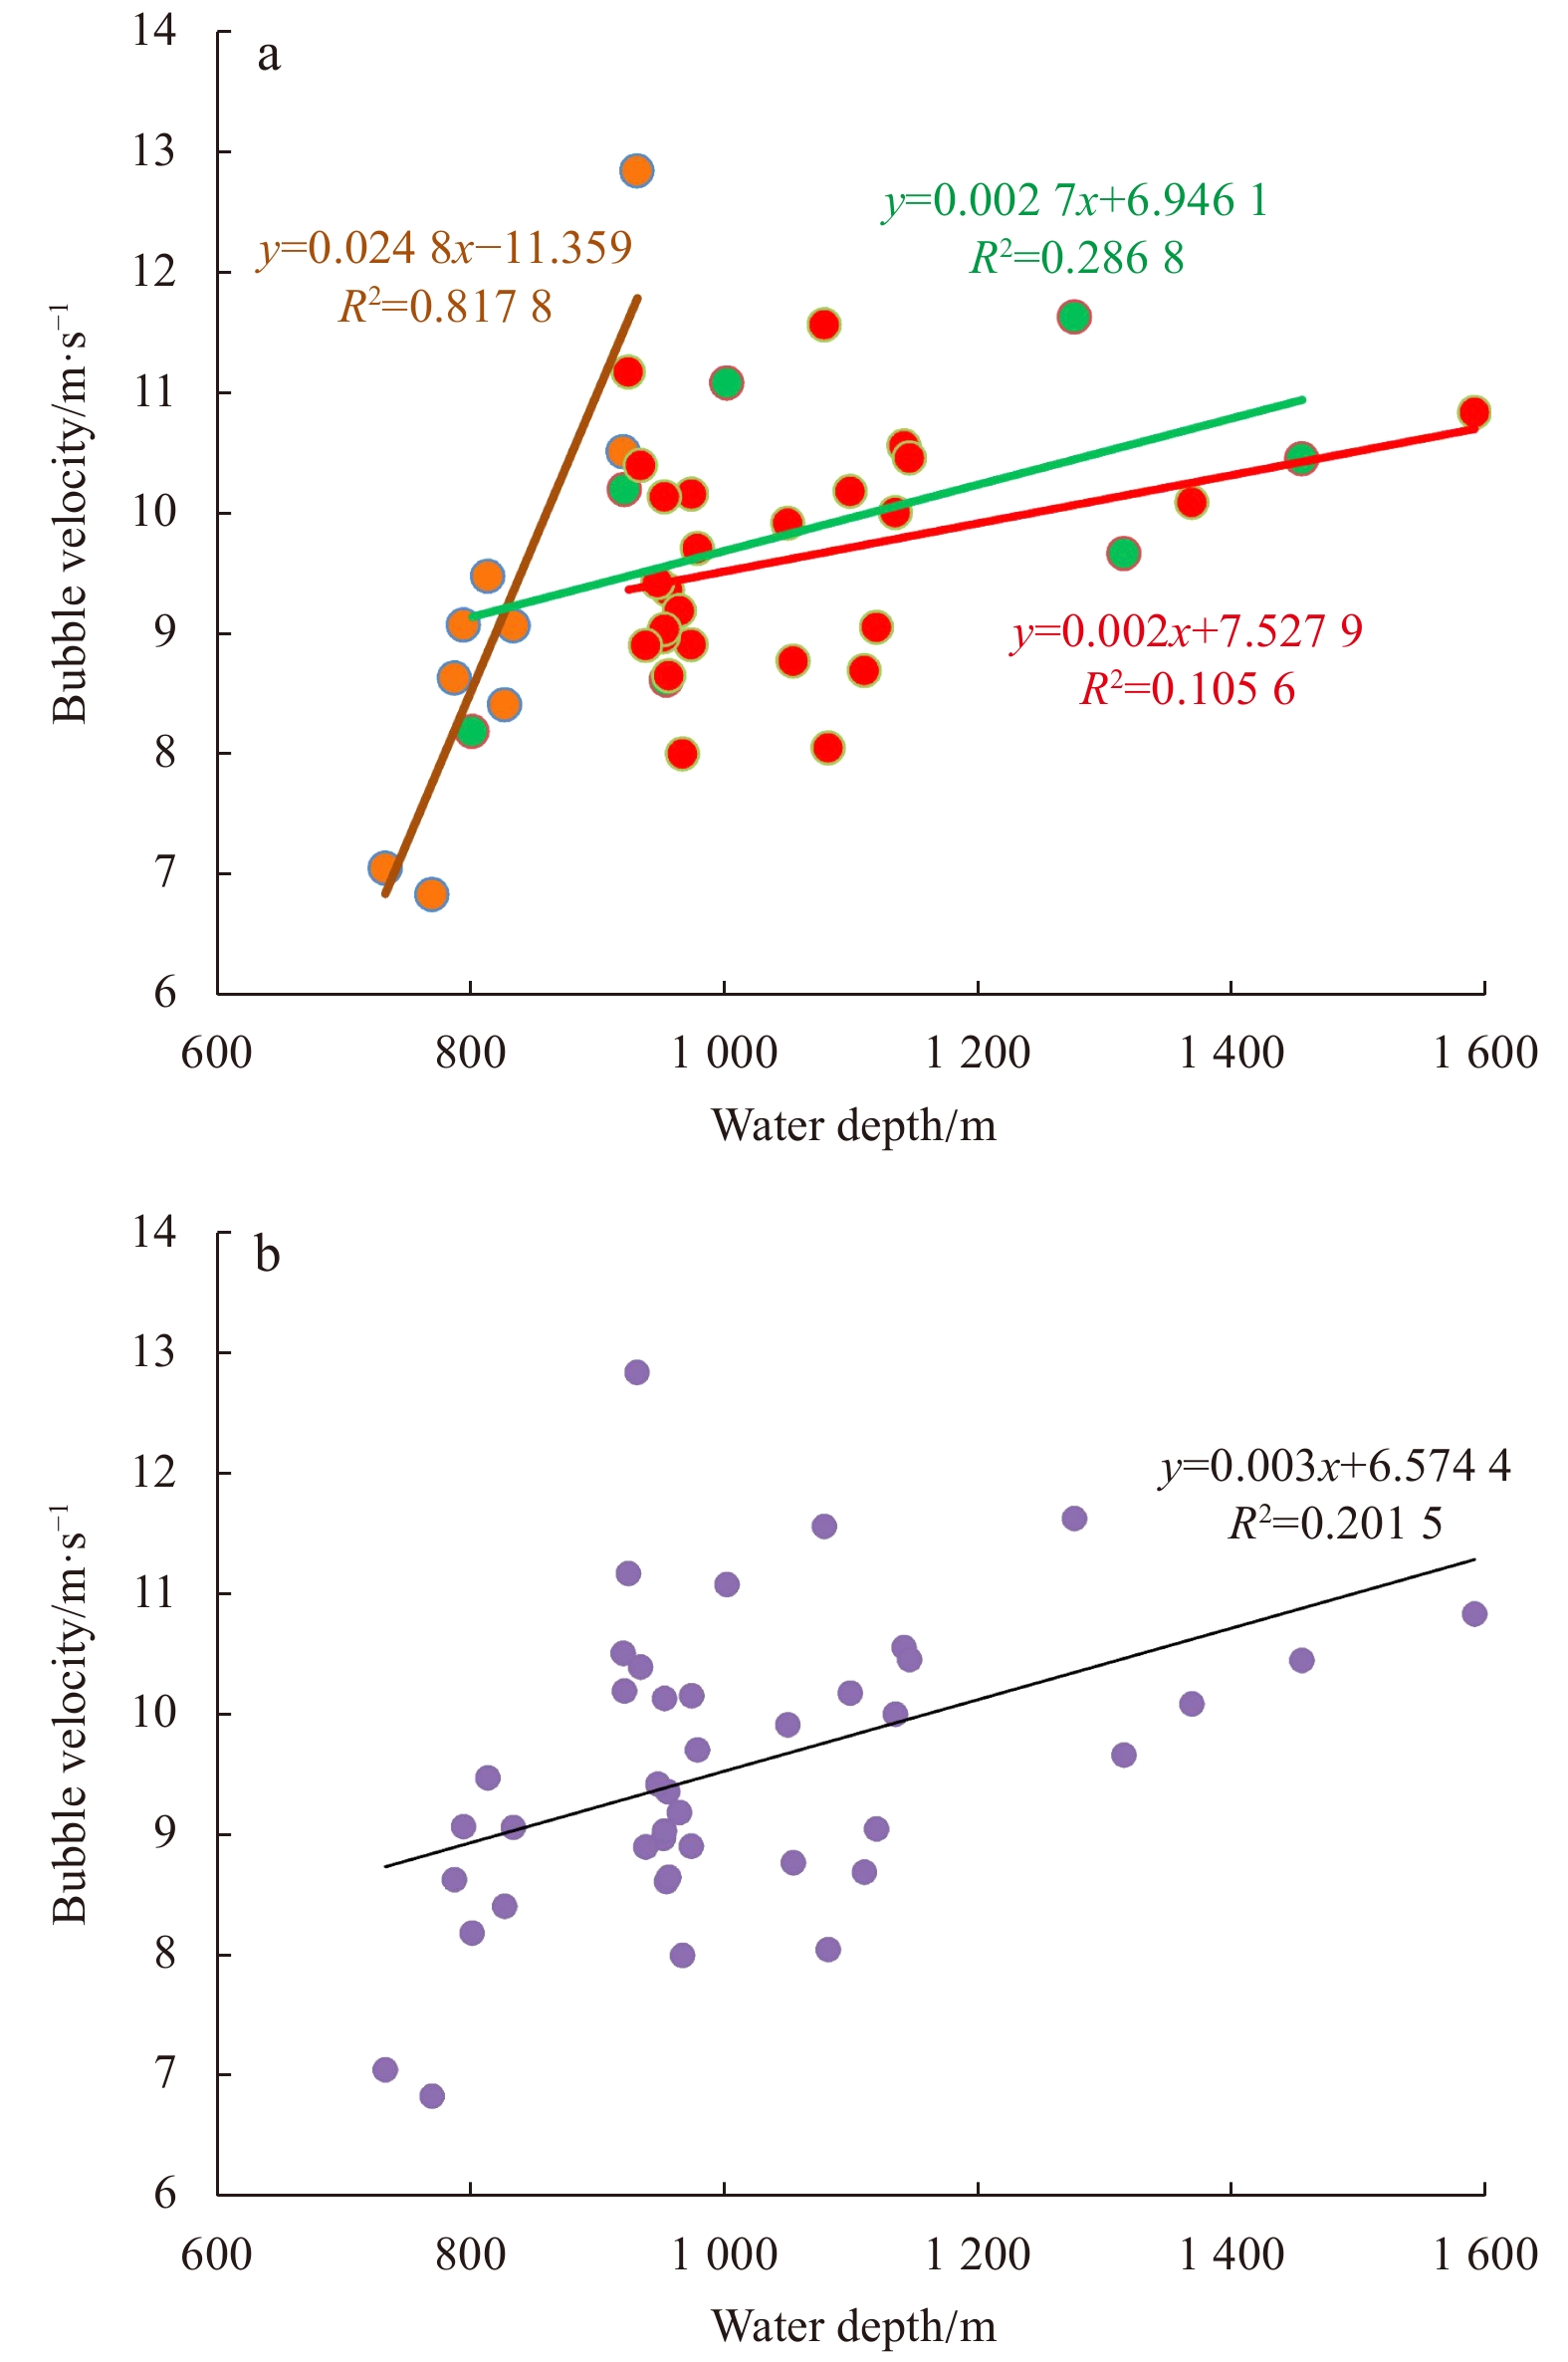
The correlation between bubble depth and rising velocity were analyzed at site I (Fig. 7). The result shows that bubble depth and rising velocity are positively correlated. The correlation of the first observation is good with correlation coefficient of 0.82 (Fig. 7a). However, correlations of the other two investigations are relatively poor which show correlation coefficients of 0.29 and 0.11, respectively (Fig. 7a). Linear regression analysis of all the bubbles also shows positive correlation between bubble depth and rising velocity with correlation coefficient of 0.2 (Fig. 7b).
Figure
7.
Positive correlations between bubble rising velocity and water depth at site I. a. Linear regression of rising velocity and water depth of individual investigation at site I (brown: Fig. 2a, green: Fig. 2b, red: Figs 2c, d) and b. linear regression of all the investigations.
4.1
Characteristics of bubble movement and its controlling factors
The bubble rising velocities in this study are consistent with previous studies in the other areas (Table 2). Four investigations were conducted at site I, however, the shape and intensity of the gas flares varied significantly (Figs 2a–b). We speculate that these differences are resulted from temporal and spatial variation of the gas flares, ship orientation, and ocean current. Although the distances among four observations are only 27–110 m, the big difference of gas flare morphology indicates that methane leakage is spatial heterogeneous on meter scale at site I. In addition, changes of gas flare characteristics might also be related to the periodic activity of the cold seeps. There are many factors affecting the cyclical variation of deep sea methane seepage at cold seeps, including gas hydrate formation and decomposition (Wei et al., 2015), subsurface pressure regime (Bangs et al., 2011), and formation of authigenic minerals (Loher et al., 2018; Wei et al., 2020). Formation of gas hydrates and authigenic carbonate may decrease the permeability and block the pathways of fluid migration (Sultan et al., 2014). With increasing pressure underneath to overcome the static lithological pressure, new pathways (factures) will be generated to facilitate the fluid migration (Torres et al., 2004). In addition, ocean current will deflect the gas flares which show discontinues features when multibeam signals cut through the deflected flares.
Table
2.
Comparisons of bubble velocities reported in other areas and in this study
The gas plume at site II exhibits strong reflection and non-linear decrease in rising velocity (28 cm/s to 20 cm/s) during the ascent in the water column (Fig. 5c). We attribute it to the initial velocity induced by overpressure subsurface, bubble collapse during rising, and hydrate formation. The gas plume at site II is a sudden release of large amount of methane by drilling through the free gas reservoir which was originally sealed by low permeable hydrate-bearing sediment (Sultan et al., 2014). Methane gas gushed out from the seafloor with high initial velocity under subsurface (~14 m) overpressure. The size of the observed bubbles is obviously larger than those from natural cold seeps (Sultan et al., 2014). It is inferred that large bubbles may break up under the effect of fluid flow and form large amount of small bubbles (Egorov et al., 2010). Previous studies shown that bubble size is positively correlated with velocity (McGinnis et al., 2006). We inferred that the increase of high reflection area and decrease of rising velocity is due to the formation of small bubbles from large bubbles during ascent. In addition, studies have shown that gas hydrate shells may form within 5–10 min in the deep sea environment (Rehder et al., 2002a). The formation of gas hydrate shells will increase the bubbles density, also resulting in the decrease of the rising speed. In addition, methane gas is continuously consumed by gas hydrate formation, causing decrease of bubble internal pressure. The discrepancy between bubble internal and external pressure will break the hydrate shell, forming many small bubbles and gas hydrate grains which reduce the rising velocity and increase the size of the gas plume (Egorov et al., 2012).
Each of the method in calculating bubble rising velocity has their own advantages and limitations. By using the first method, the descending and ascending speeds of the rope-controlled instruments were estimated to be 57 cm/s, 48 cm/s and 48 cm/s (Figs 4a–c), which are consistent with the speed recorded by the winch, indicating that the first method is feasible. In contrast to the second method, the first method is more efficient in depicting the bubble movement. Since the gas plume is a continuous movement of bubble strings, the oblique lines used in the first method may not occur in many cases (Fig. 4e). Instead, high reflections may fill the whole depth range of gas flares (Fig. 4e). Although the second method is less efficient, one can observe dynamic changes of the plumes. In addition, the second method is particularly useful for studying episodic methane leakage in natural cold seeps.
The possibility of gases entering the atmosphere is controlled by many factors, and the major factors include water depth, rising velocity, bubble size, hydrate formation (Sauter et al., 2006), and upwelling (Rehder et al., 2002b). Compared with site I, methane bubbles at site II passed through the top of the GHSZ and entered the upper non-GHSZ. The water depth and bubble rising velocity at site II are both smaller than those at site I, resulting in a longer time of dissolution in the water. The strong gushing at site II may release many hydrate pieces to the water, and we inferred that strong reflections in the non-GHSZ might be partly caused by gas hydrate decomposition. Larger bubble size at site II may also result in a longer staying time in the water. Upwelling of the fluid flow generated by subsurface overpressure may accelerate the bubble movement at site II. Therefore, mutual effects of these factors may result in the entrance of gas flare in the upper non-GHSZ at site II.
4.2
Numerical simulation of bubble dissolution and environmental impact of methane leakage
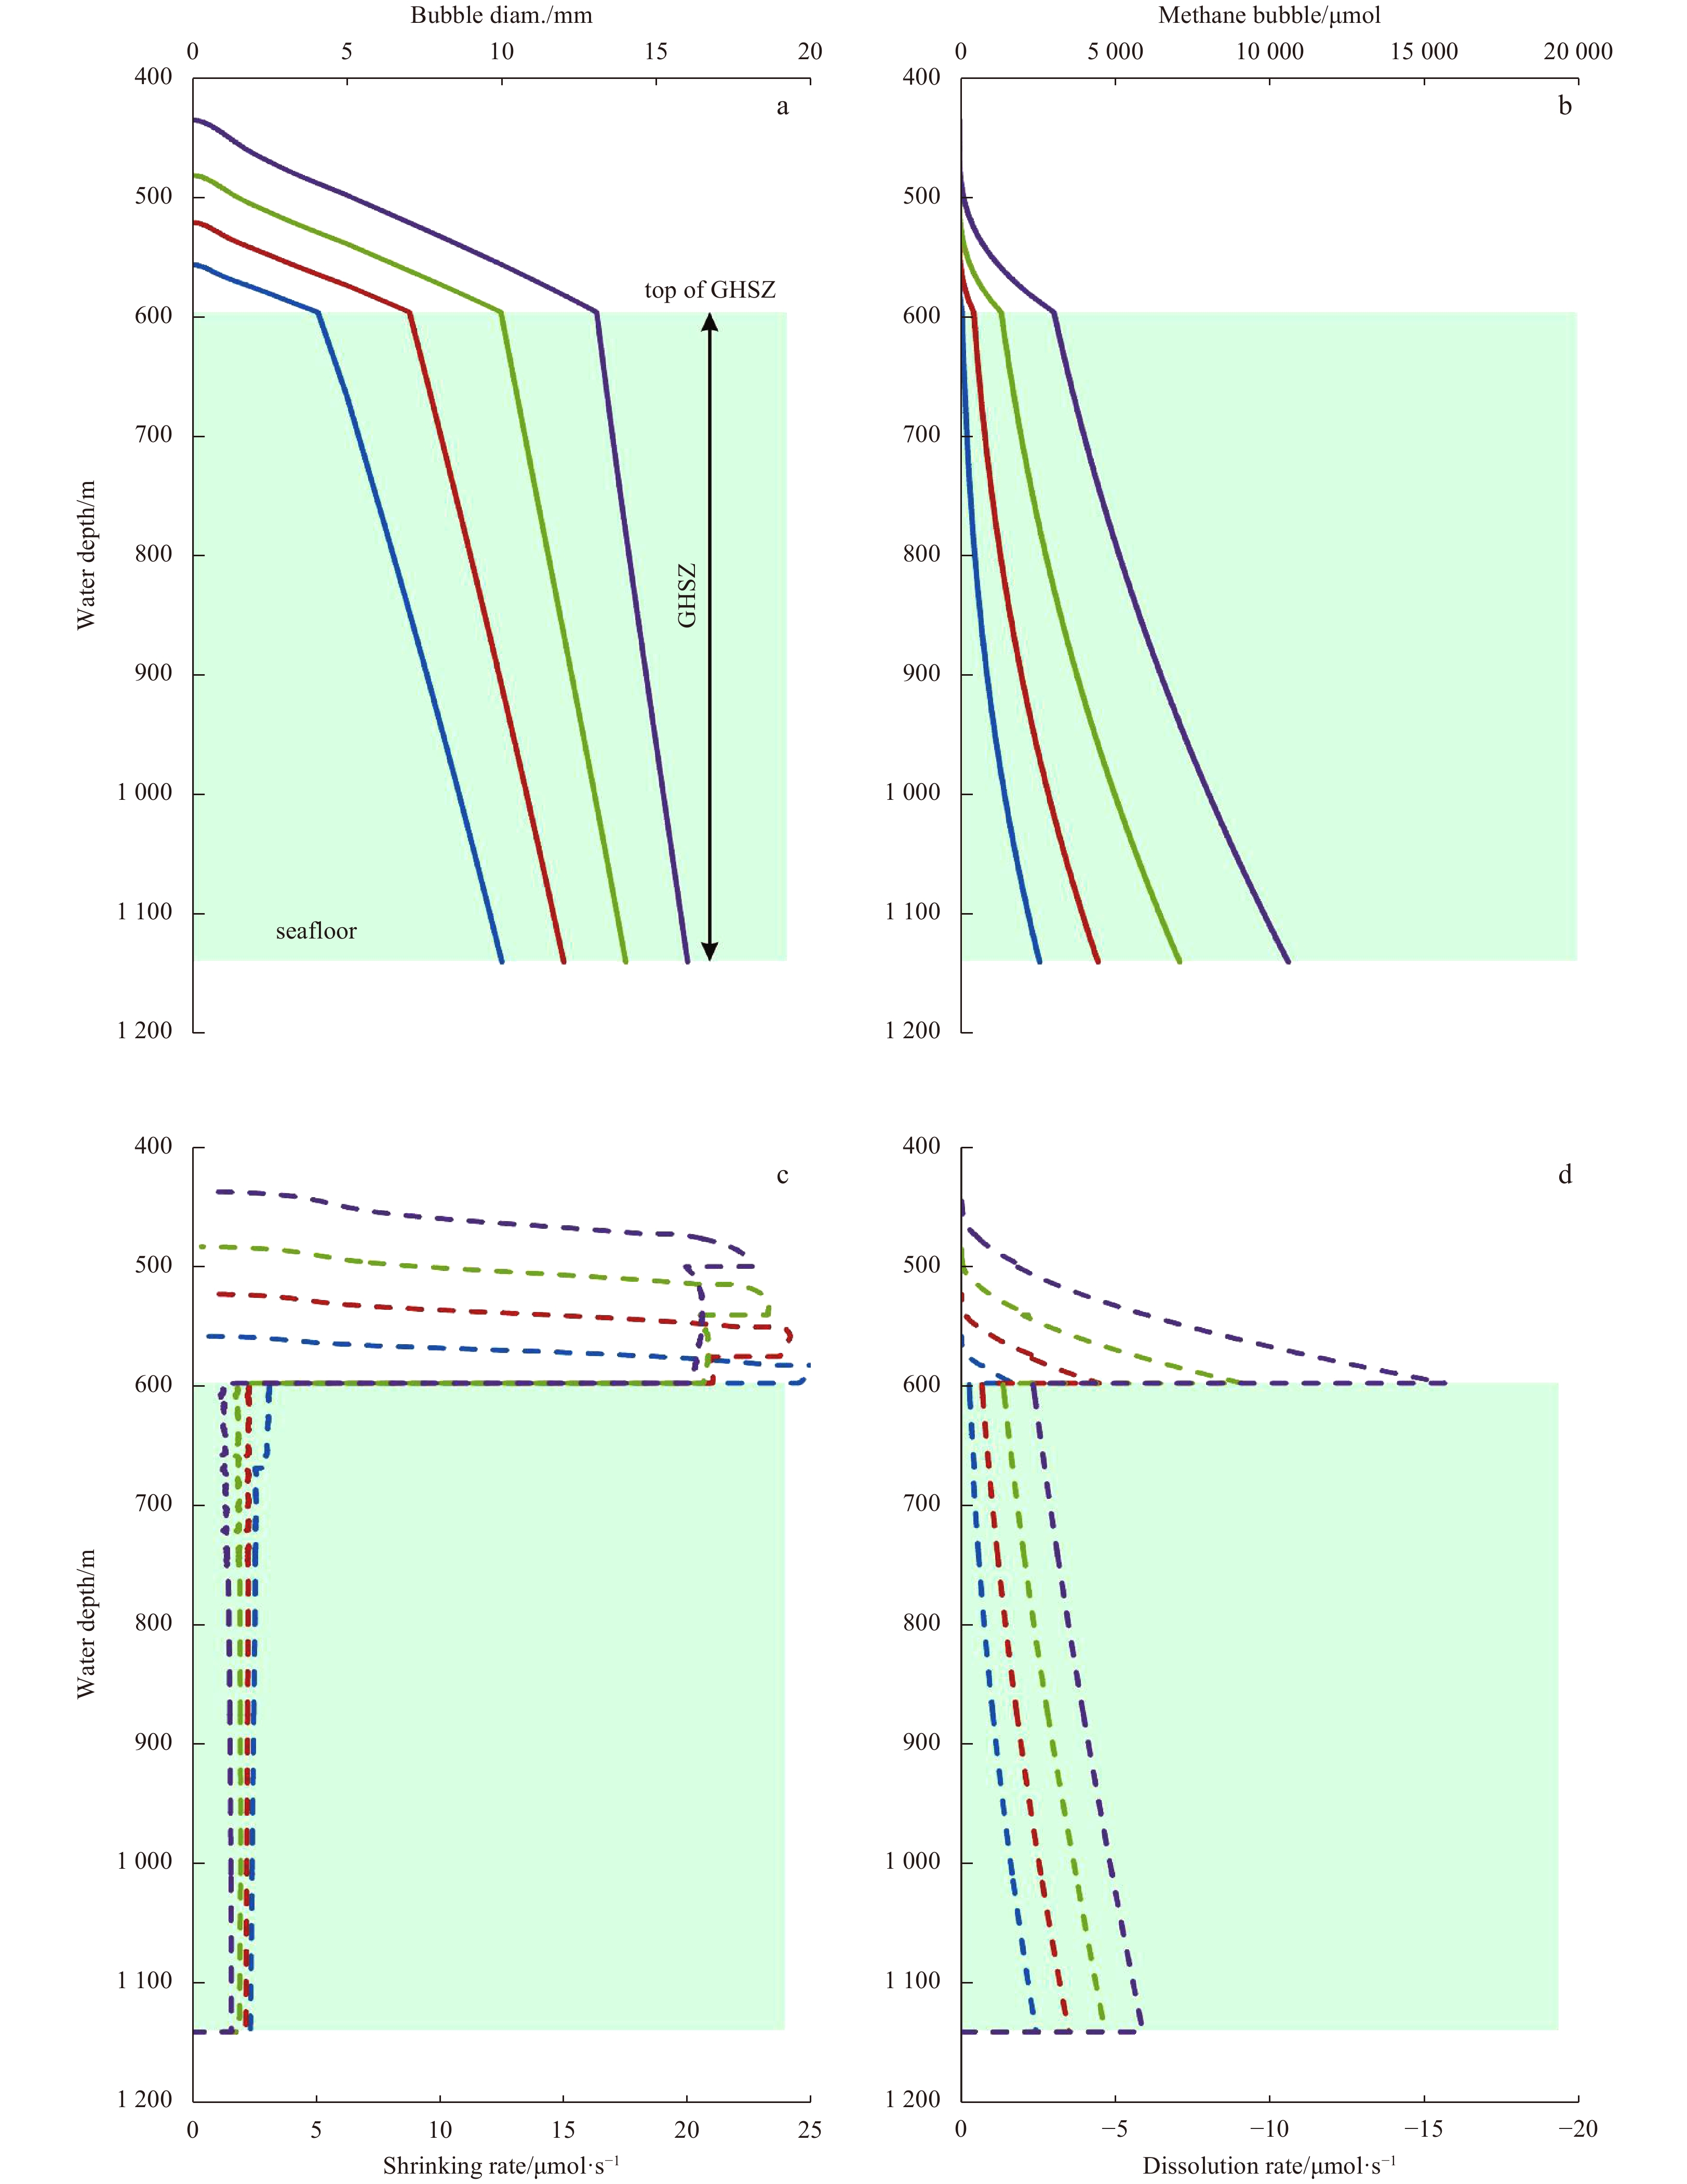
Base on the environmental parameters at sites I and II, the dissolution process of methane bubbles with 10–16 mm diameter (2 mm interval) in the water were simulated (Figs 8 and 9). The results show that bubbles of 10–16 mm diameter vanished at 1 044 m, 844 m, 805 m and 760 m, respectively (Fig. 8a). Gas flares at site I disappeared at about 920 m (Fig. 4a). Therefore, it is inferred that the initial diameter of bubbles released from the seafloor was between 10 and 12 mm. The simulation results at site II show that bubbles with diameters of 10–16 mm (2 mm interval) disappear at 557 m, 522 m, 483 m and 436 m, respectively (Fig. 9a). The multibeam water data shows that methane bubbles at site II disappeared at about 550 m. Therefore, it is inferred that the diameter of most methane bubbles at site II was around 10 mm when they were released at the seabed. However, bubble diameter observed using camera at site II is far larger than estimated 10 mm and theoretically these bubbles can reach the sea surface. We inferred that the bubble size discrepancy between the theoretical speculation and actual observation is mainly due to the broken of big bubbles into small bubbles during ascent.
Figure
8.
Dissolution process of methane bubbles based on the numerical simulation at site I. Red cycle at the key point which were discussed in Section 4.2.
The simulation result shows changes of bubble diameter and gas amount with depth during bubble ascending. The formation and decomposition of gas hydrate shells exert important impact on the changes of bubble diameter, gas volume and the corresponding decay rates (Greinert and McGinnis, 2009). Within the GHSZ, bubble diameter of site I decreases approximately linearly with depth, and the shrinking rate is 2.0–2.5 μm/s (10–16 mm) (Fig. 8b). Gas volume in the bubble decreases exponentially with depth. The dissolution rate decreases with depth within the GHSZ. After passing through the GHSZ, the bubble shrinking rate increases to 22 μm/s which is 10 times of that in the non-GHSZ (Fig. 8c), and the dissolution rate increases abruptly (7.2 μmol/s for bubble of 16 mm diameter) (Fig. 8d), leading to a fast consumption of methane gas to zero. Based on the simulation profiles at site I, it is inferred that bubbles within initial diameter of 10–16 mm reduced to 50% at 1 372 m, 1 250 m, 1 088 m and 877 m (Fig. 8a). Only bubbles larger than 12 mm in diameter can enter the non-GHSZ. The amount of 16 mm diameter methane bubbles dissolved within the non-GHSZ was only 880 μmol, accounting for 5.4% of the initial gas amount (16 300 μmol) (Fig. 8b). In contrast, the amount of methane dissolved within the non-GHSZ for the same bubble at site II is significantly increased due to the shallower water depth. The 10 mm diameter methane bubble can enter the non-GHSZ, and the amount of methane gas released by the 16 mm bubble in non-GHSZ (3 130 μmol) accounts for 29.5% of the initial amount of methane (10 600 μmol) (Fig. 9b).
Previous studies suggested that methane flux of a single gas flare is 0.13–21.9×10⁶ mol/a (Römer et al., 2012). In our study, 3–4 plumes were observed at sites I and II. Total methane entering the water body is estimated to be around 0.4–87.6×10⁶ mol/a at these two sites. It is insignificant compared with total amount of methane in the ocean (St Louis et al., 2000), however, considering the widely distributed cold seeps, methane leaked from the cold seeps may exert significant impact on seawater acidification. Many researchers concerned that potential methane leakage during gas hydrate exploration and exploitation may affect methane output to the atmosphere (Ye et al., 2018). Result at site II evidenced that methane gas will be hindered by thick seawater not to enter the atmosphere even if leakage occurs. Therefore, gas hydrate exploration and exploitation will not produce a significant greenhouse effect. In addition, although acoustic observation and numerical simulation show that the gaseous methane at two sites did not enter the atmosphere, however, further research is still needed to know whether cold seepage will increase methane concentration in surface water and the methane exchange rate at the gas-water interface, which consequently increase the amount of methane entering the atmosphere and exacerbate greenhouse effect.
5.
Conclusions
By using multibeam water column data and CTD data combined with numerical simulation at two seep sites, we studied the morphology, moving characteristics, dissolution process of methane bubbles in the water, and discussed the potential that gaseous methane enters the atmosphere. The major conclusions were drawn as follows.
(1) Multibeam water column data shows that methane bubbles at site I went up to 920 m water depth and did not pass the top of the GHSZ (850 m). In contrast, methane bubbles at site II passed through the top of GHSZ (597 m) and entered the non-GHSZ (550 m).
(2) Two methods were applied to calculate the bubble rising velocities at sites I and II, which were 9.6 cm/s and 24 cm/s, respectively. The bubble velocity is positively associated with water depth which is inferred to be caused by the decrease of bubble size during the ascent.
(3) Gas hydrate shell on the bubble surface plays an important role in protecting methane bubbles to enter the upper non-GHSZ. Water depth, bubble velocity, initial kinetic energy, bubble size and other factors also affect the residence time of methane bubbles in the water column and whether it can enter the atmosphere.
(4) The amount of methane leaked from both sites is estimated to be 0.4×10⁶–87.6×10⁶ mol/a. Although it is small, considering the widely distributed cold seeps in the deep oceans, methane seepage might exert important impact on the ocean acidification. Although methane gas entering the atmosphere is not observed, further research is stilled needed to answer whether deep sea methane seepage will increase the surface seawater concentration and gas-water interface methane exchanging rate, resulting in the corresponding acceleration of global warming
Acknowledgements
We thank Nabil Sultan for providing the data sets at site II. We thank the captain and crew of R/V Pourquoi pas? for their support during the GUINECO-MeBo cruise in 2011.We thank all the crew and scientists for their excellent work on the China-Pakistan Joint Marine Scientific Expedition in 2018. We also are thankful for the constructive comments from three anonymous reviewers which helped to improve the manuscript significantly.
Bangs N L, Hornbach M J, Berndt C. 2011. The mechanics of intermittent methane venting at South Hydrate Ridge inferred from 4D seismic surveying. Earth and Planetary Science Letters, 310(1): 105–112
[2]
Barnes P M, Lamarche G, Bialas J, et al. 2010. Tectonic and geological framework for gas hydrates and cold seeps on the Hikurangi subduction margin. New Zealand: Marine Geology, 272(1): 26–48
Boles J R, Clark J F, Leifer I, et al. 2001. Temporal variation in natural methane seep rate due to tides. Coal Oil Point area, California. Journal of Geophysical Research Oceans, 106(C11): 27077–27086. doi: 10.1029/2000JC000774
[5]
Bourry C, Chazallon B, Charlou J L, et al. 2009. Free gas and gas hydrates from the Sea of Marmara, Turkey: Chemical and structural characterization. Chemical Geology, 264(1–4): 197–206
[6]
Chen Y, Ding J, Zhang H, et al. 2019. Multibeam water column data research in the Taixinan Basin: Implications for the potential occurrence of natural gas hydrate. Acta Oceanologica Sinica, 38(5): 129–133. doi: 10.1007/s13131-019-1444-0
[7]
Ding L, Zhao M, Yu M, et al. 2017. Biomarker assessments of sources and environmental implications of organic matter in sediments from potential cold seep areas of the northeastern South China Sea. Acta Oceanologica Sinica, 36(10): 8–19. doi: 10.1007/s13131-017-1068-1
[8]
Egorov A V, Nigmatulin R I, Rimskii-Korsakov, et al. 2010. Breakup of deep-water methane bubbles. Oceanology, 50(4): 469–478. doi: 10.1134/S000143701004003X
[9]
Egorov A V, Nigmatulin R I, Rozhkov A N, et al. 2012. About transformation of the deep-water methane bubbles into hydrate powder and hydrate foam. Oceanology, 52(2): 194–205. doi: 10.1134/S000143701202004X
[10]
Feng D, Chen D. 2015. Authigenic carbonates from an active cold seep of the northern South China Sea: new insights into fluid sources and past seepage activity. Deep Sea Research Part II: Topical Studies in Oceanography, 122: 74–83. doi: 10.1016/j.dsr2.2015.02.003
[11]
Fischer D, Sahling H, Nöthen K, et al. 2012. Interaction between hydrocarbon seepage, chemosynthetic communities, and bottom water redox at cold seeps of the Makran accretionary prism: insights from habitat-specific pore water sampling and modeling. Biogeosciences, 9(6): 2013–2031. doi: 10.5194/bg-9-2013-2012
[12]
Greinert J. 2008. Monitoring temporal variability of bubble release at seeps: The hydroacoustic swath system GasQuant. Journal of Geophysical Research Oceans, 113: C07048
[13]
Greinert J, Artemov Y, Egorov V, et al. 2006a. 1300-m-high rising bubbles from mud volcanoes at 2080 m in the Black Sea: Hydroacoustic characteristics and temporal variability. Earth & Planetary Science Letters, 244(1): 1–15
[14]
Greinert J, McGinnis D F. 2009. Single bubble dissolution model – The graphical user interface SiBu-GUI. Environmental Modelling & Software, 24(8): 1012–1013
[15]
Greinert J, Mcginnis D F, Naudts L, et al. 2010. Atmospheric methane flux from bubbling seeps: Spatially extrapolated quantification from a Black Sea shelf area. Journal of Geophysical Research Oceans, 115: C01002
[16]
Himmler T, Birgel D, Bayon G, et al. 2015. Formation of seep carbonates along the Makran convergent margin, northern Arabian Sea and a molecular and isotopic approach to constrain the carbon isotopic composition of parent methane. Chemical Geology, 415: 102–117. doi: 10.1016/j.chemgeo.2015.09.016
[17]
Judd A A G, Hovland M. 2007, Seabed Fluid Flow: the Impact of Geology, Biology and the Marine Environment. Cambridge,UK: Cambridge University Press.
[18]
Judd A G. 2004. Natural seabed gas seeps as sources of atmospheric methane. Environmental Geology, 46(8): 988–996. doi: 10.1007/s00254-004-1083-3
[19]
Judd A G, Hovland M, Dimitrov L I, et al. 2010. The geological methane budget at continental margins and its influence on climate change. Geofluids, 2(2): 109–126
[20]
Klaucke I, Weinrebe W, Petersen C J, et al. 2010. Temporal variability of gas seeps offshore New Zealand: Multi-frequency geoacoustic imaging of the Wairarapa area, Hikurangi margin. Marine Geology, 272(1): 49–58
[21]
Leifer I, Luyendyk B , Boles J, et al. 2006. Natural marine seepage blowout: Contribution to atmospheric methane. Global Biogeochemical Cycles, 20: GB3008
[22]
Lelieveld J, Crutzen P J, Dentener F J. 1998. Changing concentration, lifetime and climate forcing of atmospheric methane: Tellus B. Chemical and Physical Meteorology, 50(2): 128–150
[23]
Li C, Gou L, You J, et al. 2016. Further studies on the numerical simulation of bubble plumes in the cold seepage active region. Acta Oceanologica Sinica, 35(1): 118–124. doi: 10.1007/s13131-016-0803-3
[24]
Liu L, Fu S, Zhang M, et al. 2017. Coupled carbon and sulfur isotope behaviors and other geochemical perspectives into marine methane seepage. Acta Oceanologica Sinica, 36(6): 12–22. doi: 10.1007/s13131-017-0998-y
[25]
Loher M, Marcon Y, Pape T, et al. 2018. Seafloor sealing, doming, and collapse associated with gas seeps and authigenic carbonate structures at Venere mud volcano, Central Mediterranean: Deep Sea Research Part I. Oceanographic Research Papers, 137: 76–96. doi: 10.1016/j.dsr.2018.04.006
[26]
McGinnis D F, Greinert J, Artemov Y, et al. 2006. Fate of rising methane bubbles in stratified waters: How much methane reaches the atmosphere?. Journal of Geophysical Research: Oceans, 111: C09007
[27]
Mcneil K. 2009. Considerable methane fluxes to the atmosphere from hydrocarbon seeps in the Gulf of Mexico. Nature Geoscience, 2(8): 561–565
[28]
Muyakshin S I, Sauter E. 2010. The hydroacoustic method for the quantification of the gas flux from a submersed bubble plume. Oceanology, 50(6): 995–1001. doi: 10.1134/S0001437010060202
[29]
Myhre C L, Ferré B, Platt S M, et al. 2016. Extensive release of methane from Arctic seabed west of Svalbard 5 during summer 2014 does not influence the atmosphere. Geophysical Research Letters, 43(9): 4624–4631. doi: 10.1002/2016GL068999
[30]
Nikolovska A, Sahling H, Bohrmann G. 2008. Hydroacoustic methodology for detection, localization, and quantification of gas bubbles rising from the seafloor at gas seeps from the eastern Black Sea. Geochemistry, Geophysics, Geosystems, 9: Q10010
[31]
Olsen J E, Dunnebier D, Davies E, et al. 2017. Mass transfer between bubbles and seawater. Chemical Engineering Science, 161: 308–315. doi: 10.1016/j.ces.2016.12.047
[32]
Römer M, Sahling H, Pape T, et al. 2012. Quantification of gas bubble emissions from submarine hydrocarbon seeps at the Makran continental margin (offshore Pakistan). Journal of Geophysical Research: Oceans, 117: C10015
[33]
Rehder G, Brewer P W, Peltzer E T, et al. 2002a. Enhanced lifetime of methane bubble streams within the deep ocean. Geophysical Research Letters, 29(15): 21–24. doi: 10.1029/2002GL014864
[34]
Rehder G, Collier R W, Heeschen K, et al. 2002b. Enhanced marine CH4 emissions to the atmosphere off Oregon caused by coastal upwelling. Global Biogeochemical Cycles, 16: 3
[35]
Rehder G, Leifer I, Brewer P G,et al. 2009. Controls on methane bubble dissolution inside and outside the hydrate stability field from open ocean field experiments and numerical modeling. Marine Chemistry, 114(1): 19–30
[36]
Riedel M. 2007. 4D seismic time-lapse monitoring of an active cold vent, northern Cascadia margin. Marine Geophysical Researches, 28(4): 355–371. doi: 10.1007/s11001-007-9037-2
[37]
Sauter E J, Muyakshin S I, Charlou J L, et al. 2006. Methane discharge from a deep-sea submarine mud volcano into the upper water column by gas hydrate-coated methane bubbles. Earth & Planetary Science Letters, 243(3): 354–365
[38]
Sloan E D, Koh C. 2007. Clathrate Hydrates of Natural Gases. New York: CRC Press.
[39]
Solomon E A, Kastner M, MacDonald I R, et al. 2009. Considerable methane fluxes to the atmosphere from hydrocarbon seeps in the Gulf of Mexico. Nature Geosci, 2(8): 561–565. doi: 10.1038/ngeo574
[40]
St Louis V L, Jwm D E R, Rosenberg D M, et al. 2000. Reservoir surfaces as sources of greenhouse gases to the atmosphere: A global estimate. Bioscience, 50(9): 766–775. doi: 10.1641/0006-3568(2000)050[0766:RSASOG]2.0.CO;2
[41]
Sultan N, Bohrmann G, Ruffine L, et al. 2014. Pockmark formation and evolution in deep water Nigeria: Rapid hydrate growth versus slow hydrate dissolution. Journal of Geophysical Research: Solid Earth, 119(4): 2679–2694. doi: 10.1002/2013JB010546
[42]
Sun S, Liu C, Ye Y, et al. 2014. Pore capillary pressure and saturation of methane hydrate bearing sediments. Acta Oceanologica Sinica, 33(10): 30–36. doi: 10.1007/s13131-014-0538-y
[43]
Sun T, Wu D, Yang F, et al. 2019. Sedimentary geochemical proxies for methane seepage at Site C14 in the Qiongdongnan Basin in the northern South China Sea. Acta Oceanologica Sinica, 38(7): 84–95. doi: 10.1007/s13131-019-1460-6
[44]
Torres M E, Wallmann K, Tréhu A M, et al. 2004. Gas hydrate growth, methane transport, and chloride enrichment at the southern summit of Hydrate Ridge, Cascadia margin off Oregon. Earth and Planetary Science Letters, 226(1–2): 225–241. doi: 10.1016/j.jpgl.2004.07.029
[45]
Tréhu A M, Stakes D S, Bartlett C D, et al. 2003. Seismic and seafloor evidence for free gas, gas hydrates, and fluid seeps on the transform margin offshore Cape Mendocino. Journal of Geophysical Research: Solid Earth (1978–2012), 108: doi: 10.1029/2001JB001679
[46]
Tréhu A M, Torres M E, Moore G F, et al. 1999. Temporal and spatial evolution of a gas hydrate bearing accretionary ridge on the Oregon continental margin. Geology, 27(10): 939. doi: 10.1130/0091-7613(1999)027<0939:TASEOA>2.3.CO;2
[47]
Tryon M D, Brown K M, Torres M E, et al. 1999. Measurements of transience and downward fluid flow near episodic methane gas vents, Hydrate Ridge, Cascadia. Geology, 27(12): 1075–1078. doi: 10.1130/0091-7613(1999)027<1075:MOTADF>2.3.CO;2
[48]
Wang J, Wu S, Xiu K, et al. 2018. Subsurface fluid flow at an active cold seep area in the Qiongdongnan Basin, northern South China Sea. Journal of Asian Earth Sciences, 168: 48–56. doi: 10.1016/j.jseaes.2018.01.020
[49]
Wei J, Fang Y, Lu H, et al. 2018. Distribution and characteristics of natural gas hydrates in the Shenhu Sea Area, South China Sea. Marine and Petroleum Geology, 98: 622–628. doi: 10.1016/j.marpetgeo.2018.07.028
[50]
Wei J, Li J, Wu T, et al. 2020. Geologically controlled intermittent gas eruption and its impact on bottom water temperature and chemosynthetic communities—A case study in the “HaiMa” cold seeps, South China Sea. Geological Journal, : doi: https://doi.org/10.1002/gj.3780
[51]
Wei J, Liang J, Lu J, et al. 2019. Characteristics and dynamics of gas hydrate systems in the northwestern South China Sea - Results of the fifth gas hydrate drilling expedition. Marine and Petroleum Geology, 110: 287–298. doi: 10.1016/j.marpetgeo.2019.07.028
[52]
Wei J, Pape T, Sultan N, et al. 2015. Gas hydrate distributions in sediments of pockmarks from the Nigerian margin – Results and interpretation from shallow drilling. Marine and Petroleum Geology, 59: 359–370. doi: 10.1016/j.marpetgeo.2014.09.013
[53]
Wu T, Wei J, Liu S, et al. 2019. Characteristics and formation mechanism of seafloor domes on the north-eastern continental slope of the South China Sea. Geological Journal, 55: 1–10
[54]
Ye J, Qin X, Qiu H, et al. 2018. Preliminary results of environmental monitoring of the natural gas hydrate production test in the South China Sea. China Geology, 1(2): 202–209. doi: 10.31035/cg2018029
[55]
Ye J, Wei J, Liang J, et al. 2019. Complex gas hydrate system in a gas chimney, South China Sea. Marine and Petroleum Geology, 104: 29–39. doi: 10.1016/j.marpetgeo.2019.03.023
[56]
Yin X, Zhou H, Yang Q, et al. 2008. The evidence for the existence of methane seepages in the northern South China Sea: abnormal high methane concentrations in bottom waters. Acta Oceanologica Sinica, 27(6): 62–70
[57]
Zhang M, Lu H, Guan H, et al. 2018. Methane seepage intensities traced by sulfur isotopes of pyrite and gypsum in sediment from the Shenhu area, South China Sea. Acta Oceanologica Sinica, 37(7): 20–27. doi: 10.1007/s13131-018-1241-1
Qianli Zhang, Shuo Bi, Yingchun Xie, et al. FMAW-YOLOv5s: A deep learning method for detection of methane plumes using optical images. Applied Ocean Research, 2024, 153: 104217. doi:10.1016/j.apor.2024.104217
2.
Ting Hu, Tao Yang, Birol Dindoruk, et al. Investigation the impact of methane leakage on the marine carbon sink. Applied Energy, 2024, 360: 122880. doi:10.1016/j.apenergy.2024.122880
3.
Xianqing Wang, Siqing Liu, Bin Zhao, et al. Quantitative analysis of the risk of hydrogen sulfide release from gas hydrates. Frontiers in Earth Science, 2023, 10 doi:10.3389/feart.2022.1018325
4.
Fanlin Yang, Feng Wang, Zhendong Luan, et al. Automatic segmentation of gas plumes from multibeam water column images using a U-shape network. Journal of Oceanology and Limnology, 2023, 41(5): 1753. doi:10.1007/s00343-022-2139-5
5.
Tonggang Han, Jiangxin Chen, Leonardo Azevedo, et al. Quantitative estimation of bubble volume fraction of submarine seep plumes by modeling seismic oceanography data. Journal of Oceanology and Limnology, 2023, 41(2): 673. doi:10.1007/s00343-022-1413-x
6.
Xie Rui, Wu Daidai, Wei Jiangong, et al. The Enrichment Mechanism of REE at Sulfate and Methane Transition Zone (SMTZ) of the Northern Part of the South China Sea. Geofluids, 2022, 2022: 1. doi:10.1155/2022/7571792
7.
Linqi Zhu, Jiangong Wei, Shiguo Wu, et al. Application of unlabelled big data and deep semi-supervised learning to significantly improve the logging interpretation accuracy for deep-sea gas hydrate-bearing sediment reservoirs. Energy Reports, 2022, 8: 2947. doi:10.1016/j.egyr.2022.01.139
8.
Jiangong Wei, Tingting Wu, Xiguang Deng, et al. Seafloor methane emission on the Makran continental margin. Science of The Total Environment, 2021, 801: 149772. doi:10.1016/j.scitotenv.2021.149772
9.
Tingting Wu, Xiguang Deng, Huiqiang Yao, et al. Distribution and development of submarine mud volcanoes on the Makran Continental Margin, offshore Pakistan. Journal of Asian Earth Sciences, 2021, 207: 104653. doi:10.1016/j.jseaes.2020.104653
10.
Jiangong Wei, Tingting Wu, Wei Zhang, et al. Deeply Buried Authigenic Carbonates in the Qiongdongnan Basin, South China Sea: Implications for Ancient Cold Seep Activities. Minerals, 2020, 10(12): 1135. doi:10.3390/min10121135
11.
Xingrong Chen, Zenghong Liu, Haiyan Wang, et al. Significant salinity increase in subsurface waters of the South China Sea during 2016–2017. Acta Oceanologica Sinica, 2019, 38(11): 51. doi:10.1007/s13131-019-1498-z
Figure 1. Location of two deep sea cold seep sites. Site I is located at 1 832 m water depth on the Makran accretion wedge offshore Pakistan. Site II is located at 1 140 m water depth on the Nigeria continental Margin, Gulf of Guinea.
Figure 2. Fan-shaped multibeam water column data showing gas flares in high reflections from seafloor at site I. a–d. Four independent multibeam investigations at site I with research vessel static by dynamic positioning. The colors represent the intensity of the acoustic impendence (red: high, green: medium, blue: low).
Figure 4. Stacked multibeam water column data and manually drawn dashed lines for calculating bubble velocity using the first method. White lines represent the top of GHSZ at site I, red line at 920 m illustrates the depth where most gas bubbles disappeared. a–c and e correspond to the Fan-shaped images in Figs 2a–d in time series; d and f are enlarged images of c.
Figure 3. Fan-shaped multibeam water column data showing gas flares in high reflections from seafloor at site Ⅱ. a–d. Dynamic changes of the gas flares and gas plumes in time series for one investigation with ship dynamic positioned.
Figure 5. Gas hydrate phase boundaries estimated at sites I (a) and II (b). The top of the GHSZ is at 850 and 597 m at site I and site II, respectively. The right images illustrate the major gas hydrate formation and decomposition during ascending.
Figure 6. Height of bubble velocity changed with time at site II. The height of the gas plume is represented by the centre of the manually drawn cycle. The corresponding liner regressions of depth and time in a and b are denoted in c. “Time break” in Fig. 5a shows the point where a piece of video is missing.
Figure 7. Positive correlations between bubble rising velocity and water depth at site I. a. Linear regression of rising velocity and water depth of individual investigation at site I (brown: Fig. 2a, green: Fig. 2b, red: Figs 2c, d) and b. linear regression of all the investigations.
Figure 8. Dissolution process of methane bubbles based on the numerical simulation at site I. Red cycle at the key point which were discussed in Section 4.2.
Figure 9. Dissolution process of methane bubbles based on the numerical simulation at site II.


 DownLoad:


 DownLoad:


 DownLoad: