Shoujin Liu, Jian Lin, Zhiyuan Zhou, Fan Zhang. Large along-axis variations in magma supply and tectonism of the Southeast Indian Ridge near the Australian-Antarctic Discordance[J]. Acta Oceanologica Sinica, 2020, 39(1): 118-129. doi: 10.1007/s13131-019-1518-z
Citation:
Shoujin Liu, Jian Lin, Zhiyuan Zhou, Fan Zhang. Large along-axis variations in magma supply and tectonism of the Southeast Indian Ridge near the Australian-Antarctic Discordance[J]. Acta Oceanologica Sinica, 2020, 39(1): 118-129. doi: 10.1007/s13131-019-1518-z
Shoujin Liu, Jian Lin, Zhiyuan Zhou, Fan Zhang. Large along-axis variations in magma supply and tectonism of the Southeast Indian Ridge near the Australian-Antarctic Discordance[J]. Acta Oceanologica Sinica, 2020, 39(1): 118-129. doi: 10.1007/s13131-019-1518-z
Citation:
Shoujin Liu, Jian Lin, Zhiyuan Zhou, Fan Zhang. Large along-axis variations in magma supply and tectonism of the Southeast Indian Ridge near the Australian-Antarctic Discordance[J]. Acta Oceanologica Sinica, 2020, 39(1): 118-129. doi: 10.1007/s13131-019-1518-z
Key Laboratory of Ocean and Marginal Sea Geology, South China Sea Institute of Oceanology, Chinese Academy of Sciences, Guangzhou 510301, China
2.
University of Chinese Academy of Sciences, Beijing 100049, China
3.
Department of Geology and Geophysics, Woods Hole Oceanographic Institution, Woods Hole, MA 02543, USA
4.
Innovation Academy of South China Sea Ecology and Environmental Engineering, Chinese Academy of Sciences, Guangzhou 523936, China
Funds:
The National Key R&D Program of China under contract Nos 2018YFC0310105 and 2018YFC0309800; the China Ocean Mineral Resources R&D Association under contract No. DY135-S2-1-04; the National Natural Science Foundation of China under contract Nos 41890813, 91628301, 41976066, 41706056, 41976064, 91858207 and U1606401; the Chinese Academy of Sciences under contract Nos Y4SL021001, QYZDY-SSW-DQC005 and 133244KYSB20180029; the Southern Marine Science and Engineering Guangdong Laboratory (Guangzhou) under contract No. GML2019ZD0205.
We analyzed seafloor morphology and geophysical anomalies of the Southeast Indian Ridge (SEIR) to reveal the remarkable changes in magma supply along this intermediate fast-spreading ridge. We found systematic differences of the Australian-Antarctic Discordance (AAD) from adjacent ridge segments with the residual mantle Bouguer gravity anomaly (RMBA) being more positive, seafloor being deeper, morphology being more chaotic, M factors being smaller at the AAD. These systematic anomalies, as well as the observed Na8.0 being greater and Fe8.0 being smaller at AAD, suggest relatively starved magma supply and relatively thin crust within the AAD. Comparing to the adjacent ridges segments, the calculated average map-view M factors are relatively small for the AAD, where several Oceanic Core Complexes (OCCs) develop. Close to 30 OCCs were found to be distributed asymmetrically along the SEIR with 60% of OCCs at the northern flank. The OCCs are concentrated mainly in Segments B3 and B4 within the AAD at ~124°–126°E, as well as at the eastern end of Zone C at ~115°E. The relatively small map-view M factors within the AAD indicate stronger tectonism than the adjacent SEIR segments. The interaction between the westward migrating Pacific mantle and the relatively cold mantle beneath the AAD may have caused a reduction in magma supply, leading to the development of abundant OCCs.
The Oceanic Core Complex (OCC) features were interpreted to be the result of prolonged localized tectonic extension in oceanic lithosphere, resulting in rotated and uplifted foot wall of a normal fault exhibiting corrugated surface (Tucholke and Lin, 1994; Cann et al., 1997; Tucholke et al., 1998; MacLeod et al., 2009). Most of OCC features were observed at slow- (full spreading rates of 20–40 mm/a) or ultraslow-spreading (<20 mm/a) ridges, where the magma supply is relatively low comparing to the fast- (>80 mm/a) and intermediate fast-spreading (40–80 mm/a) ridges. Globally, nearly 200 Oceanic Core Complexes (OCCs) have been identified, most of them were found on slow- and ultraslow-spreading ridges, e.g., the northern Mid-Atlantic Ridge (MAR) and Southwest Indian Ridge (SWIR) (Ciazela et al., 2015). Several OCCs were also found on ridges of moderate spreading rates, e.g., the Southeast Indian Ridge (SEIR) (Christie et al., 1998), the Chile Ridge (Okino et al., 2004), and the Parece Vela backarc basin (Ohara et al., 2001). Noticeably, a cluster of OCCs, including a prominent example of 50-km-long corrugation, were observed in the AAD on the intermediate fast-spreading SEIR (Okino et al., 2004).
Our study region on the SEIR is located at 54°–44°S and 108°–134°E. It has relatively constant full spreading rates of 72–76 mm/a (Weissel and Hayes, 1971) and includes eight spreading segments that are separated by nine prominent transform faults (Fig. 1). Several second-order offsets also exist, which are separated by small transform and non-transform discontinuities. Weissel and Hayes (1971) first divided the SEIR south of Australia into three zones. We adopted the same zone names but modified the zone boundaries as Zone A (~128°–134°E), Zone B (~120°–127°E), and Zone C (~108°–120°E). The overall topography of Zones A and C is shallower than that of Zone B. Zones A and C include a series of short segments separated by propagating rifts and transform faults. Zone B, which is also called the AAD, can be further divided into five segments (B1–B5) from east to west, bounded by the Birubi, Euroka, Lutana, Warringa, Nalkari, and Baroga transform faults, respectively (Hayes and Conolly, 1972; Vogt et al., 1983). The AAD region is characterized by anomalously deep seafloor compared with the average seafloor age-depth relation (Hayes, 1988). About 30 Ma ago, chaotic topography began to develop in the AAD, indicating relatively weak magma supply, which might be caused by cold spot, mantle convective downwelling, and/or pre-Cretaceous remnant slab (Anderson et al., 1980; Klein et al., 1991; Christie et al., 1998; Gurnis et al., 1998). The AAD region also shows prominent axial valleys (Fig. 1), which are typical of slow- and ultraslow-spreading ridges, e.g., the MAR and SWIR (Lin et al., 1990; Macdonald, 1990; Dick et al., 2003).
Figure
1.
Topography map of the study region. The Southeast Indian Ridge (SEIR) and the study region are shown as red lines and red rectangle, respectively, on the regional setting map (inset map). Black dashed lines, black short double lines, and green lines are the main fracture zones, ridge axes, and propagating rifts, respectively. The study region is divided into Zones A, B, and C; the Australian–Antarctic Discordance (AAD) includes 5 segment corridors of B1 to B5; Zones A and C have 3 and 5 segments, respectively. The boundaries are modified from Weissel and Hayes (1971) and Vogt et al. (1983). Red curve is the trace of the Indian/Pacific MORB mantle boundary from Christie et al. (2004). AF represents the African plate,AN the Antarctica plate, and AU the Australian plate.
Since the spreading rate is relatively uniform along our study region on the SEIR, other factors such as magma supply are expected to play an important role in shaping the seafloor morphology and tectonic deformation. Buck et al. (2005) modeled seafloor morphology and normal faulting, showing that 95% of the plate separation on the SEIR at 115°E of Zone C is result of magma intrusion (i.e., M=0.95). Behn and Ito (2008) found M=0.7–0.8 on the SEIR at 114.2°–114.3°E of Zone C. However, the detail variations in tectonic deformation along the SEIR and the potential controlling factors are still poorly known.
In this study, we investigated the role of melt supply in the development of morphologic features and crustal structures along the SEIR. We first conducted a detailed analysis of morphology and gravity anomalies. We then developed a new 2D map-view method to quantify the percentage of seafloor surface area occupied by fault scarps and to calculate the percentage of seafloor area created by magmatic accretion (i.e., the M factor). We also identified the exact boundary of individual OCCs and calculated the M factor of these areas. Finally, we analyzed the results of gravity anomalies and M factors together with geochemical constraints. The combination of the results indicates a strong link among cold mantle source, limited magma supply, thin crust, and widespread development of OCCs.
2.
Data and methods
2.1
Bathymetry
The topographic data used in this study are the merged datasets of global bathymetry data in 15″ grid and multi-beam bathymetry data where available. The global bathymetry data were obtained from the University of California, San Diego (SRTM15_PLUS Version 1, http://topex.ucsd.edu/marine_topo/). Multi-beam bathymetry data were obtained mostly from the Marine Geoscience Data System (MGDS, http://www.marine-geo.org/portals/gmrt/) and National Geophysical Data Center (NGDC, http://maps.ngdc.noaa.gov/viewers/autogrid/). Part of the multi-beam bathymetry data for Segment B3 were collected by Okino et al. (2004). The resampled grid size of all multi-beam bathymetry data is about 100 m × 100 m. Multi-beam bathymetry data cover several areas including regions at 108°–118°E, 124°–126°E, and a northern box at 126°–128°E. Most of the multi-beam bathymetry data cover regions of more than 50 km in width to both sides of the SEIR axis. The global bathymetry of 15″ grid size was used for areas without multi-beam bathymetry.
2.2
Sediment thickness and crustal age
The sediment thickness data were obtained from the NGDC (http://www.ngdc.noaa.gov/mgg/sedthick/sedthick.html) with 5′ grid size. The sediment layer is relatively thin in our study area with average thickness of ~130 m. The average sediment thickness north of the SEIR is smaller than the conjugate southern flank by ~100 m. The crustal age data were obtained from the NGDC (http://www.ngdc.noaa.gov/mgg/ocean_age/ocean_age_2008.html) with 2′ grid size(Müller et al., 2008).
2.3
Gravity anomalies and crustal thickness
The free-air gravity anomaly (FAA) data were obtained from the global marine gravity model data base with 1′ grid size (Sandwell et al., 2014). We calculated the mantle Bouguer gravity anomaly (MBA) by subtracting from the FAA the gravitational effects of (1) water-sediment; (2) sediment-crust; and (3) crust-mantle interfaces with an assumed 6-km-thick reference crust. The sediment density is assumed to increase with depth (e.g., Wang et al., 2011) from 1 950 kg/m3 to 2 600 kg/m3 with an assumed depth gradient of 15 kg/m3 per 100 m. The densities of water, crust, and mantle were assumed to be 1 030, 2 700, and 3 300 kg/m3, respectively. The Fourier spectrum method of Parker (1973) was used in the calculation.
We further calculated the residual mantle Bouguer gravity anomaly (RMBA) by subtracting from the MBA the gravitational effects of lithospheric cooling (Wang et al., 2011). We assumed a model of 1D vertical plate cooling for the corresponding crustal age, assuming temperature of 1 350°C at the mantle depth of 100 km and thermal expansion coefficient of 3.5×10⁻⁵ °C–1. The 3D temperature field was then converted into a density anomaly grid by Δρ=ρ0αΔT, where ρ0, α, and ΔT are the reference mantle density, thermal expansion coefficient, and temperature anomaly relative to a reference point in the mantle, respectively (Parker, 1973; Kuo and Forsyth, 1988; Lin et al., 1990).
Finally, we calculated an end-member crustal thickness model by downward continuing the RMBA signals to the bottom of the assumed 6-km-thick reference crust. A cosine taper low-pass filter between 25 and 100 km was used to ensure stability in downward continuation (Oldenburg, 1974; Kuo and Forsyth, 1988).
2.4
Estimation of M factors
The M factor is defined as the fraction of total seafloor spreading accommodated by magma accretion (Buck et al., 2005; Behn and Ito, 2008). In this study, we analyzed multi-beam bathymetry to estimate the spatial variations in the M factor. Since the sediment layer is relatively thin (usually <500 m) near the SEIR axis, we neglected the sediment when analyzing faults.
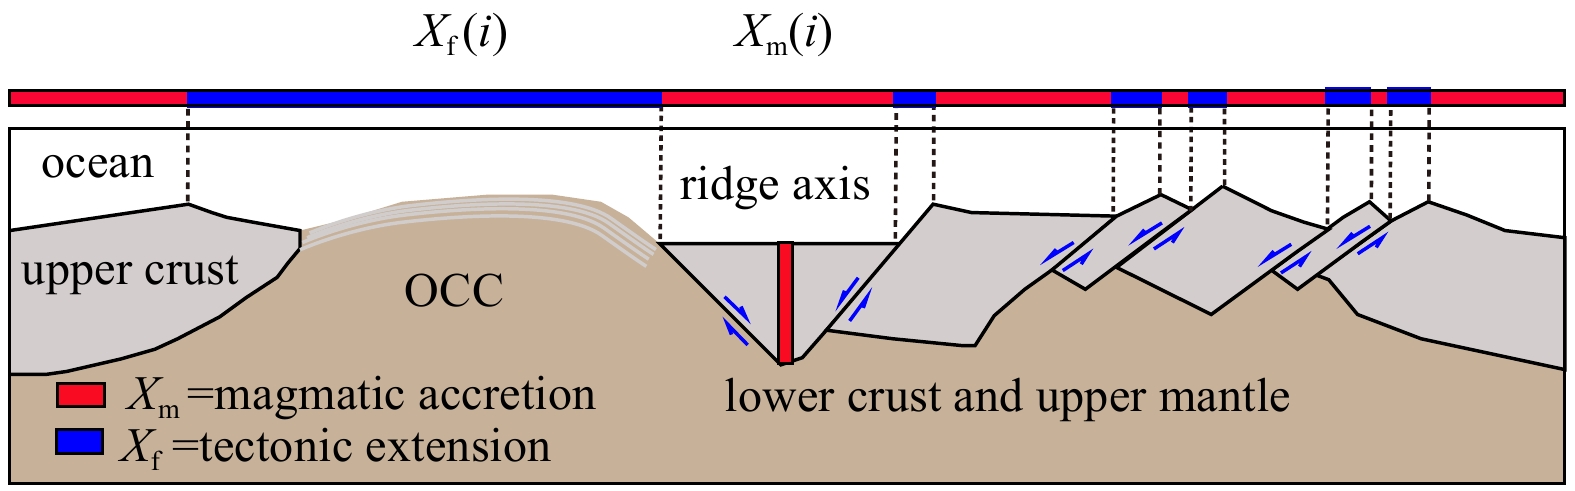
The M factor along an individual ridge-perpendicular profile could be estimated by calculating the cumulative fault heaves along the profile normalized by the profile length: M=1–∑Xf/(∑Xf+∑Xm), where ∑Xf is the cumulative length of fault heaves along the profile, while ∑Xm is the cumulative length not covered by fault heaves (Fig. 2).
Figure
2.
Illustrasion map of M factors calculation. The M factor is calculated from topographic profile, as modified from Smith (2013). The blue stripe (Xf) is the horizontal projection of fault surface. The blue and red (Xm) stripes represent tectonic extension and magmatic accretion regions, repectively. M factor can be evaluated by M=$\frac{{\displaystyle\sum {X_{\rm m}} }}{{\displaystyle\sum {X_{\rm f} + \displaystyle\sum {X_{\rm m}} } }}$. The blue arrow is the moving direction relative to the conjugated fault block. The water, upper crust, and the lower crust/upper mantle are represented by white, light gray, and light brown areas, respectively. Red vertical box represents the ridge axis.
We also calculated the M factors in two-dimensional map view. The study region with multi-beam bathymetry data was divided into a mosaic of small boxes. Each box has spatial dimension of ~12 km×7 km and contains several faults. The fault surfaces (i.e., fault scarps) exposed in each box were manually identified and digitized. We calculated the map-view M factors as M=1–∑Sf/(∑Sf+∑Sm), where ∑Sf is the total area of fault surfaces in map view, while ∑Sm is the total area not covered by faults surfaces.
For a certain sliding sampling box K×L, the fault scarp F(i) can be treated as enveloped by curves of h(x) and g(x), while L and K are parallel and perpendicular to the ridge axis, respectively; x is parallel to the ridge axis. The area S(i) can be calculated by Eq. (1):
The left-hand-side of Eq. (3) is the map view ratio of faults while the right-hand-side of Eq. (3) is a single profile ratio of faults.
We calculated the map-view M factors for all ridge segments in the study region (Fig. 1), except for Segments B1 and B2, where multi-beam bathymetry is lacking. The sampling box size is ~12 km × 7 km, and the sliding step length is ~9 km and 5 km, respectively, along and perpendicular to the ridge axis. The mean map-view M factors of each segment were also calculated. Through calculating the spatial variations in the 2D map view, we could obtain critical information on magma-to-tectonic ratio both along and across the SEIR axis.
2.5
Simulation of lithospheric deformation as a function of M factor
To better understand the causes of the observed large variations in the SEIR tectonics, we conducted geodynamic simulations of lithospheric deformation for average spreading rates similar to that of the SEIR, but varying the M factor. The simulations were carried out using the 2D Fast Lagrangian Analysis Continua (FLAC) that has previously been used to model ridge deformation (Cundall, 1989; Buck et al., 2005; Behn and Ito, 2008; Tucholke et al., 2008; Olive et al., 2010). Our model is 40 km in width and 10 km in depth with grid size of ~ 0.18 km × 0.2 km. The magma is injected and fixed at the center of the ridge axis with a narrow rectangle injection region of ~ 0.18 km × 6 km. The temperatures of the top and bottom boundaries are set to 0°C and 1 300°C, respectively. The heat source associated with magma injection at the ridge axis is added in proportion to the magma injection rate (Behn and Ito, 2008). The spatial variations in the elastic, viscous, and plastic deformation of the crust and mantle depend on the temperature, strain rate, and accumulated plastic strain. The faulting-related plastic yielding follows the Mohr-Coulomb criterion, while the cohesion is assumed to decrease linearly from 44 MPa to 4 MPa when a fault develops, as was required to model the fault formation processes in mid-ocean ridges (Lavier et al., 2000) and subducting plates (Zhou et al.,2015; Zhou et al., 2018; Zhou and Lin, 2018). The thermal diffusion perturbation due to faulting is taken into consideration. The modeling time step is 25 ka, and remeshing occurs when any distorted triangles are greater than 5° (Lavier and Buck, 2002).
We modeled five cases with M factor of 0.2, 0.4, 0.6, 0.8, and 1.0, respectively, to investigate the resultant faulting style characteristics (Fig. 4). After multiple modeling steps, the temperature structure and fault style become steady state, and thus the resultant fault pattern could be considered as representing the specific M factor. In our models, we chose t = 0.7 Ma as the end time for comparison, at which time all simulations have reached steady state.
Figure
4.
Results of FLAC geodynamic simulation for M factors of M=0.2 (a, b), M=0.4 (c, d), M=0.6 (e, f ), M=0.8 (g, h), and M=1.0 (I, j). Left and right columns are the claculated strain rate and temperature, respectively, at the model running time of 0.7 Ma, when the models have reached steady state. Magma injection is imposed at the ridge axis in a dike of 0.18 km wide and at depth of 0–6 km from the seafloor. The simulation grid size is 0.18 km ×0.22 km. The cohesion of the deforming layer is assumed to decrease with plastic strain after yielding. The intial layer cohesion is 44 MPa, and the deformation plane is assumed to lose its conhesion linearly to 4 MPa at deformation offset of ~200 m. Intial axial lithospheric thickness is ~6 km.
The map-view M factors were calculated for all segments of the study region with sufficient multi-beam bathymetry, including Segment A1 (Fig. 3a, b), C1 and C2 (Figs 3c-f), C3 and C4 (Fig. 3g-j), C5 and B3 (Figs 3k–n), and B4 and B5 (Fig. 3o-r). Segments B1 and B2 lack sufficient multi-beam bathymetry and thus were not included in the analysis. While all results (Fig. 3) are shown for a specified sampling box size of ~12 km×7 km, analyses using varying sampling box sizes have yielded generally similar conclusions.
Figure
3.
Map of shaded topography, identified fault scarps, and calculated map-view M factor for Segments A1 ( a, b ), C1 ( c, d ), C2 ( e, f ), C3 ( g, h), C4 ( i, j ), C5 ( k, l), B3 ( m, n ), B4 ( o, p ), and B5 ( q, r ), respectively. For each ridge segment, the shaded topographic maps are based on multi-beam bathymetry data ( a, c, e, g, i, k, m, o and q ). The map-view M factors (MVM, color shades) were calculated using a sliding sampling box of ~12 km ×7 km, while the fault scarps (black stripes) were identified from 3D topography and topographic slopes ( b, d, f, h, j, l, n, p, and r ). Both the white and green double lines are the ridge axes.
For ridge segments outside the AAD, including Segments A1 (Figs 3a,b), C1 and C2 (Figs 3c-f), and C3 and C4 (Figs 3g–j), the calculated map-view M factors are in the range of 0.7–1.0 with peak values of ~0.85–0.92. These five segments have similar observed faulting style that appears to resemble the predicted lithospheric deformation pattern by the FLAC numerical simulation for M=0.8 (i.e., Figs 4g-h). For this relatively high M value, faults are predicted to develop successively on both ridge flanks with fault spacing of about several kilometers. Buck et al. (2005) compared the results of FLAC simulations with a topographic profile across the SEIR axis, yielding an estimated M factor of ~ 0.95 for a profile at 115°E within Segment C4. Meanwhile, Behn and Ito (2008) estimated a M factor of ~ 0.7–0.8 for a profile at 114.2°–114.3°E, also within Segment C4. Thus the average values from our map-view M factor analysis are consistent with the previous estimates based on selected profiles across Segment C (Buck et al., 2005; Behn and Ito, 2008).
For ridge segment within the AAD, including Segments C5 and B3 (Figs 3k–n) and B4 and B5 (Figs 3o–r), however, the map-view M factor exhibits a wide range of variations from 0 to 1. The M factors for profiles across the OCCs are calculated to be in the range of ~0.3–0.6.
Meanwhile, for cases of limited magma supply, i.e., M≤~0.6 (Figs 4a-f), the FLAC simulations predict long-lived faults of large fault scarp (tens of kilometers) and relatively small dip angle. These results are consistent with previous FLAC simulations for M factor of 0.3–0.5 (Tucholke et al., 2008). The observed strong tectonism and asymmetrical accretion at the ridge segments within the AAD are similar to that of the MAR at 12.5°–35°N where a single detachment fault can accommodate 50% of the plate separation on one flank of the ridge axis (Escartín et al., 2008). In particular, Segment B4 (Figs 3o-p) and the eastern part of Segment B3 (Figs 3m-n), both of which are located within the AAD, exhibit irregular topography of faulting. Such topographic features are consistent with the faulting pattern predicted by the FLAC simulations for M≤0.6 (Figs 4a-f). Such areas of extensive faulting would facilitate lithospheric weakening and water penetration into the mantle (e.g., Olive et al., 2010; Zhou and Lin, 2018).
Although the fault scarps might be affected by the subsequent geological process, we employed the same approach for calculating the M factor for the entire study region, and thus the relative differences in the M factor between sub-regions are of geological significance. Furthermore, we focused on the variations of the M factors of the AAD in comparison to adjacent segments. Therefore, the uncertainties in the calculation of absolute value of the M factor have little influence on our main results.
In summary, the ridge segments within the AAD (Zone B, Fig. 1) appear to have limited magma supply, as indicated by the smaller map-view M factors than the adjacent segments. Within the AAD, Segment B4 and the eastern part of Segment B3 have the smallest M values, implying that they may be undergoing the strongest tectonic extension in comparison to other segments.
3.2
OCCs and correlation with RMBA
The RMBA varies significantly in the study region (Fig. 5b), indicating strong spatial variations in magma supply. In the flow line direction, the area of more positive RMBA (red shaded areas in Fig. 5b) are much wider for ridge segments within the AAD than the adjacent segments. The off-axis distance of the regions with RMBA≥20 mGal is 2–6 times greater within the AAD than the adjacent segments. Furthermore, the RMBA contours show systematic westward along-axis trends. Such trends are consistent with the westward direction of propagating rifts at Segment A1 (Figs 1 and 5a).
Figure
5.
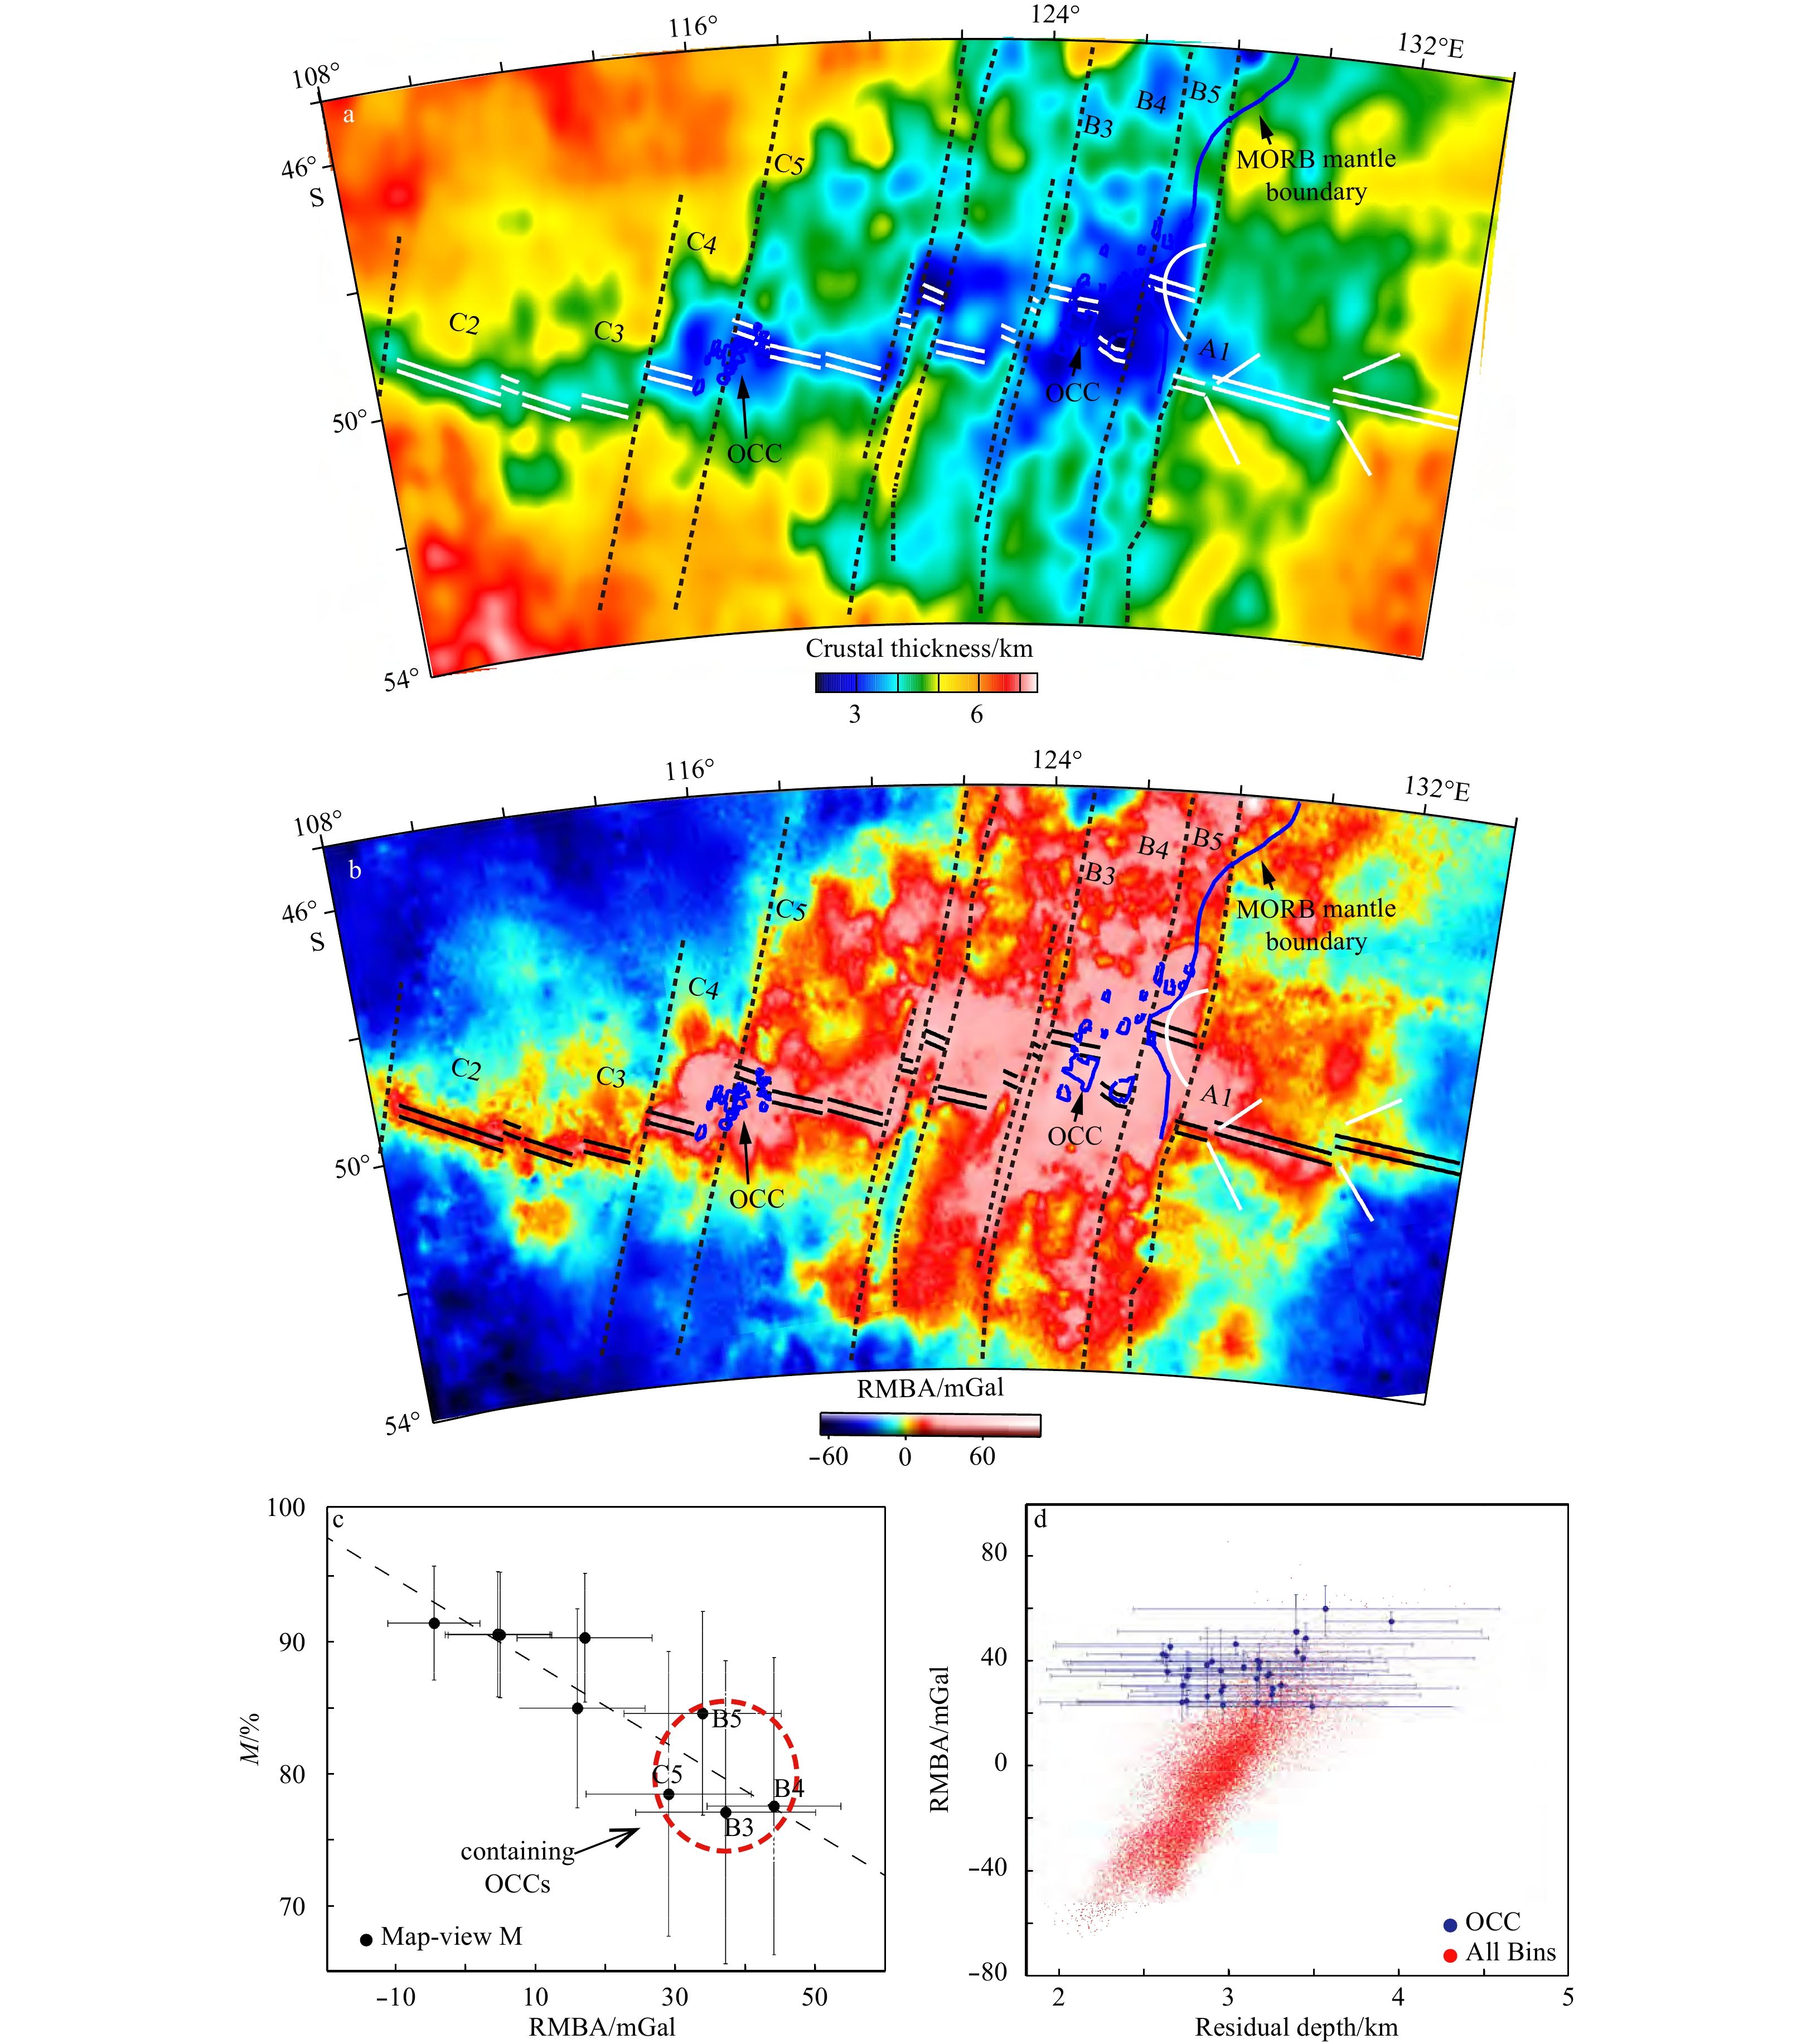
Map of gravity-derived crustal thickness (a), RMBA of the study region in b correlation between RMBA and M factors (c), and correlation between residual depth and RMBA (d). Small regions with blue enclosed contous in b. indicate OCCs. Black points in (c) represents mean map-view M factor and average RMBA of ridge segments. Horizontal errorbars represent the minmum and maxmum RMBA values within individual ridge segments. Vertical errorbars corespond to 50% confidence interval for fault recognition. Red points in (d) are the aveage RMBA and aveage residual depth from each grid bins (~20 km×20 km) of the study region. Blue points indicate regions containing OCCs with the horizontal and vertical errorbars reflecting the minmum and maxmum values of residual depth and RMBA, repectively.
A total of 22 OCCs with typical megamullion structure have been found in the study region with 17 OCCs occurring in Segments B3, B4, and B5 of the AAD, while another 5 OCCs occurring at Segments C4 and C5 of Zone C at 116°–117°E (Fig. 5b). Furthermore, several possible OCCs without obvious megamullion have been found in Zone C. The OCCs occur only in regions of relatively positive RMBA (Fig. 5c), while no OCCs have been found in areas of relatively more negative RMBA.
The OCCs within the AAD have greater size than those of Segment C5. Most OCCs are 5–20 km in length along the flow line direction. The largest OCC, which is located at the inside corner of Segment B3, extends by ~50 km in the flow line direction. The RMBA values of OCCs are in the range of 20–70 mGal with an average of ~40 mGal. The relatively positive RMBA values of the OCCs, which might result from thinner crust and/or exposed upper mantle, are consistent with previous studies at the MAR (e.g., Cann et al., 1997; Tucholke et al., 1998) and global settings (Tucholke et al., 2008). A refraction seismic experiment in Segment B4 (Kojima et al., 2003) revealed crustal thickness of ~3.6 km, which is consistent with our gravity-derived crustal thickness model of ~3.0 km (Fig. 5a).
The AAD region is deeper by ~0.8–1.0 km than the adjacent ridge segments (Hayes, 1988; Mark et al., 1990; Klein et al., 1991; Pyle et al., 1992). The stretched, rotated, and uplifted footwall of the OCCs might also cause relatively shallow seafloor and large topographic gradients. We calculated the residual bathymetry by subtracting the effect of thermal subsidence and sediment loading from the observed bathymetry to illustrate if the regions with OCCs were elevated by detachment faults. The OCCs have ~2.5–3.5 km of residual depth (Fig. 5d). The topographic variations within the individual OCCs are in the range of 1.0–2.5 km. In comparison, the topographic variations within typical abyssal hills are in the range of only 0.1–0.5 km (e.g., abyssal hills in Segments C1, C2, C3 and A1). Only very few abyssal hills may reach topographic variations of ~1 km (e.g., part of abyssal hills in Segment C4). The observed topographic variations within the OCCs are similar to the predictions by the FLAC simulations for moderate to small M factors (Fig. 4). The RMBA and topography of Segments B1 and B2 are similar to that of Segments B3, B4, B5, and C5. It is possible that OCCs might exist in Segments B1 and B2 of the AAD, but we cannot identify them yet due to the lack of high-resolution bathymetry data.
In summary, the mean map-view M factors show inverse correlation with the average RMBA values, i.e., the M factor decreases with increasing RMBA with a gradient of –0.003 mGal–1 (Fig. 5c). The inverse correlation between the observed M factor and RMBA implies that the limited magma supply of the AAD, as reflected in thinner crust, is related to stronger tectonism, as reflected in extensive faulting and widespread occurrence of OCCs.
4.
Discussion
4.1
Comparison with geochemical indicators
Multiple geochemical indicators can be used to infer mantle source compositions and partial melting processes beneath mid-ocean ridges (e.g., Klein and Langmuir, 1987; Klein et al., 1988, 1991). For example, the initial depth and average degree of partial melting can be inferred from Fe8.0 and Na8.0, which are calculated by normalizing the measured wt% FeO and Na2O values, respectively, to 8.0 wt% MgO (Klein and Langmuir, 1987). We plotted 69 sets of Na8.0 and Fe8.0 data (Klein et al., 1988, 1991; Mahoney et. al., 2002) and compared the axial topography, RMBA, M factors, and geochemical indicators of Na8.0 and Fe8.0 to explore the geological processes at the SEIR (Fig. 6).
Figure
6.
Along-ridge-axis variations in seafloor depth (a), RMBA (b), Na8.0 (c), Fe8.0 (d), and map-view M factor (e) along the SEIR in the study region. Black arrows in (a) indicate location of transform faults and non-transform discontinuties. Light gray dash lines in (c) and (d) are envelope lines of geochemical data points from Klein et al. (1989, 1991) and Mahoney et al. (2002). Black dots in (e) indicate the mean map-view M factors of ridge segments.
Several positive correlations were found in the SEIR datasets: (1) Topography vs. Fe8.0; (2) Topography vs. M factor; (3) Fe8.0 vs. M factor; and (4) RMBA vs. Na8.0. Meanwhile, RMBA and Na8.0 exhibit inverse correlations with topography, Fe8.0, and M factor (Fig. 6). The local extreme values of Na8.0 and Fe8.0 in Segment C5 (~116°E) and the AAD (~123°E) indicate shallower initial melting depth and lower partial melting extent than adjacent ridge segments. This is consistent with models of limited magma supply for these two regions, as reflected in the overserved relatively positive RMBA and deeper seafloor in Segment C5 and AAD (Fig. 6).
4.2
Causes and consequences of limited magma supply at the AAD
Although OCCs could sometime develop in regions of relatively high magma intrusion rate (e.g., Escartín et al., 2003; Olive et al., 2016), most OCCs do develop in amagmatic regions, e.g., at the slow-spreading MAR and ultraslow-spreading SWIR. Results of the above analysis revealed that the AAD is indeed such a region of limited magma supply even though it is located on an intermediate fast-spreading ridge.
Several hypotheses were proposed to explain the mantle and seafloor depth anomaly at the AAD, including “cold spot”, “mantle convective downwelling”, and “pre-Cretaceous remnant slab” (Hayes, 1976; Anderson et. al., 1980; Klein et al., 1991; Gurnis et al., 1998; Gurnis and Müller, 2003). Melting is more difficult in depleted or cold mantle, which could lead to less magma supply and thus thinner crust and stronger tectonism. Combination of the multiple geological, geophysical, and geochemical constraints leads to the following interpretation of the systematic variations in magma supply and tectonism of the SEIR near the AAD:
(1) Relatively cold or depleted mantle might exist beneath the AAD. Thus, partial melting beneath the AAD might be at shallower initial depth and of lesser extent than that of Zones A and C.
(2) Under the relatively constant spreading rates of the SEIR, the limited partial melting beneath the AAD would lead to insufficient melt supply and thinner than normal crustal thickness.
(3) The relatively magma-starved state of the AAD could lead to an increase in tectonism through normal faulting. At sites of extreme low local magma supply, OCC features would then develop either at isolated locations or as a cluster of OCCs as observed at the AAD.
4.3
Westward migration of the OCC Zone
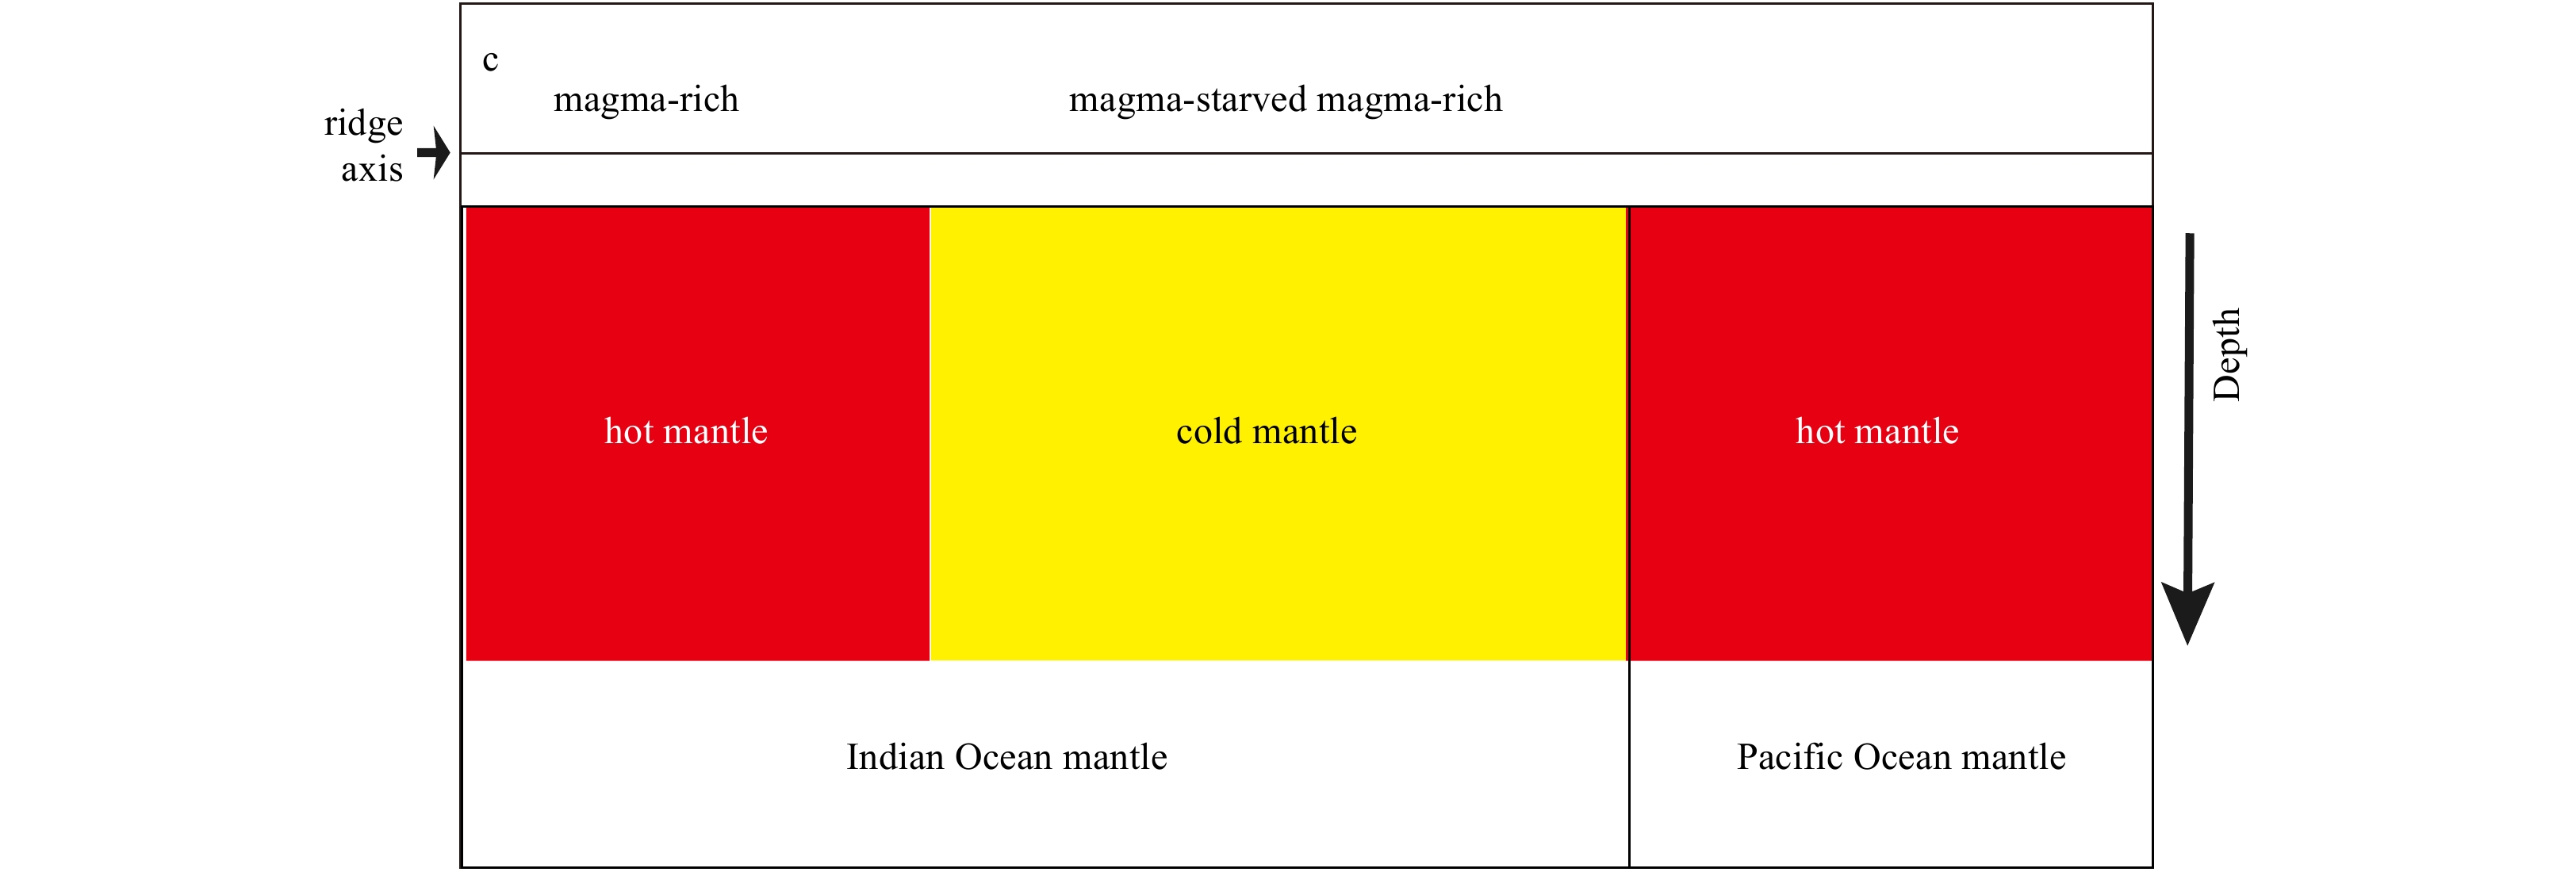
Several lines of evidence suggest that the observed zone of concentrated OCCs at the AAD might have migrated westward: (1) The westward spindle-shaped envelopes of relatively high values of RMBA; (2) The relatively wider spread of the OCCs in the AAD than at Segment C5; (3) The westward-pointing depth anomaly; (4) the westward-pointing propagating rifts; (5) The westward-pointing magma-rich region at Segment B5 (Fig. 7a).
Figure
7.
Illustration of the OCC development and regional tectonics. a. Mjor tectonic elements of the study region on top of the RMBA map. b. Simplified illustration of OCC development, illustrating the developing tendency of the new OCC region (brown area with arrows) and magma-rich (red area with arrows) regions, respectively. c Illustration of the axial mantle underlying the AAD. Red and long blue curves in (a) are the inferred boundary between the Indian and Pacific MORB mantle domains from Christie et al. (2004). Yellow ellipse in (b) indicates a region of concentrated OCCs at the AAD. Black ellipses in (a) and (b) indicate the approximate locations of the 30 and 50 mGal contours of the RMBA. The red semi-circle at the boundary between Segments B5 and A1 in (b) indicates that the magma from the enriched Pacific mantle domain tends to migrate westward.
Based on the observed chaotic topography at the AAD, it was suggested that the chaotic topography of the AAD might have developed for at least 30 Ma (Christie et al., 1998). Furthermore, it was inferred that the observed chaotic topography, and thus the associated zone of concentrated OCCs, could have migrated westward at a rate of 19–27 mm/a (Mark et al., 1990; Christie et al., 1998). Meanwhile, the RMBA envelopes indicate an apparent westward rate of ~40 mm/a (Figs 7a,b). Therefore, the westward migration rate of the zone of concentrated OCCs could be in the range of ~19–40 mm/a. Clearly more in-depth studies are needed to investigate the causes and consequences of the possible migration of mantle domains and tectonic zones.
5.
Conclusions
In this study, we analyzed along-axis variations in seafloor morphology, geophysical and geochemical anomalies, and the development of OCCs on the SEIR from 108°E to 134°E, yielding the following conclusions:
(1) The AAD is deeper than the adjacent ridge segments of the SEIR and is associated with more positive RMBA, indicating thinner crust and/or colder mantle. The higher Na8.0 and lower Fe8.0 values of the AAD indicate relatively shallow initial melting depth and small amount of mantle melting.
(2) We developed a new method of calculating 2D map-view M factor and illustrated that ridge segments within the AAD have smaller average M factors than the adjacent segments. The relatively small average M values of the AAD indicates limited magma supply and strong tectonism through faulting.
(3) Most OCCs occur in the AAD along the SEIR, especially at Segments B3 and B4. The OCC features are associated with relatively large values of local positive RMBA, indicating that the OCCs are developed at sites of limited magma supply. It is anticipated that the zone of concentrated OCCs might migrate westward along the ridge axis.
Anderson R N, Spariosu D J, Weissel J K, et al. 1980. The interrelation between variations in magnetic anomaly amplitudes and basalt magnetization and chemistry along the Southeast Indian Ridge. Journal of Geophysical Research: Solid Earth, 185(B7): 3883–3898. doi: 10.1029/JB085iB07p03883
[2]
Behn M D, Ito G. 2008. Magmatic and tectonic extension at mid-ocean ridges: 1. Controls on fault characteristics. Geochemistry, Geophysics, Geosystems, 9(8): Q08O10. doi: 10.1029/2008GC001965
[3]
Buck W R, Lavier L L, Poliakov A N B. 2005. Modes of faulting at mid-ocean ridges. Nature, 434(7034): 719–723. doi: 10.1038/nature03358
[4]
Cann J R, Blackman D K, Smith D K, et al. 1997. Corrugated slip surfaces formed at ridge-transform intersections on the Mid-Atlantic Ridge. Nature, 385(6612): 329–332
[5]
Christie D M, West B P, Pyle D G, et al. 1998. Chaotic topography, mantle flow and mantle migration in the Australian-Antarctic discordance. Nature, 394(6694): 637–644. doi: 10.1038/29226
[6]
Ciazela J, Koepke J, Dick H J B, et al. 2015. Mantle rock exposures at oceanic core complexes along mid-ocean ridges. Geologos, 21(4): 207–231. doi: 10.1515/logos-2015-0017
[7]
Cundall P A. 1989. Numerical experiments on localization in frictional material. Ingenieur-Archiv, 58(2): 148–159. doi: 10.1007/bf00538368
[8]
Dick H J B, Lin Jian, Schouten H. 2003. An ultraslow-spreading class of ocean ridge. Nature, 426(6965): 405–412. doi: 10.1038/nature02128
[9]
Escartín J, Mével C, Macleod C J, et al. 2003. Constraints on deformation conditions and the origin of oceanic detachments: The Mid-Atlantic Ridge core complex at 15°45’N. Geochemistry, Geophysics, Geosystems, 4(8): 1067. doi: 10.1029/2002GC000472
[10]
Escartín J, Smith D K, Cann J R, et al. 2008. Central role of detachment faults in accretion of slow-spreading oceanic lithosphere. Nature, 455(7214): 790–794. doi: 10.1038/nature07333
[11]
Gurnis M, Müller R D, Moresi L. 1998. Cretaceous vertical motion of Australia and the Australian Antarctic discordance. Science, 279(5356): 1499–1504. doi: 10.1126/science.279.5356.1499
[12]
Gurnis M, Müeller R D. 2003. Origin of the Australian-Antarctic discordance from an ancient slab and mantle wedge. Geological Society of America Special Papers, 372: 417–429
[13]
Hayes D E. 1976. Nature and implications of asymmetric sea-floor spreading-“different rates for different plates”. GSA Bulletin, 87(7): 994–1002. doi: 10.1130/0016-7606(1976)87<994:NAIOAS>2.0.CO;2
[14]
Hayes D E. 1988. Age-depth relationships and depth anomalies in the Southeast Indian Ocean and south Atlantic Ocean. Journal of Geophysical Research: Solid Earth, 93(B4): 2937–2954. doi: 10.1029/JB093iB04p02937
[15]
Hayes D E, Conolly J R. 1972. Morphology of the Southeast Indian Ocean. In: Hayes D E, ed. Antarctic Oceanology II: The Australian-New Zealand Sector. Washington D C: Wiley, 125–145,
[16]
Klein E M, Langmuir C H. 1987. Global correlations of ocean ridge basalt chemistry with axial depth and crustal thickness. Journal of Geophysical Research: Solid Earth, 92(B8): 8089–8115. doi: 10.1029/JB092iB08p08089
[17]
Klein E M, Langmuir C H, Staudigel H. 1991. Geochemistry of basalts from the Southeast Indian Ridge, 115°E-138°E. Journal of Geophysical Research: Solid Earth, 96(B2): 2089–2107. doi: 10.1029/90JB01384
[18]
Klein E M, Langmuir C H, Zindler A, et al. 1988. Isotope evidence of a mantle convection boundary at the Australian-Antarctic Discordance. Nature, 333(6174): 623–629. doi: 10.1038/333623a0
[19]
Kojima Y, Shinohara M, Mochizuki K, et al. 2003. Seismic velocity structure in the Australian-Antarctic Discordance, Segment B4 revealed by airgun-OBS experiment. In: American Geophysical Union, Fall Meeting 2003, S21F-0396
[20]
Kuo Baiyuan, Forsyth D W. 1988. Gravity anomalies of the ridge-transform system in the South Atlantic between 31 and 34.5°S: Upwelling centers and variations in crustal thickness. Marine Geophysical Researches, 10(3–4): 205–232. doi: 10.1007/BF00310065
[21]
Lavier L L, Buck W R. 2002. Half graben versus large-offset low-angle normal fault: Importance of keeping cool during normal faulting. Journal of Geophysical Research: Solid Earth, 107(B6): 2122. doi: 10.1029/2001JB000513
[22]
Lavier L L, Buck W R, Poliakov A N B. 2000. Factors controlling normal fault offset in an ideal brittle layer. Journal of Geophysical Research: Solid Earth, 105(B10): 23431–23442. doi: 10.1029/2000JB900108
[23]
Lin J, Purdy G M, Schouten H, et al. 1990. Evidence from gravity data for focused magmatic accretion along the Mid-Atlantic Ridge. Nature, 344(6267): 627–632. doi: 10.1038/344627a0
[24]
Müller R D, Sdrolias M, Gaina C, et al. 2008. Age, spreading rates, and spreading asymmetry of the world’s ocean crust. Geochemistry, Geophysics, Geosystems, 9(4): Q04006. doi: 10.1029/2007GC001743
[25]
Macdonald K C. 1990. A slow but restless ridge. Nature, 348(6297): 108–109. doi: 10.1038/348108a0
[26]
MacLeod C J, Searle R C, Murton B J, et al. 2009. Life cycle of oceanic core complexes. Earth and Planetary Science Letters, 287(3–4): 333–344. doi: 10.1016/j.jpgl.2009.08.016
[27]
Mahoney J J, Graham D W, Christie D M, et al. 2002. Between a hotspot and a cold spot: Isotopic variation in the Southeast Indian Ridge asthenosphere, 86°E–118°E. Journal of Petrology, 43(7): 1155–1176. doi: 10.1093/petrology/43.7.1155
[28]
Marks K M, Vogt P R, Hall S A. 1990. Residual depth anomalies and the origin of the Australian-Antarctic Discordance zone. Journal of Geophysical Research: Solid Earth, 95(B11): 17325–17337. doi: 10.1029/JB095iB11p1732
[29]
Ohara Y, Yoshida T, Kato Y, et al. 2001. Giant megamullion in the Parece Vela backarc basin. Marine Geophysical Researches, 22(1): 47–61. doi: 10.1023/A:1004818225642
[30]
Okino K, Matsuda K, Christie D M, et al. 2004. Development of oceanic detachment and asymmetric spreading at the Australian-Antarctic Discordance. Geochemistry, Geophysics, Geosystems, 5(12): Q12012. doi: 10.1029/2004GC000793
[31]
Oldenburg D W. 1974. The inversion and interpretation of gravity anomalies. Geophysics, 39(4): 526–536. doi: 10.1190/1.1440444
[32]
Olive J A, Behn M D, Mittelstaedt E, et al. 2016. The role of elasticity in simulating long-term tectonic extension. Geophysical Journal International, 205(2): 728–743. doi: 10.1093/gji/ggw044
[33]
Olive J A, Behn M D, Tucholke B E. 2010. The structure of oceanic core complexes controlled by the depth distribution of magma emplacement. Nature Geoscience, 3(7): 491–495. doi: 10.1038/ngeo888
[34]
Parker R L. 1973. The rapid calculation of potential anomalies. Geophysical Journal International, 31(4): 447–455. doi: 10.1111/j.1365-246X.1973.tb06513.x
[35]
Pyle D G, Christie D M, Mahoney J J. 1992. Resolving an isotopic boundary within the Australian-Antarctic Discordance. Earth and Planetary Science Letters, 112(1–4): 161–178. doi: 10.1016/0012-821X(92)90014-M
[36]
Sandwell D T, Müller R D, Smith W H F, et al. 2014. New global marine gravity model from CryoSat-2 and Jason-1 reveals buried tectonic structure. Science, 346(6205): 65–67. doi: 10.1126/science.1258213
[37]
Shaw W J, Lin Jian. 1996. Models of ocean ridge lithospheric deformation: Dependence on crustal thickness, spreading rate, and segmentation. Journal of Geophysical Research: Solid Earth, 101(B8): 17977–17993. doi: 10.1029/96JB00949
[38]
Smith D. 2013. Mantle spread across the sea floor. Nature Geoscience, 6(4): 247–248. doi: 10.1038/ngeo1786
[39]
Tucholke B E, Behn M D, Buck W R, et al. 2008. Role of melt supply in oceanic detachment faulting and formation of megamullions. Geology, 36(6): 455–458. doi: 10.1130/G24639A.1
[40]
Tucholke B E, Lin Jian. 1994. A geological model for the structure of ridge segments in slow spreading ocean crust. Journal of Geophysical Research: Solid Earth, 99(B6): 11937–11958. doi: 10.1029/94JB00338
[41]
Tucholke B E, Lin Jian, Kleinrock M C. 1998. Megamullions and mullion structure defining oceanic metamorphic core complexes on the Mid-Atlantic Ridge. Journal of Geophysical Research: Solid Earth, 103(B5): 9857–9866. doi: 10.1029/98JB00167
[42]
Vogt P R, Cherkis N Z, Morgan G A. 1983. Project Investigator-I: Evolution of the Australian-Antarctic Discordance deduced from a detailed aeromagnetic study. In: Oliver R L, James P R, Jago J B, eds. Antarctic Earth Science: 4th International Symposium. Camberra: Cambridge University Press, 608–613
[43]
Wang Tingting, Lin Jian, Tucholke B E, et al. 2011. Crustal thickness anomalies in the North Atlantic Ocean basin from gravity analysis. Geochemistry, Geophysics, Geosystems, 12(3): Q0AE02. doi: 10.1029/2010GC003402
[44]
Weissel J K, Hayes D E. 1971. Asymmetric seafloor spreading south of Australia. Nature, 231(5304): 518–522. doi: 10.1038/231518a0
[45]
Zhou Zhiyuan, Lin Jian, Behn M, Olive J A. 2015. Mechanism for normal faulting in the subducting plate at the Mariana Trench. Geophysical Research Letters, 42(11): 4309–4317. doi: doi:10.1002/2015GL063917
[46]
Zhou Zhiyuan, Lin Jian. 2018. Elasto-plastic deformation and plate weakening due to normal faulting in the subducting plate along the Mariana Trench. Tectonophysics, 734–735: 59–68. doi: 10.1016/j.tecto.2018.04.008
[47]
Zhou Zhiyuan, Lin Jian, Zhang Fan. 2018. Modeling of normal faulting in the subducting plates of the Tonga, Japan, Izu-Bonin and Mariana Trenches: implications for near-trench plate weakening. Acta Oceanologica Sinica, 37(11): 53–60. doi: 10.1007/s13131-0181146-z
Omar M. N. Alsharabi, Salina Daud, Amar Hisham Jaaffar. The AI Revolution: Driving Business Innovation and Research. Studies in Systems, Decision and Control, doi:10.1007/978-3-031-54383-8_5
Shoujin Liu, Jian Lin, Zhiyuan Zhou, Fan Zhang. Large along-axis variations in magma supply and tectonism of the Southeast Indian Ridge near the Australian-Antarctic Discordance[J]. Acta Oceanologica Sinica, 2020, 39(1): 118-129. doi: 10.1007/s13131-019-1518-z
Shoujin Liu, Jian Lin, Zhiyuan Zhou, Fan Zhang. Large along-axis variations in magma supply and tectonism of the Southeast Indian Ridge near the Australian-Antarctic Discordance[J]. Acta Oceanologica Sinica, 2020, 39(1): 118-129. doi: 10.1007/s13131-019-1518-z
Figure 1. Topography map of the study region. The Southeast Indian Ridge (SEIR) and the study region are shown as red lines and red rectangle, respectively, on the regional setting map (inset map). Black dashed lines, black short double lines, and green lines are the main fracture zones, ridge axes, and propagating rifts, respectively. The study region is divided into Zones A, B, and C; the Australian–Antarctic Discordance (AAD) includes 5 segment corridors of B1 to B5; Zones A and C have 3 and 5 segments, respectively. The boundaries are modified from Weissel and Hayes (1971) and Vogt et al. (1983). Red curve is the trace of the Indian/Pacific MORB mantle boundary from Christie et al. (2004). AF represents the African plate,AN the Antarctica plate, and AU the Australian plate.
Figure 2. Illustrasion map of M factors calculation. The M factor is calculated from topographic profile, as modified from Smith (2013). The blue stripe (Xf) is the horizontal projection of fault surface. The blue and red (Xm) stripes represent tectonic extension and magmatic accretion regions, repectively. M factor can be evaluated by M=$\frac{{\displaystyle\sum {X_{\rm m}} }}{{\displaystyle\sum {X_{\rm f} + \displaystyle\sum {X_{\rm m}} } }}$. The blue arrow is the moving direction relative to the conjugated fault block. The water, upper crust, and the lower crust/upper mantle are represented by white, light gray, and light brown areas, respectively. Red vertical box represents the ridge axis.
Figure 4. Results of FLAC geodynamic simulation for M factors of M=0.2 (a, b), M=0.4 (c, d), M=0.6 (e, f ), M=0.8 (g, h), and M=1.0 (I, j). Left and right columns are the claculated strain rate and temperature, respectively, at the model running time of 0.7 Ma, when the models have reached steady state. Magma injection is imposed at the ridge axis in a dike of 0.18 km wide and at depth of 0–6 km from the seafloor. The simulation grid size is 0.18 km ×0.22 km. The cohesion of the deforming layer is assumed to decrease with plastic strain after yielding. The intial layer cohesion is 44 MPa, and the deformation plane is assumed to lose its conhesion linearly to 4 MPa at deformation offset of ~200 m. Intial axial lithospheric thickness is ~6 km.
Figure 3. Map of shaded topography, identified fault scarps, and calculated map-view M factor for Segments A1 ( a, b ), C1 ( c, d ), C2 ( e, f ), C3 ( g, h), C4 ( i, j ), C5 ( k, l), B3 ( m, n ), B4 ( o, p ), and B5 ( q, r ), respectively. For each ridge segment, the shaded topographic maps are based on multi-beam bathymetry data ( a, c, e, g, i, k, m, o and q ). The map-view M factors (MVM, color shades) were calculated using a sliding sampling box of ~12 km ×7 km, while the fault scarps (black stripes) were identified from 3D topography and topographic slopes ( b, d, f, h, j, l, n, p, and r ). Both the white and green double lines are the ridge axes.
Figure 5. Map of gravity-derived crustal thickness (a), RMBA of the study region in b correlation between RMBA and M factors (c), and correlation between residual depth and RMBA (d). Small regions with blue enclosed contous in b. indicate OCCs. Black points in (c) represents mean map-view M factor and average RMBA of ridge segments. Horizontal errorbars represent the minmum and maxmum RMBA values within individual ridge segments. Vertical errorbars corespond to 50% confidence interval for fault recognition. Red points in (d) are the aveage RMBA and aveage residual depth from each grid bins (~20 km×20 km) of the study region. Blue points indicate regions containing OCCs with the horizontal and vertical errorbars reflecting the minmum and maxmum values of residual depth and RMBA, repectively.
Figure 6. Along-ridge-axis variations in seafloor depth (a), RMBA (b), Na8.0 (c), Fe8.0 (d), and map-view M factor (e) along the SEIR in the study region. Black arrows in (a) indicate location of transform faults and non-transform discontinuties. Light gray dash lines in (c) and (d) are envelope lines of geochemical data points from Klein et al. (1989, 1991) and Mahoney et al. (2002). Black dots in (e) indicate the mean map-view M factors of ridge segments.
Figure 7. Illustration of the OCC development and regional tectonics. a. Mjor tectonic elements of the study region on top of the RMBA map. b. Simplified illustration of OCC development, illustrating the developing tendency of the new OCC region (brown area with arrows) and magma-rich (red area with arrows) regions, respectively. c Illustration of the axial mantle underlying the AAD. Red and long blue curves in (a) are the inferred boundary between the Indian and Pacific MORB mantle domains from Christie et al. (2004). Yellow ellipse in (b) indicates a region of concentrated OCCs at the AAD. Black ellipses in (a) and (b) indicate the approximate locations of the 30 and 50 mGal contours of the RMBA. The red semi-circle at the boundary between Segments B5 and A1 in (b) indicates that the magma from the enriched Pacific mantle domain tends to migrate westward.


 DownLoad:


 DownLoad: