Figure
1.
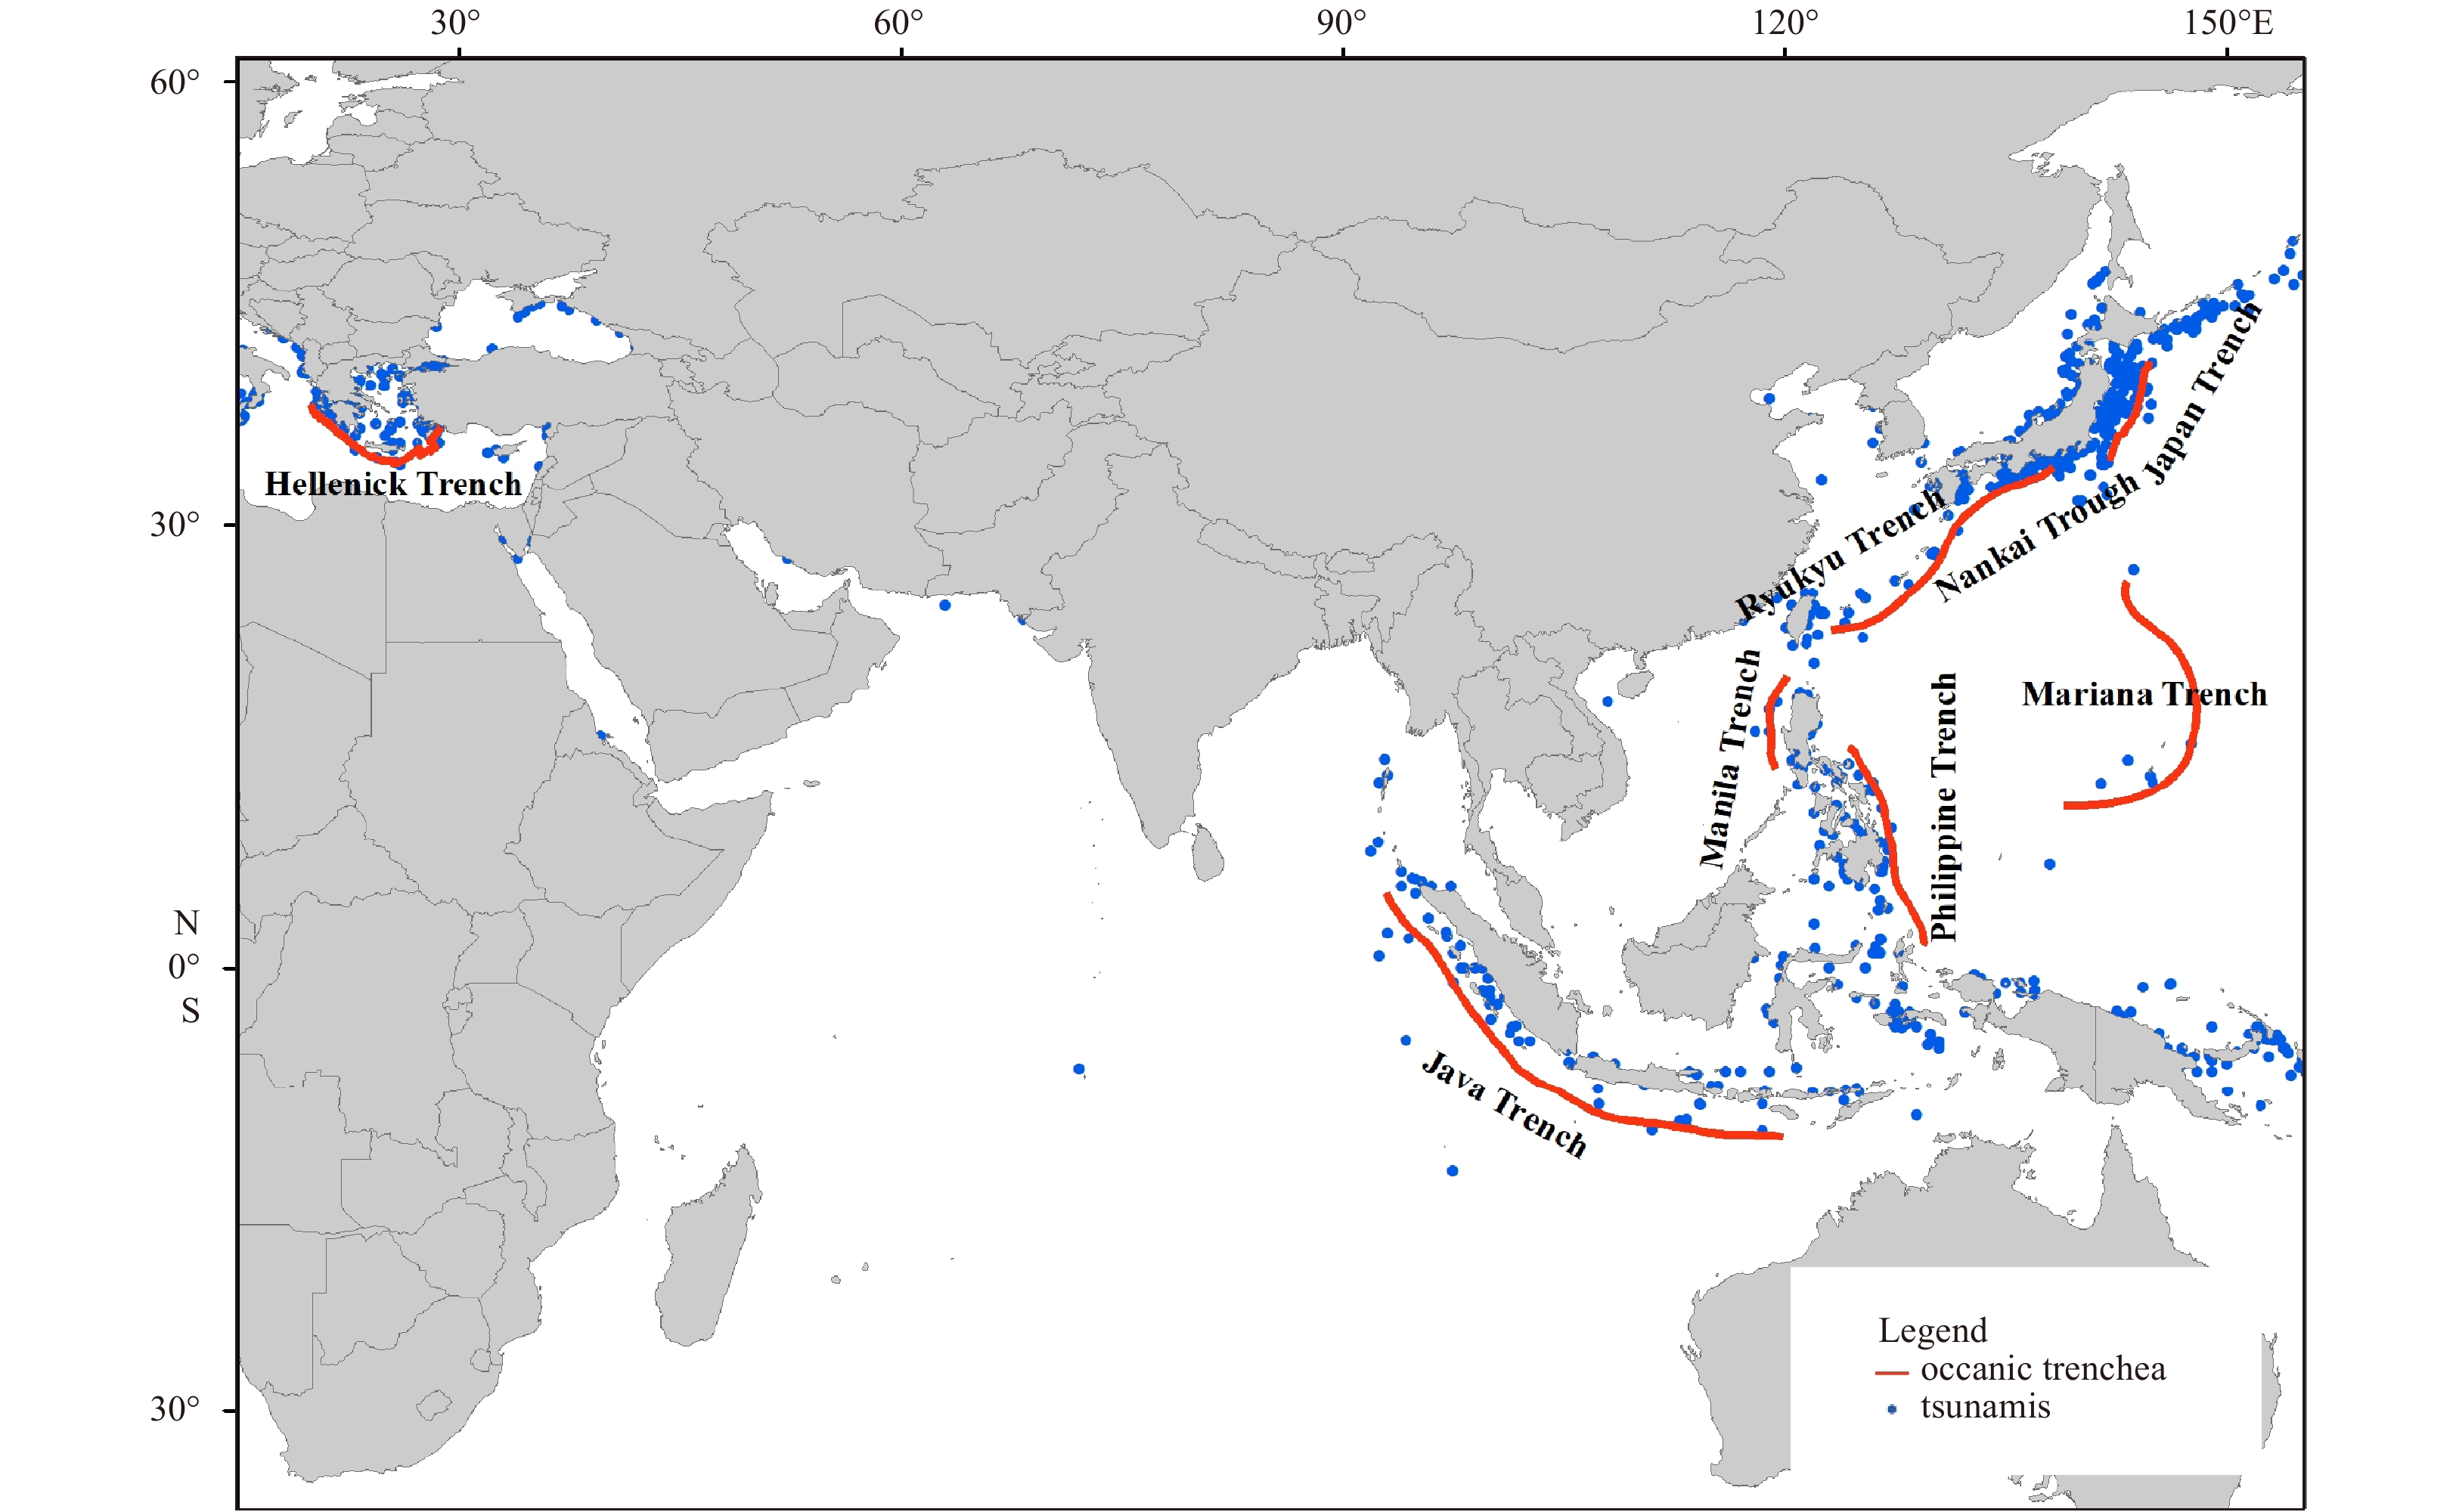
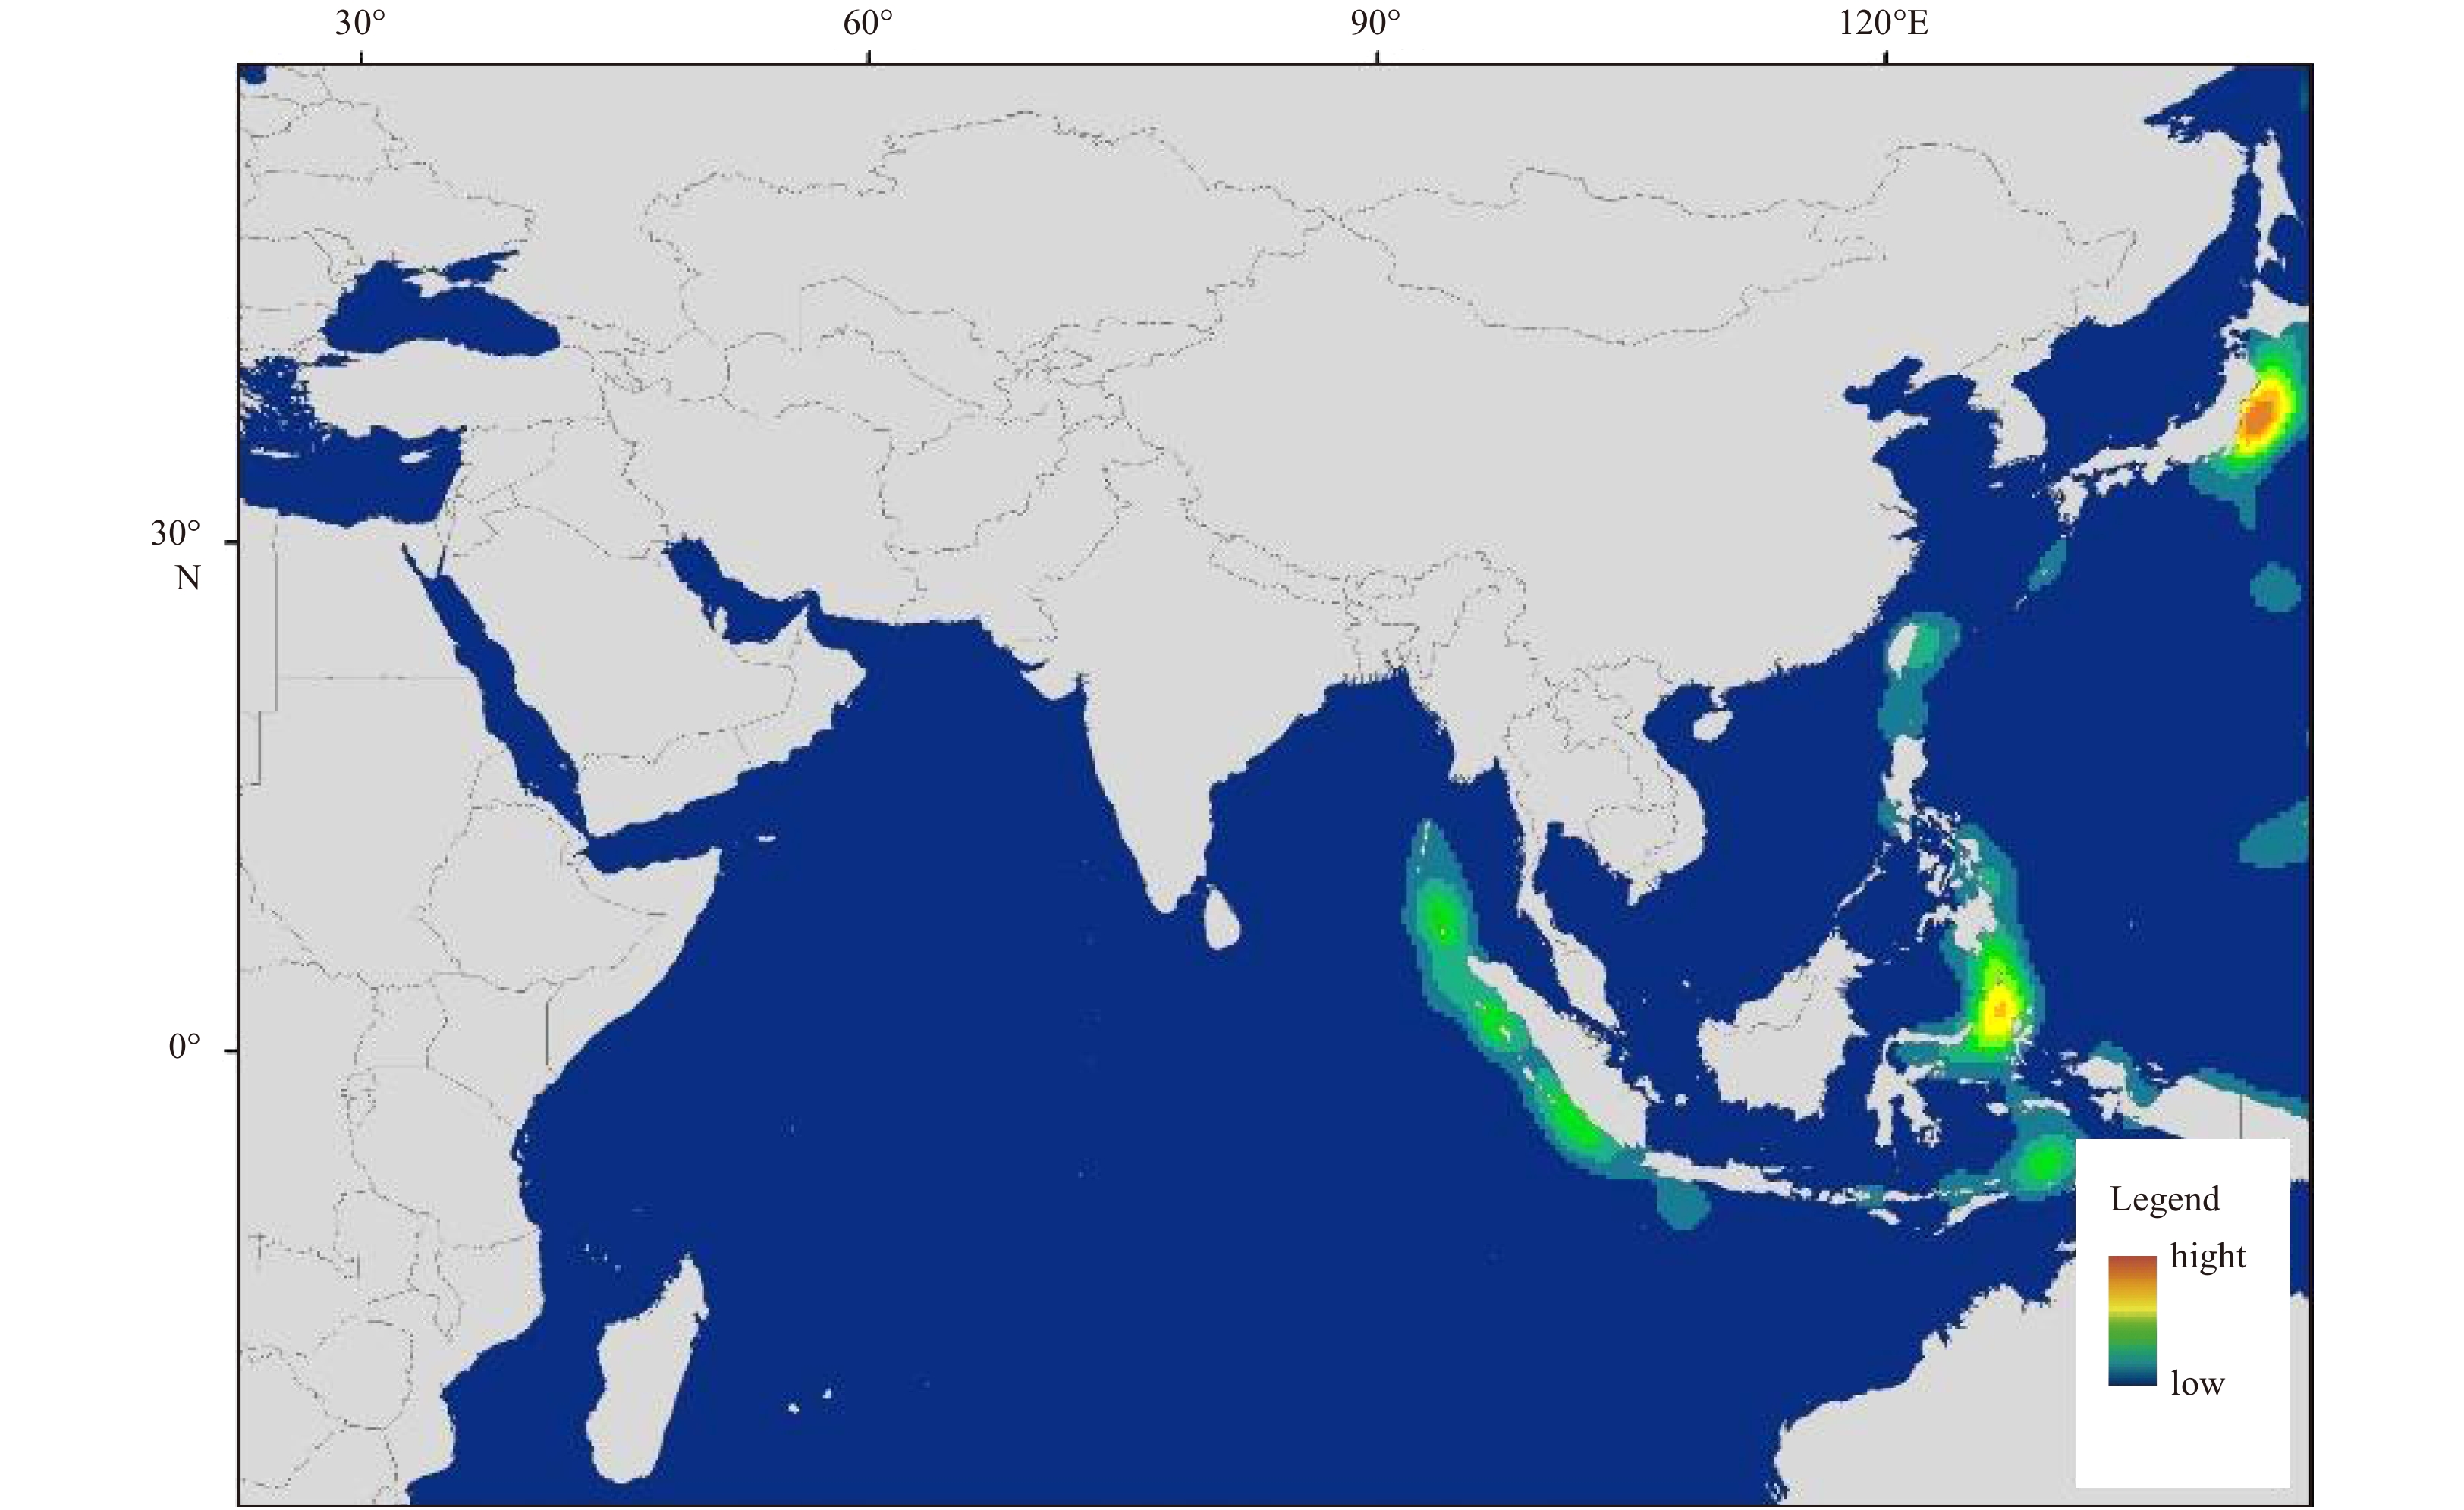
Spatial distribution of earthquakes.
| Citation: | Jingming Hou, Xiaojuan Li, Peitao Wang, Juncheng Wang, Zhiyuan Ren. Hazard analysis of tsunami disaster on the Maritime Silk Road[J]. Acta Oceanologica Sinica, 2020, 39(1): 74-82. doi: 10.1007/s13131-019-1526-z

|
China proposed the 21st century Maritime Silk Road initiative in 2013 (Guan, 2016), which was welcomed and supported by many countries. This initiative aims to achieve harmonious coexistence and common development with relevant countries by revitalizing the ancient Maritime Silk Road. The Maritime Silk Road extends from China and Japan, through the South China Sea and the northern Indian Ocean, to East Africa and Europe, passing through more than 50 countries and regions. However, countries along the Maritime Silk Road often suffer from marine disasters. Tsunami is one of the most serious marine disasters in the world. In recent years, destructive tsunami has occurred every year (IOC, 2013). Since the beginning of the 21st century, there have been two major tsunamis on the Maritime Silk Road, the Indian Ocean tsunami (Grilli et al., 2007) in 2004 and the Japan tsunami (Wei et al., 2013) in 2011. Although tsunami is a low-probability event, its occurrence is often accompanied by huge economic loss and casualties (Wang et al., 2018). Moreover, tsunami can spread across the ocean and affect areas far from the source, causing widespread disasters (Hébert et al., 2001). Nowadays, scientists are still unable to predict when and where the next tsunami will occur. Therefore, it is necessary to study and analyze the tsunami events in advance to mitigate the disastrous effect of tsunami.
Tsunami could have disastrous effects on trade, shipping and other activities on the Maritime Silk Road. A number of organizations need to understand the tsunami hazard on the Maritime Silk Road to assess the safety of economic and cultural exchanges. Several published studies had analyzed the tsunami hazard in China’s surrounding waters (Liu et al., 2007; Wen et al., 2008; Dao et al., 2009). Regional tsunami assessments show the tsunami hazard of China’s coastal provinces (Mao et al., 2015; Hou et al., 2016). The effect of China coastal topography on tsunamis has also been studied (Zhao et al., 2013). However, the tsunami hazard on the Maritime Silk Road has not been studied comprehensively. Although researchers have analyzed the historical tsunamis (Zhou and Adams, 1988), the occurrence regularity of tsunami disasters has not been clearly stated. In addition, the question of what kind of earthquake can triger a tsunami has not been clarified.
This paper studied the temporal and spatial distribution and occurrence regularity of tsunamis on the Maritime Silk Road. The numerical model was used to simulate the potential tsunamis and identify the coastline with high tsunami risk. The analysis results are of great significance for ensuring the safety of economic and cultural exchanges on the Maritime Silk Road.
Most tsunamis are caused by earthquakes. Tsunami warning is initiated based on earthquake information. Once an earthquake occurs, the seismic wave data can be obtained first. According to the location and magnitude of the earthquake, the numerical model can be used to predict the tsunami travel time and wave amplitude. However, if the tsunami source is very close to the land, there may not be enough time to respond. So, it is necessary to have a comprehensive understanding of the occurrence of the submarine earthquakes and tsunamis on the Maritime Silk Road. In this study, the temporal and spatial distributions of earthquakes and tsunamis were analyzed using historical earthquake and tsunami data.
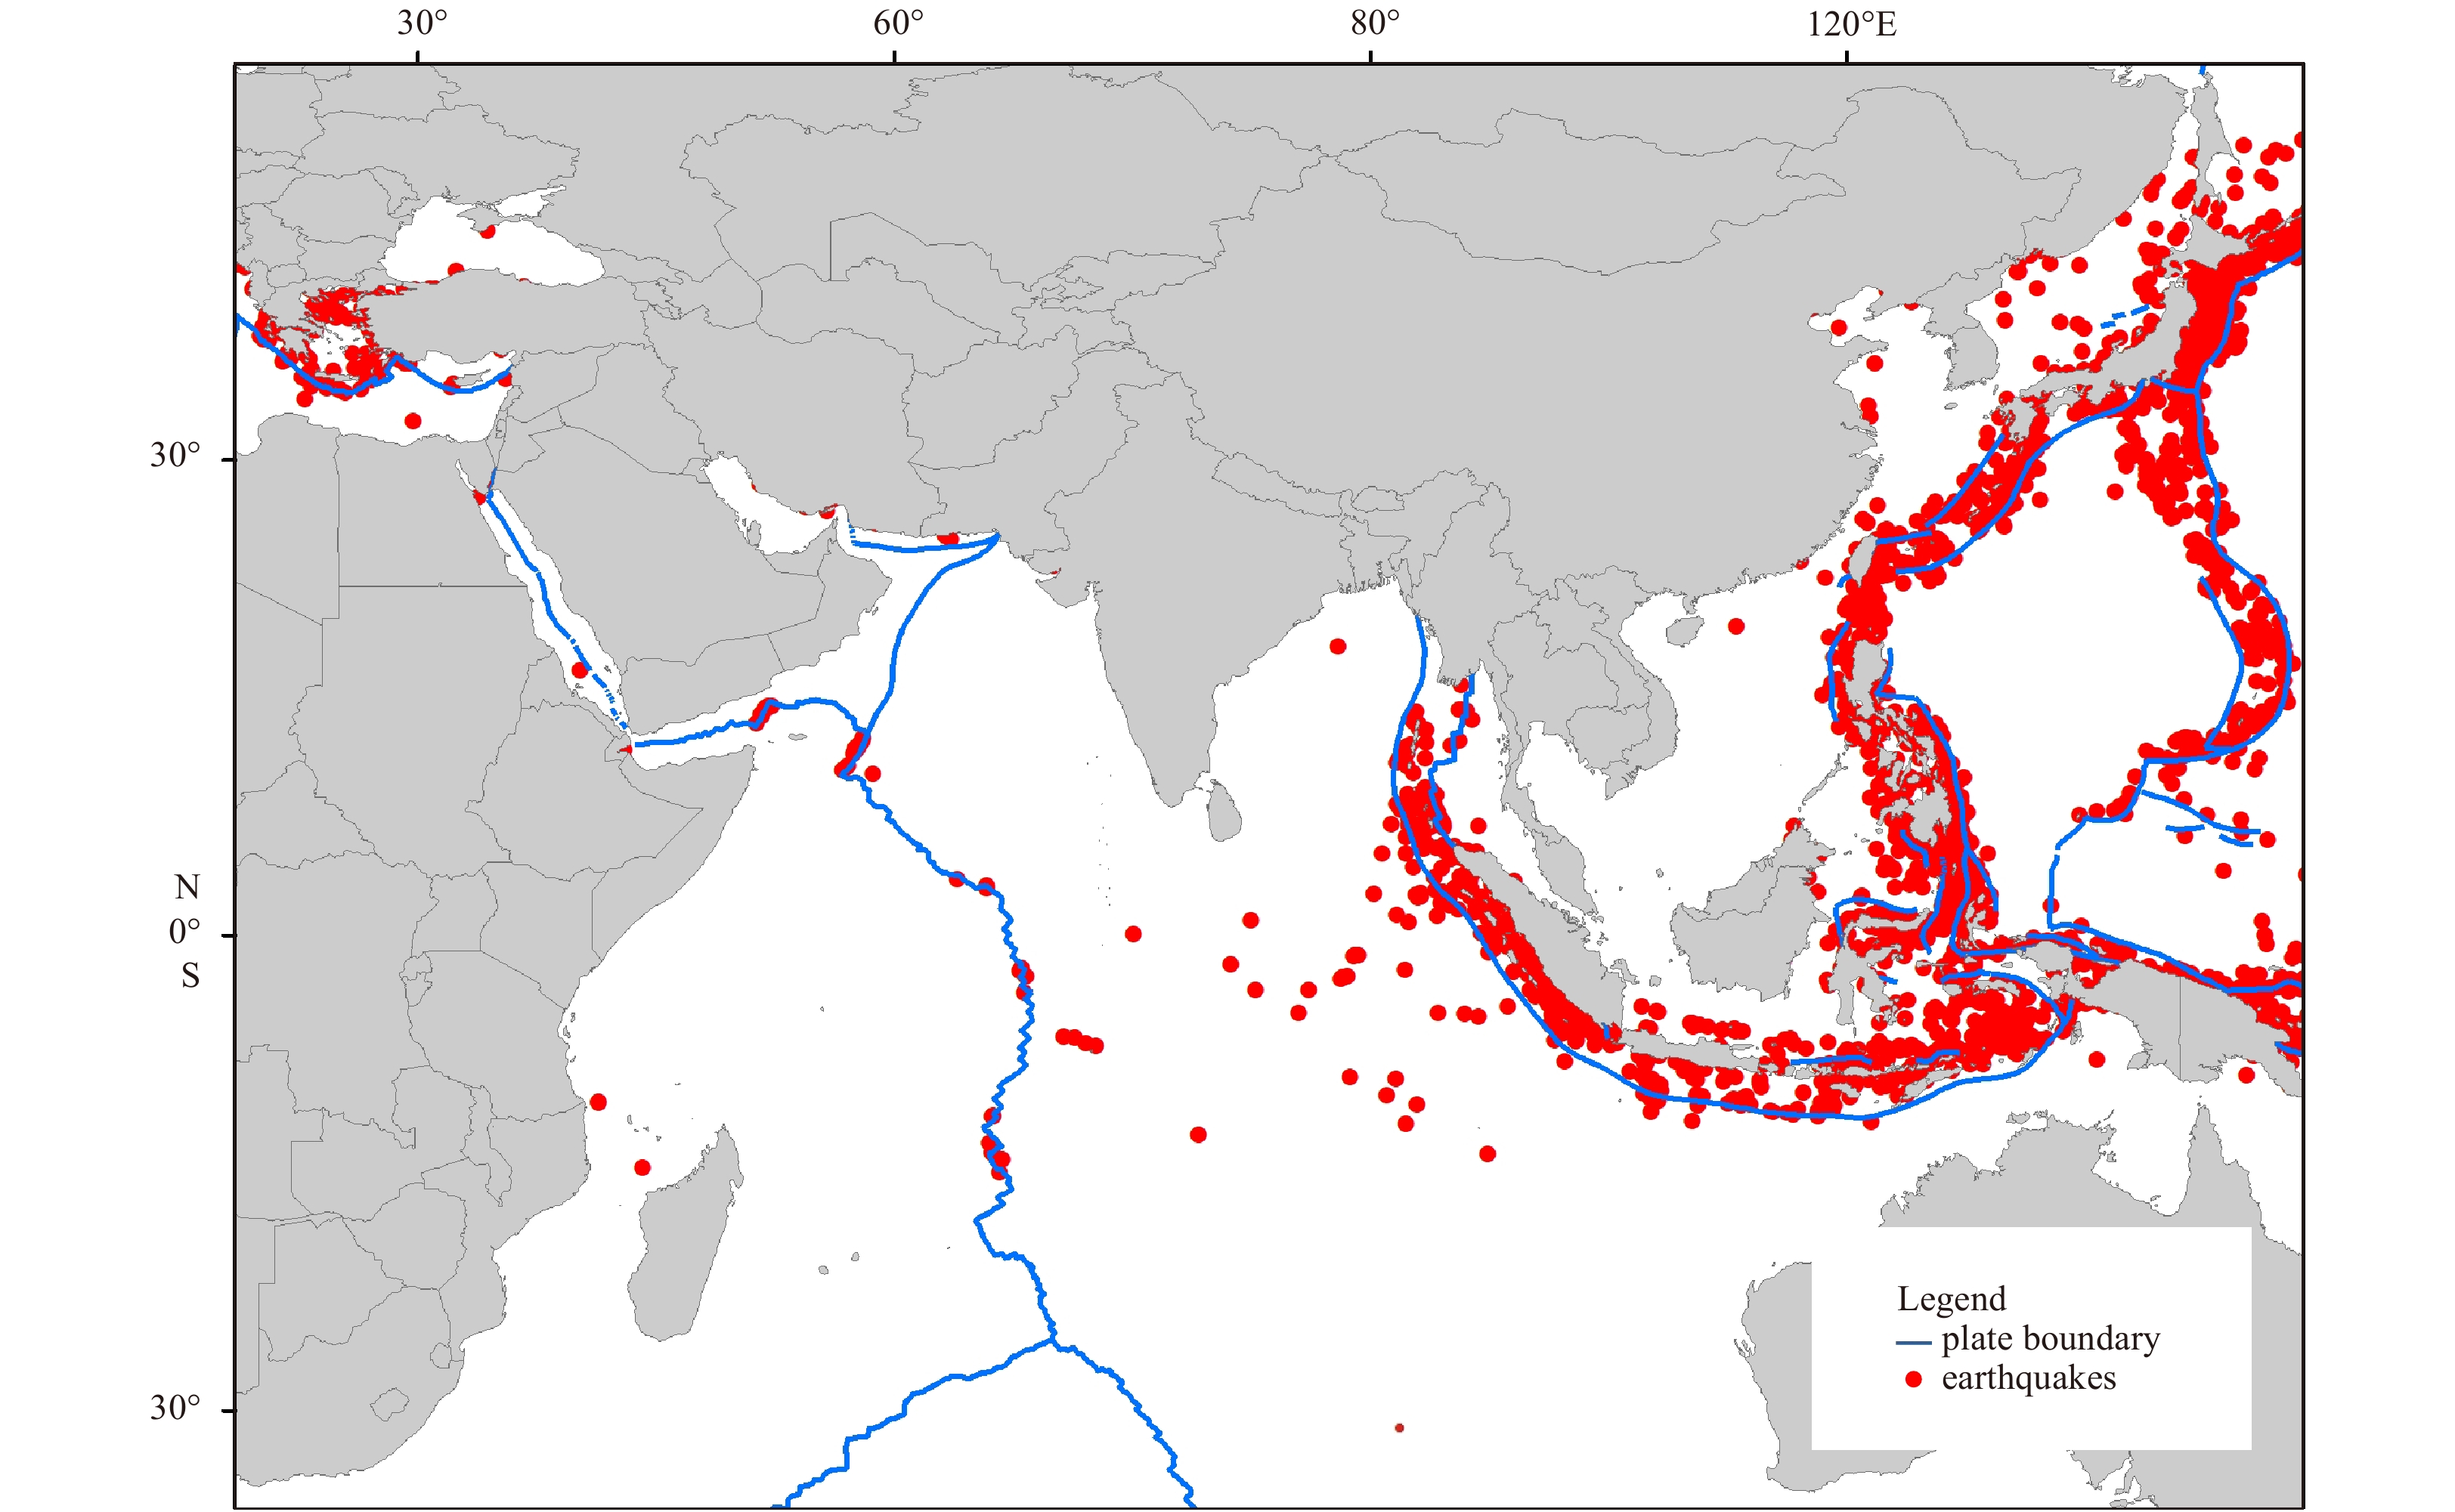
The earthquake data (1917–2017) is from the global seismic database of the United States Geological Survey (USGS, 2018). Figure 1 shows the distribution of historical earthquakes on the Maritime Silk Road. From this figure we can see that earthquakes are mostly distributed on plate boundaries. The northwestern Pacific Ocean and the northeastern Indian Ocean are the most seismically active areas, while there are fewer earthquakes in the mid-west Indian Ocean. The northwestern Pacific Ocean lies on the Circum-Pacific seismic belt, which is one of the world’s major seismic zones. In addition, there are also large earthquakes occurring in the Mediterranean region, which belongs to another large seismic belt, the Eurasia seismic belt.
There are several large tectonic faults on the Maritime Silk Road, which are the sources of major earthquakes and tsunamis. Figure 2 shows 8 main faults on the Maritime Silk Road, including Japan Trench, Nankai Trough, Ryukyu Trench, Mariana Trench, Manila Trench, Philippine Trench, Java Trench and Hellenick Trench.

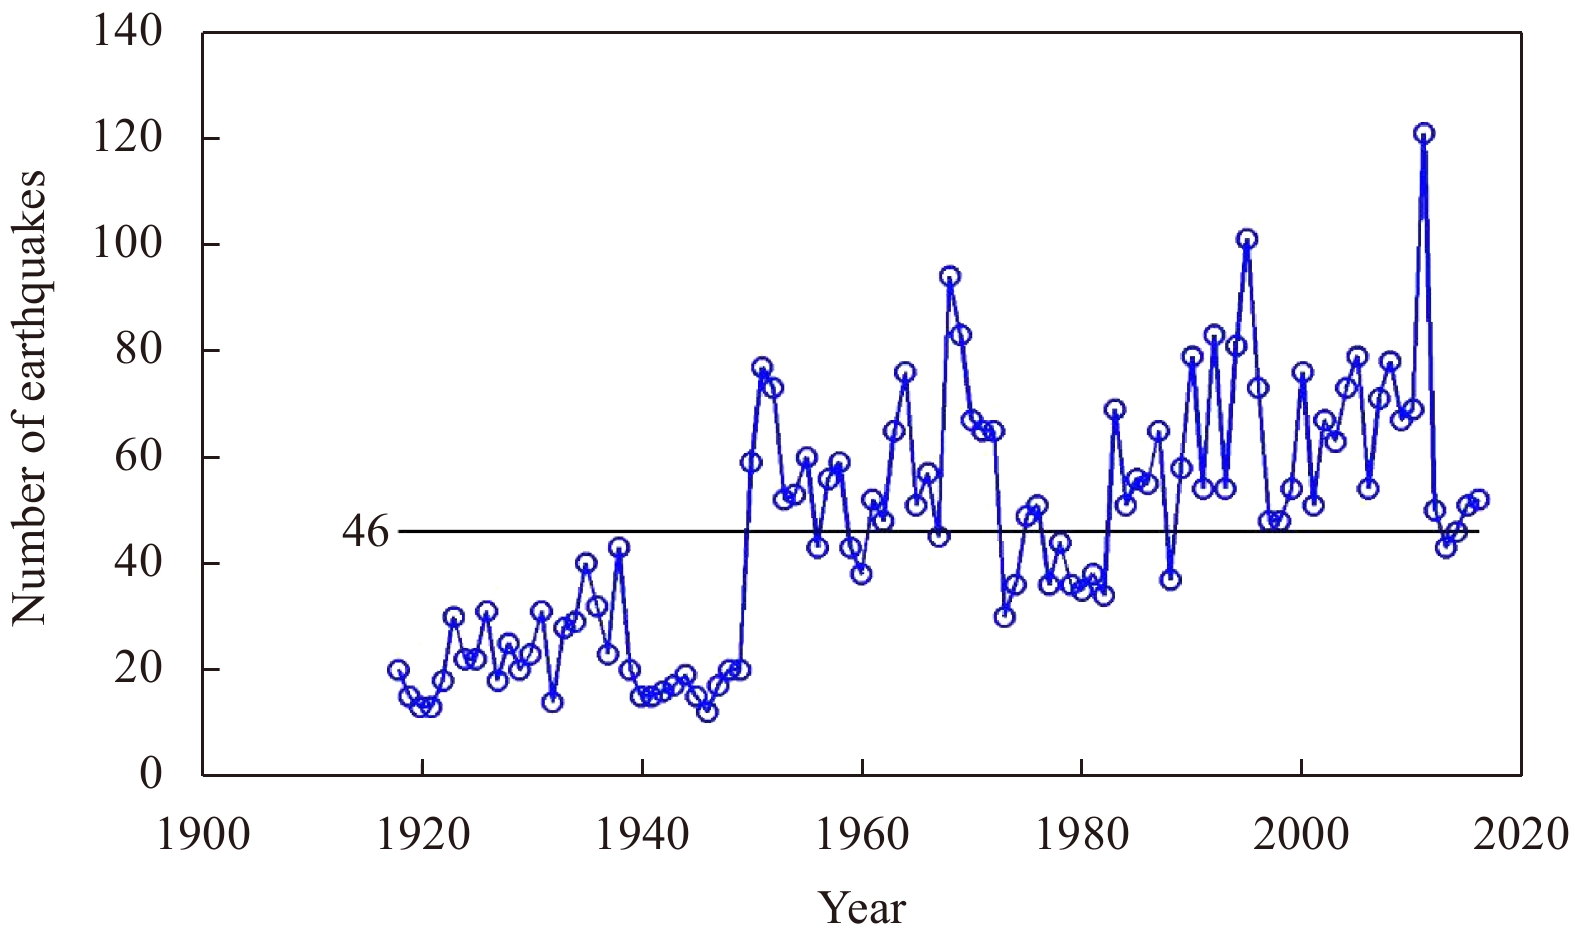
Figure 3 shows the annual earthquakes on the Maritime Silk Road between 1917 and 2017. As can be seen from this figure, the number of earthquakes fluctuated with time, with an peak every three years on average. In the 1950s, the number of earthquakes increased significantly. This is due to the invention and application of modern seismic monitoring equipment, which had improved the ability to monitor earthquakes. In the past 100 years, an average of 46 earthquakes with magnitude above 6 occurred annually along the Maritime Silk Road. The year of 2011 was the most frequent year with 121 earthquakes.

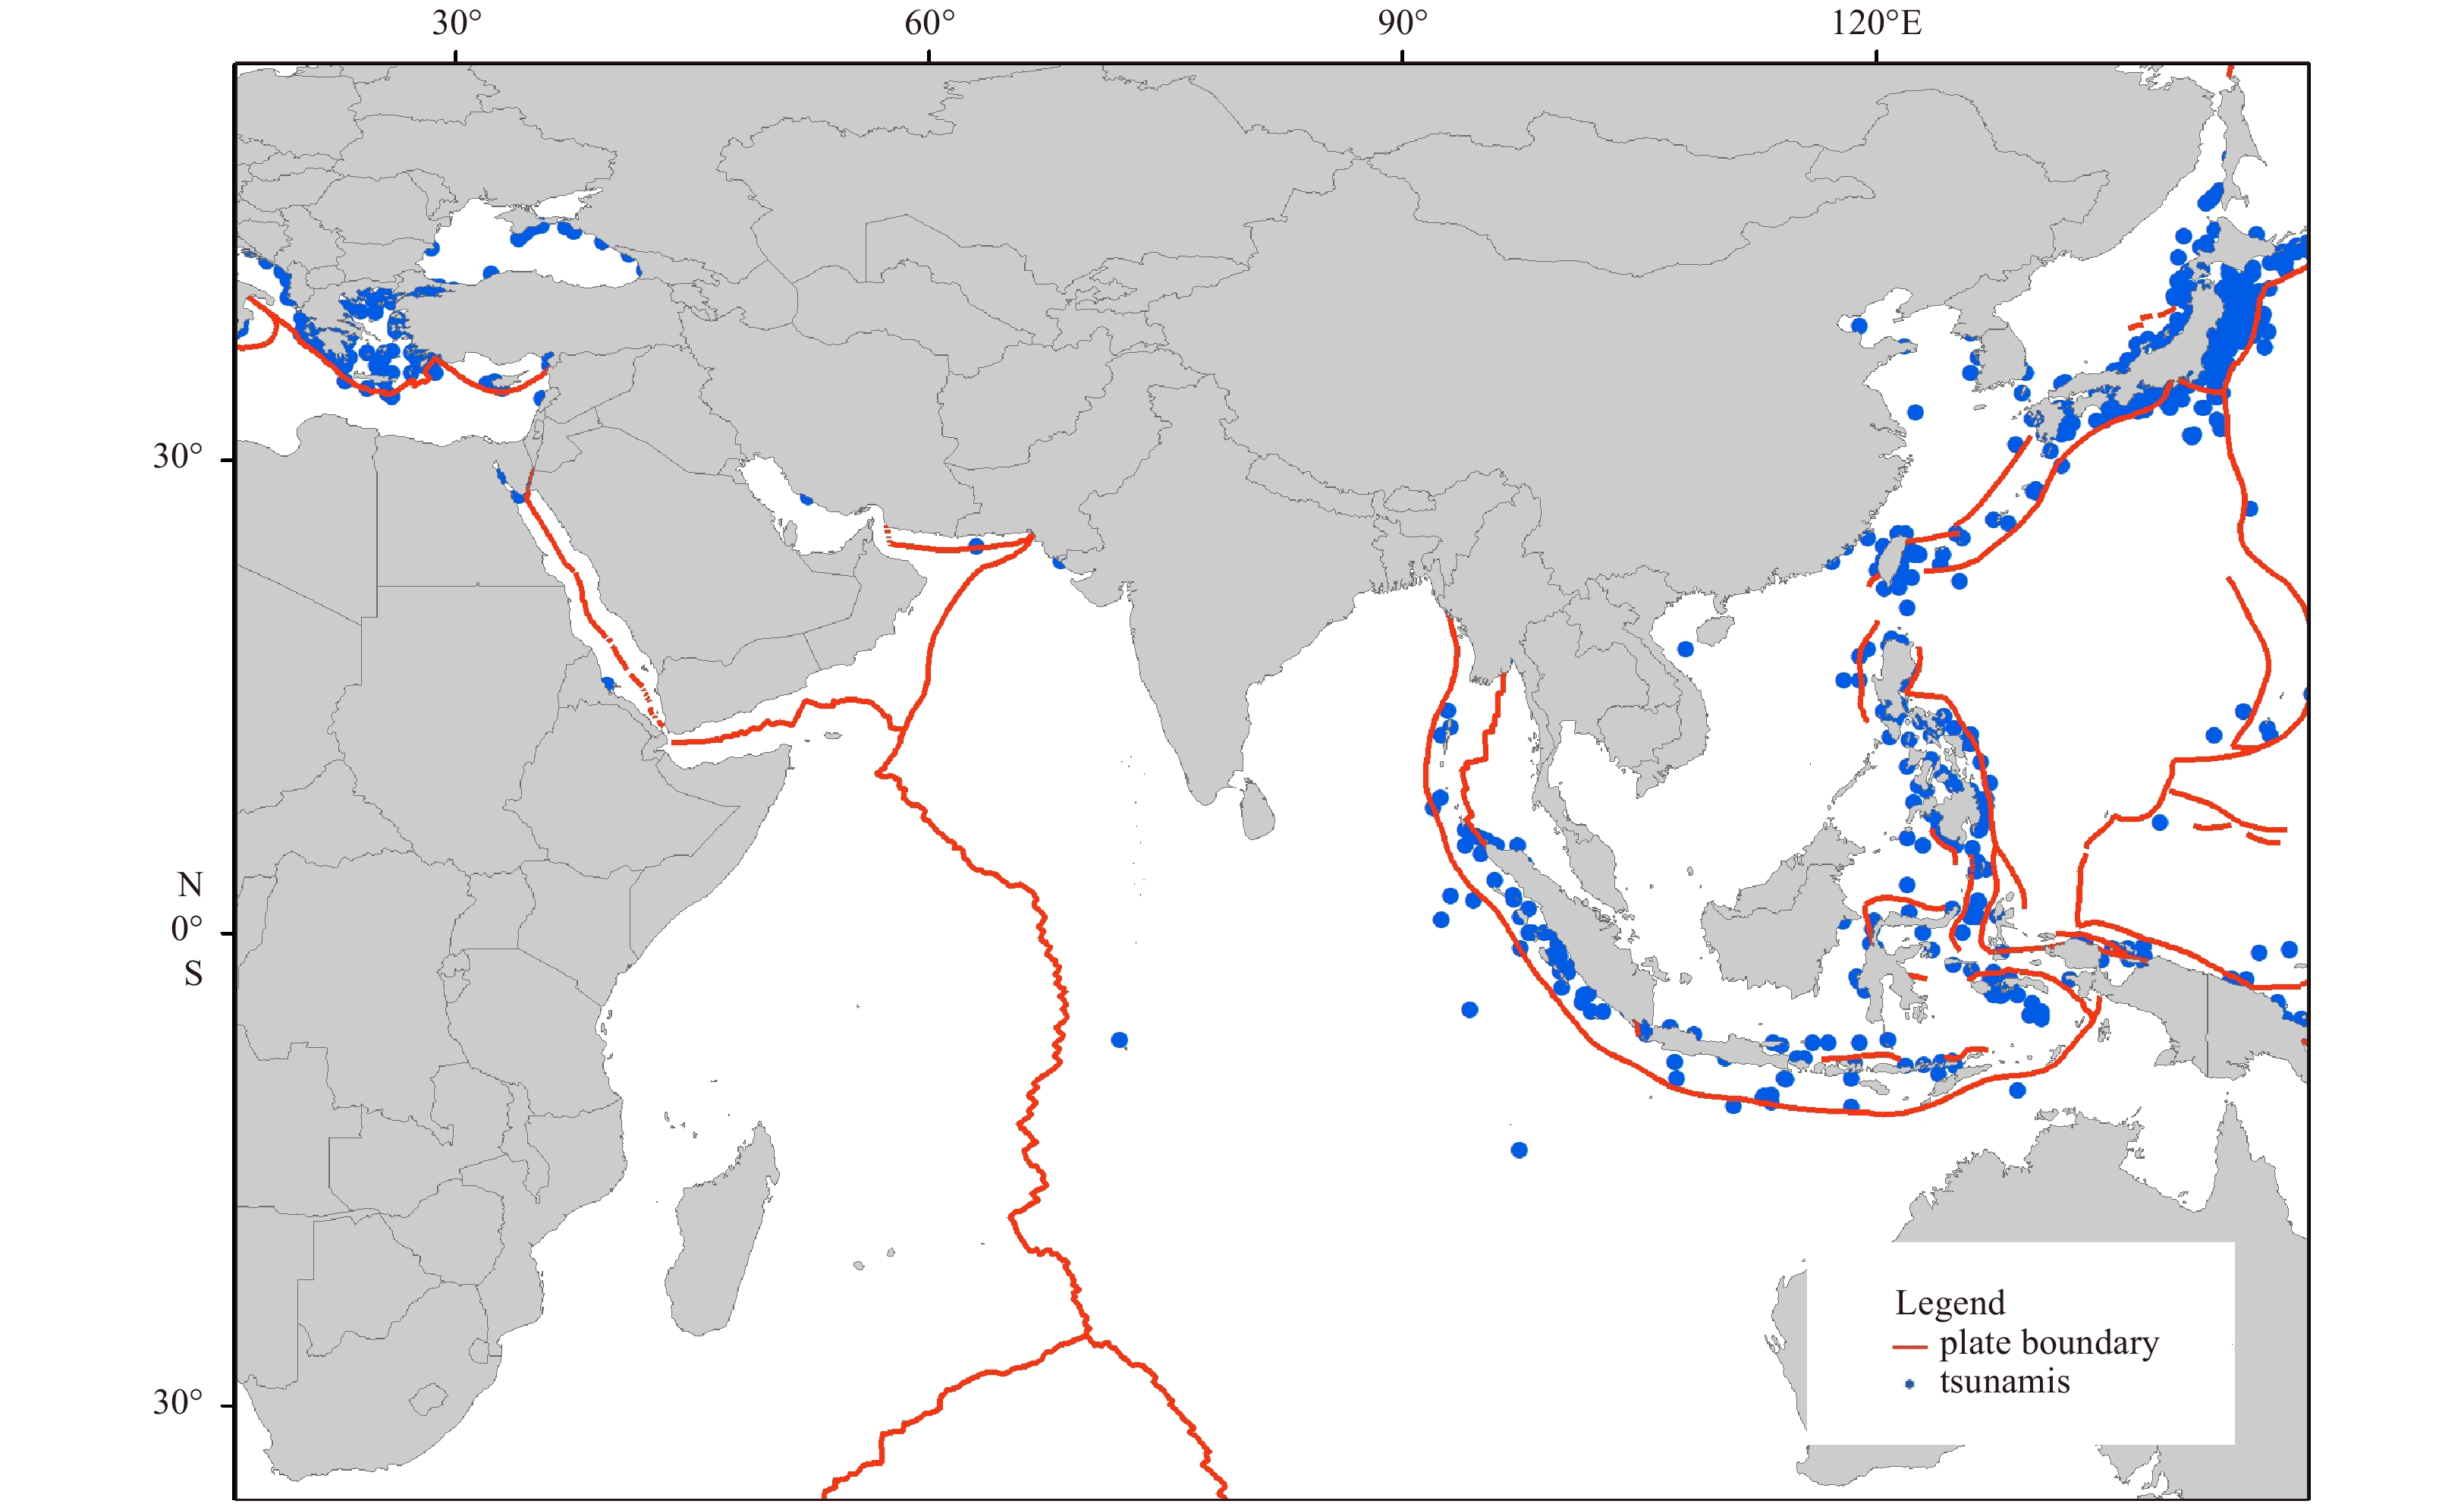
To analyze the spatial and temporal variation of tsunami disasters on the Maritime Silk Road, this study selected tsunami data of past 100 years (1917–2017) from the Global Tsunami Database of National Geophysical Data Center (NGDC, 2018). Figure 4 reveals the spatial pattern of the tsunamis on the Maritime Silk Road. As can be seen from this figure, the tsunami events also generally occurred on plate boundaries. The dense areas of the tsunami event are roughly the same as the intensive earthquake areas in Fig. 1. There are also some differences, such as the relatively smaller number of tsunami events in the Indian Ocean Ridge region. The areas with the most tsunami events include the Northwestern Pacific Ocean, the western waters of Sumatra, and the Mediterranean Sea.

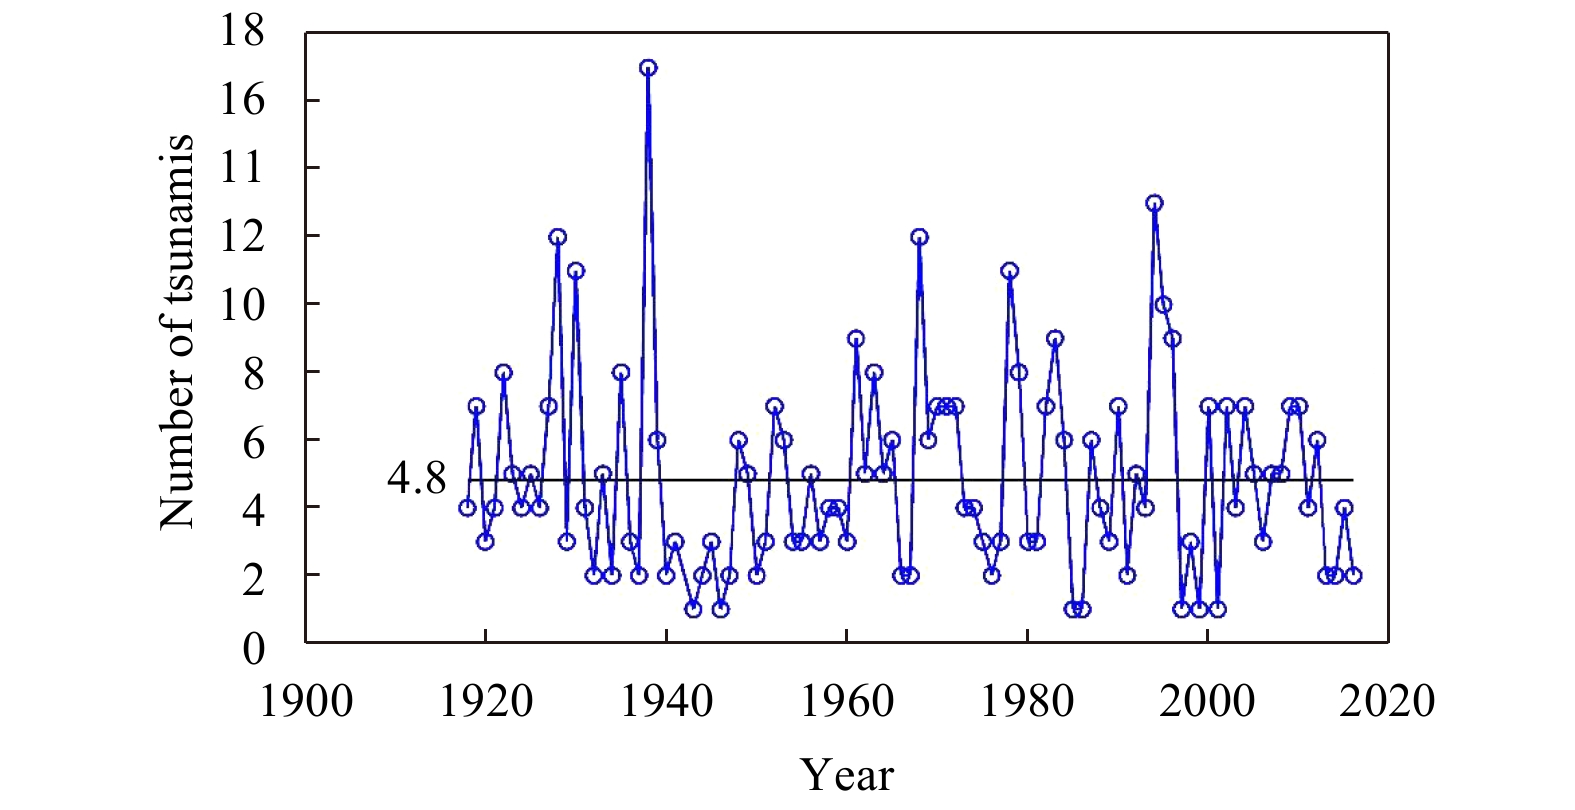
The annual tsunami events (1917–2017) on the Maritime Silk Road is shown in Fig. 5. The annual number of tsunami events also fluctuated over time. In the past 100 a, an average of 4.8 tsunamis have been recorded annually on the Maritime Silk Road. The year of 1938 had the most tsunamis, 17 tsunamis.

Density analysis can help to understand the aggregation of earthquake and tsunami on the Maritime Silk Road. In this paper, the historical earthquake and tsunami events are analyzed by the method of kernel density. The kernel density analysis is the process of interpolation using discrete point (Cai et al., 2013). Each discrete point has different weights, and the points near the center have a larger weight. The algorithm used to determine the default search radius is as follows:
| $$ {\rm {search\;radius }} = 0.9\times\min \left( {SD,\sqrt {\frac{1}{{\ln (2)}}} \times{D_{\rm m}}} \right)\times{n^{ - 0.2}}, $$ | (1) |
where SD is the standard distance, while n is the number of points. Dm represents the median distance. The search radius in this article is 126 km and the output resolution is 30 km. Density analysis was performed in ArcGIS software.
Figure 6 shows the kernel density analysis result of the historical earthquakes with magnitude above 6.0. From the results it can be seen that the most earthquake-intensive areas include the Japan-Taiwan-Philippines area and northwestern water of Sumatera. The seismic density of Mediterranean Sea area is relatively smaller.

The kernel density analysis result of historical tsunamis is shown in Fig.7. The regions with the highest density include the Japan-Taiwan- Philippines area, western water of Sumatera and the Mediterranean region. Compared with the analysis results of Fig. 6, there are not many earthquakes in the Mediterranean region, but the number of tsunamis is relatively bigger. Both the earthquake density and tsunami density in Japan-Taiwan-Philippines area are relatively higher.

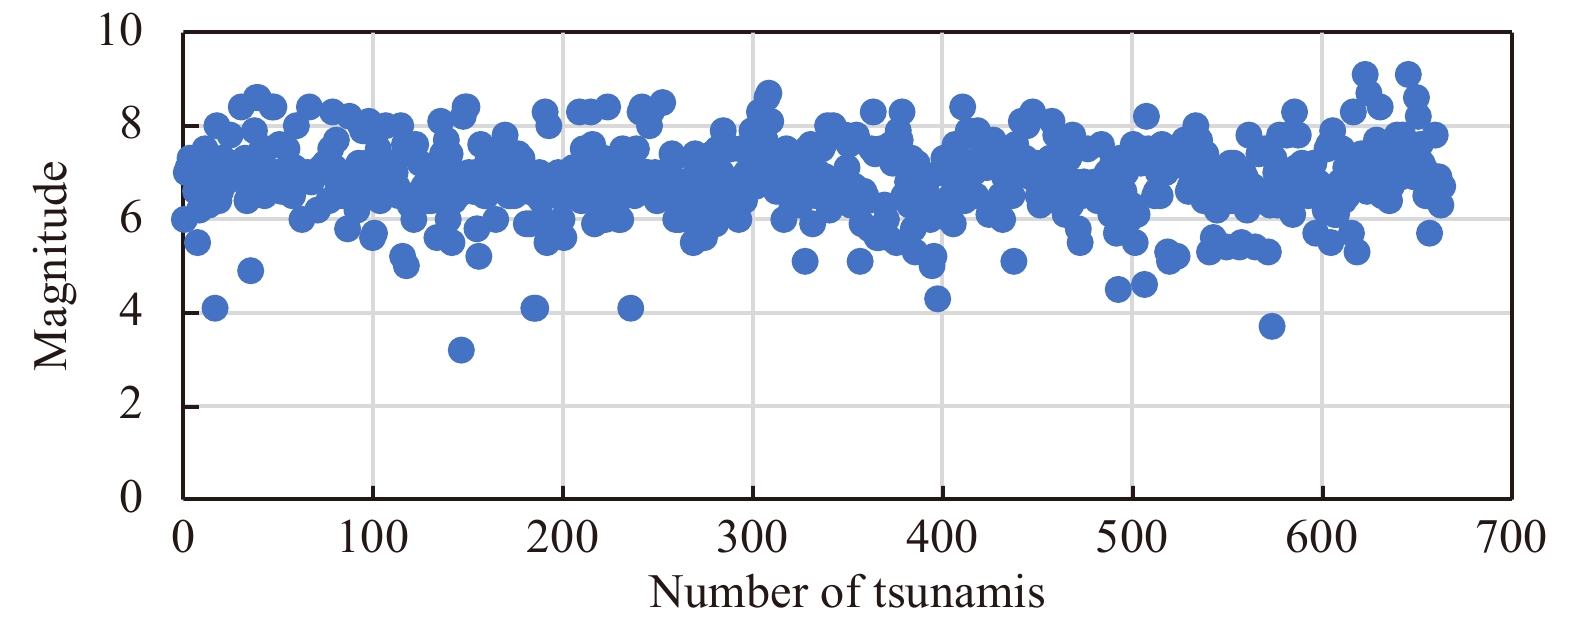
The generation of tsunami is affected by several factors such as seismic parameters and water depth. Not all submarine earthquakes can trigger tsunamis. To explore the occurrence regularity of tsunami on the Maritime Silk Road, this paper analyzed the historical tsunamis from three source parameters, including seismic magnitude, focal depth and water depth. Tsunami data is from the global historical tsunami database of NGDC. Figure 8 shows the seismic magnitude of tsunamis on the Maritime Silk Road. It can be seen from the figure that the seismic magnitudes are generally greater than 6, most of which are concentrated between 6 and 8.

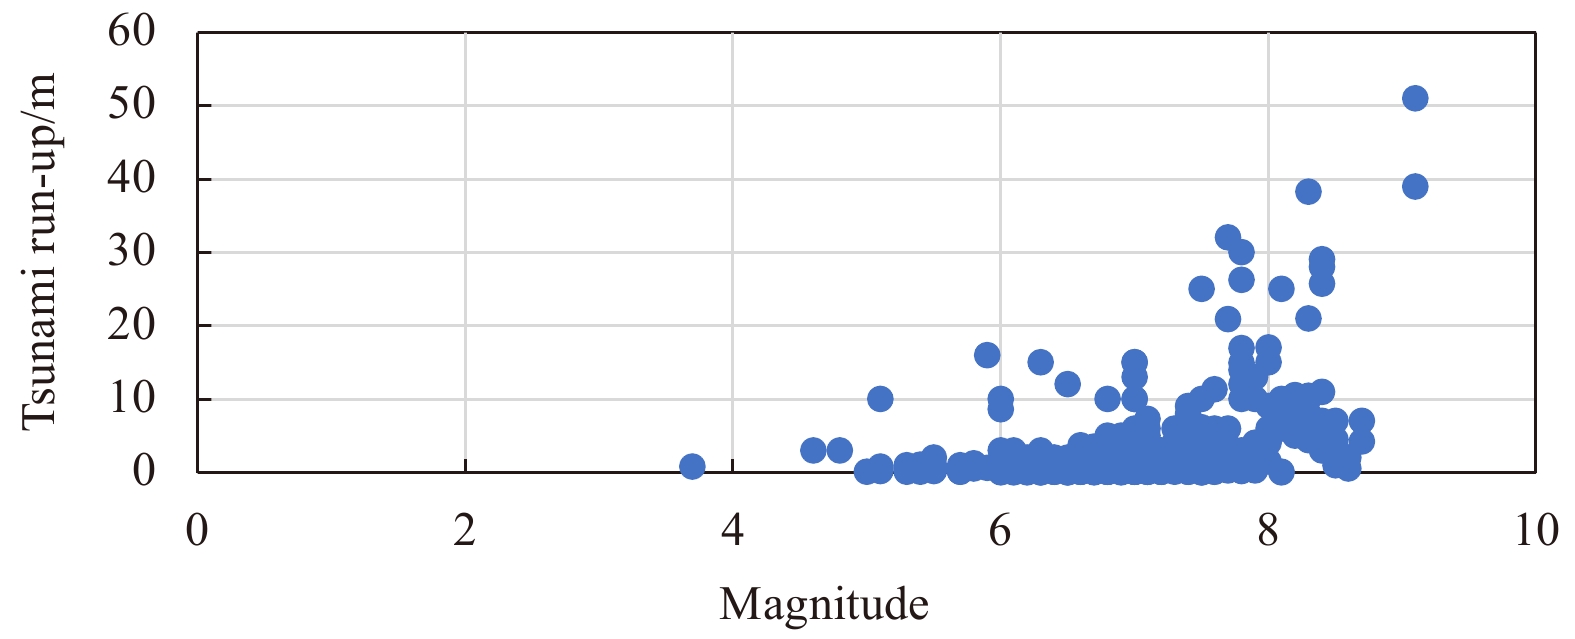
To explore whether a bigger earthquake can trigger bigger tsunami, the relationship between magnitude and tsunami wave run-up is analyzed, as shown in Fig. 9. Seen from this figure, the tsunami wave run-up shows an increasing trend with the increase of magnitude. The maximum tsunami runup is 50.9 m of 2004 Indian Ocean tsunami, followed by 38.9 m of 2011 Japan tsunami.

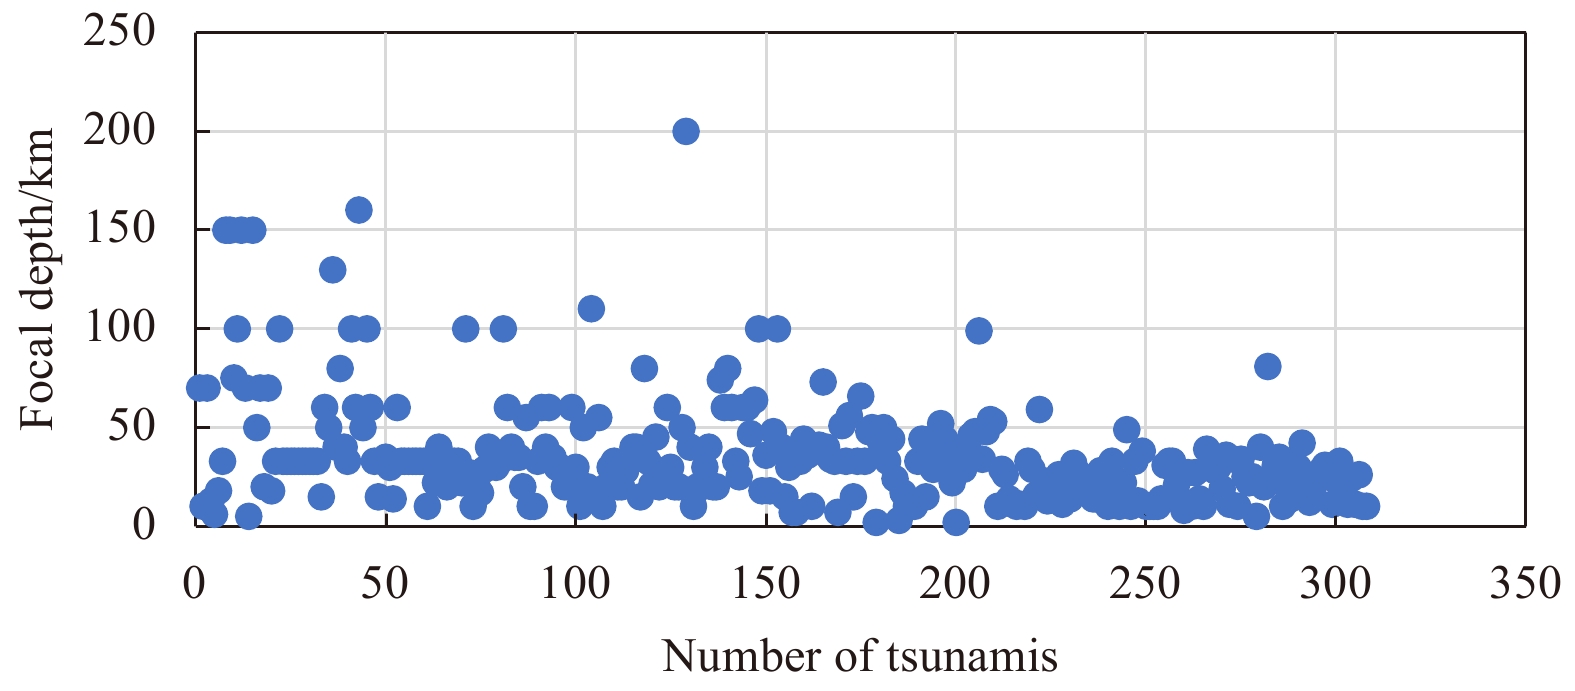
Focal depth is the vertical distance from hypocenter to epicenter. It is an important parameter of seismic source, which is of great significance to understand the tectonic background of energy accumulation and release. An earthquake with a depth less than 60 kilometers is usually called shallow earthquake. Figure 10 shows the focal depth statistics of tsunami earthquakes on the Maritime Silk Road. According to this figure, most of the earthquakes that caused tsunamis are shallow earthquakes.

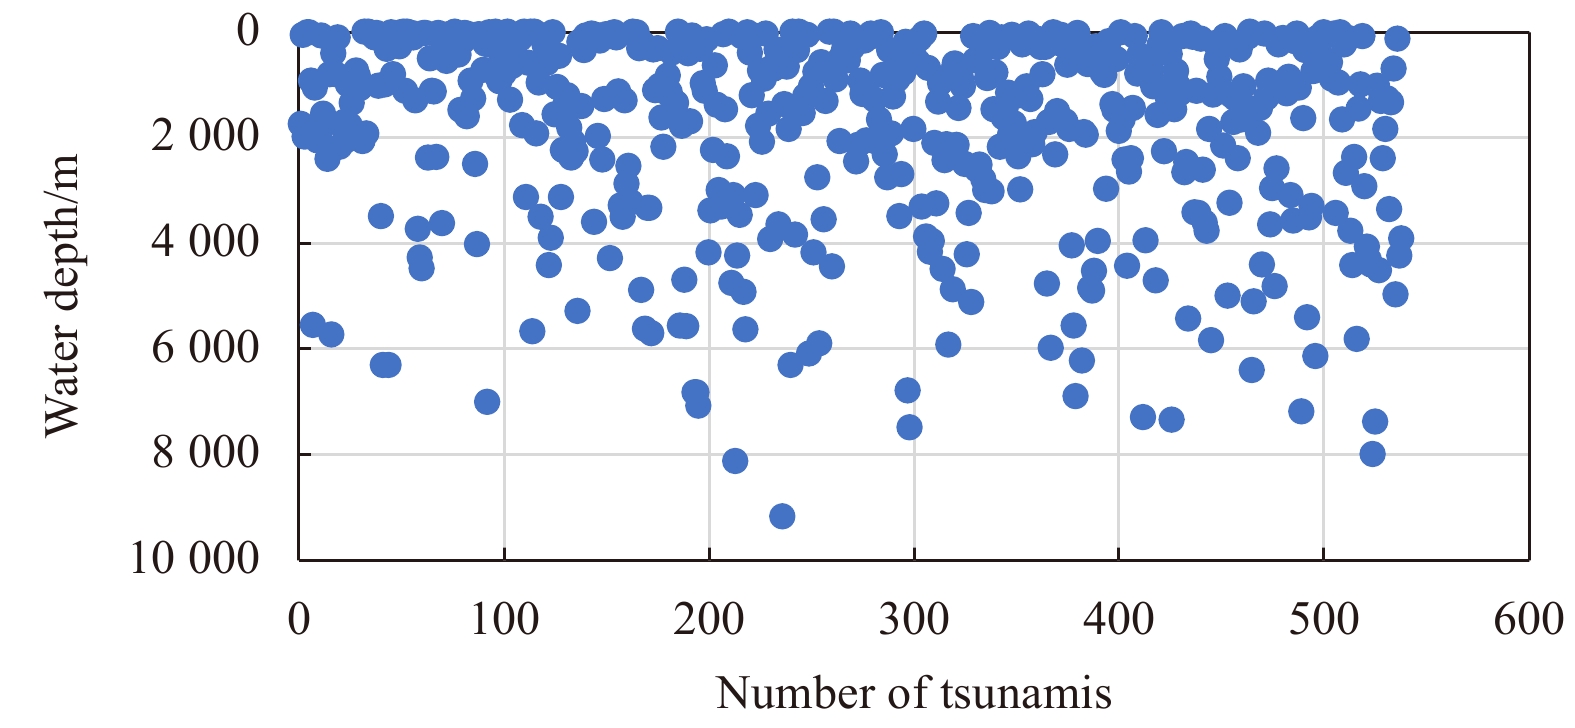
It is generally believed that earthquakes with shallow water depth do not trigger tsunami. Water depth at the location of submarine earthquake is an important factor affecting the tsunami generation. The energy released by an earthquake needs a big enough water body to generate tsunami. To find out the water depth characteristics of tsunamis on the Maritime Silk Road, this paper extracted the water depth at the location of tsunami earthquakes, as shown in Fig. 11. In the figure, the water depths of tsunami sources are less than 9 000 m, most of which are distributed within 3 000 m. The water depth values of the major tsunami events on the Maritime Silk Road from 1917 to 2017 are shown in Table 1. The maximum tsunami runups of these tsunami events in Table 1 are all greater than 10 m. The tsunami events in the table are arranged according to the depth of the water. Seen from this table, the water depths of major tsunamis are between 1 000 and 4 000 m.

| Year | Focal depth/km | Magnitude | Country | Latitude | Longitude | Tsunami run-up/m | Water depth/m |
| 1933 | 35 | 8.4 | Japan | 39.224°N | 144.622°E | 29.0 | –4 124 |
| 1977 | 33 | 8.0 | Indonesia | 11.085°S | 118.464°E | 15.0 | –3 978 |
| 2006 | 34 | 7.7 | Indonesia | 9.254°S | 107.411°E | 20.9 | –3 522 |
| 1994 | 18 | 7.8 | Indonesia | 10.477°S | 112.835°E | 13.9 | –3 440 |
| 2006 | 10 | 8.3 | Japan | 46.592°N | 153.266°E | 21.9 | –3 310 |
| 1993 | 17 | 7.7 | Japan | 42.851°N | 139.197°E | 32.0 | –2 881 |
| 1983 | 24 | 7.8 | Japan | 40.462°N | 139.102°E | 14.9 | –2 632 |
| 2010 | 20 | 7.8 | Indonesia | 3.487°S | 100.082°E | 16.9 | –2 373 |
| 1992 | 28 | 7.8 | Indonesia | 8.48°S | 121.896°E | 26.2 | –2 285 |
| 1956 | 20 | 7.8 | Greece | 36.90°N | 26.000°E | 30.0 | –1 471 |
| 2004 | 30 | 9.1 | Indonesia | 3.316°N | 95.854°E | 50.9 | –1 062 |
| 2011 | 30 | 9.1 | Japan | 38.297°N | 142.372°S | 38.9 | –1 002 |
 DownLoad:
CSV
DownLoad:
CSV
Generally, the earthquake with bigger magnitude has the higher probability of triggering a tsunami. However, the probability of tsunami caused by different magnitudes is still unclear. Therefore, this paper used Bayes’ theorem to study the tsunami probability on the Maritime Silk Road.
Bayes’ theorem is proposed by British scholar Thomas Beyes in 18th century, which can solve the conditional probability of random variables (Liu et al., 2017). In some probability events, Bayes’ theorem analysis results can modify some existing conclusions. It is mainly based on the prior knowledge of conditions related to the event (Gorsevski et al., 2003). In the case of tsunami probability, the tsunami probability of different magnitudes can instruct the tsunami warning and risk assessment, which is of great significance for tsunami disaster mitigation. The equation of this theorem is as follows:
| $$ P(A|B) = \frac{{P(AB)}}{{P(B)}} = \frac{{P(B|A)P(A)}}{{P(B)}}. $$ | (3) |
In the Eq. (2), A and B are random events. P(A) and P(B) are the probabilities of A and B independently of each other. P(A|B) is the probability of A given B. Because each fault has its own geological structure, the tsunami probability is different. In this paper, 8 major faults on the Maritime Silk Road are studied to discuss the tsunami probability of different magnitudes.
The probability analysis result (Table 2) shows that all earthquakes with magnitude above 8.0 can trigger tsunami. On average, the probability of an M(5.0–5.9) earthquake triggering a tsunami is less than 1%; the probability of an M(6.0–6.9) earthquake triggering a tsunami is around 10%; and the probability of an M(7.0–7.9) earthquake triggering a tsunami is almost 30%–40%. In Japan Trench, the tsunami probability of earthquakes with magnitude above 7.0 is 100.0%. According to the comparison of 8 trenches, earthquakes in Japan Trench are more likely to trigger tsunamis.
| Trenches | M(5.0–5.9) /% | M(6.0–6.9) /% | M(7.0–7.9) /% | M(8.0–8.9) /% | M>9.0 /% |
| Japan Trench | 0.2 | 14.8 | 100.0 | 100.0 | 100.0 |
| Java Trench | 0.1 | 3.9 | 34.8 | 100.0 | 100.0 |
| Nankai Trough | 0.2 | 7.1 | 40.1 | 100.0 | – |
| Ryukyu Trench | 0.1 | 4.1 | 39.5 | 100.0 | – |
| Philippine Trench | 0.2 | 3.3 | 37.8 | 100.0 | – |
| Manila Trench | 0.6 | 11.9 | 41.7 | – | – |
| Hellenick Trench | 0.9 | 13.6 | 43.3 | – | – |
| Mariana Trench | – | 5.6 | 14.3 | – | – |
DownLoad:
CSV
Focal mechanism solution is a method of distinguishing fault types and seismogenic mechanisms. After an earthquake occurs, the focal mechanism solution can be obtained by mathematical analysis of the seismic wave signals received by different seismic stations. The focal mechanism solution can not only make people understand the types of fault, but also reveal the specific motion of the seismic fault. The plate collision motion at the oceanic trench is complex. However, large plates have a general direction of movement. Generally, there is a typical source mechanism solution of large trench where tsunami occurs. This paper carried out statistical analysis on the focal mechanism solution using the Global Centroid Moment Tensor database, and gave the average of typical focal mechanism solutions of 8 main tectonic faults, as shown in Table 3. There are 5 trenches with the percentage of typical focal mechanism solutions more than 50%. The percentage of typical focal mechanism solution in Japan Trench is the highest, 83.3%. The typical value of the focal mechanism solution can reflect the general rupture of the fault, which is helpful to tsunami warning and tsunami disaster mitigation.
| Trenches | Strike/(°) | Dip/(°) | Slip/(°) | Percentage/% |
| Japan Trench | 205 | 21 | 88 | 83.3 |
| Java Trench | 307 | 22 | 101 | 62.5 |
| Nankai Trough | 251 | 26 | 79 | 66.8 |
| Ryukyu Trench | 41 | 28 | –67 | 41.4 |
| Philippine Trench | 160 | 31 | 72 | 76.2 |
| Manila Trench | 162 | 33 | –146 | 46.2 |
| Hellenick Trench | 265 | 35 | –50 | 57.1 |
| Mariana Trench | 201 | 34 | –96 | 43.5 |
DownLoad:
CSV
Numerical simulation is an important method in tsunami research. It can show the impact extent of some potential tsunamis and help people understand the tsunami hazard in advance (Ren et al., 2017). Some tsunami numerical models can simulate the whole lifespan of tsunami from generation, propagation, to inundation, based on the physical characteristics of tsunami waves.
The FUNWAVE model with Boussinesq equation was used in this paper, which had been validated by scholars (Shi et al., 2012). In recent years, many scholars had applied the Boussinesq equation to tsunami numerical computation. Peregrine et al. (1967) derived the standard Boussinesq equation with variable depth, according to the average depth velocity and free surface displacement. Compared with the shallow water equations, the Boussinesq equation take the frequency dispersion into account (Wang and Liu, 2006). It is shown that the numerical results obtained by using this equation are consistent with field data. The Boussinesq equation used in FUNWAVE model is as follows:
| $$\begin{split} {H_t} + & {\frac{1}{{{r_0}\cos\theta }}\left\{ {{{\left( {H{u_{\alpha} }} \right)}_{\phi} } + {{\left( {H{v_{\alpha} }\cos\theta } \right)}_{\theta} }}+ \right.}\\ & { \frac{1}{{r_0^2\cos\theta }}{{\left[ {h\left( {\left( {{z_{\alpha} } + \frac{1}{2}h} \right){A_{\phi} } + \left( {\frac{{z_{\alpha} ^2}}{2} - \frac{{{h^2}}}{6}} \right){B_{\phi} }} \right)} \right]}_{\phi} }}+\\ & { \left. \frac{1}{{r_0^2}}\left[h\cos\theta {{\left( {\left( {\left( {{z_{\alpha} } + \frac{1}{2}h} \right){A_{\theta} } + \left( {\frac{{z_{\alpha} ^2}}{2} - \frac{{{h^2}}}{6}} \right){B_{\theta} }} \right)} \right]}_{\theta} }\right\} \right. = 0,} \end{split} $$ | (4) |
| $$ \begin{split} {u_{\alpha t}} -& {{{f}}{v_{\alpha} } + \frac{1}{{{r_0}\cos\theta }}{u_{\alpha} }{u_{\alpha \phi }} + \frac{1}{{{r_0}}}{v_{\alpha} }{u_{\alpha \theta }} + \frac{g}{{{r_0}\cos\theta }}{\eta _{\phi} }}+\\ & { \frac{1}{{r_0^2\cos\theta }}\left\{ {{z_{\alpha} }{A_{t\phi }} + \frac{{z_{\alpha} ^2}}{2}{B_{t\phi }}} \right\} + \frac{{{C_d}}}{H}\left| {{U_{\alpha} }} \right|{u_{\alpha} } = 0,} \end{split} $$ | (5) |
| $$ \begin{split} {v_{\alpha t}} +& { {\rm{f}}{u_{\alpha} } + \frac{1}{{{r_0}\cos\theta }}{u_{\alpha} }{v_{\alpha \phi }} + \frac{1}{{{r_0}}}{v_{\alpha} }{v_{\alpha \theta }} + \frac{g}{{{r_0}}}{\eta _{\theta} }}+\\ & { \frac{1}{{r_0^2}}\left\{ {{z_{\alpha} }{A_{t\theta }} + \frac{{z_{\alpha} ^2}}{2}{B_{t\theta }}} \right\} + \frac{{{C_d}}}{H}\left| {{u_{\alpha} }} \right|{u_{\alpha} } = 0,} \end{split} $$ | (6) |
where Cd represents the drag coefficient, and θ and φ are latitude and longitude respectively. r0 is the Earth’s radius, and f is Coriolis. H= h+η is the total water depth, and uα and vα represent the velocity in the east and north direction respectively.
In this paper, 8 potential tsunami sources of major tectonic faults were assumed and simulated by the FUNWAVE model. The locations of hypothesized tsunami sources are shown in Table 4. The input bathymetry data is the ETOPO data with the grid resolution of 2 arc minutes. The coastline of the bathymetry data has been revised using Landsat imagery. And the source parameters used in the tsunami numerical calculations are based on Table 3. In order to analyze the maximum possible tsunami wave on the Maritime Silk Road, the magnitudes of these potential tsunami sources were set as 9.0.
| Trenches | Locations | Magnitude (Mw) |
| Japan Trench | 38.103ºN, 142.86ºE | 9.0 |
| Nankai Trough | 31.833ºN, 133.50ºE | 9.0 |
| Ryukyu Trench | 25.68ºN, 128.81ºE | 9.0 |
| Mariana Trench | 12.50ºN, 142.50ºE | 9.0 |
| Philippine Trench | 13.70ºN, 125.33ºE | 9.0 |
| Manila Trench | 14.47ºN, 119.17ºE | 9.0 |
| Java Trench | 3.32ºN, 95.85ºE | 9.0 |
| Helennick Trench | 35.50ºN, 26.00ºE | 9.0 |
DownLoad:
CSV
To show the tsunami hazard of the Maritime Silk Road more clearly, the maximum amplitude of 8 potential tsunamis was superimposed. Each grid point takes the maximum value. The result is shown in Fig. 12. As shown in this figure, many areas on the Maritime Silk Road face serious tsunami threat. The most dangerous tsunami sources are the Ryukyu Trench, Manila Trench, Java Trench and Helennick Trench. These potential major tsunamis will affect not only the area around the source, but also the other side of the waters. The maximum tsunami amplitude on the coast of the Maritime Silk Road can reach 7 m. Some tsunamis can spread to neighboring countries in a very short time. For example, if a large tsunami occurs in the Manila Trench, the tsunami wave can spread to the entire South China Sea coast in 3 hours, which puts forward higher requirements for tsunami warning and disaster mitigation. A tsunami could affect many countries along the ocean coast, so it is necessary to strengthen international cooperation to cope with the tsunami disaster. In addition, the tsunami may cause some secondary disasters such as fires, gas leaks, explosions, radioactive pollution, and landslides. The catastrophic impact of the tsunami should cause concern.

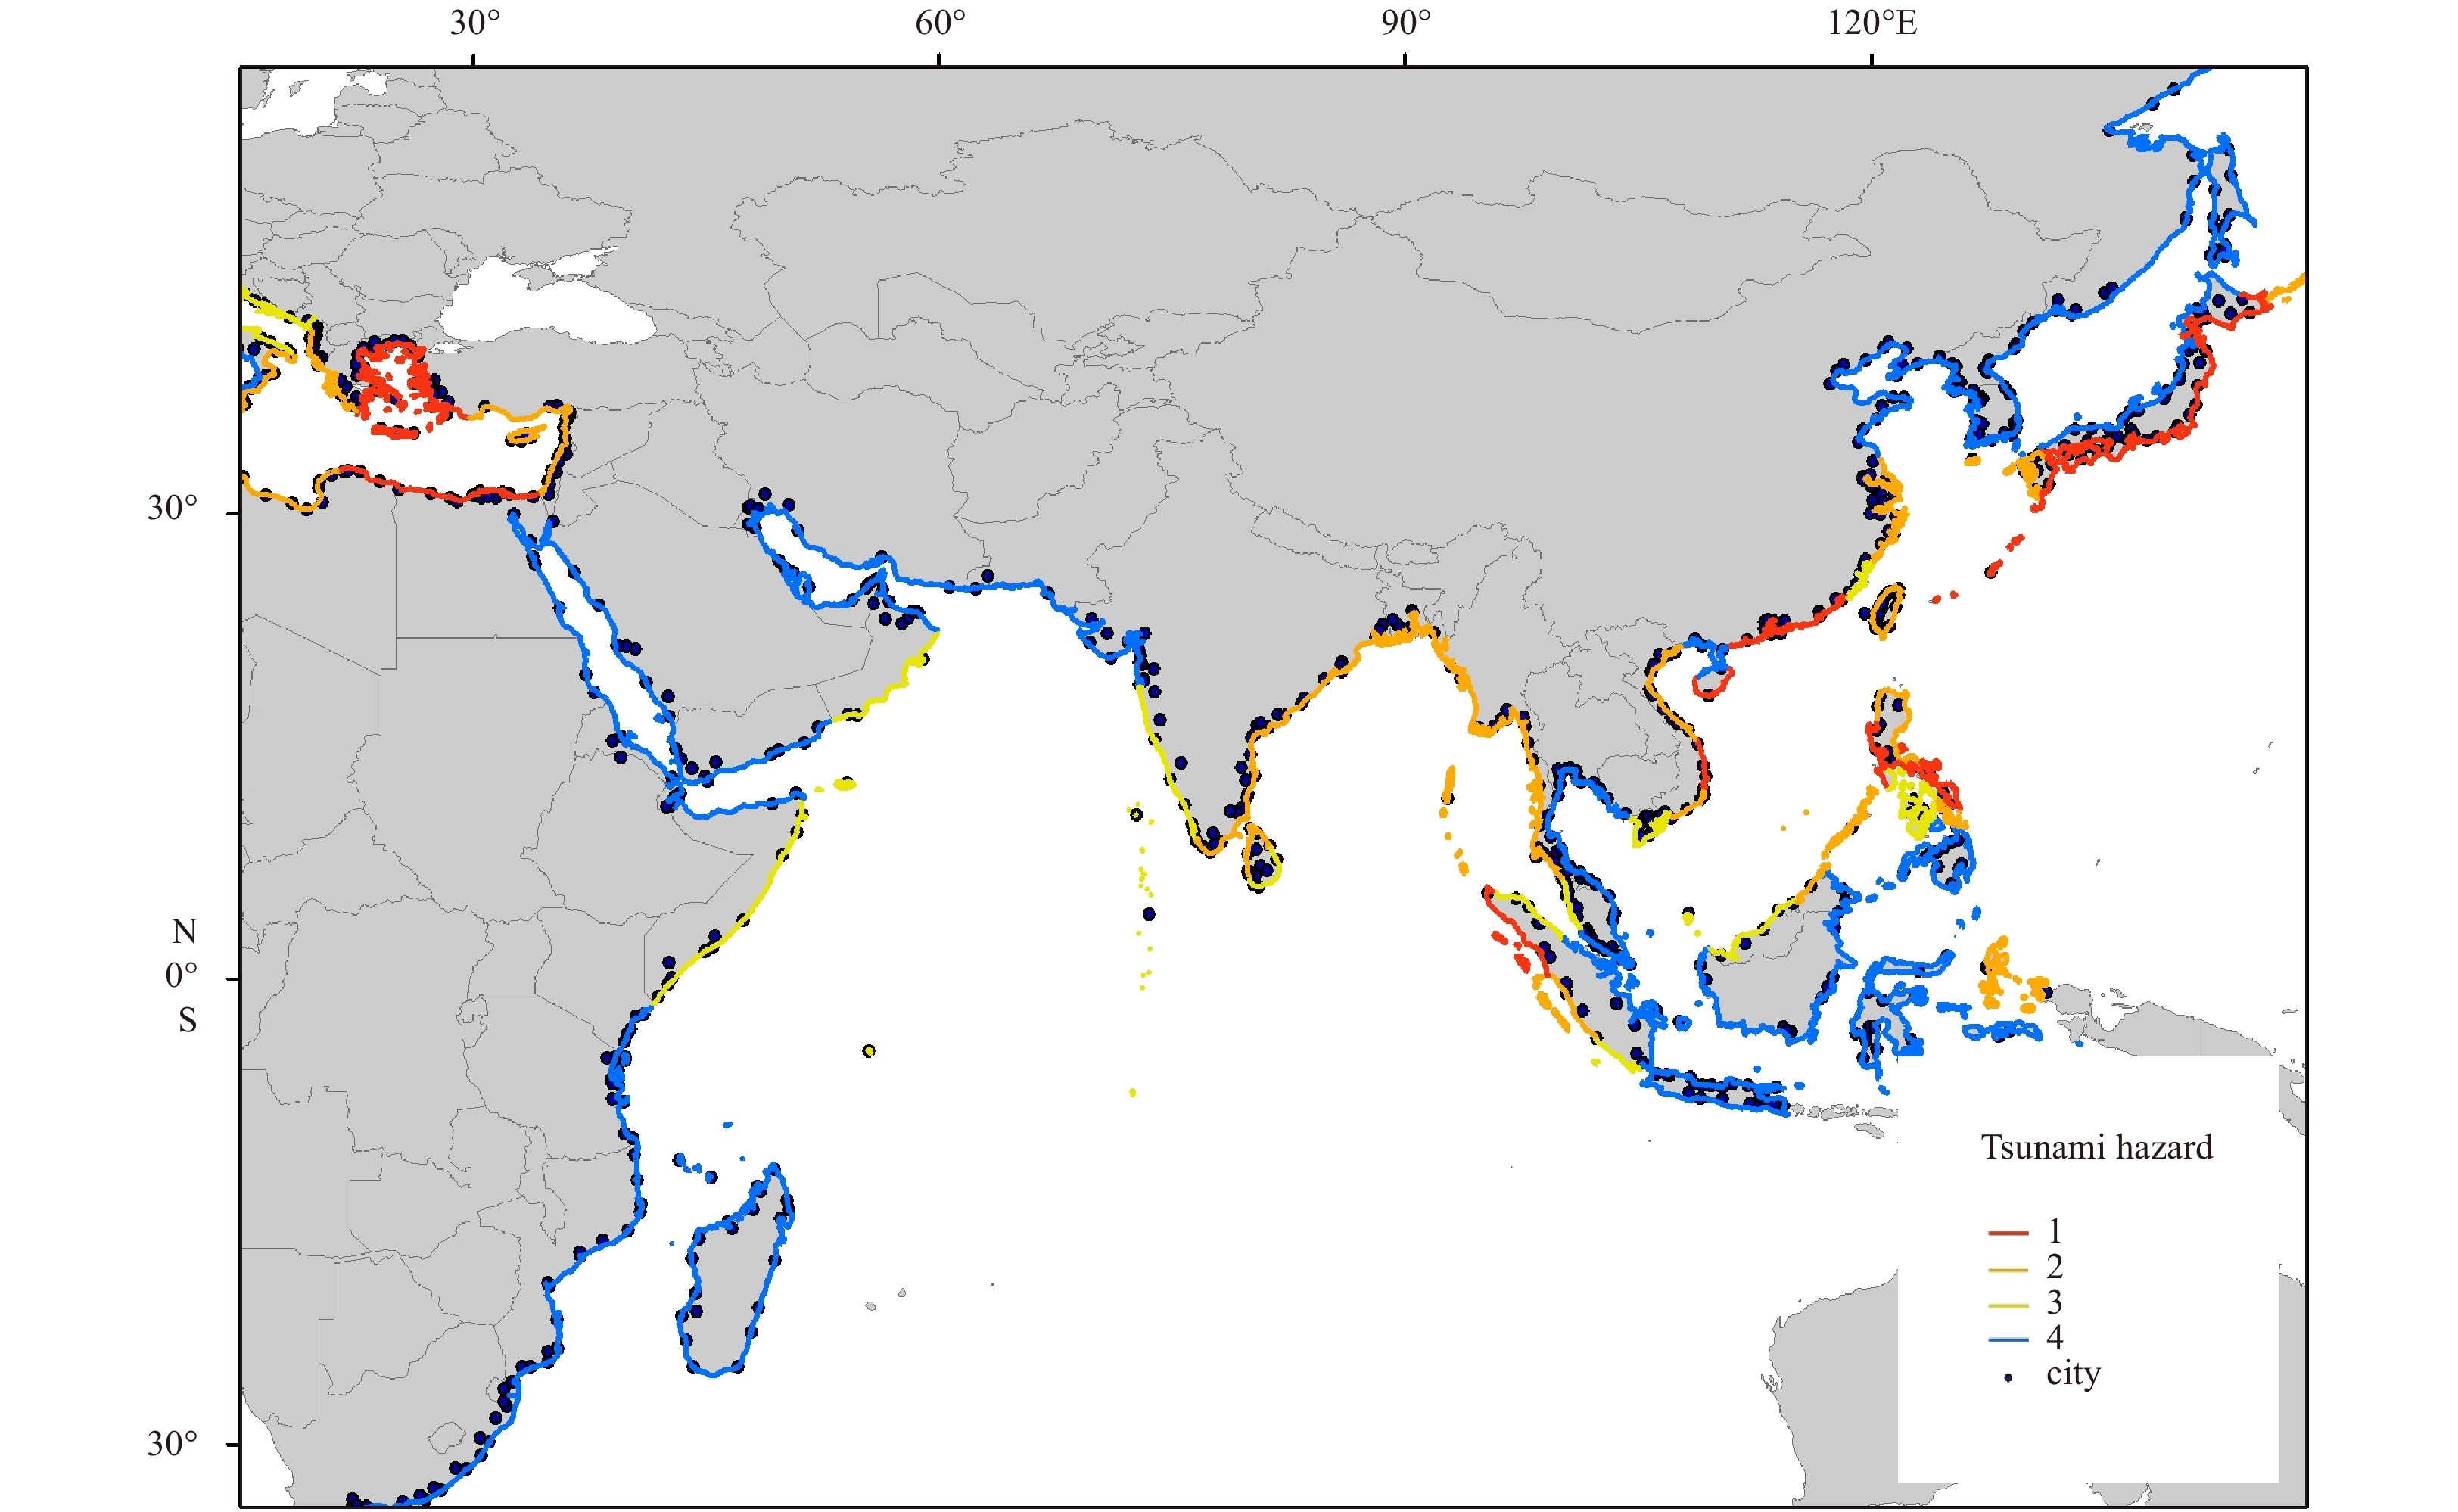
Based on the maximum amplitude superposition of potential tsunamis in Fig. 12, this paper classifies the tsunami hazard of the Maritime Silk Road. The classification criteria is shown in Table 5, according to the warning levels of the Pacific Tsunami Warning Center. The classification result of Fig. 13 shows the tsunami hazard on the Maritime Silk Road. The tsunami hazard was divided into Level 1, 2, 3 and 4. The areas with tsunami hazard level 1 includes the Japan coast, the coast of the South China Sea, the western coast of the Java and the Mediterranean coast. The coast of the East China and the Bay of Bengal coast is level 2 of tsunami hazard. There are 68 cities with more than 100 000 people within 10 km of the coastline of tsunami hazard Level 1. The total affected population is about 129 million. The nuclear power plants, large chemical plants and other dangerous goods areas in this region are exposed to major tsunami hazard. Therefore, it is necessary to carry out tsunami hazard assessment and risk investigation in advance.
| Tsunami amplitude/m | Hazard level | Color |
| >3 | 1 | Red |
| 1–3 | 2 | Orange |
| 0.3–1 | 3 | Yellow |
| <0.3 | 4 | Blue |
DownLoad:
CSV

The 21st century Maritime Silk Road was proposed to develop mutually beneficial cooperation and promote common prosperity. The tsunami disaster should be understanded to ensure the economic and cultural exchanges on the Maritime Silk Road. The analysis result shows that tsunamis mainly occur in large faults, each of which has different tsunami occurrence regularity. The tsunami analysis of specific fault needs to be combined with the focal mechanism solution of earthquakes.
Tsunami waves can travel across the ocean, causing disastrous effects in areas far from the source. Therefore, the tsunami hazard in the entire waters should be considered. It is necessary to strengthen international cooperation and technical exchanges for the tsunami early warning service along the Maritime Silk Road. There is also a need to strengthen observation network construction and observation data sharing. Tsunami warning exercise should be held irregularly to improve the efficiency of tsunami warning agencies and government departments. In addition, tsunami awareness and education are also very important. In this paper, the numerical model was used to demonstrate the tsunami hazard levels of the Maritime Silk Road coast. However, the vulnerability of countries along the Maritime Silk Road is diverse from each other. Further tsunami disaster impact analysis is worth studying in the future.
This paper studied the spatiotemporal distribution and occurrence regularity of tsunami disaster on the Maritime Silk Road based on the historical earthquake and tsunami events. The tsunamis on the Maritime Silk Road mainly occurred in 8 major tectonic faults, and the annual tsunamis fluctuated over time. The tsunami occurrence regularity is studied from the aspects of magnitude, focal depth and water depth. It was found that the seismic magnitudes of the tsunami sources were between 6 and 8, and the water depths of the major tsunamis were between 1 000 to 4 000 m. Most earthquakes that triggered tsunamis were shallow earthquakes. The Bayes’ theorem analysis result showed the tsunami probability of different magnitudes.
Eight potential tsunami sources were hypothesized and simulated by numerical model. The calculation results were classified to show the tsunami hazard. The regions most heavily affected by the potential tsunamis include the Japan coast, the coast of the South China Sea, the western coast of the Java and the Mediterranean coast. The Japan Trench and Java Trench were the major tsunami sources on the Maritime Silk Road. In addition, the earthquakes of the Ryukyu Trench, Manila Trench and Helennick Trench should also be concerned.
| [1] |
Cai Xuejiao, Wu Zhifeng, Cheng Jiong. 2013. Using kernel density estimation to assess the spatial pattern of road density and its impact on landscape fragmentation. International Journal of Geographical Information Science, 27(2): 222–230. doi: 10.1080/13658816.2012.663918
|
| [2] |
Dao M H, Tkalich P, Chan E S, et al. 2009. Tsunami propagation scenarios in the South China Sea. Journal of Asian Earth Sciences, 36(1): 67–73. doi: 10.1016/j.jseaes.2008.09.009
|
| [3] |
Gorsevski P V, Gessler P E, Jankowski P. 2003. Integrating a fuzzy k-means classification and a Bayesian approach for spatial prediction of landslide hazard. Journal of Geographical Systems, 5(3): 223–251. doi: 10.1007/s10109-003-0113-0
|
| [4] |
Grilli S T, Ioualalen M, Asavanant J, et al. 2007. Source constraints and model simulation of the December 26, 2004, Indian Ocean tsunami. Journal of Waterway, Port, Coastal, and Ocean Engineering, 133(6): 414–428. doi: 10.1061/(ASCE)0733-950X(2007)133:6(414)
|
| [5] |
Guan K C. 2016. The maritime silk road: history of an idea. Pasir Panjang, Singapore: ISEAS
|
| [6] |
Hébert H, Schindelé F, Heinrich P. 2001. Tsunami risk assessment in the Marquesas Islands (French Polynesia) through numerical modeling of generic far-field events. Natural Hazards and Earth System Sciences, 1(4): 233–242. doi: 10.5194/nhess-1-233-2001
|
| [7] |
Hou Jingming, Li Xiaojuan, Yuan Ye, et al. 2016. Tsunami hazard assessment along the Chinese mainland coast from earthquakes in the Taiwan region. Natural Hazards, 81(2): 1269–1281. doi: 10.1007/s11069-015-2133-8
|
| [8] |
IOC. 2013. A Pacific-wide tsunami warning and enhanced products exercise. Paris: IOC
|
| [9] |
Liu Rui, Chen Yun, Wu Jianping, et al. 2017. Integrating entropy‐based naïve Bayes and GIS for spatial evaluation of flood hazard. Risk Analysis, 37(4): 756–773. doi: 10.1111/risa.12698
|
| [10] |
Liu Yingchun, Santos A, Wang S M, et al. 2007. Tsunami hazards along Chinese coast from potential earthquakes in South China Sea. Physics of the Earth and Planetary Interiors, 163(1–4): 233–244. doi: 10.1016/j.pepi.2007.02.012
|
| [11] |
Mao Xianzhong, Zhu Qian, Wei Yong. 2015. Risk analysis of potential regional earthquake tsunami on the coast of Zhejiang Province. Haiyang Xuebao (in Chinese), 37(3): 37–45
|
| [12] |
National Geophysical Data Center (NGDC). 2018. NOAA/WDS global historical tsunami database. Washington DC, USA. https://www.ngdc.noaa.gov/hazard/tsu_db.shtml [2018–06–07]
|
| [13] |
Peregrine D H. 1967. Long waves on a beach. Journal of Fluid Mechanics, 27(4): 815–827. doi: 10.1017/S0022112067002605
|
| [14] |
Ren Zhiyuan, Yuan Ye, Wang Peitao, et al. 2017. The September 16, 2015 M w 8.3 Illapel, Chile Earthquake: characteristics of tsunami wave from near-field to far-field. Acta Oceanologica Sinica, 36(5): 73–82. doi: 10.1007/s13131-017-1005-3
|
| [15] |
Shi Fengyan, Kirby J T, Harris J C, et al. 2012. A high-order adaptive time-stepping TVD solver for Boussinesq modeling of breaking waves and coastal inundation. Ocean Modelling, 43–44: 36–51. doi: 10.1016/j.ocemod.2011.12.004
|
| [16] |
United States Geological Survey (USGS). 2018. Search earthquake catalog. Washington DC, USA. https://earthquake.usgs.gov/earthquakes/search/ [2018-06-07]
|
| [17] |
Wang Gang, Hu Jian, Wang Peitao, et al. 2018. Analytical and numerical investigation of tsunami trapped waves over a hyperbolic-cosine squared ocean ridge. Haiyang Xuebao (in Chinese), 40(5): 15–23
|
| [18] |
Wang Benlong, Liu Hua. 2006. Solving a fully nonlinear highly dispersive Boussinesq model with mesh–less least square‐based finite difference method. International Journal for Numerical Methods in Fluids, 52(2): 213–235. doi: 10.1002/fld.1175
|
| [19] |
Wei Yong, Chamberlin C, Titov V V, et al. 2013. Modeling of the 2011 Japan tsunami: lessons for near-field forecast. Pure and Applied Geophysics, 170(6-8): 1309–1331. doi: 10.1007/s00024-012-0519-z
|
| [20] |
Wen Yanlin, Zhu Yuanqing, Song Zhiping, et al. 2008. Preliminary numerical simulation of potential earthquake-induced tsunami in East China Sea. Acta Seismologica Sinica, 21(5): 456–463. doi: 10.1007/s11589-008-0456-1
|
| [21] |
Zhao Xi, Liu Hua, Wang Benlong. 2013. Evolvement of tsunami waves on the continental shelves with gentle slope in the China Seas. Theoretical and Applied Mechanics Letters, 3(3): 032005. doi: 10.1063/2.1303205
|
| [22] |
Zhou Qinghai, Adams W M. 1988. Tsunami risk analysis for China. Natural Hazards, 1(2): 181–195. doi: 10.1007/BF00126614
|
| 1. | Raquel Felix, Judith Hubbard, Kaya Wilson, et al. Heatmap analysis of modeled coastal tsunamis using different bathymetry data resolutions. Geoscience Letters, 2024, 11(1) doi:10.1186/s40562-024-00362-6 | |
| 2. | Jingming Hou, Yi Gao, Tingting Fan, et al. Tsunami Risk Change Analysis for Qidong County of China Based on Land Use Classification. Journal of Marine Science and Engineering, 2023, 11(2): 379. doi:10.3390/jmse11020379 | |
| 3. | Fan Yang, Li Zhang, Bowei Chen, et al. Long-Term Change of Coastline Length along Selected Coastal Countries of Eurasia and African Continents. Remote Sensing, 2023, 15(9): 2344. doi:10.3390/rs15092344 | |
| 4. | Jingming Hou, Juncheng Wang, Peitao Wang, et al. How to identify tsunami prevention zones: a case study of Putuoshan Island in China. Natural Hazards, 2023, 116(1): 133. doi:10.1007/s11069-022-05667-3 | |
| 5. | Jingming Hou, Wei Lu, Tingting Fan, et al. Tsunami hazard and mitigation analysis for bathing beaches in China based on numerical simulations. Acta Oceanologica Sinica, 2022, 41(12): 27. doi:10.1007/s13131-022-2027-z | |
| 6. | Xixi Du, Yi Qin, Chunbo Huang. Status and Prospect of Ecological Environment in the Belt and Road Initiative Regions. International Journal of Environmental Research and Public Health, 2022, 19(24): 17091. doi:10.3390/ijerph192417091 | |
| 7. | Zhiyuan Ren, Yi Gao, Xinran Ji, et al. Deterministic tsunami hazard assessment and zoning approach using far-field and near-field sources: Study of Cixi County of Zhejiang Province, China. Ocean Engineering, 2022, 247: 110487. doi:10.1016/j.oceaneng.2021.110487 | |
| 8. | Rui-dong An, Da-peng Jiang, Ching-hao Yu, et al. Numerical Simulation of Tsunami-Like Wave Impacting on Breakwater by CLSVOF/IB Method. China Ocean Engineering, 2021, 35(5): 676. doi:10.1007/s13344-021-0059-3 | |
| 9. | Jingming Hou, Yi Gao, Juncheng Wang, et al. Analysis of major tsunami prevention areas in Zhujiajian Island of China. 2021 28th International Conference on Geoinformatics, doi:10.1109/IEEECONF54055.2021.9687510 |

Figures(13) / Tables(5)

Supported by:
Beijing Renhe Information Technology Co. Ltd

Jingming Hou, Xiaojuan Li, Peitao Wang, Juncheng Wang, Zhiyuan Ren. Hazard analysis of tsunami disaster on the Maritime Silk Road[J]. Acta Oceanologica Sinica, 2020, 39(1): 74-82. doi: 10.1007/s13131-019-1526-z

| Year | Focal depth/km | Magnitude | Country | Latitude | Longitude | Tsunami run-up/m | Water depth/m |
| 1933 | 35 | 8.4 | Japan | 39.224°N | 144.622°E | 29.0 | –4 124 |
| 1977 | 33 | 8.0 | Indonesia | 11.085°S | 118.464°E | 15.0 | –3 978 |
| 2006 | 34 | 7.7 | Indonesia | 9.254°S | 107.411°E | 20.9 | –3 522 |
| 1994 | 18 | 7.8 | Indonesia | 10.477°S | 112.835°E | 13.9 | –3 440 |
| 2006 | 10 | 8.3 | Japan | 46.592°N | 153.266°E | 21.9 | –3 310 |
| 1993 | 17 | 7.7 | Japan | 42.851°N | 139.197°E | 32.0 | –2 881 |
| 1983 | 24 | 7.8 | Japan | 40.462°N | 139.102°E | 14.9 | –2 632 |
| 2010 | 20 | 7.8 | Indonesia | 3.487°S | 100.082°E | 16.9 | –2 373 |
| 1992 | 28 | 7.8 | Indonesia | 8.48°S | 121.896°E | 26.2 | –2 285 |
| 1956 | 20 | 7.8 | Greece | 36.90°N | 26.000°E | 30.0 | –1 471 |
| 2004 | 30 | 9.1 | Indonesia | 3.316°N | 95.854°E | 50.9 | –1 062 |
| 2011 | 30 | 9.1 | Japan | 38.297°N | 142.372°S | 38.9 | –1 002 |
DownLoad:
CSV
| Trenches | M(5.0–5.9) /% | M(6.0–6.9) /% | M(7.0–7.9) /% | M(8.0–8.9) /% | M>9.0 /% |
| Japan Trench | 0.2 | 14.8 | 100.0 | 100.0 | 100.0 |
| Java Trench | 0.1 | 3.9 | 34.8 | 100.0 | 100.0 |
| Nankai Trough | 0.2 | 7.1 | 40.1 | 100.0 | – |
| Ryukyu Trench | 0.1 | 4.1 | 39.5 | 100.0 | – |
| Philippine Trench | 0.2 | 3.3 | 37.8 | 100.0 | – |
| Manila Trench | 0.6 | 11.9 | 41.7 | – | – |
| Hellenick Trench | 0.9 | 13.6 | 43.3 | – | – |
| Mariana Trench | – | 5.6 | 14.3 | – | – |
DownLoad:
CSV
| Trenches | Strike/(°) | Dip/(°) | Slip/(°) | Percentage/% |
| Japan Trench | 205 | 21 | 88 | 83.3 |
| Java Trench | 307 | 22 | 101 | 62.5 |
| Nankai Trough | 251 | 26 | 79 | 66.8 |
| Ryukyu Trench | 41 | 28 | –67 | 41.4 |
| Philippine Trench | 160 | 31 | 72 | 76.2 |
| Manila Trench | 162 | 33 | –146 | 46.2 |
| Hellenick Trench | 265 | 35 | –50 | 57.1 |
| Mariana Trench | 201 | 34 | –96 | 43.5 |
DownLoad:
CSV
| Trenches | Locations | Magnitude (Mw) |
| Japan Trench | 38.103ºN, 142.86ºE | 9.0 |
| Nankai Trough | 31.833ºN, 133.50ºE | 9.0 |
| Ryukyu Trench | 25.68ºN, 128.81ºE | 9.0 |
| Mariana Trench | 12.50ºN, 142.50ºE | 9.0 |
| Philippine Trench | 13.70ºN, 125.33ºE | 9.0 |
| Manila Trench | 14.47ºN, 119.17ºE | 9.0 |
| Java Trench | 3.32ºN, 95.85ºE | 9.0 |
| Helennick Trench | 35.50ºN, 26.00ºE | 9.0 |
DownLoad:
CSV
| Tsunami amplitude/m | Hazard level | Color |
| >3 | 1 | Red |
| 1–3 | 2 | Orange |
| 0.3–1 | 3 | Yellow |
| <0.3 | 4 | Blue |
DownLoad:
CSV
| Year | Focal depth/km | Magnitude | Country | Latitude | Longitude | Tsunami run-up/m | Water depth/m |
| 1933 | 35 | 8.4 | Japan | 39.224°N | 144.622°E | 29.0 | –4 124 |
| 1977 | 33 | 8.0 | Indonesia | 11.085°S | 118.464°E | 15.0 | –3 978 |
| 2006 | 34 | 7.7 | Indonesia | 9.254°S | 107.411°E | 20.9 | –3 522 |
| 1994 | 18 | 7.8 | Indonesia | 10.477°S | 112.835°E | 13.9 | –3 440 |
| 2006 | 10 | 8.3 | Japan | 46.592°N | 153.266°E | 21.9 | –3 310 |
| 1993 | 17 | 7.7 | Japan | 42.851°N | 139.197°E | 32.0 | –2 881 |
| 1983 | 24 | 7.8 | Japan | 40.462°N | 139.102°E | 14.9 | –2 632 |
| 2010 | 20 | 7.8 | Indonesia | 3.487°S | 100.082°E | 16.9 | –2 373 |
| 1992 | 28 | 7.8 | Indonesia | 8.48°S | 121.896°E | 26.2 | –2 285 |
| 1956 | 20 | 7.8 | Greece | 36.90°N | 26.000°E | 30.0 | –1 471 |
| 2004 | 30 | 9.1 | Indonesia | 3.316°N | 95.854°E | 50.9 | –1 062 |
| 2011 | 30 | 9.1 | Japan | 38.297°N | 142.372°S | 38.9 | –1 002 |
| Trenches | M(5.0–5.9) /% | M(6.0–6.9) /% | M(7.0–7.9) /% | M(8.0–8.9) /% | M>9.0 /% |
| Japan Trench | 0.2 | 14.8 | 100.0 | 100.0 | 100.0 |
| Java Trench | 0.1 | 3.9 | 34.8 | 100.0 | 100.0 |
| Nankai Trough | 0.2 | 7.1 | 40.1 | 100.0 | – |
| Ryukyu Trench | 0.1 | 4.1 | 39.5 | 100.0 | – |
| Philippine Trench | 0.2 | 3.3 | 37.8 | 100.0 | – |
| Manila Trench | 0.6 | 11.9 | 41.7 | – | – |
| Hellenick Trench | 0.9 | 13.6 | 43.3 | – | – |
| Mariana Trench | – | 5.6 | 14.3 | – | – |
| Trenches | Strike/(°) | Dip/(°) | Slip/(°) | Percentage/% |
| Japan Trench | 205 | 21 | 88 | 83.3 |
| Java Trench | 307 | 22 | 101 | 62.5 |
| Nankai Trough | 251 | 26 | 79 | 66.8 |
| Ryukyu Trench | 41 | 28 | –67 | 41.4 |
| Philippine Trench | 160 | 31 | 72 | 76.2 |
| Manila Trench | 162 | 33 | –146 | 46.2 |
| Hellenick Trench | 265 | 35 | –50 | 57.1 |
| Mariana Trench | 201 | 34 | –96 | 43.5 |
| Trenches | Locations | Magnitude (Mw) |
| Japan Trench | 38.103ºN, 142.86ºE | 9.0 |
| Nankai Trough | 31.833ºN, 133.50ºE | 9.0 |
| Ryukyu Trench | 25.68ºN, 128.81ºE | 9.0 |
| Mariana Trench | 12.50ºN, 142.50ºE | 9.0 |
| Philippine Trench | 13.70ºN, 125.33ºE | 9.0 |
| Manila Trench | 14.47ºN, 119.17ºE | 9.0 |
| Java Trench | 3.32ºN, 95.85ºE | 9.0 |
| Helennick Trench | 35.50ºN, 26.00ºE | 9.0 |
| Tsunami amplitude/m | Hazard level | Color |
| >3 | 1 | Red |
| 1–3 | 2 | Orange |
| 0.3–1 | 3 | Yellow |
| <0.3 | 4 | Blue |
 DownLoad:


 DownLoad: