Figure
1.
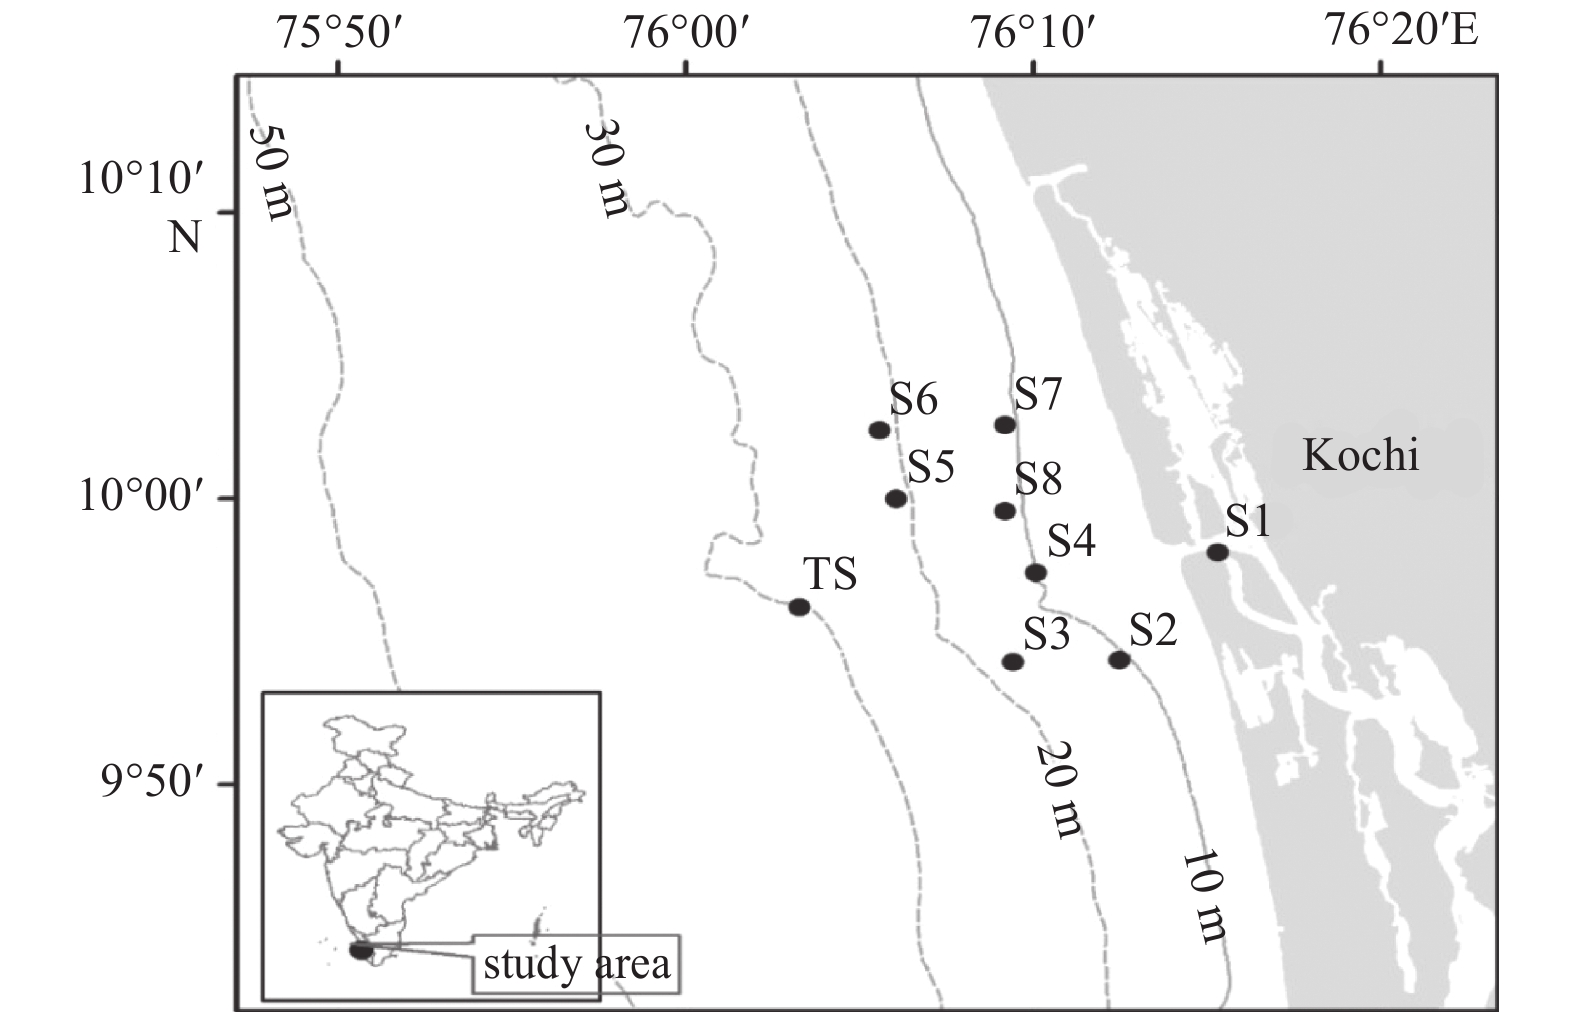
Map showing the sampling stations in the South Eastern Arabian Sea.
| Citation: | P Minu, V P Souda, S K Baliarsingh, R M Dwivedi, Y Ali, P M Ashraf. Assessing temporal variation of coloured dissolved organic matter in the coastal waters of South Eastern Arabian Sea[J]. Acta Oceanologica Sinica, 2020, 39(1): 102-109. doi: 10.1007/s13131-020-1534-z

|
Coloured dissolved organic matter (CDOM) is considered as an important bio-optical constituent in the aquatic environment. It has a positive impact on secondary productivity by protecting the marine organisms from UV radiation and acts as a substitute for microbial respiration. CDOM is an important component in marine photo-degradation processes and a primary determinant of the optical properties in ocean. CDOM competes with phytoplankton for the available solar radiation and thus high amount of CDOM in waters has a negative impact on primary producers in that area (Nelson and Siegel, 2002; Siegel et al., 2002; Blough and Del Vecchio, 2002; Del Vecchio and Blough, 2006).
The high spatial and temporal variability of CDOM in coastal waters limits remote-sensing algorithms for CDOM to local areas. Several bio-optical algorithms have been developed to retrieve CDOM absorption or closely related products from ocean colour satellite observations. These algorithms help to estimate the absorption coefficient of CDOM and detrital (non-pigmented) matters as single parameter (Adg), since CDOM and detritus have similar spectral response in the visible spectrum (Carder et al., 1999; Doerffer and Schiller, 2007; Bricaud et al., 2012; Hoge et al., 2001; Lee et al., 2010, 2002; Maritorena et al., 2002; Siegel et al., 2005; Tilstone et al., 2012; Werdell et al., 2013). Inversion algorithms provide better results for Adg retrieval in the open ocean and failed in coastal waters due to high levels of CDOM, detrital particles, and phytoplankton (Siegel et al., 2002; Aurin and Dierssen, 2012).
Remote sensing algorithms for estimating CDOM in coastal waters by linking the CDOM absorption with apparent optical properties have been initiated by Kowalczuk et al. (2003). The spatial and temporal variability of CDOM in the California Current has been studied by applying SeaWiFS imagery (Kahru and Mitchell, 1999; 2001). A quantitative understanding of autochthonous production or removal of CDOM allows us to better identify occasions where (Kowalczuk et al., 2003) suitable algorithms can be used for its retrieval from space. Regionally tuned Tassan or Carder’s Ag440 algorithm retrieved Ag440 with uncertainties as high as 35% when applied in the Yellow Sea and the East China Sea (Siswanto et al., 2011). Tehrani et al. (2013) established seasonal band ratio empirical algorithms to analyse dissolved organic carbon (DOC) using the relationships between CDOM-Remote Sensing reflectance (Rrs) and seasonal CDOM-DOC for SeaWiFS, MODIS and MERIS. Results revealed accurate estimation of DOC during summer time and underestimation during spring-winter time by both MODIS and MERIS. A study performed with Rrs’s of HICO at estuaries of the river Indus and GBM of North Indian Ocean suggested the need for ocean colour sensors with central wavelength 426, 484, 490, 581 and 610 nm to estimate the concentrations of Chl a, Suspended Sediments and CDOM in case-II waters (Srinivasa et al., 2016). Only a few algorithms were used for validation involving a direct comparison of in situ with coincident satellite data. The major limitation to rigorous validation is the dearth of sufficient information of co-incident in situ field and satellite observations that are independent of the data used to develop the algorithm. Hence, a study was carried out in the coastal waters off Kochi, South Eastern Arabian Sea, for evaluating the performance of satellite-based measurements of absorption by CDOM and detritus using field-based measurements. This study also focuses on determining whether the satellite imagery is a reliable data source and the most accurate products available for on-going monitoring and various research applications in the region.
The study area forms part of south eastern Arabian Sea (SEAS) (Minu et al., 2014). The region experiences a tropical monsoonal climate and exhibits seasonal changes in hydrographic conditions, influenced by river discharge and surface circulation. Wind-induced upwelling along with a northward undercurrent and a southward surface flow associated with strong vertical mixing occurs in coastal waters off Kochi (Kumar and Kumar, 1996). Southerly current supports the upwelling process along the coastal waters during the monsoon season (Joshi and Rao, 2012). Subsequent to monsoon season, the change in hydrographic parameters causes very strong freshwater discharge from backwaters (Srinivas and DineshKumar, 2006). During the transition period of monsoon to the post-monsoon season, the freshwater containing high levels of nutrients are transported through the Cochin inlet or Barmouth, thus makes a significant contribution to the nutrient budget of the coastal waters (Balachandran et al., 2008). At certain locations, during the southwest monsoon period, seasonal phytoplankton blooms were also observed (Srinivas and DineshKumar, 2006). Usha et al. (2014) had pointed out that the increase of influx of nutrients contributes to the domination of a single species of phytoplankton and results in the high pelagic fishery.
Seawater samples were collected from nine discrete stations from coastal waters off Kochi during April 2010 to December 2014 (Fig. 1). A commercial purse seiner was used as the sampling platform. Samples were collected using Niskin water sampler and stored under low temperature until analysis in the laboratory. ACDOM was measured spectrophotometrically following methodologies prescribed by Kowalczuk and Kaczmarek (1996). Seawater samples were filtered through 0.2 μm nitrocellulose membrane filters and the filtered seawater was stored in amber coloured borosilicate glass bottles. The sample absorption was measured using a double beam UV-Visible spectrophotometer (make: ShimadzuTM, model: UV-2450) over the spectral range of 400 to 700 nm at 1 nm resolution. ACDOM was calculated from the optical density of the sample following the methods are given in Twardowski et al. (2004).
The algorithm used for retrieval of CDOM from MODIS Aqua sensor (MODISA) was used for validation. MODISA Level-2 (L2) data over the study areas were acquired from NASA’s Ocean Colour Web (https://oceancolor.gsfc.nasa.gov). L2- IOP files were downloaded and data were processed using SeaDAS software. MODIS-A uses six Rrs bands (412, 443, 488, 531, 547 and 667 nm) for CDOM retrieval, with a spatial resolution of 1.1 km and the data were acquired on the same dates of the field measurements from 2010 to 2014 (temporal window between satellite overpass and the time of field sampling = ±12 h). The algorithm developed by Carder et al. (1999) used in MODIS retrieves the absorption coefficients of the sum (Adg, m−1) of CDOM (Ag, m−1) and detritus (Ad, m−1), collectively named as CDM. This algorithm does not separate Adg into Ag and Ad analytically. Hence, the combined effect of Adg was used for the present study.
The functional form of the algorithm used to retrieve Adg443 in MODIS is an empirical power function based on the ratio of Rrs.
| $$ {{{A}}_{{\rm{dg}}}}443 = {10^{(0.043\left| {0.185_{a_0}} \right|1.081_{a_1} + 1.234_{a_2})}} ,$$ |
where
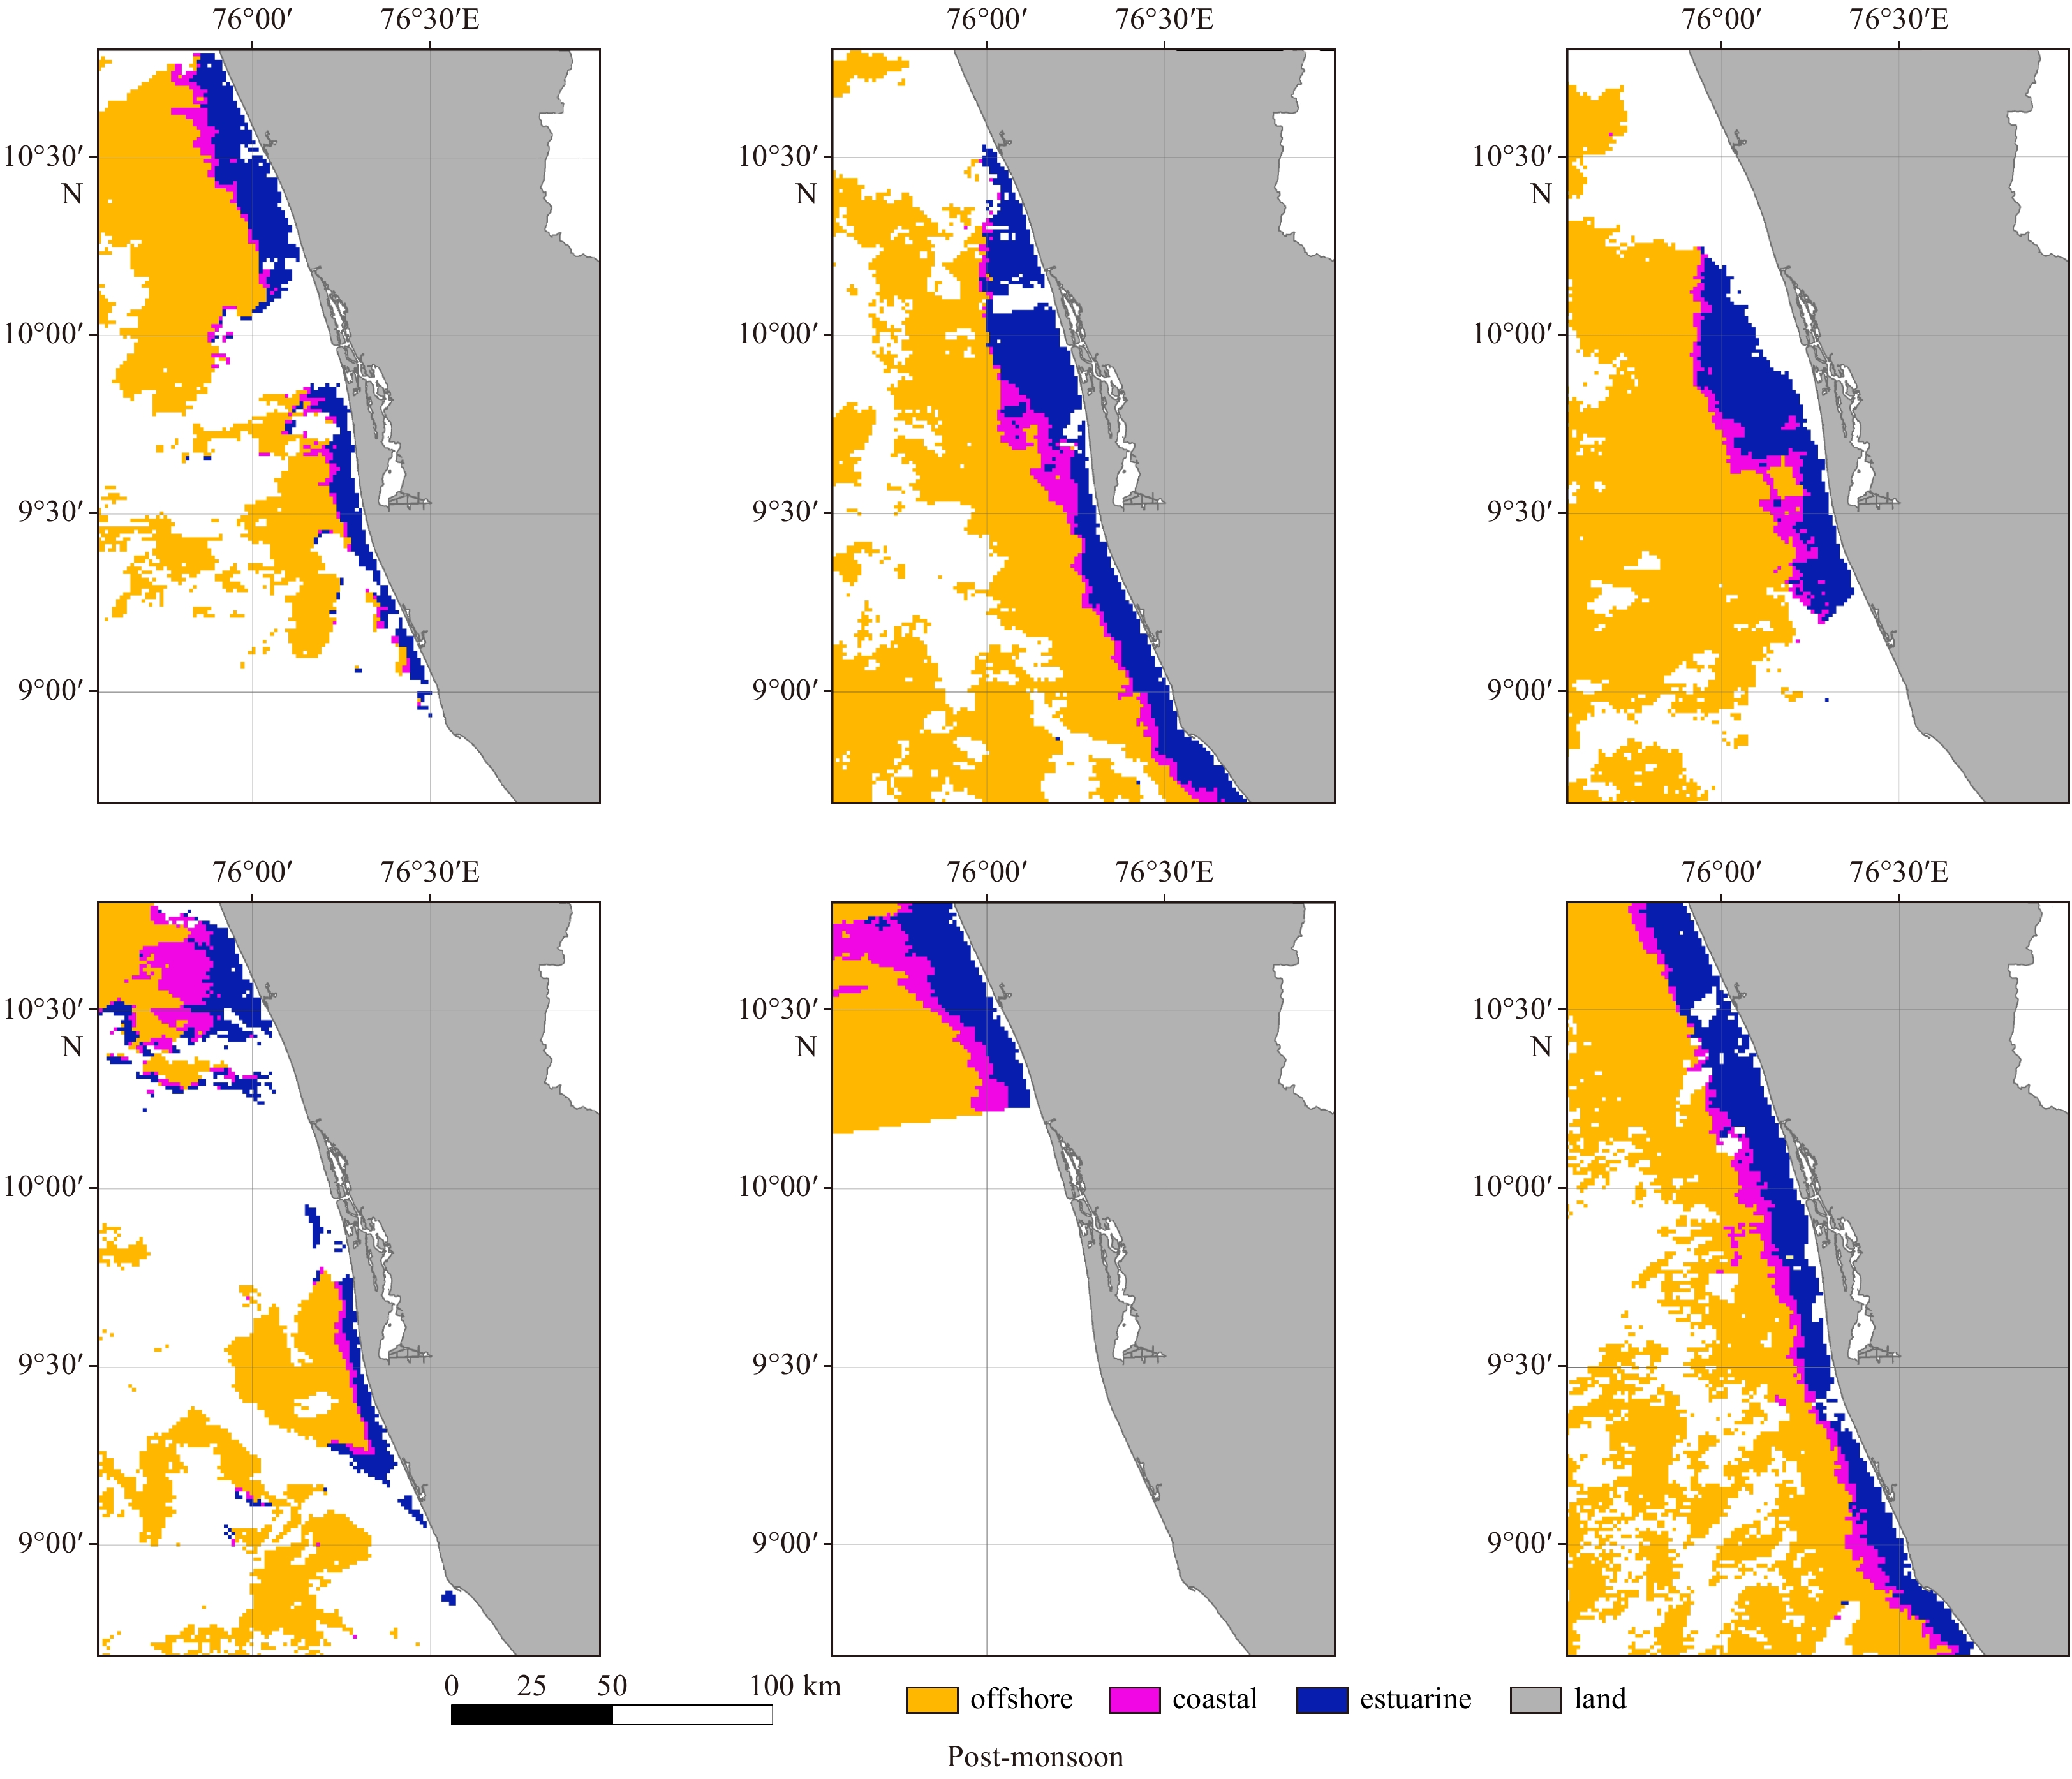
The data from MODISA was used for the present study. Three stations were identified including one each from the estuarine, coastal and offshore waters. The products of Chl a and Adg443 were generated using band math function of ERDAS software. The product exhibited three different ranges of values for the estuarine, coastal and offshore waters. These values have been superimposed on the images after band math calculation.
The products of Chl a and Adg443 aided in identifying the sources of CDOM in the study area (Figs 2–4). The seasonal variability was clearly marked from the analysis. The product exhibited three distinct ranges viz. 0.001–0.1, 0.1–2.0 and 2.0–14.35 for offshore, coastal and estuarine waters, respectively. Taking these values as a proxy, we identified the distribution of these waters coastal region. During monsoon season, estuarine waters (blue colour) were observed to spread in the coastal region (Fig. 2). During the post-monsoon season, spreading of estuarine waters diminished and offshore waters gained the place (Fig. 3). The intermittent appearance of coastal waters was also visible. Pre-monsoon season exhibited a clear dominance of CDOM in the study area (Fig. 4).


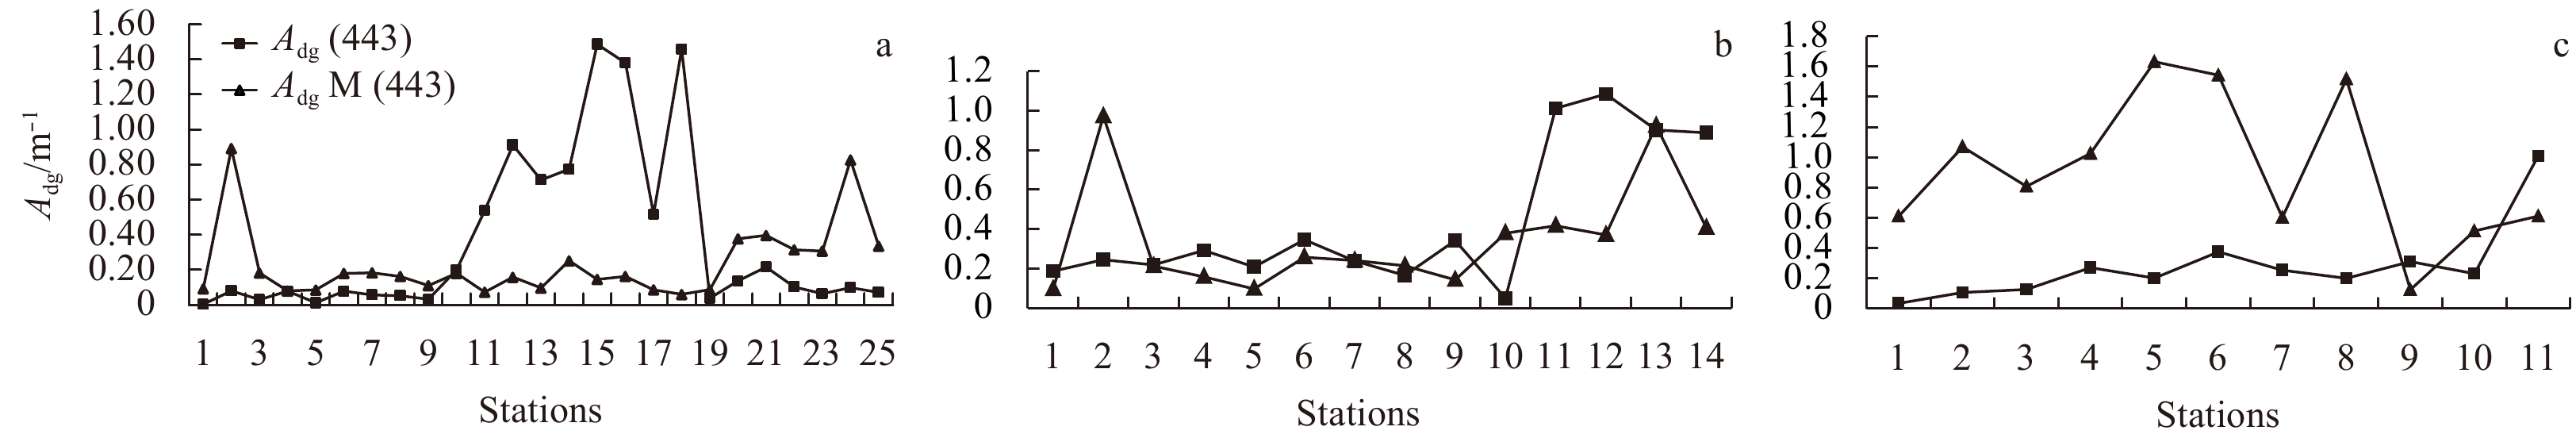
Matchup analysis between in situ (Adg443) and from MODISA (Adg443M) was carried out (Figs 5 and 6). Adg443 giop, the absorption coefficient of non-algal material plus CDOM (Adg) at 443 nm was used. The GIOP model uses a single, fixed Adg(λ) taken from the GSM model (Carder et al., 1999). The raw data exhibited a few matchups between in situ and satellite data. The in situ data ranged from 0.003 to1.64 m–1 while satellite data was between 0.034 4 and 1.084 7 m–1. The plot reveals that satellite estimates for stations 11–19 are relatively lower and 20–25 are relatively higher as compared to the corresponding field measurements. For the remaining stations, the algorithm matched with in situ data CDOM. A significant increase in the magnitude of measured CDOM was observed in Stations 11–19. However, the algorithm is not sensitive to react to this abrupt increase though it does show an increasing trend. A few matchups were observed when the in situ data falls between 0.15 and 0.3 m–1. Another attempt was to infer the influence of impact of the freshwater influx on ACDOM variation. For this, the data was split correspondingly to different seasons. ACDOM443 and corresponding satellite data were not available for the study period during peak monsoon season (June–July). Another drawback is the heavy cloud coverage, persisted in the area during these southwest monsoon season, which failed to generate the CDOM imageries. The analysis exhibited a negative correlation between the two with an R-value of 0.5. Hence, data corresponding to the pre-monsoon season and post-monsoon season were taken for the analysis. The Adg443 was much lower than that retrieved using MODISA in the post-monsoon season. The scenario changed entirely during the pre-monsoon season, showing an increase in the Adg443. The Adg443M overestimated Adg443 during post-monsoon and it underestimated the same during pre-monsoon. The split data corresponding to pre-monsoon and post-monsoon seasons exhibited a negative correlation with an R-value 0.5 and 0.3, respectively (Fig. 6).


Higher values of correlation after splitting the data season-wise indicated that season and region-specific bias correction can be applied to the MODISA estimated Adg443 to get the estimates close to realistic values. The functional form of the matchup analysis performed for two seasons also exhibited variations in the coefficients. The results of this approach directed the tuning of the Chl a and CDOM ratio-based algorithm. This finely tuned algorithm can be used for retrieving absorption by in situ data discounting the effect of allochthonous CDOM origin.
For the pre-monsoon season, the tuned functional form isas follows
log10 (in situ CDOM) =1.20–0.232 log10 (Chl/CDOM).
For the post-monsoonseason, the new functional form is as follows
log (in situ CDOM)=1.32–0.201 log10 (Chl/CDOM)
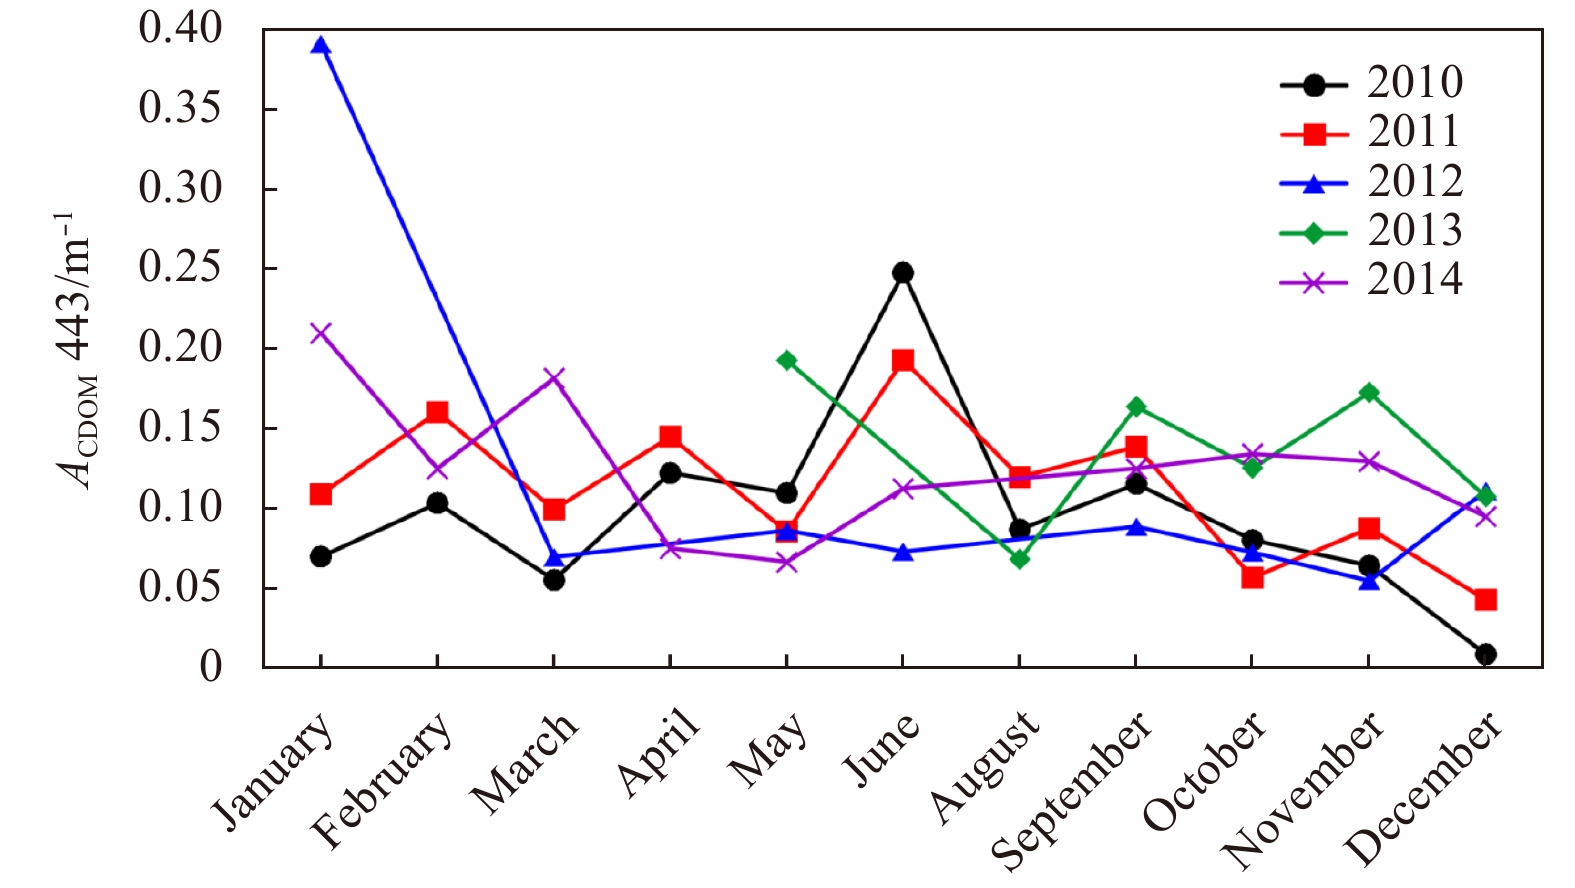
Monthly variation of in situ measured ACDOM at 443 nm, spanning 5 years from 2010–2015 was studied (Fig. 7). Trends were similar for the period 2010–2014. The abnormality was observed in the trend during February 2014. During 2010 and 2011, ACDOM443 was marginally higher during February when compared with January and March. In February 2014, the absorption was lower which increased in the preceding month. The trend followed a zig-zag pattern with maximum absorption during June in 2010 and 2011. During 2014, a higher magnitude of CDOM absorption was recorded in January. During monsoon, the absorption was almost identical. But high variability was observed during the post-monsoon season (October–January).

Further, reason for high CDOM persisted in the area during February was analysed on behalf of phytoplankton physiology. As evidenced from Fig. 2, during pre-monsoon season, the offshore waters dominate in the area and CDOM production is mainly by authocthonous process. The phytoplankton class responsible for this autochthonous production was identified according to Dwivedi et al. (2015) and Priyaja et al. (2016). Accordingly, phytoplankton class/species was identified using Rrs data retrieved from MODISA. From the results, Noctiluca scintillans bloom was identified as the contributor of high CDOM during this period. As, CDOM was the product of degraded phytoplankton, the level of degradation was identified by calculating the phytoplankton physiology product using software ERDAS IMAGINE. Phytoplankton physiology product defines well the state of degradation of bloom, thereby the CDOM production. Further, it was found that the CDOM was in a moderately degrading state.
The origin of CDOM in marine waters is mainly by the decomposition of biological activity and by terrestrial input such as river discharge. Hence, CDOM absorption may be related to phytoplankton biomass or salinity. However, Adg443 in the Cochin coastal waters did not correlate with chlorophyll (Minu et al., 2014). During January and February (late post-monsoon and early pre-monsoon), phytoplankton blooms occur along with pre-showers of south west monsoon. The high phytoplankton density results in increased decomposition of organic matter during the senescence phase of blooms. This results in high CDOM production.
The high ACDOM443 found during January and February also coincides with the phytoplankton blooms. In order to substantiate the recurrence of phytoplankton bloom during early pre-monsoon months, a satellite-based case study, on 14 February 2012, revealed high phytoplankton biomass (i.e. Chl a) in coastal waters off Kochi (Fig. 8a). In addition, using the remote sensing approach developed by Dwivedi et al. (2015) and further cross validated by Baliarsingh et al. (2017), the MODIS-A retrieved phytoplankton class/species product discerned prevalence of bloom-forming green Noctiluca scintillans in the coastal waters (Fig. 8b). The authors relied on the satellite data processing and model outputs because many recent publications supported the model output, which correlated phytoplankton physiology product with in-situ data of Noctiluca scintillans bloom (Baliarsingh et al., 2018; Dwivedi et al., 2015). Further, the phytoplankton assemblage was observed to be in degrading stage as revealed by the MODISA retrieved phytoplankton physiology product (Figs 8 c, d).

MODISA data was biased when the annual data were taken for correlation. Since the CDOM absorption showed monthly variations, the data when taken as a whole exhibited bias. This bias was reduced when the data were split into two seasons and when the ratio of chlorophyll and CDOM were taken. It is expected that during monsoon and post-monsoon season, the CDOM absorption should exceed chlorophyll. However, the coastal waters off Kochi are considered as eutrophic environment promoting phytoplankton production far more than organic matter production (Bhavya et al., 2016, Thomas et al., 2013). Figure 5 represents match up analysis between in-situ and MODIS-A Adg 443 data during post-monsoon and pre-monsoon seasons. Even though there are reports on which Carder et al. (1999) Adg algorithm failed to perform better in waters where chlorophyll a concentration is greater than 1.5 mg/m3 and Aph675 greater than 0.025 m–1 (Carder et al., 1999), in coastal waters off Kochi, the algorithm is closely associated with the in situ data during post-monsoon. Monsoon and post-monsoon season are the peak time for rise in chlorophyll concentration in this region in particular (Chakraborty et al., 2016; Minu et al., 2014; 2017). Moreover, Chl a concentration is comparatively lower during pre-monsoon season. Hence, the work was carried forward because, the Carder et al. (1999) Adg algorithm, which is presently operational on MODIS-A, performed better in case of the coastal waters off Kochi.
The main source of CDOM was terrestrial matter during monsoon and contributed by in situ production during pre-monsoon whereas of both autochthonous and allochthonous origin during post-monsoon. The product of chlorophyll and Adg443 from MODISA exhibited three ranges each for estuarine waters, coastal waters and offshore waters. CDOM source during monsoon could be of terrestrial origin which reached the coast through estuarine influx. Hence, the waters are dominated by estuarine range (Fig. 2). During post-monsoon, a mixture of terrestrial and organic decomposition contributed to the CDOM in the study area. In contrast, the source of CDOM was only from organic decomposition during pre-monsoon.
Coastal waters are important transition zones between marine and estuarine environments and receive high amounts of sediments, dissolved organic matter, and nutrients making them optically complex and challenging for ocean colour remote sensing applications. A good number of algorithms have been proposed and ACDOM (λ) retrieval was validated for the coastal waters. The present work deciphers the main sources of CDOM in different seasons in the coastal waters of SEAS. Significant error was encountered in the algorithm's performance when the seasonal component was not taken for consideration. The finely tuned algorithms presented in this study can be applied to other coastal regions. It can also be used to extract CDOM data using region-specific chlorophyll to ACDOM relationships.
We are thankful to the Directors, Central Institute of Fisheries Technology (CIFT) and Indian National Centre for Ocean Information Services (INCOIS) for their support and encouragement to complete the work. The study was financially supported by INCOIS under SATellite Coastal Oceanographic REsearch (SATCORE) programme. We are also grateful to management and staffs of MV Bharath Darshan, for their unrestricted support during the cruises.
| [1] |
Aurin D A, Dierssen H M. 2012. Advantages and limitations of ocean color remote sensing in CDOM-dominated, mineral-rich coastal and estuarine waters. Remote Sensing of Environment, 125: 181–197. doi: 10.1016/j.rse.2012.07.001
|
| [2] |
Balachandran K K, Reddy G S, Revichandran C, et al. 2008. Modelling of tidal hydrodynamics for a tropical ecosystem with implications for pollutant dispersion (Cohin Estuary, Southwest India). Ocean Dynamics, 58(3–4): 259–273. doi: 10.1007/s10236-008-0153-6
|
| [3] |
Baliarsingh S K, Dwivedi R, Lotliker A A, et al. 2018. An ephemeral dinoflagellate bloom during summer season in nearshore water of Puri, east coast of India. Ocean Science Journal, 53(1): 143–147. doi: 10.1007/s12601-017-0059-7
|
| [4] |
Bhavya P S, Kumar S, Gupta G V M, et al. 2016. Nitrogen uptake dynamics in a tropical eutrophic estuary (Cochin, India) and adjacent coastal waters. Estuaries and Coasts, 39(1): 54–67. doi: 10.1007/s12237-015-9982-y
|
| [5] |
Blough N V, Del Vecchio R. 2002. Chromophoric DOM in the coastal environment. In: Hansell D A, Carlson C A, eds. Biogeochemistry of Marine Dissolved Organic Matter. Amsterdam: Academic Press, 509–546
|
| [6] |
Bricaud A, Ciotti A M, Gentili B. 2012. Spatial-temporal variations in phytoplankton size and colored detrital matter absorption at global and regional scales, as derived from twelve years of SeaWiFS data (1998−2009). Global Biogeochemical Cycles, 26(1): GB1010. doi: 10.1029/2010GB003952
|
| [7] |
Carder K L, Chen F R, Lee Z P, et al. 1999. Semi analytic moderate-resolution imaging spectrometer algorithms for chlorophyll a and absorption with bio-optical domains based on nitrate-depletion temperatures. Journal of Geophysical Research: Oceans, 104(C3): 5403–5421. doi: 10.1029/1998JC900082
|
| [8] |
Chakraborty K, Gupta A, Lotliker A A, et al. 2016. Evaluation of model simulated and MODIS-aqua retrieved sea surface chlorophyll in the eastern Arabian Sea. Estuarine Coastal and Shelf Science, 181: 61–69. doi: 10.1016/j.ecss.2016.08.002
|
| [9] |
Del Vecchio R, Blough N V. 2006. Influence of ultraviolet radiation on the chromophoric dissolved organic matter in natural waters. In: Ghetti F, Checcucci G, Bornman J F, eds. Environmental UV Radiation: Impact on Ecosystems and Human Health and Predictive Models. Dordrecht: Springer, 203–216
|
| [10] |
Doerffer R, Schiller H. 2007. The MERIS Case 2 water algorithm. International Journal of Remote Sensing, 28(3–4): 517–535. doi: 10.1080/01431160600821127
|
| [11] |
Dwivedi R, Rafeeq M, Smitha B R, et al. 2015. Species identification of mixed algal bloom in the northern Arabian Sea using remote sensing techniques. Environmental Monitoring and Assessment, 187(2): 51. doi: 10.1007/s10661-015-4291-2
|
| [12] |
Hoge F E, Wright C W, Lyon P E, et al. 2001. Inherent optical properties imagery of the western North Atlantic Ocean: Horizontal spatial variability of the upper mixed layer. Journal of Geophysical Research: Oceans, 106(C12): 31129–31140. doi: 10.1029/1999JC000132
|
| [13] |
Joshi M, Rao A D. 2012. Response of southwest monsoon winds on shelf circulation off Kerala Coast, India. Continental Shelf Research, 32: 62–70. doi: 10.1016/j.csr.2011.10.015
|
| [14] |
Kahru M, Mitchell B G. 1999. Empirical chlorophyll algorithm and preliminary SeaWiFS validation for the California Current. International Journal of Remote Sensing, 20(17): 3423–3429. doi: 10.1080/014311699211453
|
| [15] |
Kahru M, Mitchell B G. 2001. –Seasonal and nonseasonal variability of satellite–derived chlorophyll and colored dissolved organic matter concentration in the California Current. Journal of Geophysical Research: Oceans, 106(C2): 2517–2529. doi: 10.1029/1999JC000094
|
| [16] |
Kowalczuk P, Cooper W J, Whitehead R F, et al. 2003. Characterization of CDOM in an organic-rich river and surrounding coastal ocean in the South Atlantic Bight. Aquatic Sciences, 65(4): 384–401. doi: 10.1007/s00027-003-0678-1
|
| [17] |
Kowalczuk P, Kaczmarek S. 1996. Analysis of temporal and spatial variability of “yellow substance”absorption in the southern Baltic. Oceanologia, 38(1): 3–32
|
| [18] |
Kumar P V H, Kumar N M. 1996. On the flow and thermohaline structure off Cochin during pre-monsoon season. Continental Shelf Research, 16(4): 457–468. doi: 10.1016/0278-4343(95)00017-8
|
| [19] |
Lee Z, Ahn Y H, Mobley C, et al. 2010. Removal of surface-reflected light for the measurement of remote-sensing reflectance from an above-surface platform. Optics Express, 18(25): 26313–26324. doi: 10.1364/OE.18.026313
|
| [20] |
Lee Z, Carder K L, Arnone R A. 2002. Deriving inherent optical properties from water color: a multiband quasi-analytical algorithm for optically deep waters. Applied Optics, 41(27): 5755–5772. doi: 10.1364/AO.41.005755
|
| [21] |
Maritorena S, Siegel D A, Peterson A R. 2002. Optimization of a semianalytical ocean color model for global-scale applications. Applied Optics, 41(15): 2705–2714. doi: 10.1364/AO.41.002705
|
| [22] |
Minu P, Souda V P, Ashraf P M. 2017. Temporal variability of size-fractionated chlorophyll a concentration and influence of chemical parameters in coastal waters of South-eastern Arabian Sea. Fishery Technology, 54: 14–24
|
| [23] |
Minu P, Lotliker A A, Shaju S S, et al. 2014. Effect of optically active substances and atmospheric correction schemes on remote-sensing reflectance at a coastal site off Kochi. International Journal of Remote Sensing, 35(14): 5434–5447. doi: 10.1080/01431161.2014.926420
|
| [24] |
Nelson N B, Siegel D A. 2002. Chromophoric DOM in the open ocean. In: Hansell D A, Carlson C A, eds.Biogeochemistry of Marine Dissolved Organic Matter. Amsterdam: Academic Press, 547–554, cp1–cp2, 555–578
|
| [25] |
Priyaja P, Dwivedi R, Sini S, et al. 2016. Remote sensing of bacterial response to degrading phytoplankton in the Arabian Sea. Environmental Monitoring and Assessment, 188(12): 662. doi: 10.1007/s10661-016-5666-8
|
| [26] |
Siegel D A, Maritorena S, Nelson N B, et al. 2002. Global distribution and dynamics of colored dissolved and detrital organic materials. Journal of Geophysical Research: Oceans, 107(C12): 3228. doi: 10.1029/2001JC000965
|
| [27] |
Siegel D A, MaritorenaS, Nelson N B, et al. 2005. Colored dissolved organic matter and its influence on the satellite-based characterization of the ocean biosphere. Geophysical Research Letters, 32(20): L20605. doi: 10.1029/2005GL024310
|
| [28] |
Siswanto E, Tang Junwu, Yamaguchi H, et al. 2011. Empirical ocean-color algorithms to retrieve chlorophyll-a, total suspended matter, and colored dissolved organic matter absorption coefficient in the Yellow and East China Seas. Journal of Oceanography, 67(5): 627–650. doi: 10.1007/s10872-011-0062-z
|
| [29] |
Srinivas K, DineshKumar P K. 2006. Atmospheric forcing on the seasonal variability of sea level at Cochin, southwest coast of India. Continental Shelf Research, 26(10): 1113–1133. doi: 10.1016/j.csr.2006.03.010
|
| [30] |
Srinivasa R N, Ramarao E P, Srinivas K, et al. 2016. Classification of case-II waters using hyperspectral (HICO) data over North Indian Ocean. In: Proceedings of Remote Sensing of the Oceans and Inland Waters: Techniques, Applications, and Challenges. New Delhi, India: SPIE
|
| [31] |
Tehrani N C, D’Sa E J, Osburn C L, et al. 2013. Chromophoric dissolved organic matter and dissolved organic carbon from sea-viewing wide field-of-view sensor (SeaWiFS), moderate resolution imaging spectroradiometer (MODIS) and MERIS sensors: case study for the northern Gulf of Mexico. Remote Sensing, 5(3): 1439–1464. doi: 10.3390/rs5031439
|
| [32] |
Thomas L C, Padmakumar K B, Smitha B R, et al. 2013. Spatio-temporal variation of microphytoplankton in the upwelling system of the south-eastern Arabian Sea during the summer monsoon of 2009. Oceanologia, 55(1): 185–204. doi: 10.5697/oc.55-1.185
|
| [33] |
Tilstone G H, Peters S W M, Van Der Woerd H J, et al. 2012. Variability in specific-absorption properties and their use in a semi-analytical ocean colour algorithm for MERIS in the North Sea and western English Channel coastal waters. Remote Sensing of Environment, 118: 320–338. doi: 10.1016/j.rse.2011.11.019
|
| [34] |
Twardowski M S, Boss E, Sullivan J M, et al. 2004. Modeling the spectral shape of absorption by chromophoric dissolved organic matter. Marine Chemistry, 89(1–4): 69–88. doi: 10.1016/j.marchem.2004.02.008
|
| [35] |
Usha B, Shaju S S, Ragesh N, et al. 2014. Observations on bio-optical properties of a phytoplankton bloom in coastal waters off Cochin during the onset of southwest monsoon. Indian Journal of Geo-Marine Sciences, 43(2): 289–296
|
| [36] |
Werdell PJ, Franz B A, Bailey S W, et al. 2013. Generalized ocean color inversion model for retrieving marine inherent optical properties. Applied Optics, 52(10): 2019–2037. doi: 10.1364/AO.52.002019
|
| 1. | Anagha Prasad, P. Rama Chandra Prasad, N. Srinivasa Rao. Assessing the water quality dynamics in the coastal waters of Kollam (Kerala, India) using Sentinel images. Anthropocene Coasts, 2024, 7(1) doi:10.1007/s44218-024-00042-0 | |
| 2. | T.M. Balakrishnan Nair, V.V.S.S. Sarma, Aneesh A. Lotliker, et al. An integrated buoy-satellite based coastal water quality nowcasting system: India's pioneering efforts towards addressing UN ocean decade challenges. Journal of Environmental Management, 2024, 354: 120477. doi:10.1016/j.jenvman.2024.120477 | |
| 3. | T. S. Rahul, J. Brema, G. Jims John Wessley. Evaluation of surface water quality of Ukkadam lake in Coimbatore using UAV and Sentinel-2 multispectral data. International Journal of Environmental Science and Technology, 2023, 20(3): 3205. doi:10.1007/s13762-022-04029-7 | |
| 4. | Twinkle Sathish, Jayanarayanan Kuttippurath, Aishwarya Purushothaman, et al. Observed evidence for the impact of coastal currents on the recurrent Noctiluca scintillans blooms in the northwest Indian Ocean coast. Marine Pollution Bulletin, 2023, 194: 115426. doi:10.1016/j.marpolbul.2023.115426 | |
| 5. | Saiyidah Munirah Mohd-Shazali, Jafar-Sidik Madihah, Nurzaliah Ali, et al. Dynamics of absorption properties of CDOM and its composition in Likas estuary, North Borneo, Malaysia. Oceanologia, 2022, 64(4): 583. doi:10.1016/j.oceano.2022.04.005 |

Figures(8)

Supported by:
Beijing Renhe Information Technology Co. Ltd

P Minu, V P Souda, S K Baliarsingh, R M Dwivedi, Y Ali, P M Ashraf. Assessing temporal variation of coloured dissolved organic matter in the coastal waters of South Eastern Arabian Sea[J]. Acta Oceanologica Sinica, 2020, 39(1): 102-109. doi: 10.1007/s13131-020-1534-z

 DownLoad:


 DownLoad: