Atul Srivastava, Anitha Gera, Imran M. Momin, Ashis Kumar Mitra, Ankur Gupta. The impact of northern Indian Ocean rivers on the Bay of Bengal using NEMO global ocean model[J]. Acta Oceanologica Sinica, 2020, 39(3): 45-55. doi: 10.1007/s13131-020-1537-9
Citation:
Atul Srivastava, Anitha Gera, Imran M. Momin, Ashis Kumar Mitra, Ankur Gupta. The impact of northern Indian Ocean rivers on the Bay of Bengal using NEMO global ocean model[J]. Acta Oceanologica Sinica, 2020, 39(3): 45-55. doi: 10.1007/s13131-020-1537-9
Atul Srivastava, Anitha Gera, Imran M. Momin, Ashis Kumar Mitra, Ankur Gupta. The impact of northern Indian Ocean rivers on the Bay of Bengal using NEMO global ocean model[J]. Acta Oceanologica Sinica, 2020, 39(3): 45-55. doi: 10.1007/s13131-020-1537-9
Citation:
Atul Srivastava, Anitha Gera, Imran M. Momin, Ashis Kumar Mitra, Ankur Gupta. The impact of northern Indian Ocean rivers on the Bay of Bengal using NEMO global ocean model[J]. Acta Oceanologica Sinica, 2020, 39(3): 45-55. doi: 10.1007/s13131-020-1537-9
The effect of river runoff over the northern Indian Ocean (NIO) especially over the Bay of Bengal (BoB) has been studied using global Nucleus for European Modelling of the Ocean (NEMO). Two sensitivity experiments, with and without river runoff are conducted and the influence of river runoff on the Indian Ocean hydrography, stratification and circulation features are studied. It is found that due to river runoff surface salinity over the northern BoB decreases by more than 5 and the East India Coastal Current strengthens by 2 cm/s during post monsoon season. The fresh river water reaches up to 15°N in the BoB and is the main cause for low salinity there. Sea surface temperature in the northwestern BoB increases by more than 0.2°C due to the river runoff in summer monsoon while surface cooling upto 0.2°C is seen in north-west part of BoB in winter season. The seasonal mixed layer depth in the region is found to be dependent on river runoff. The effect of vertical shear and Brunt Vaisala frequency on stratification is also examined. The ocean water becomes highly stratified up to 3 035 m due to the river runoff. It is found that the energy required for mixing is high in the northern and coastal BoB.
The northern Indian Ocean comprises of Arabian Sea (AS), Bay of Bengal (BoB) and equatorial Indian Ocean. During summer monsoon BoB receives large amount of freshwater flux (Sengupta et al., 2006) in terms of local precipitation and river discharge. BoB receives freshwater during southwest monsoon from major adjoining rivers namely Ganges, Brahmaputra, Irawadi and other rivers. During the monsoon season in northern BoB, 443.493 × 10⁹ m3, amount of fresh water is discharged (Varkey et al., 1996) by rivers. This incoming river water affects mainly salinity. The salinity change alters the mixed layer depth (MLD) and stratification of the BoB (Shetye et al., 1996) due to which sea surface temperure (SST) is also affected. Further, due to changes in salinity and temperature, the heat and salt budgets are also altered (de Boyer Montégut et al., 2007).
The freshwater forcing in BoB and AS is contrasting in nature due to precipitation and river runoff. In BoB, precipitation is more than evaporation (Harenduprakash and Mitra, 1988; Prasad, 1997) while the opposite is observed in the AS. Therefore the surface layer of the BoB is less saline and more stratified than AS (Vinayachandran et al., 2002; Shenoi et al., 2002). Weller et al. (2002) have discussed the importance of wind mixing and surface buoyancy forcing in the AS and found that in summer monsoon surface mixed layer is deep due to wind mixing while in winter monsoon convective deepening plays a significant role over the AS. It happens due to surface buoyancy. Gordon et al. (2003) discussed that surface freshwater changes the upper ocean velocity field by creating dynamic height gradients. It also changes the salinity stratification (Howden and Murtugudde, 2001) which influences the mixed layer depth (MLD), surface momentum flux, velocity shear and entrainment rates. It is showed that if the mixed layer is very shallow then penetrative shortwave flux is balanced by net surface heat flux, whereas subsurface water isolated from evaporative and long wave cooling, is warmed by penetrative sunlight (Sengupta et al., 2002; Sengupta and Ravichandran 2001). Anitha et al. (2008) using Argo data analysed the surface buoyancy flux in BoB and AS and observed that both in AS and BoB the net buoyancy flux is dominated by the freshwater buoyancy and that it is very high in the BoB than AS, implying a highly stable upper ocean in the BoB than AS. Perigaud et al. (2003) studied the impact of interannual rainfall anomalies on sea surface salinity (SSS) using the layer model and found that surface salinity is mainly affected due to changes in freshwater flux and river runoff. Jensen (2001) studied the long-term salt balance, water exchange between the two basins and its associated properties. In terms of salinity distribution less saline water is found along the west coast of BoB (Rao and Sivakumar, 1999, 2003; Prasanna et al., 2004, Gopalakrishna et al., 2005), whereas high-salinity water is found in the AS. Akhil et al. (2014) studied the properties responsible for strong seasonal cycle in surface salinity in BoB. Vinayachandran et al. (2015) using climate coupled model have studied the effect of river discharge in the monsoon season and found that when the river discharge is not provided to the model, the SST increases by about 0.5°C and that the Indian Summer Monsoon Rainfall increases by 10%. Jana et al (2015) used ROMS and found significant improvement in SST, SSS, MLD and barrier layer thickness due to seasonal river input into the BoB. The Indian Ocean simulation features using NEMO 3.2 ocean model are also discussed by Momin et al. (2013). They noted that the model results match well with the observations. Momin et al. (2014) have used the same NEMO ocean model with two different horizontal and vertical resolutions and found that higher resolution model simulations have less bias when compared with observations.
Chowdary et al. (2016) studied the upper ocean salinity variability with several models and found that models have positive bias in salinity and concluded that better vertical and turbulence schemes are still needed to capture the variability. The mechanism responsible for low salinity pool and its offshore movement in the BoB is studied by Mahapatra and Rao (2017). Behara and Vinayachandran (2016) analysed the effects of rainfall and river discharge (freshwater flux) on the BoB with four sensitivity experiments. They discussed the impact of rainfall and river runoff on the SST, SSS, transport and currents. They found that due to the river runoff, equator-ward flowing East India Coastal Current (EICC) is strengthened by about 0.15 m/s during north east monsoon and that the northwestern bay SST increases by 1.58°C during summer due to greater heat absorption within a shallow mixed layer (ML). Callaghan et al. (2014) have described the role of air-sea forcing near the surface mixed layer. Halkides et al. (2015) discuss the spatial and temporal variation of processes that determine ocean mixed layer temperature variability in tropical Indian Ocean. Da-Allada et al. (2015) studied mixed-layer salinity budget in the tropical Indian Ocean using satellite products and in situ observations for the period 2004–2012. They observed that the seasonal cycle of the mixed layer salinity is mainly due to meridional advection driven by the monsoon winds. Durand et al. (2011) investigated the impact of river runoff in the BoB and found that higher vertical and horizontal resolution ocean model is required to quantify the BoB salinity variations.
These studies discussed above to explore the impact of river runoff were performed with coarser vertical resolution in the upper 500 m. Ocean stratification and wind shear play an important role in mixing the upper water column of the ocean. To represent the vertical structure and mixing well, an ocean model with higher vertical resolution is required which can capture the subsurface variability. Earlier studies suggested the large biases in the BoB hydrography are mainly due to vertical mixing, vertical resolution, and lateral advection (e.g., Chowdary et al. 2016). In light of this background, this study aims to investigate the influence of river runoff on SST, SSS, MLD, circulation and stratification in northern Indian Ocean especially over the BoB with high vertical resolution of 75 vertical levels from surface to bottom of the ocean. The remaining structure of the paper is as follows. Section 2 details the configuration of the ocean model, data sets used for the study and details of model setup for the sensitivity experiments conducted. Results and discussion are given in Section 3. Conclusions of this paper are presented in Section 4.
2.
Model and data
We used a high vertical resolution global Nurcleus for European Modelling of the Ocean (NEMO) (Madec and the NEMO team, 2012) to analyze the effect of river runoff in northern Indian Ocean. NEMO model is based on the primitive equation model (OPA) which solves the three dimensional velocity field, the temperature and the salinity fields for the global and regional ocean circulation. It uses a curvilinear orthogonal tripolar grid to remove the North Pole singularity in horizontal direction. The variables are arranged in three-dimensional Arakawa C-type grid. It also has the capability to simulate the sea-ice (LIM) and biogeochemistry (TOP-PISCES) features in the ocean. In addition, Ice-shelf-ocean interaction is also included. The model is configured for global run with 1º x 1º horizontal resolutions with 75 vertical levels. The high vertical resolution with 75 levels help in resolving the mixing processes. Out of 75 levels, 40 levels in vertical direction vary from 0.5 m in the upper ocean to 500 m. From the global model run, the study region of interest is 0º–26ºN , 50º–105ºE (Fig. 1a). Model Bathymetry is derived from ETOPO2-two minute global bathymetry. Turbulence Kinetic Energy (TKE) mixing scheme is used for vertical mixing. The mixing scheme used in ocean models used to calculate the vertical eddy viscosity and diffusivity coefficients which is developed by Gaspar et al. (1990). The insertion depth of the river runoff is computed in the model. The model is initialized from rest with WOA 13 (Zweng et al., 2013) temperature and salinity and run for 21 years to reach steady state. The restart at the end of 21st year is used as climatological initial condition, and the model run for another two years. The seasonal means from the simulations of these two years are analysed and discussed. The model is forced to run with obtained climatological initial condition and climatological CORE2 forcing data sets of Large and Yeager 2009. The forcing fields are time varying which are 6-hourly air temperature at 2 m, relative humidity, zonal wind, meridional wind, while daily downward long wave and short wave radiation data are given to model. Monthly precipitation (Large and Yeager, 2009), chlorophyll and river runoff (Dai et al., 2009) data are also used. To study the effect of river runoff over our study region we perform two sensitivity experiments. In the first experiment (CTRL), the model is forced with all the above forcing fields while in the second experiment (NROF), river runoff is switched off.
Figure
1.
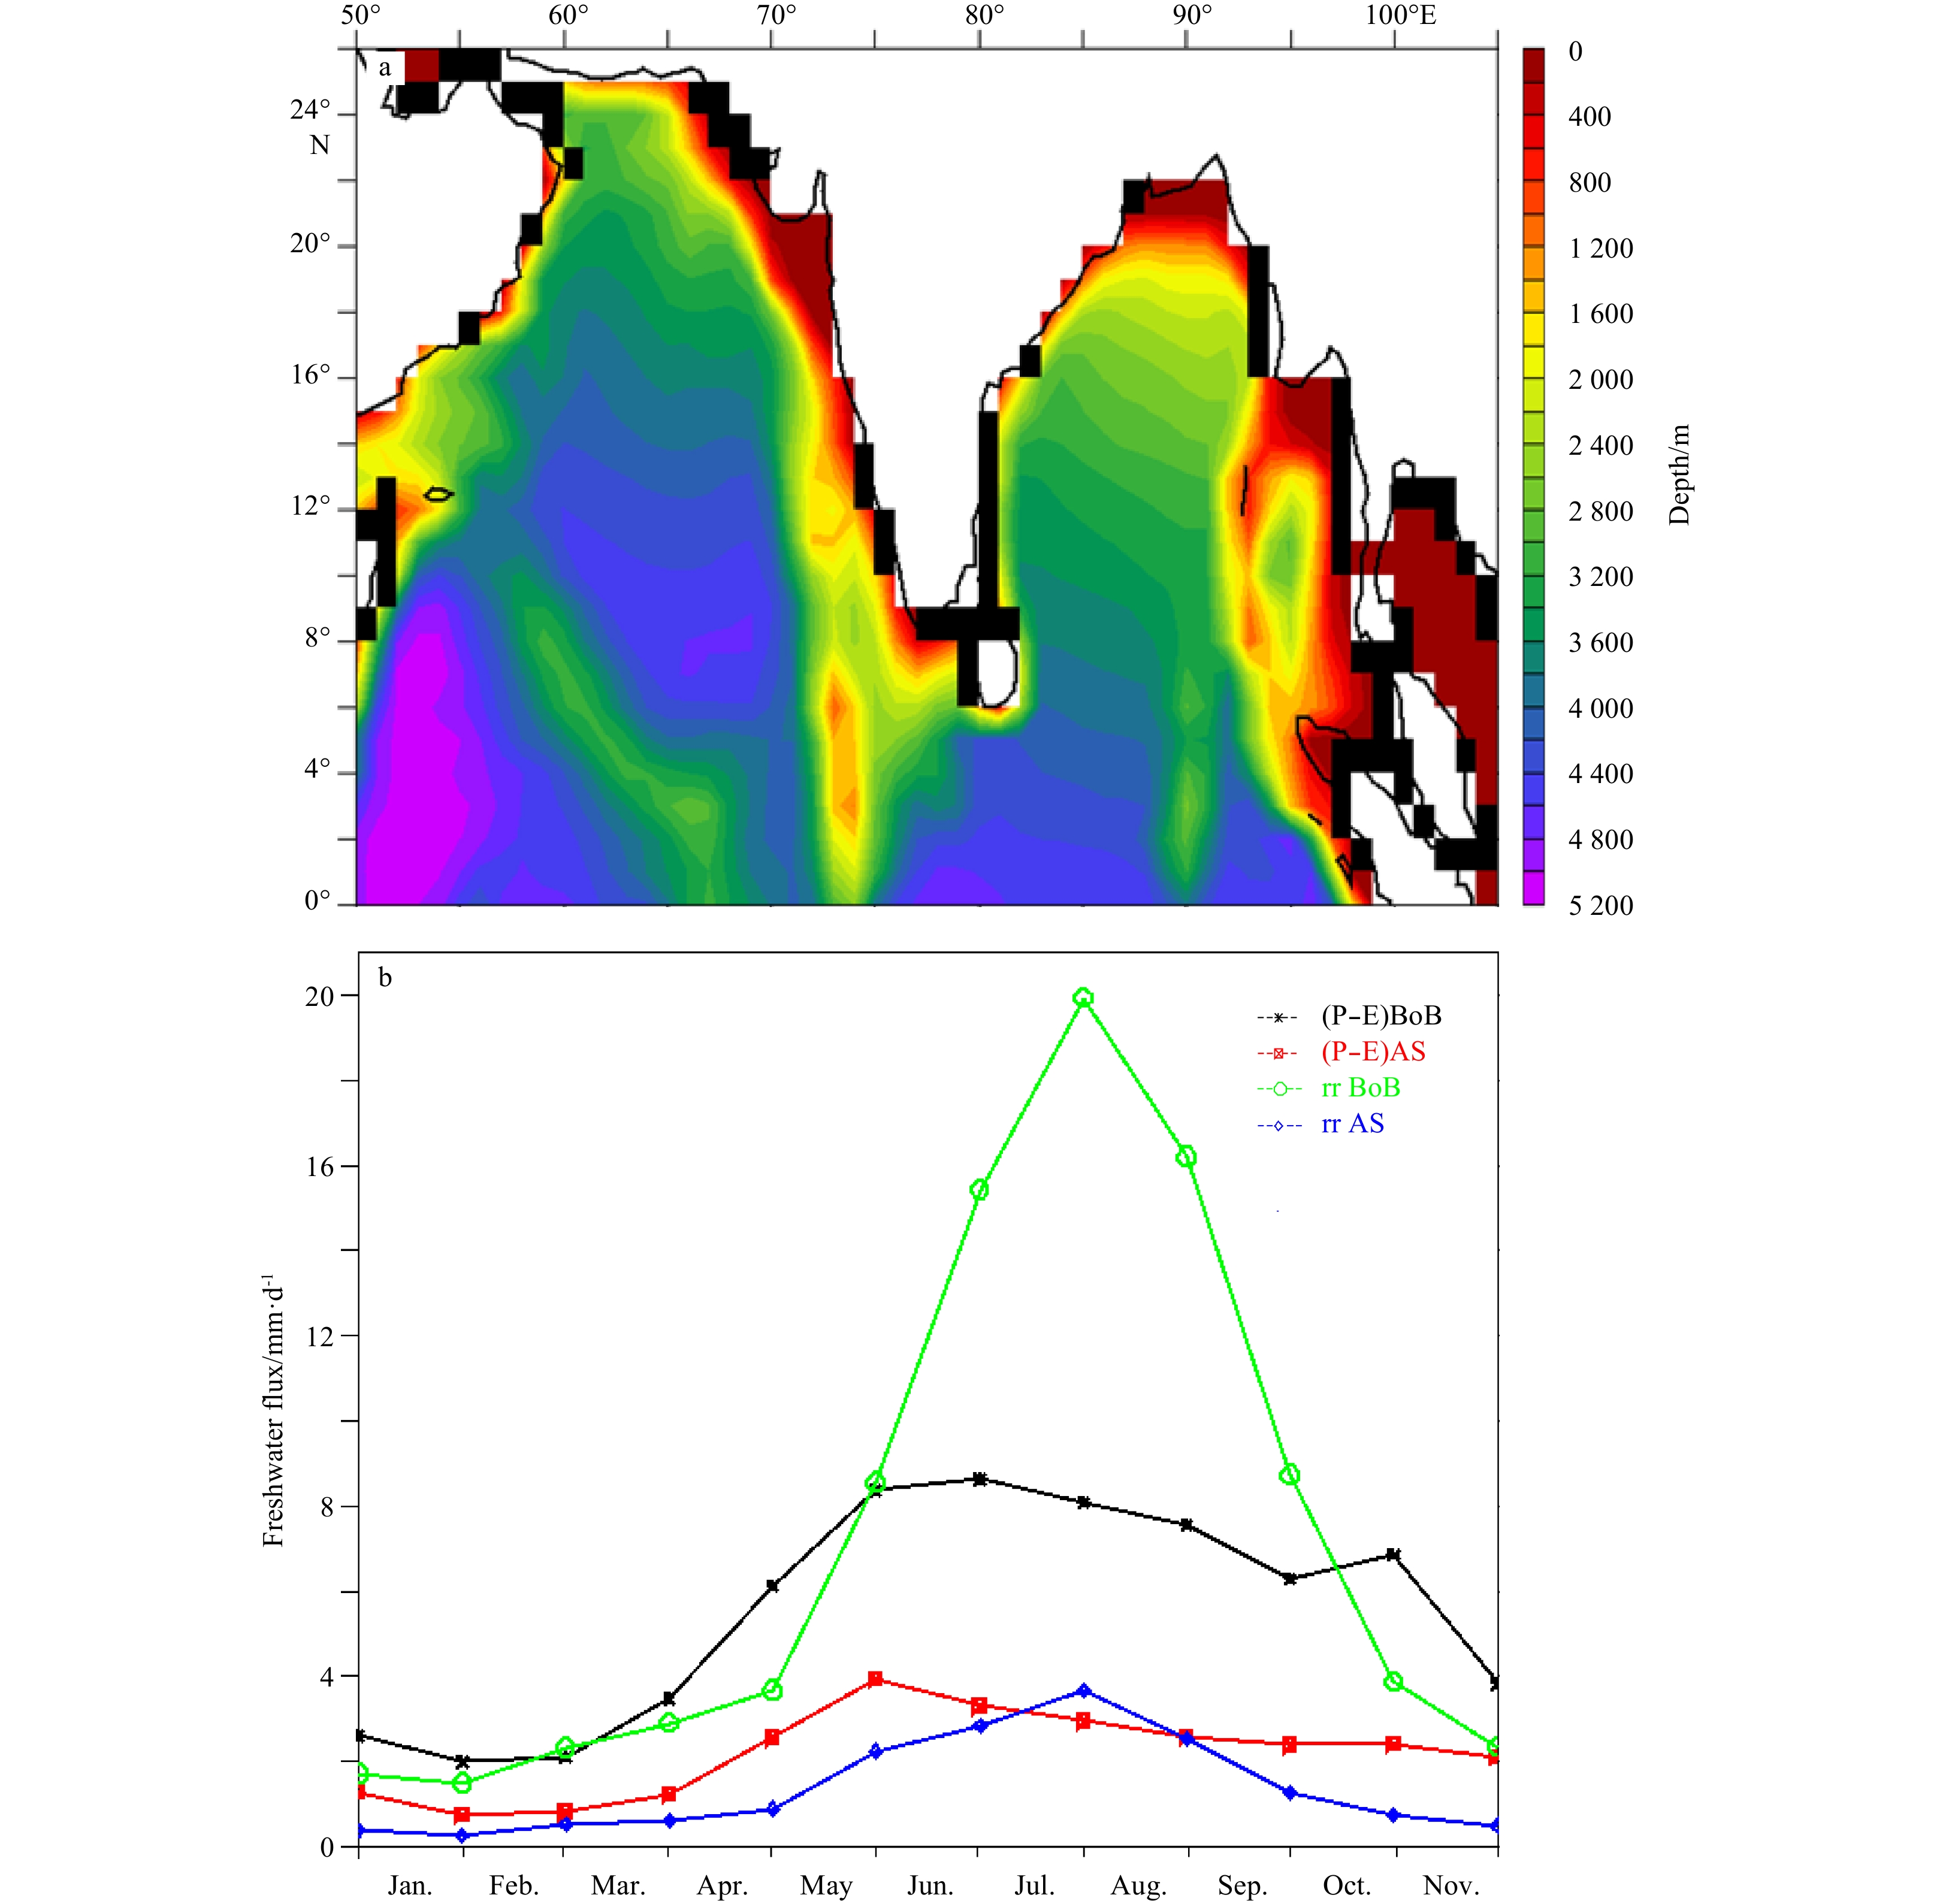
Bathymetry (shaded) of the study area. Black boxes represent the river discharge locations from the rivers in the NIO(a), Monthly plot of river runoff (mm/d) and freshwater flux (mm/d) in the AS (0º–26ºN, 50º–80ºE) and BoB (0º–22ºN, 80º–95ºE) (b).
To study the role of river runoff in influencing the vertical stability over the northern Indian Ocean especially over BoB, the vertical shear and Brunt Vaisala frequency are computed and analyzd. The vertical shear has been computed as S2= (∂U/∂z)2 + (∂V/∂z)2, where U and V are zonal and meridional components of horizontal current, respectively. Whereas Brunt Vaisala frequency (buoyancy frequency) has been computed as N2 = – (g/ρ)∂ρ/∂z, where ρ is density and g is gravitational acceleration. To study the influence of river runoff on upper-ocean stratification energy required for mixing (ERM) is computed. The ERM is the potential energy required to mix water of the column from the surface to MLD (Shenoi et al., 2002). The ERM is computed folllowing (Chowdary et al., 2016; Srivastava et al., 2018):
Where g is acceleration due to gravity, ρs is surface layer density of ocean and ρb is density at the base of mixed layer depth (h). The energy required for mixing the water column to base of the mixed layer is the difference between the potential energy of a stratified column at the base of mixed layer and that of the same column when it is not stratified.
3.
Results and discussion
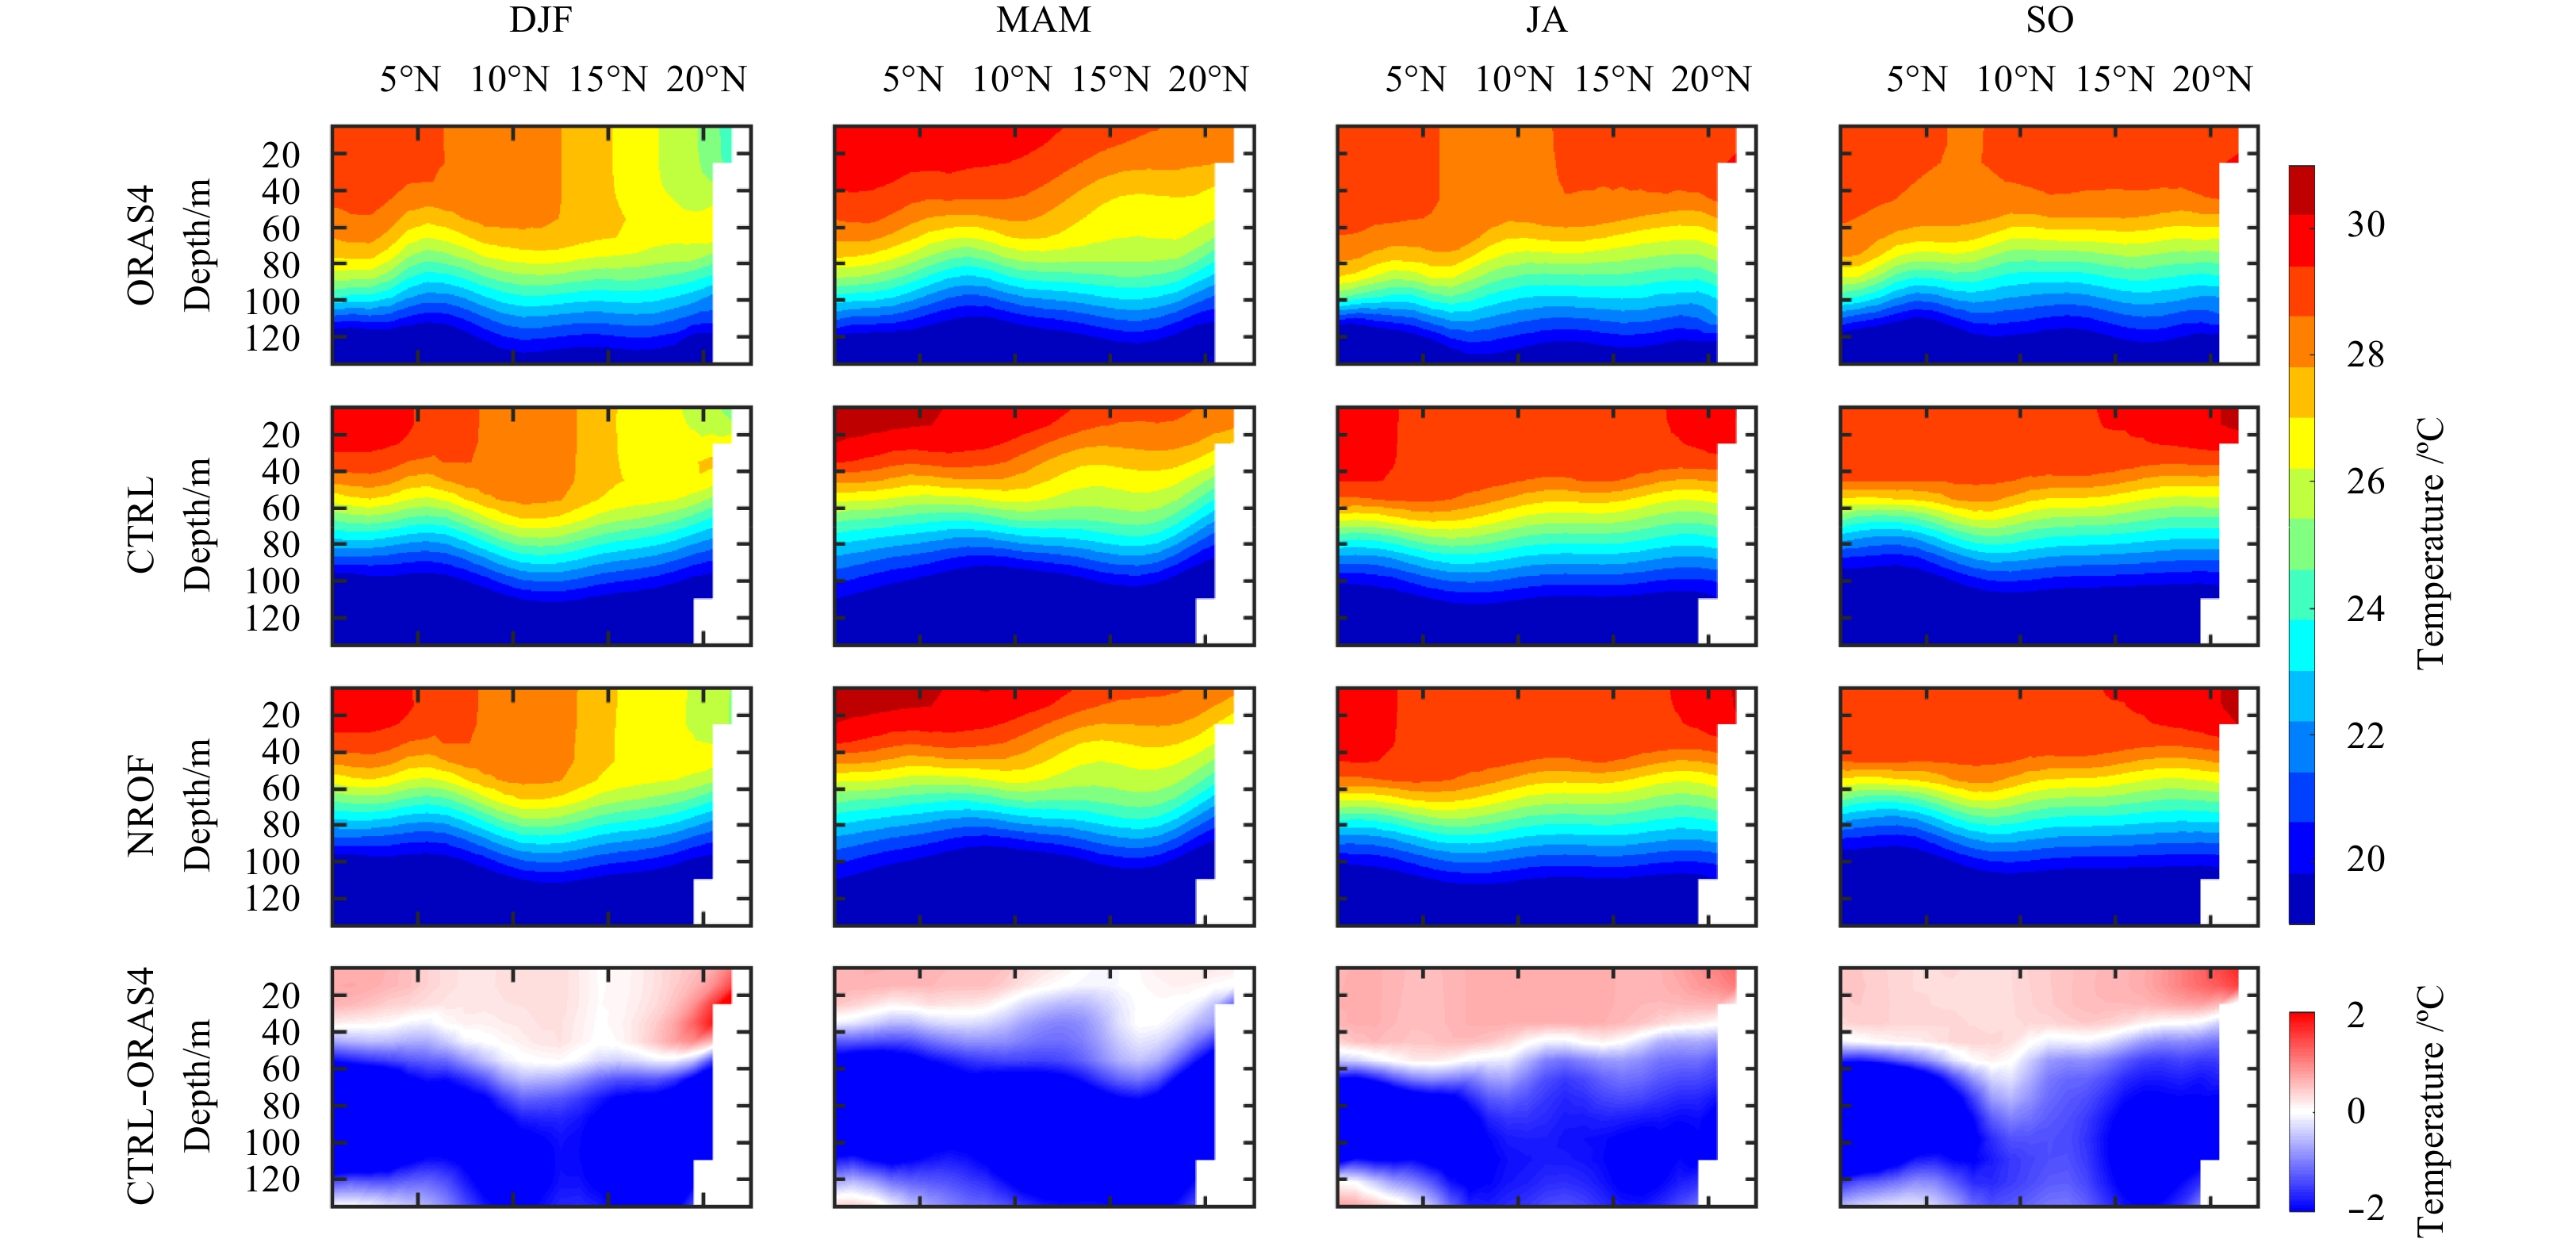
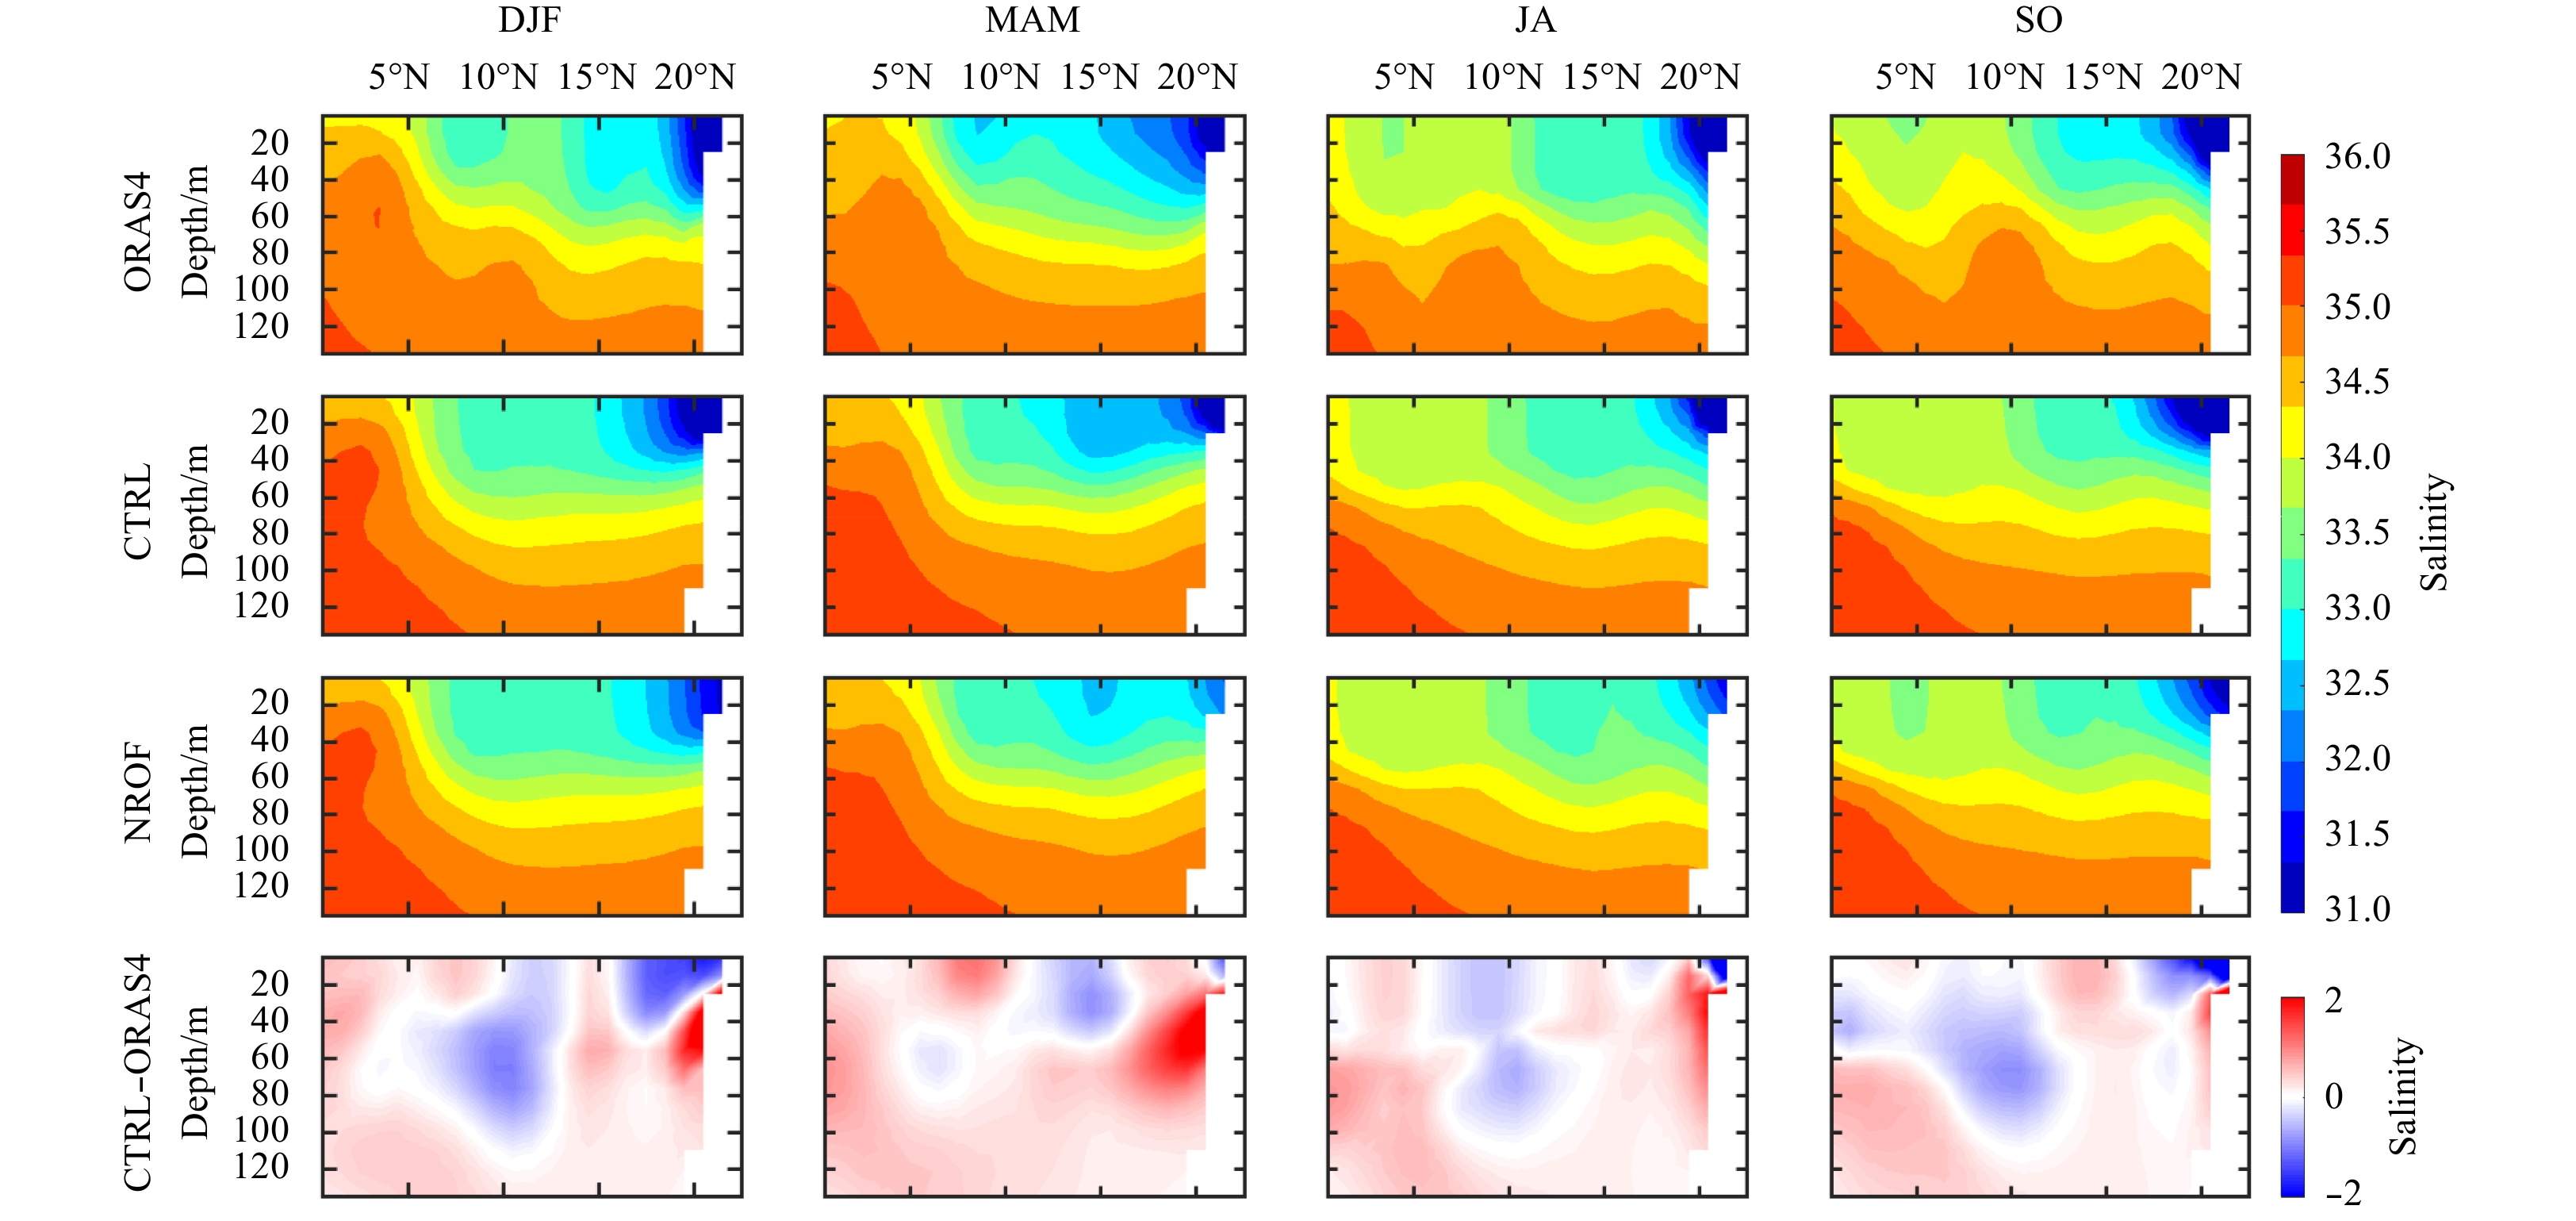
In this section we discuss the impact of river runoff on SST, SSS, MLD and stability defined in our study region (0º–26ºN, 50º–105ºE). The influence of river runoff on the ocean subsurface parameters is also analyzed. The seasonal averages are computed as December-January-February (DJF), March-April-May (MAM), July-August (JA), and September-October (SO) months. In order to discuss the model validation against the observations, we compared the seasonal mean model results of SST and SSS with that of ocean reanalysis system 4 (ORAS4) (Balmaseda et al., 2013). The surface current is validated with Ocean Surface Current Analysis Real-time (OSCAR) data. The OSCAR (Bonjean and Lagerloef, 2002) currents are taken on global 1/3 degree grid with a 5 d resolution. The correlation between CTRL SST and ORAS4 SST is found to be 0.85 and root mean square error (RMSE) of the CTRL run and ORAS4 to be 0.8°C. The standard deviation (SD) of ORAS4 SST is 1.2°C. The RMSE is much smaller than the SD which implies quality of our model output is good. The SSS correlation coefficient between the CTRL run and the ORAS4 is 0.91. The RMSE of the CTRL run w.r.t ORAS4 SSS is 0.35 which is much smaller than the standard deviation 0.85 of the ORAS4 SSS, which further suggests that the quality of our model output is reasonably good. The detailed validation of the model output against different observations has been documented in Gera et al. (2013) and it is found that model simulations agree well with the observations in the Indian Ocean. Figure 1a shows the bathymetry (shaded) and the major adjoining rivers (black shaded boxes) in the study region. Figure 1b shows the monthly river runoff and freshwater flux (P-E) in the BoB and AS. BoB receives more river runoff than AS through-out the year. BoB receives maximum (19 mm/d) river runoff in mid of July and August (Jana et al., 2015) while minimum in January (1.9 mm/d). Similarly, AS also receives the maximum (2.2 mm/d) and minimum (0.1 mm/d) river runoff in the same months but the magnitudes are much less compared to that in BoB. From Fig. 1b we observe that low salinities in the BoB region is mainly due to river runoff. Freshwater flux (P-E) also plays an important role in maintaining low salinity in the BoB. However the contribution of river runoff is more than that of P-E in the the BoB. Figure 2 shows the latitude-depth plot of upper ocean temperature section at 90ºE from model experiments and ORAS4 and the difference from the observation. From this figure, we observe that temperature decreases northward during DJF and MAM season in both CTRL and ORAS4 while in JA and SO season same variability is observed from 10ºN to 15ºN. We also observe from this figure that in DJF season ORAS4 shows 27°C temperature at 80 m while in CTRL run it occurs at a shallower depth of 60 m. Figure 3 shows latitude depth comparison of ORAS4 (1st row), CTRL (2nd row), NROF (3rd row) and their difference (CTRL-ORAS4; 4th row) salinity at 90ºE. From Fig. 3, we find that CTRL run captures the salinity variability very well in all seasons because of the model’s high vertical resolution. The CTRL run has marginally overestimated the salinity (0.5) from 0º–10ºN from surface to subsurface in DJF season with respect to ORAS4. In DJF and SO season CTRL run shows marginally negative bias (0.5) from 16º–22ºN. However, in MAM and JA seasons very small differences (0.3) in salinity are observed. Therefore, the model gives a good salinity state representation in the vertical in BoB. Hence, it is understood that our model configuration is reasonably good to study the impact of river runoff in BoB.
Figure
2.
Latitude-depth map of temperature (ºC) at 90ºE from ORAS4 (1st row), CTRL (2nd row) NROF (3rd row), difference of CTRL and ORAS4 observation (4th row).
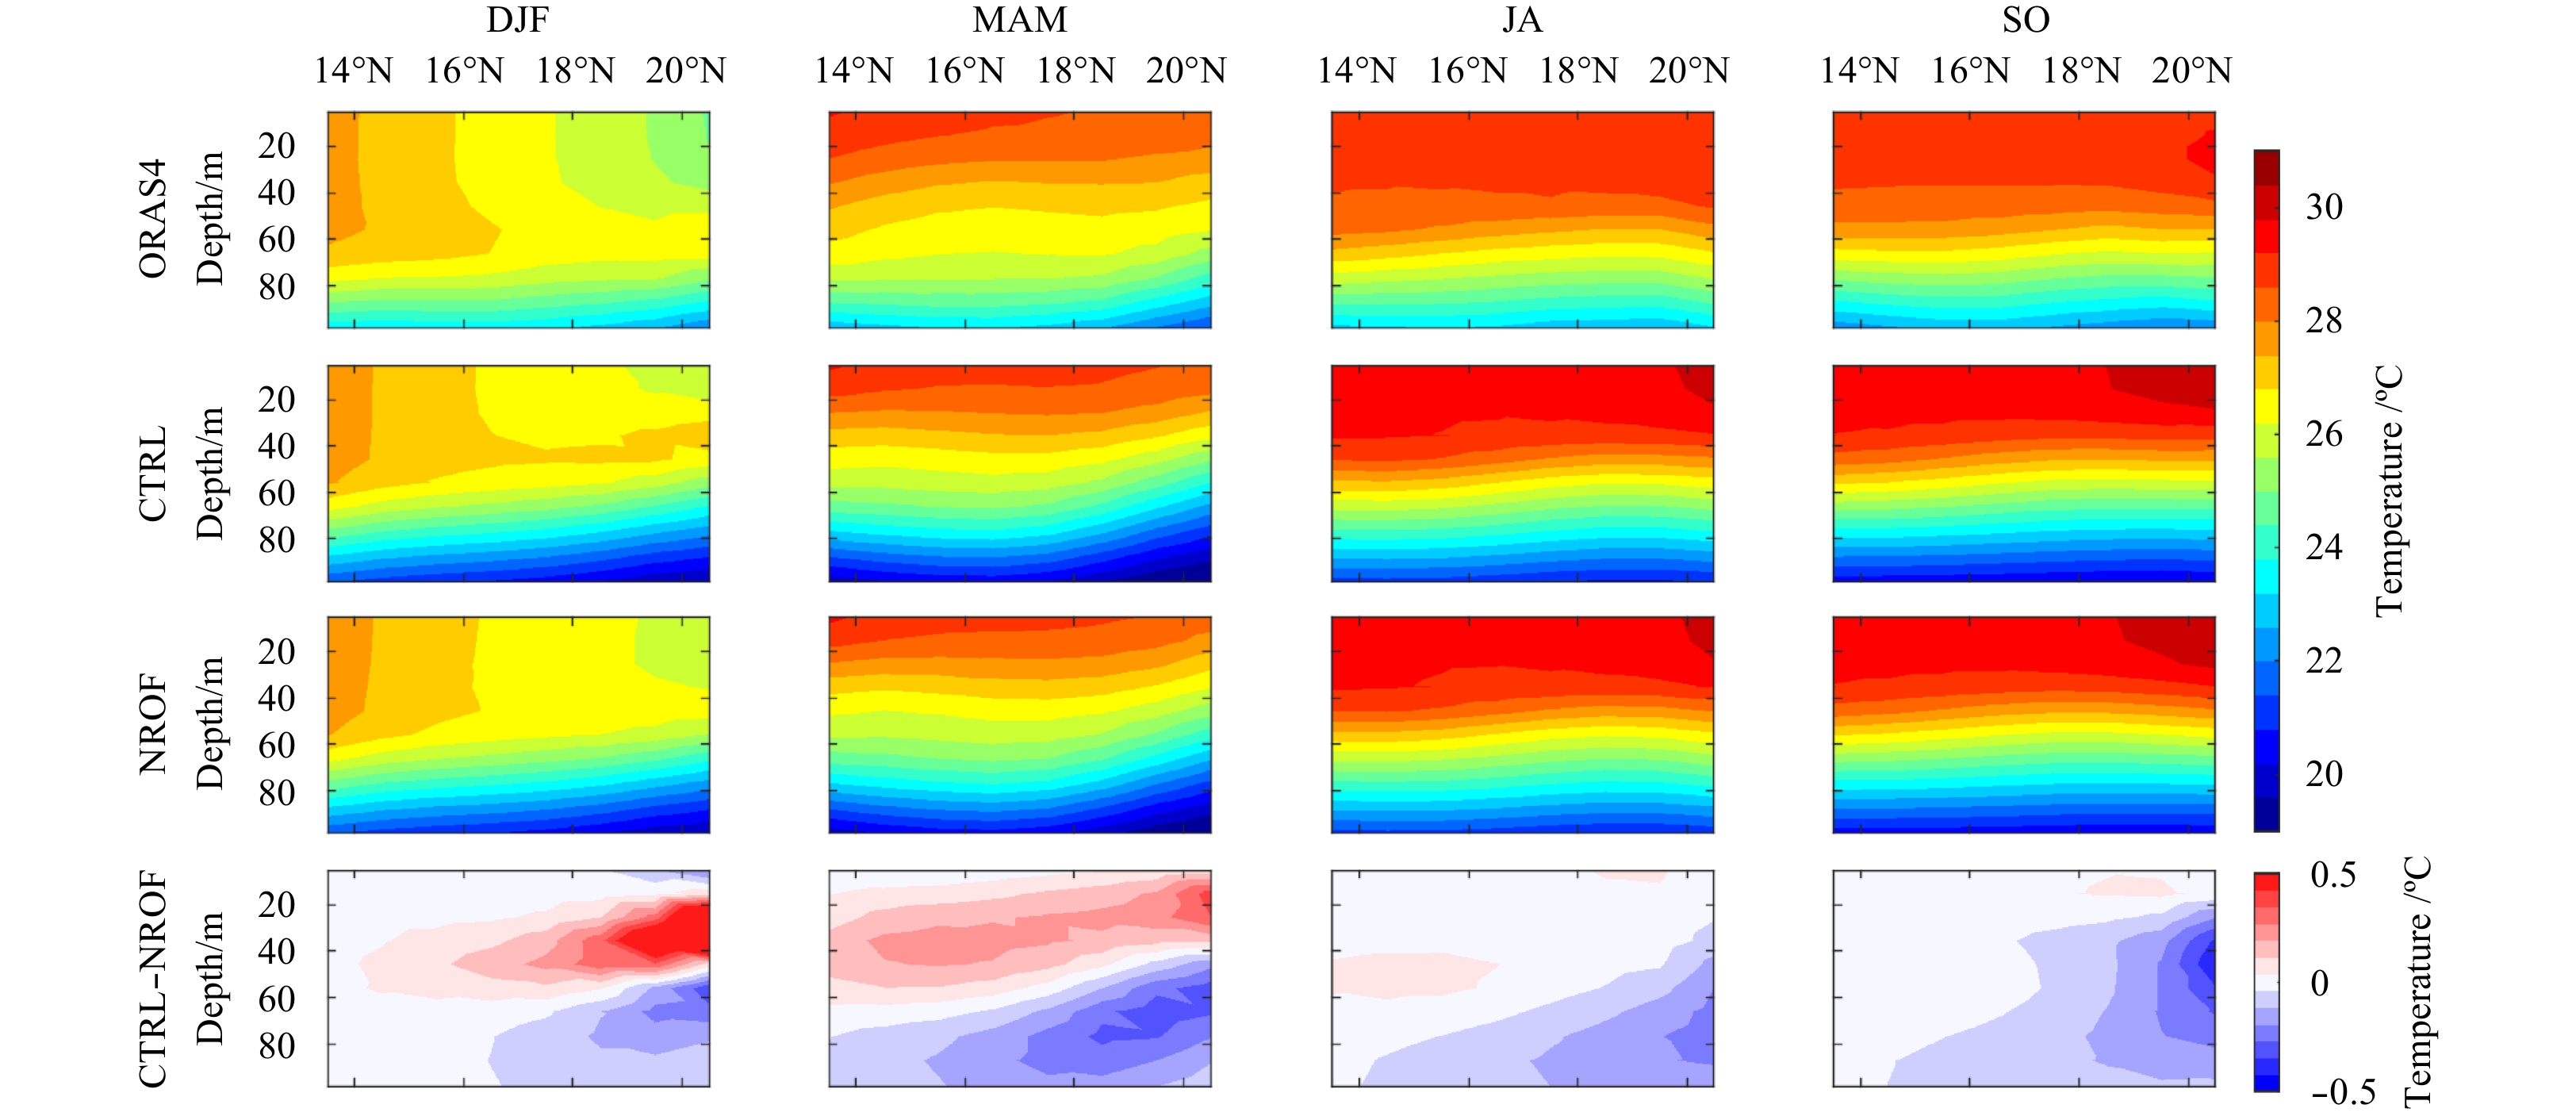
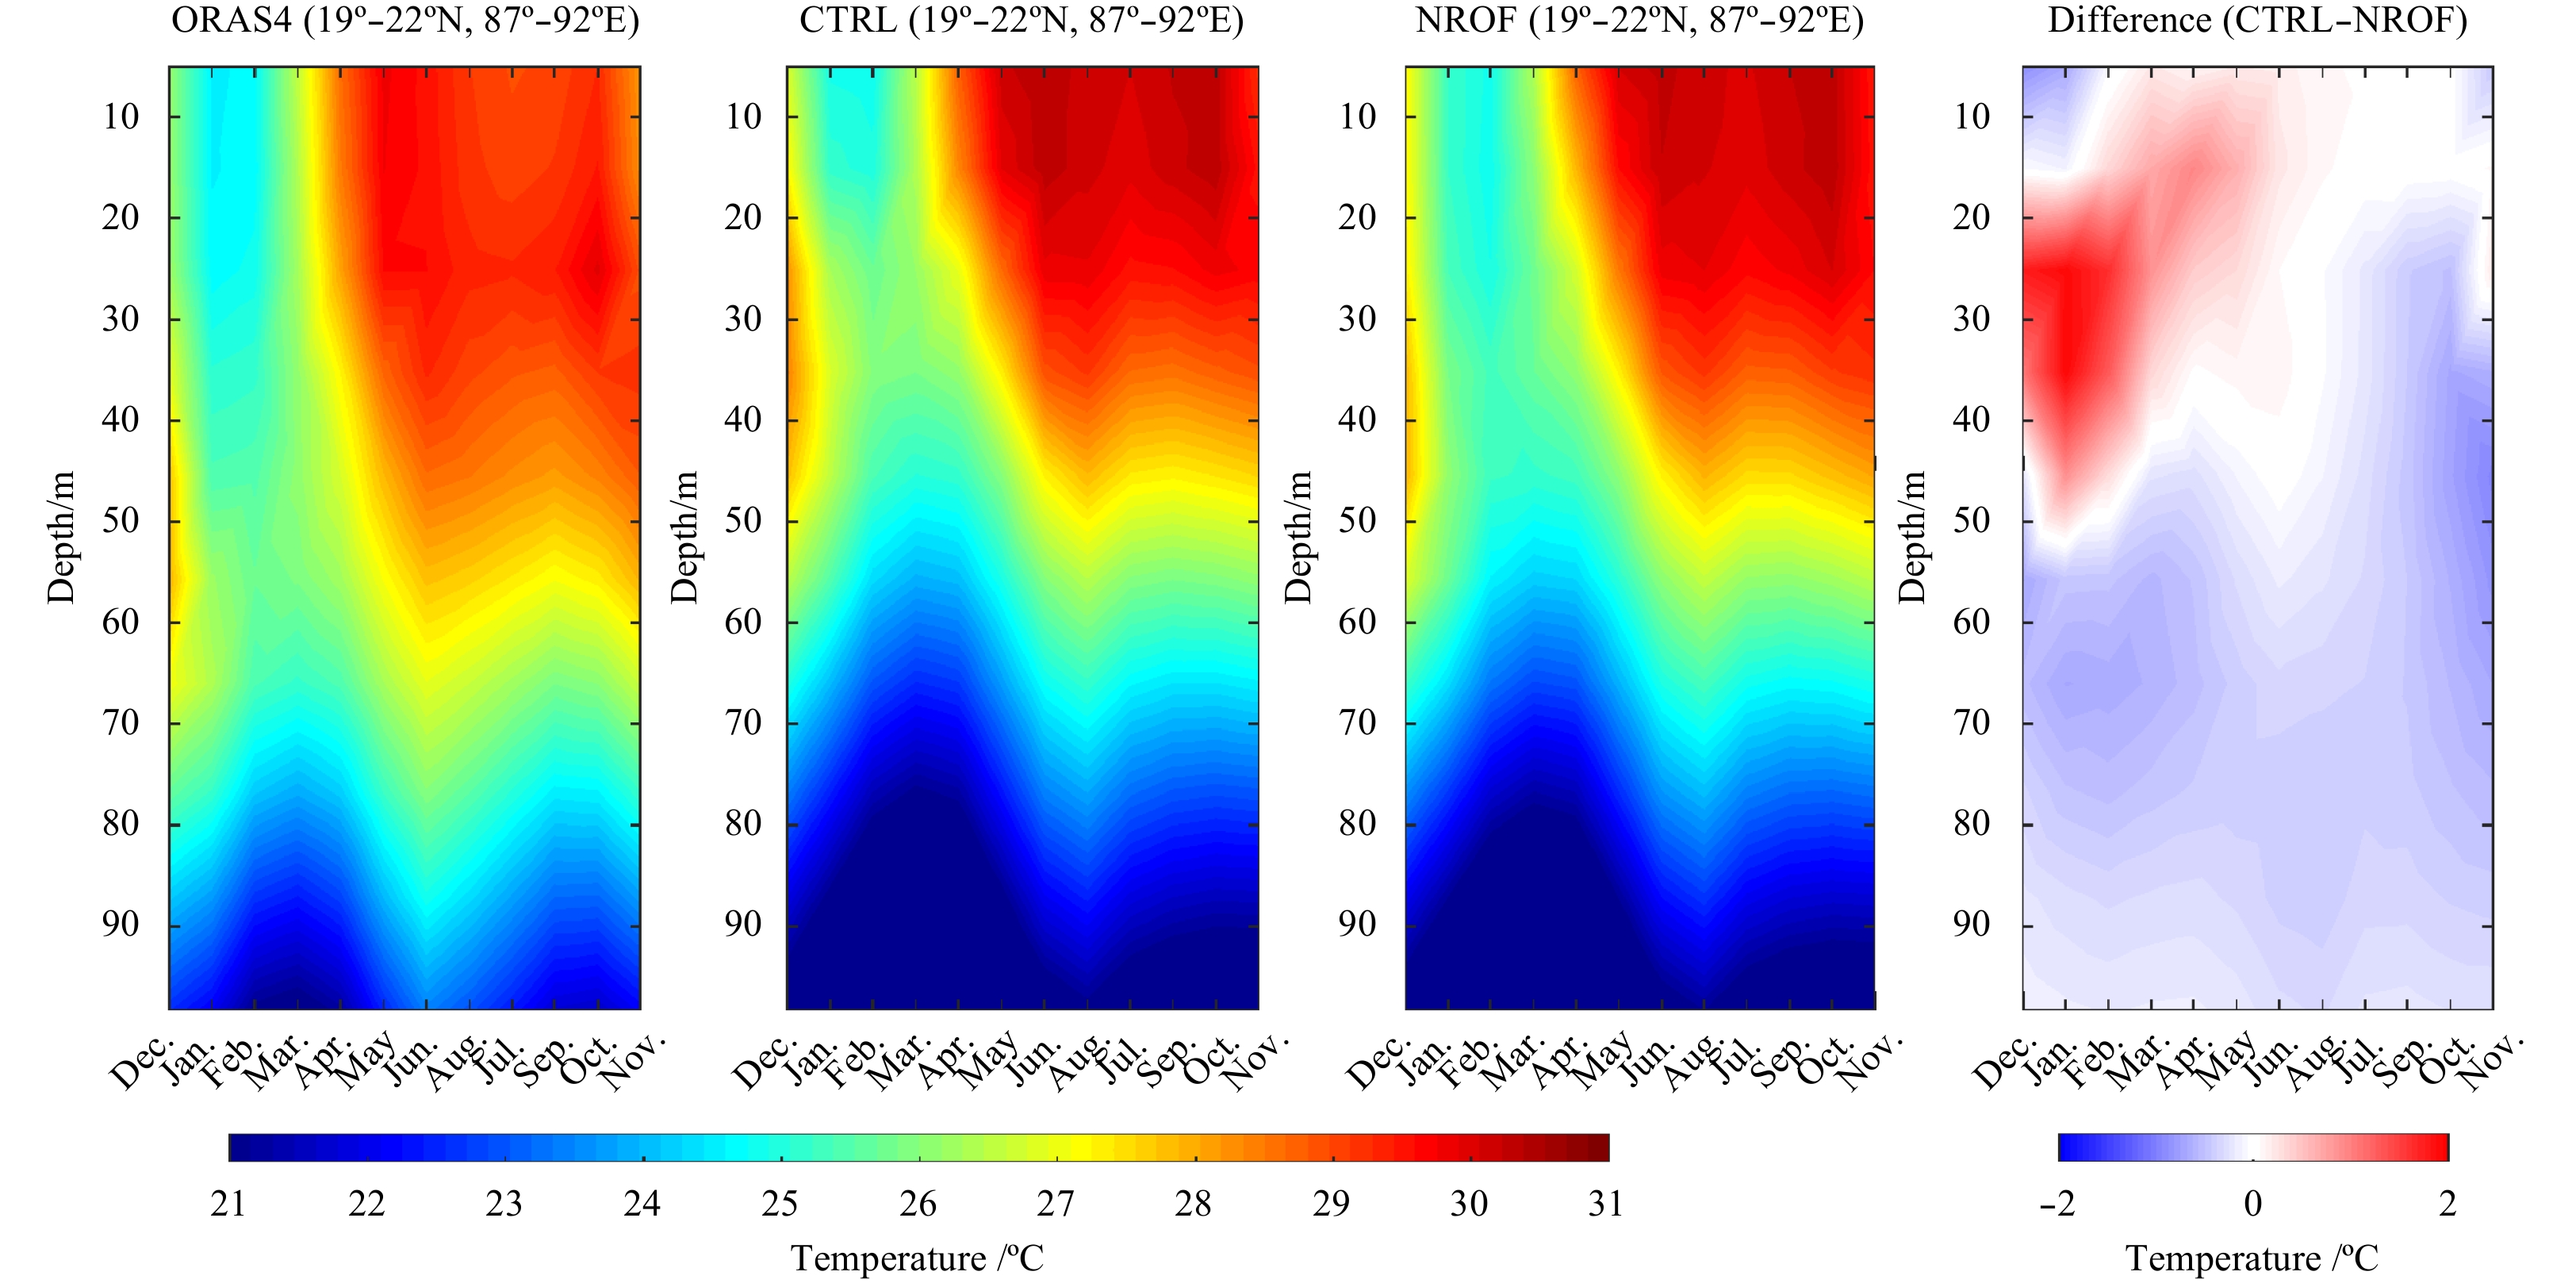
After validating the model simulations with observations we now discuss the results obtained from the sensitivity experiments. Figure 4 shows the seasonal variability of SST from CTRL run (2nd row) and NROF (3rd row) experiment while 4th row represents their difference. We observe that in the presence of river runoff, SST increases by 0.1°C during MAM in the northern BoB and 0.2°C in JA and SO season over north western BoB. These results agree with those of Chamarthi et al. (2008). The mixed layer of the northern BoB is shallow due to river runoff and high SST. In DJF season the MLD is very deep in NROF experiment. Further, to see the effect of runoff with depth, we plot in Fig. 5 the latitude-depth plot of temperature at 90ºE. In JA upper layer temperature is warmer and sub-surface temperature cooler. The region 15º–20ºN is the most sensitive area. Due to river runoff, north of 18ºN, CTRL run temperature is larger (0.5ºC) than NROF experiment up to 20 m in MAM season. In JA and SO season, the temperature increases but it is less (0.2°C) than that of MAM season. In winter season the CTRL run near surface temperature upto 20 m is less than that in NROF. In DJF season MLD decreases due to river runoff in CTRL run and SST also decreases. An interesting feature is that in DJF season river runoff increases the temperature by more than (1°C) from 20 m to 50 m. To study the temperate pattern only over the head bay region temperature is averaged over the region (19º–22ºN, 87º–92ºE) (Fig. 6). We find an increase of more than 1°C temperature due to runoff below the depth of 20 m. However, decrease of temperature is seen from surface to 20 m of the ocean in DJF season.
Figure
4.
Seasonal Sea Surface Temperature (SST) over the Indian Ocean from ORAS4 (1st row), CTRL (2nd row), NROF (3rd row) and difference of CTRL and NROF experiments (4th row).
Figure
5.
Latitude-depth plot of temperature at 90ºE from ORAS4 (1st row), CTRL (2nd row), NROF (3rd row) and difference of CTRL and NROF experiments (4th row).
Figure
6.
Time-depth plots of temperature average over the area(19º–22ºN, 87º–92ºE) from ORAS4 (1st column), CTRL (2nd column), NROF (3rd column) and difference of CTRL and NROF experiments (4th column).
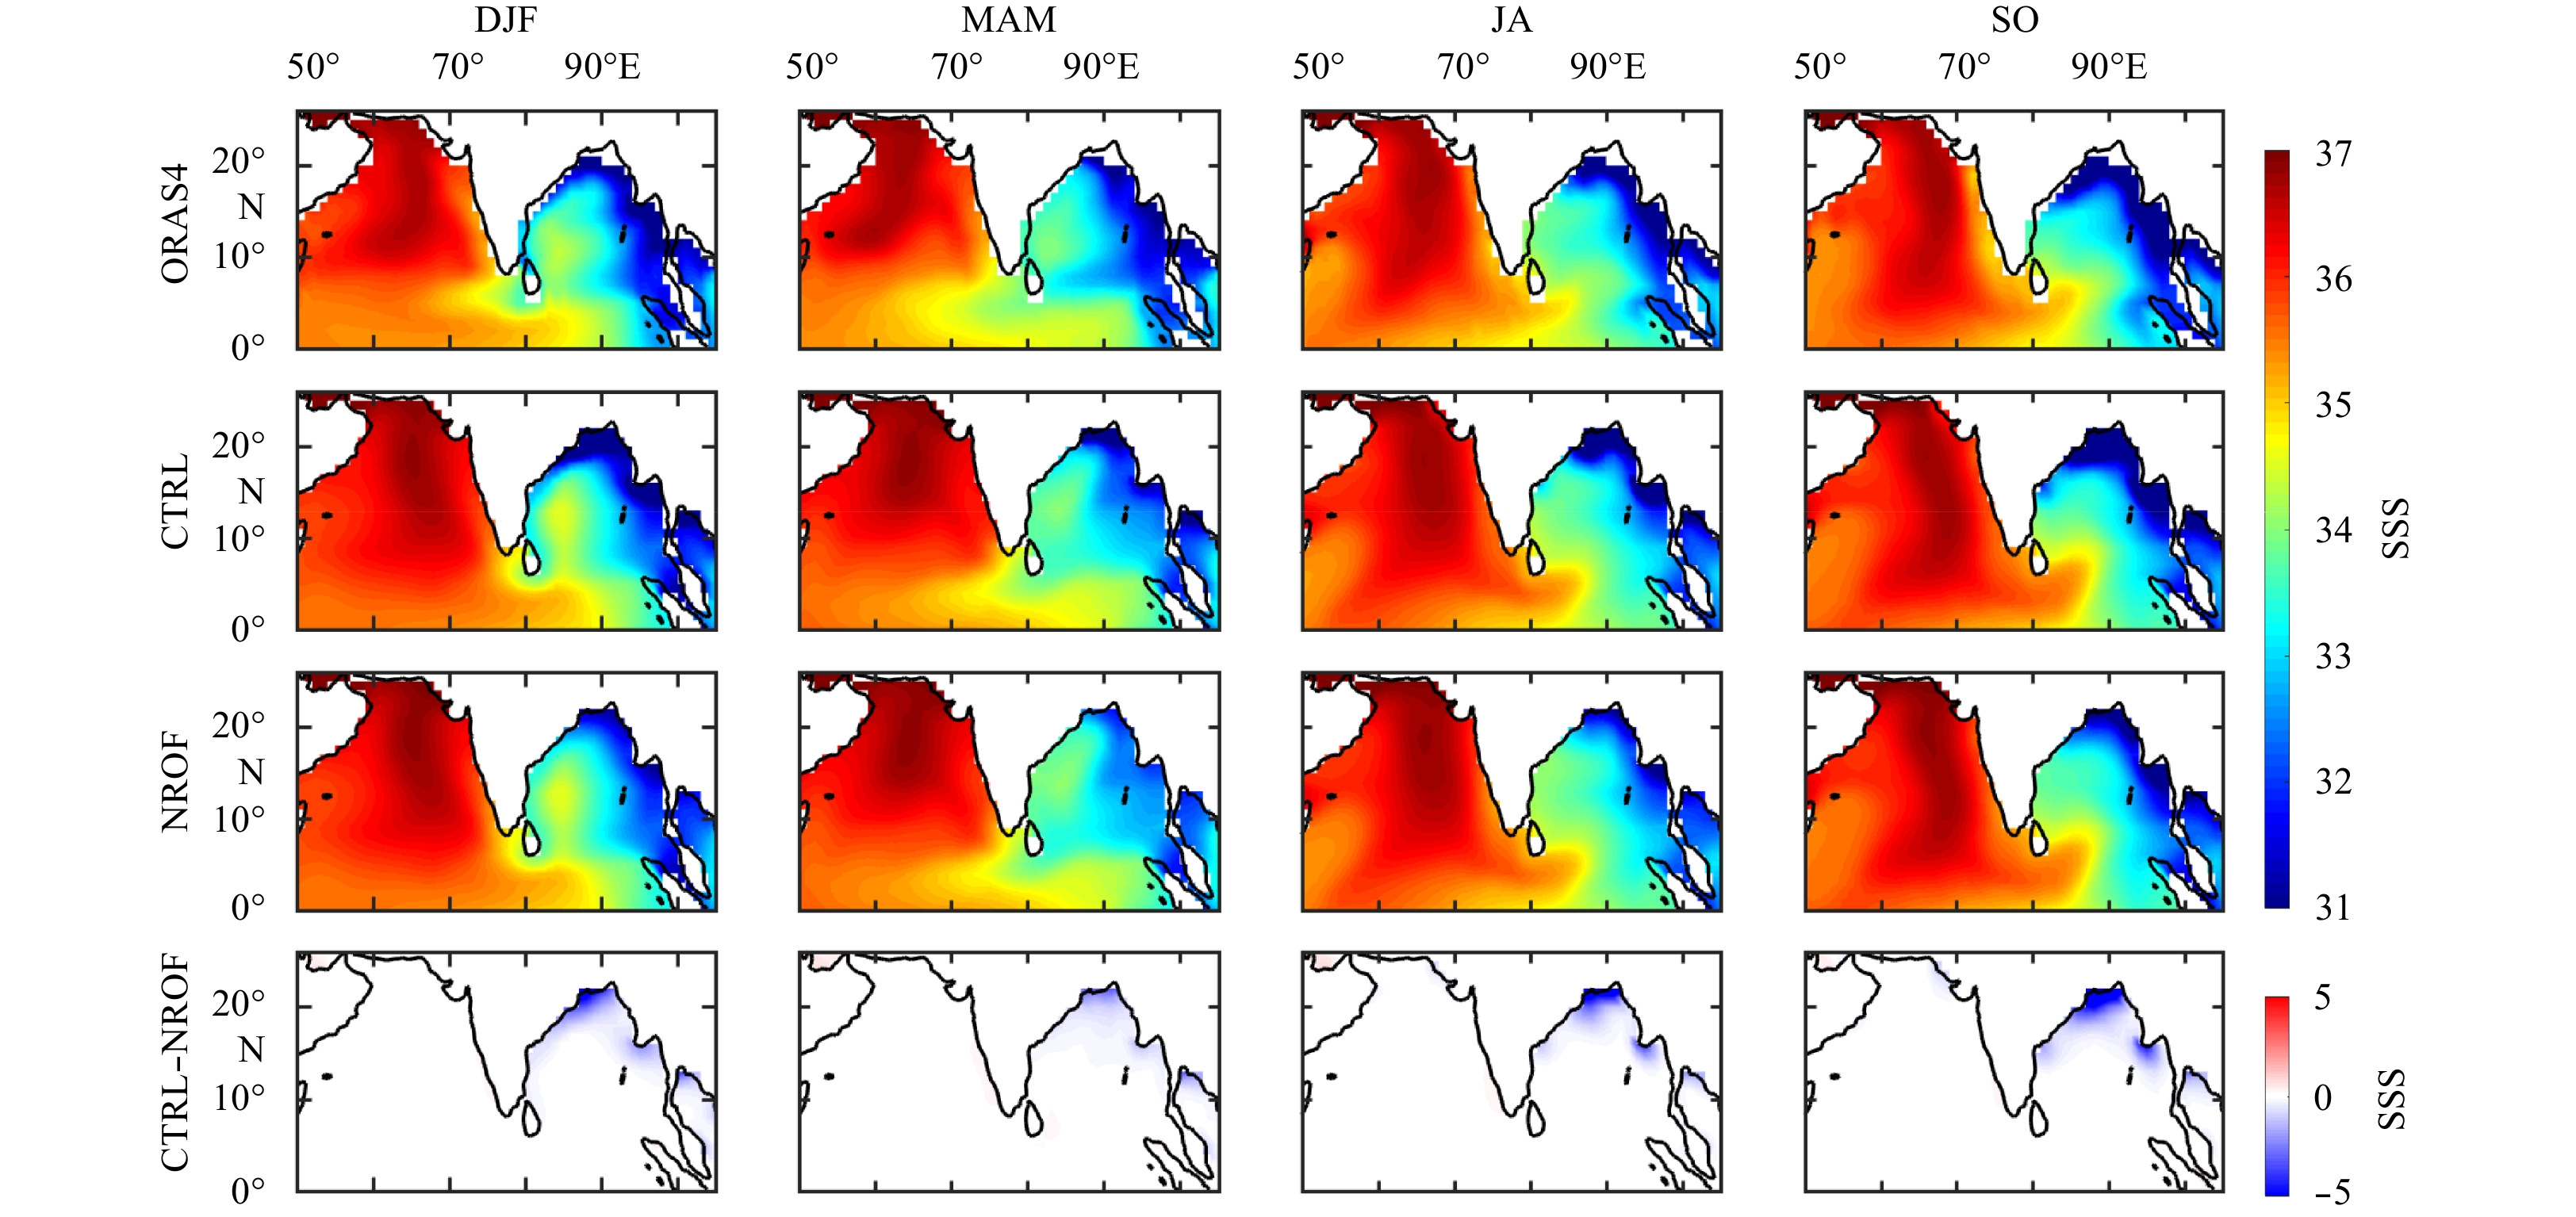
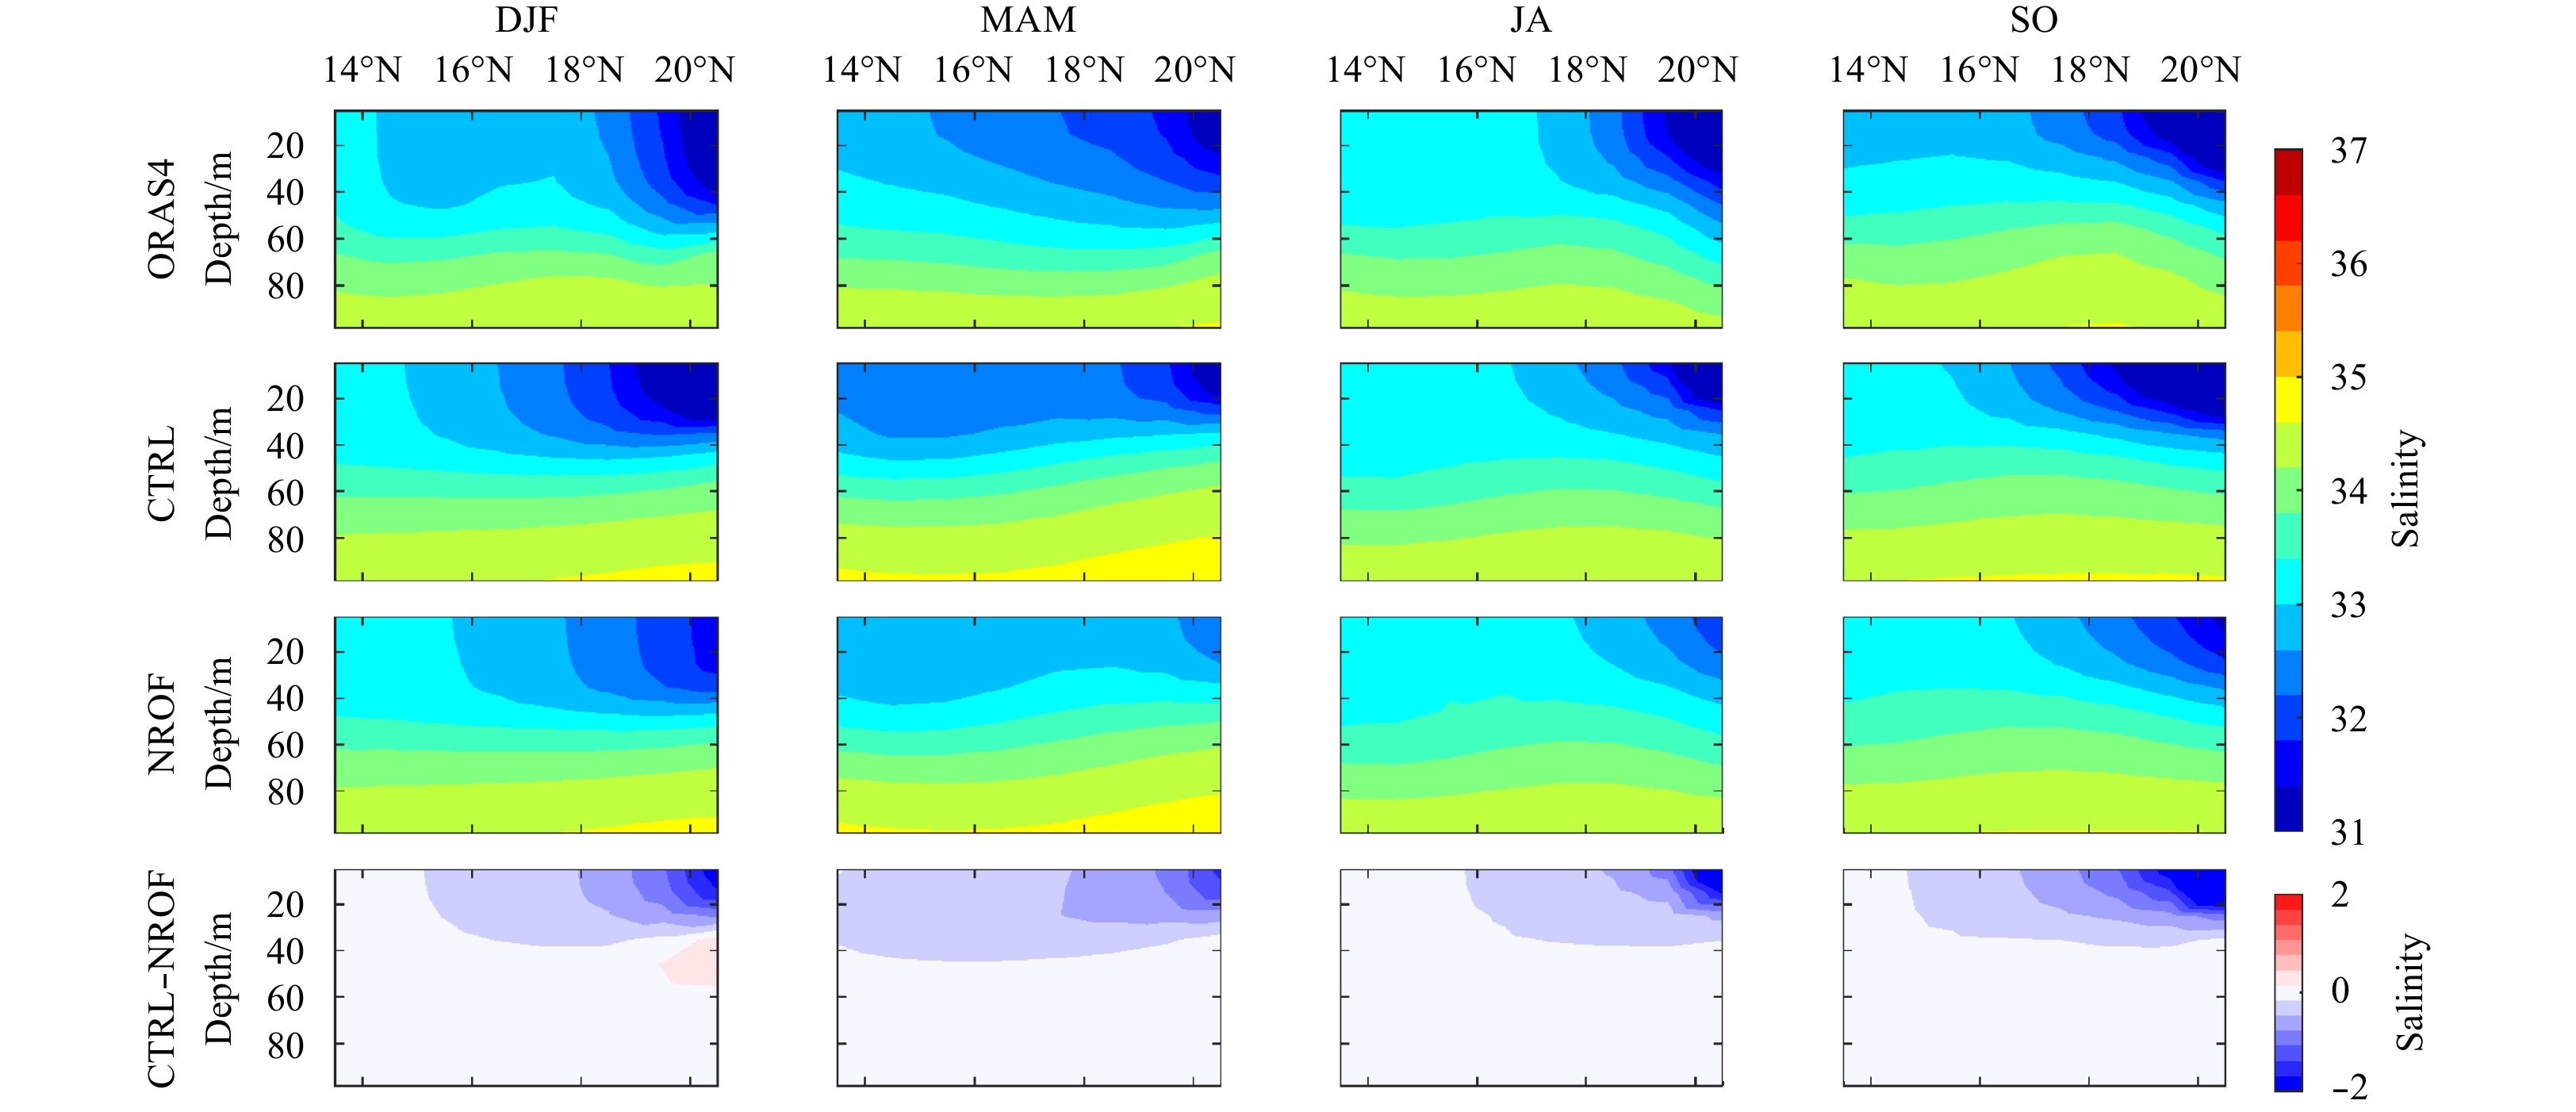
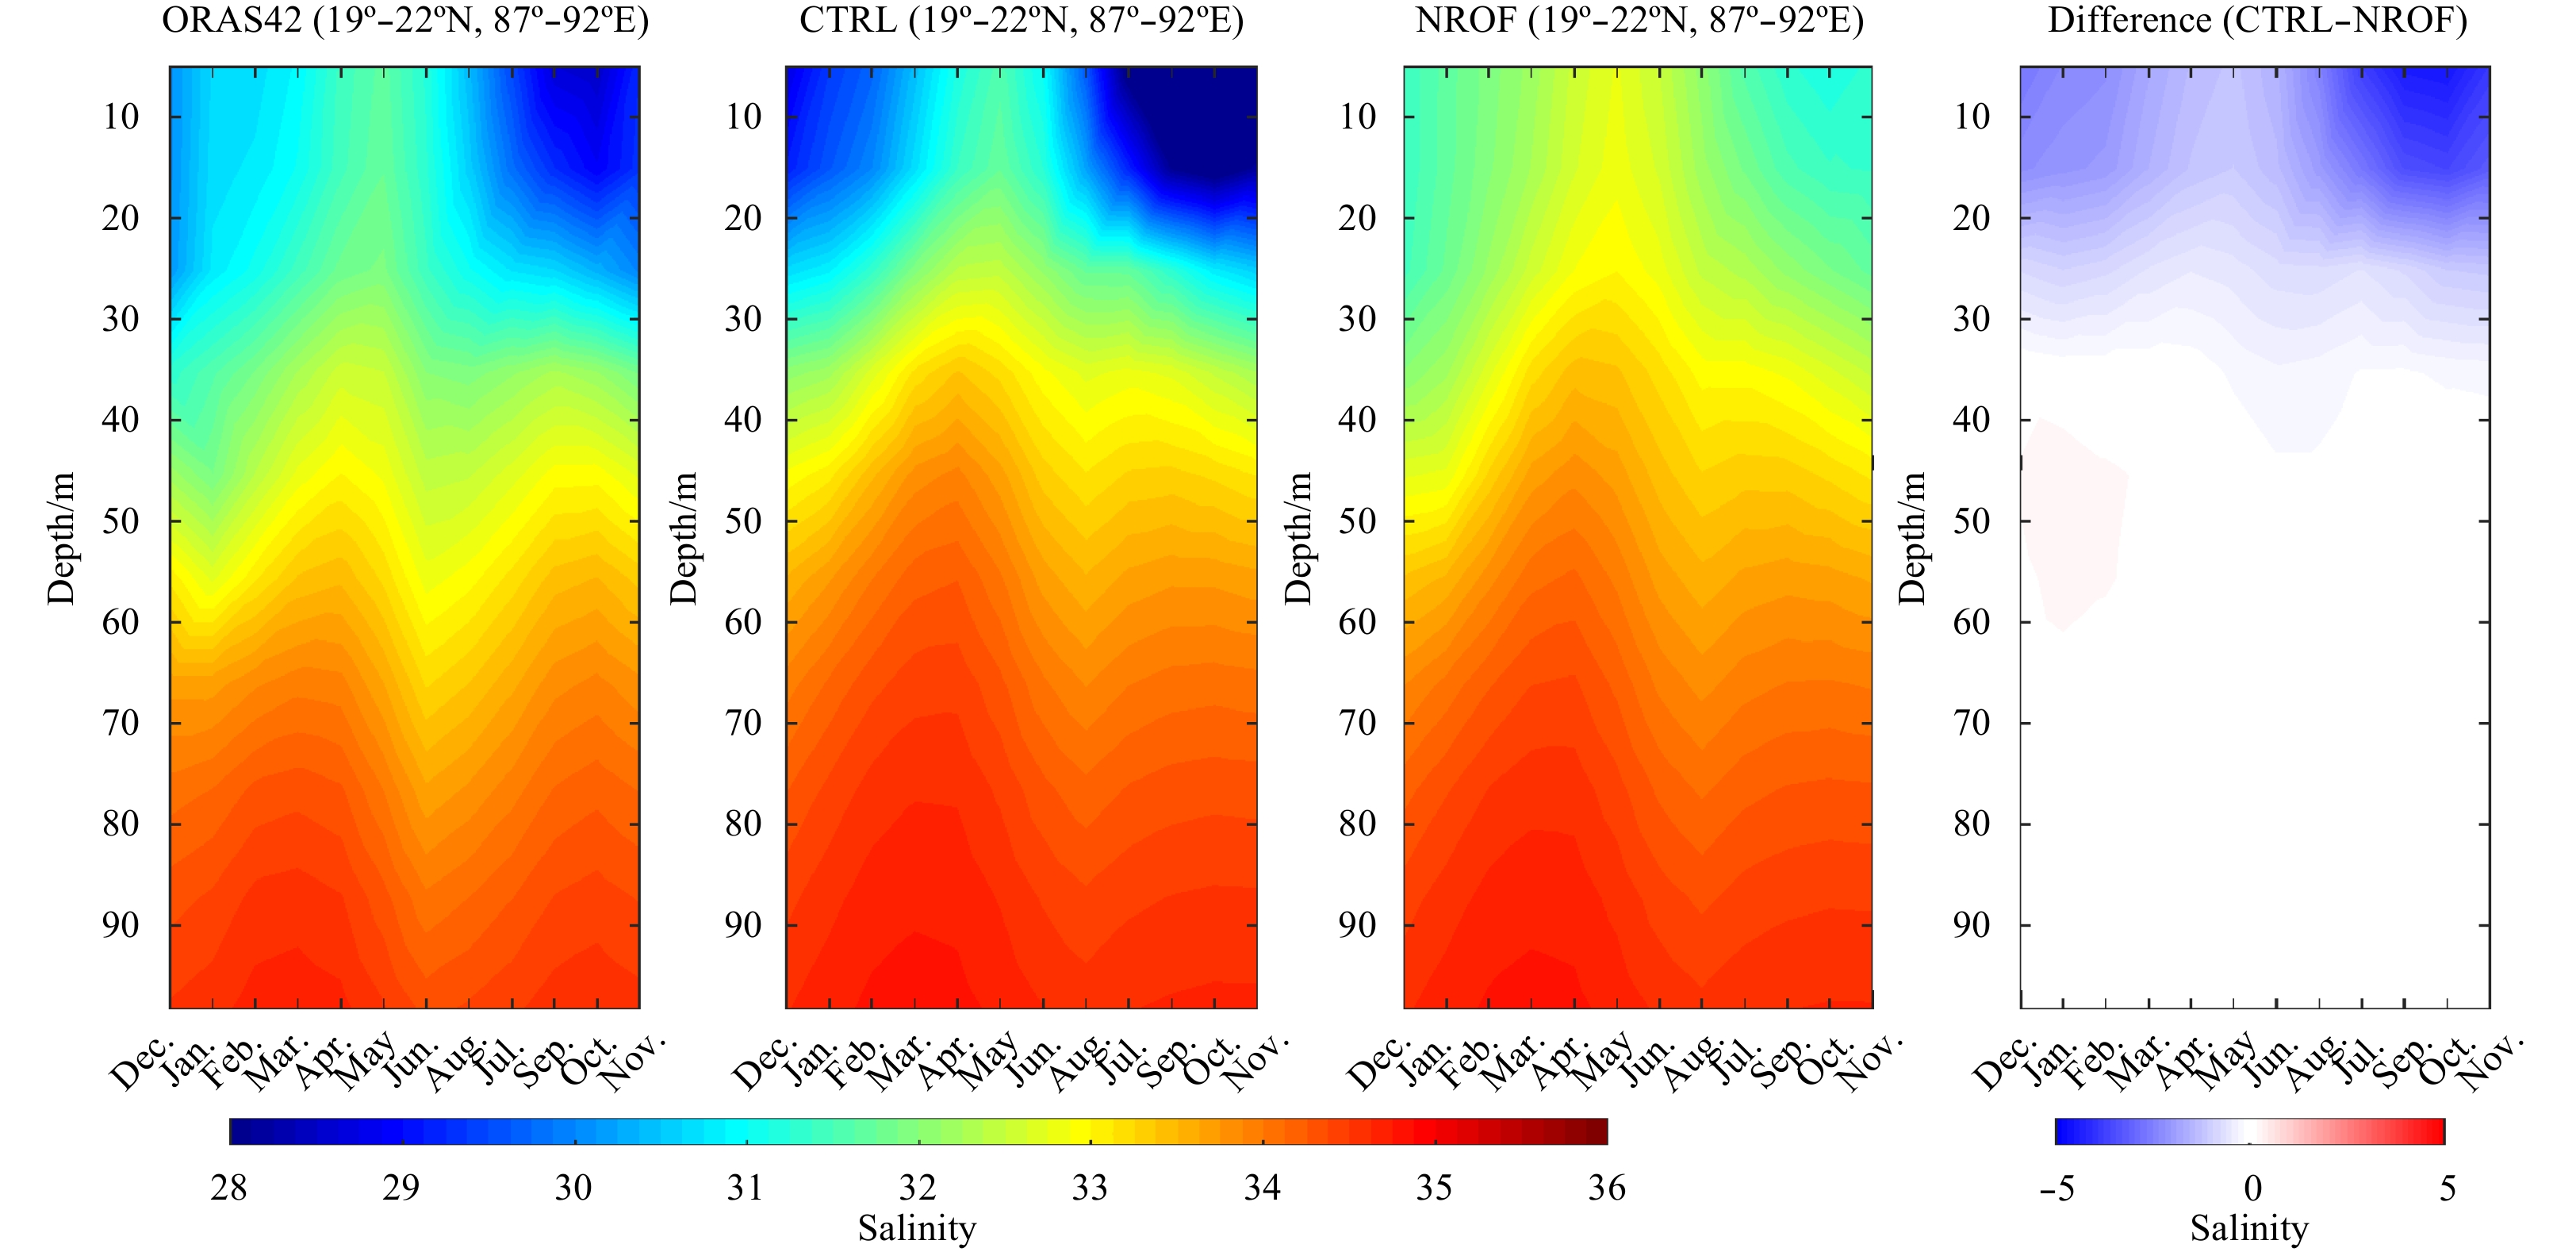
Stratification due to salinity in the BoB is important. It determines the depth of vertical mixing and helps keep SST high above the threshold value for strong convection (Sengupta et al., 2007, Neetu et al., 2012). This leads to the development of large number of low pressure systems and cyclones over the BoB in atmosphere (Gera et al., 2013). Figure 7 shows the seasonal variability of SSS in CTRL run (1st row) and NROF (3rd row). We observe that in the presence of river runoff, SSS decreases more than 5 in JA and SO seasons in the BoB. Therefore, river input has considerable impact on salinity and thermohaline structure of the BoB. Figure 7 (3rd column) shows that salinity is very low in post monsoon season when all river runoff reaches the ocean and makes a layer of freshwater in the BoB. After withdrawal of the south-west monsoon this freshening spreads along the coasts of BoB. The decrease in salinity can also be seen in the AS due to Narmada River. To see the effect of runoff with depth we plot the latitude depth plot of salinity at 90ºE (Fig. 8). Due to river runoff in the north of 18ºN CTRL run salinity decreases more than 5 in SO season. Moreover, the effect of runoff can be seen up to 30 m very clearly. In DJF and MAM salinity decreases but less as compared to SO season. To study the salinity pattern only over the northern area, we average the salinity over (19º–22ºN, 87º–92ºE) and find that more than 5 salinity decreases due to runoff in the top 30 m (Fig. 9). From this figure we can infer that in all seasons, salinity in CTRL run is lesser than that in NROF. Further, in DJF season river runoff decreases the salinity by more than (5) from surface to 30 m. During DJF mixing of sub-surface high saline water with surface water takes place. Freshwater decreases the salinity in the head BoB in all months but in the post monsoon season when river water spreads over the basin, its effects are high. In April, May and June an upwelling is observed in this region. This may be due to strong EICC current in BoB. The strong salinity stratification causes the shallow MLD and thick barrier layer. It is seen that the effect of river runoff is limited to upper 30 m of ocean. The fresher water leads to the shallower MLDs in all seasons except MAM (Fig. 10). Except in inter-monsoon periods, high winds over BoB cools the upper ocean. In these conditions, shallower upper layer could lead to enhanced surface cooling. This cooling during all seasons (except for the season MAM) can be seen in depth-time cross-section of temperature over the head BoB (Fig. 6).
Figure
7.
Seasonal Sea Surface salinity (SSS) over the Indian Ocean from ORAS4 (1st row), CTRL (2nd row), NROF (3rd row) and difference of CTRL and NROF experiments (4th row).
Figure
8.
Latitude-depth map of salinity at 90ºE from ORAS4 (1st row), CTRL (2nd row), NROF (3rd row) and difference of CTRL and NROF experiments (4th row).
Figure
9.
Time-depth plot of salinity average over the area(19º–22ºN, 87º–92ºE) from ORAS4 (1st column), CTRL (2nd column), NROF (3rd column) and difference of CTRL and NROF experiments (4th column).
Figure
10.
Seasonal MLD over the Indian Ocean from ORAS4 (1st row), CTRL (2nd row), NROF (3rd row) and difference of CTRL and NROF experiments (4th row).
To study the effect of runoff on MLD in the Indian Ocean, we computed the MLD using density criterion. The MLD is defined as the depth at which the density is greater than density at the surface by 0.125 kg/m3. The study of mixed layer depth (MLD) is very important over the Indian Ocean because it acts as a link between atmosphere and ocean and influences the ocean productivity and climate change (Thomson and Fine, 2003). Figure 10 shows that due to river runoff MLD decreases by more than 5 m in DJF especially over the northern and eastern BOB. Figure 11 shows the seasonal current pattern. In the entire coast of the Indian Ocean some impact due to coastal current can also be seen. We observed from figure that in BoB, the EICC is strengthened due to river runoff. This may due to changes in the pressure gradients occurring as a result of enhanced stratification due to this, considerable amount of water is transported from northern BoB to southern BoB. The circulation in BoB consists of an anticyclonic gyre in the monsoon season and cyclonic gyre in winter season near the western BOB. The intrusion of BoB freshwater from Srilanka to the southern part of India can be seen clearly in both the experiments. The current patterns are similar in both the experiments but the magnitudes are differing along the coast. Moreover, river runoff enhances the surface stratification, and also intensifies the wind roles in the current at surface layer (Gan et al., 2009; Shu et al., 2011, 2014). Due to geostrophic balance between river plume and underlying saline water, the surface current amplifies at the onshore side and decreases at offshore side.
Figure
11.
Seasonal variability of the surface currents over the Indian Ocean from OSCAR (1st row), CTRL (2nd row), NROF (3rd row) and difference of CTRL and OSCAR4 observation (4th row).
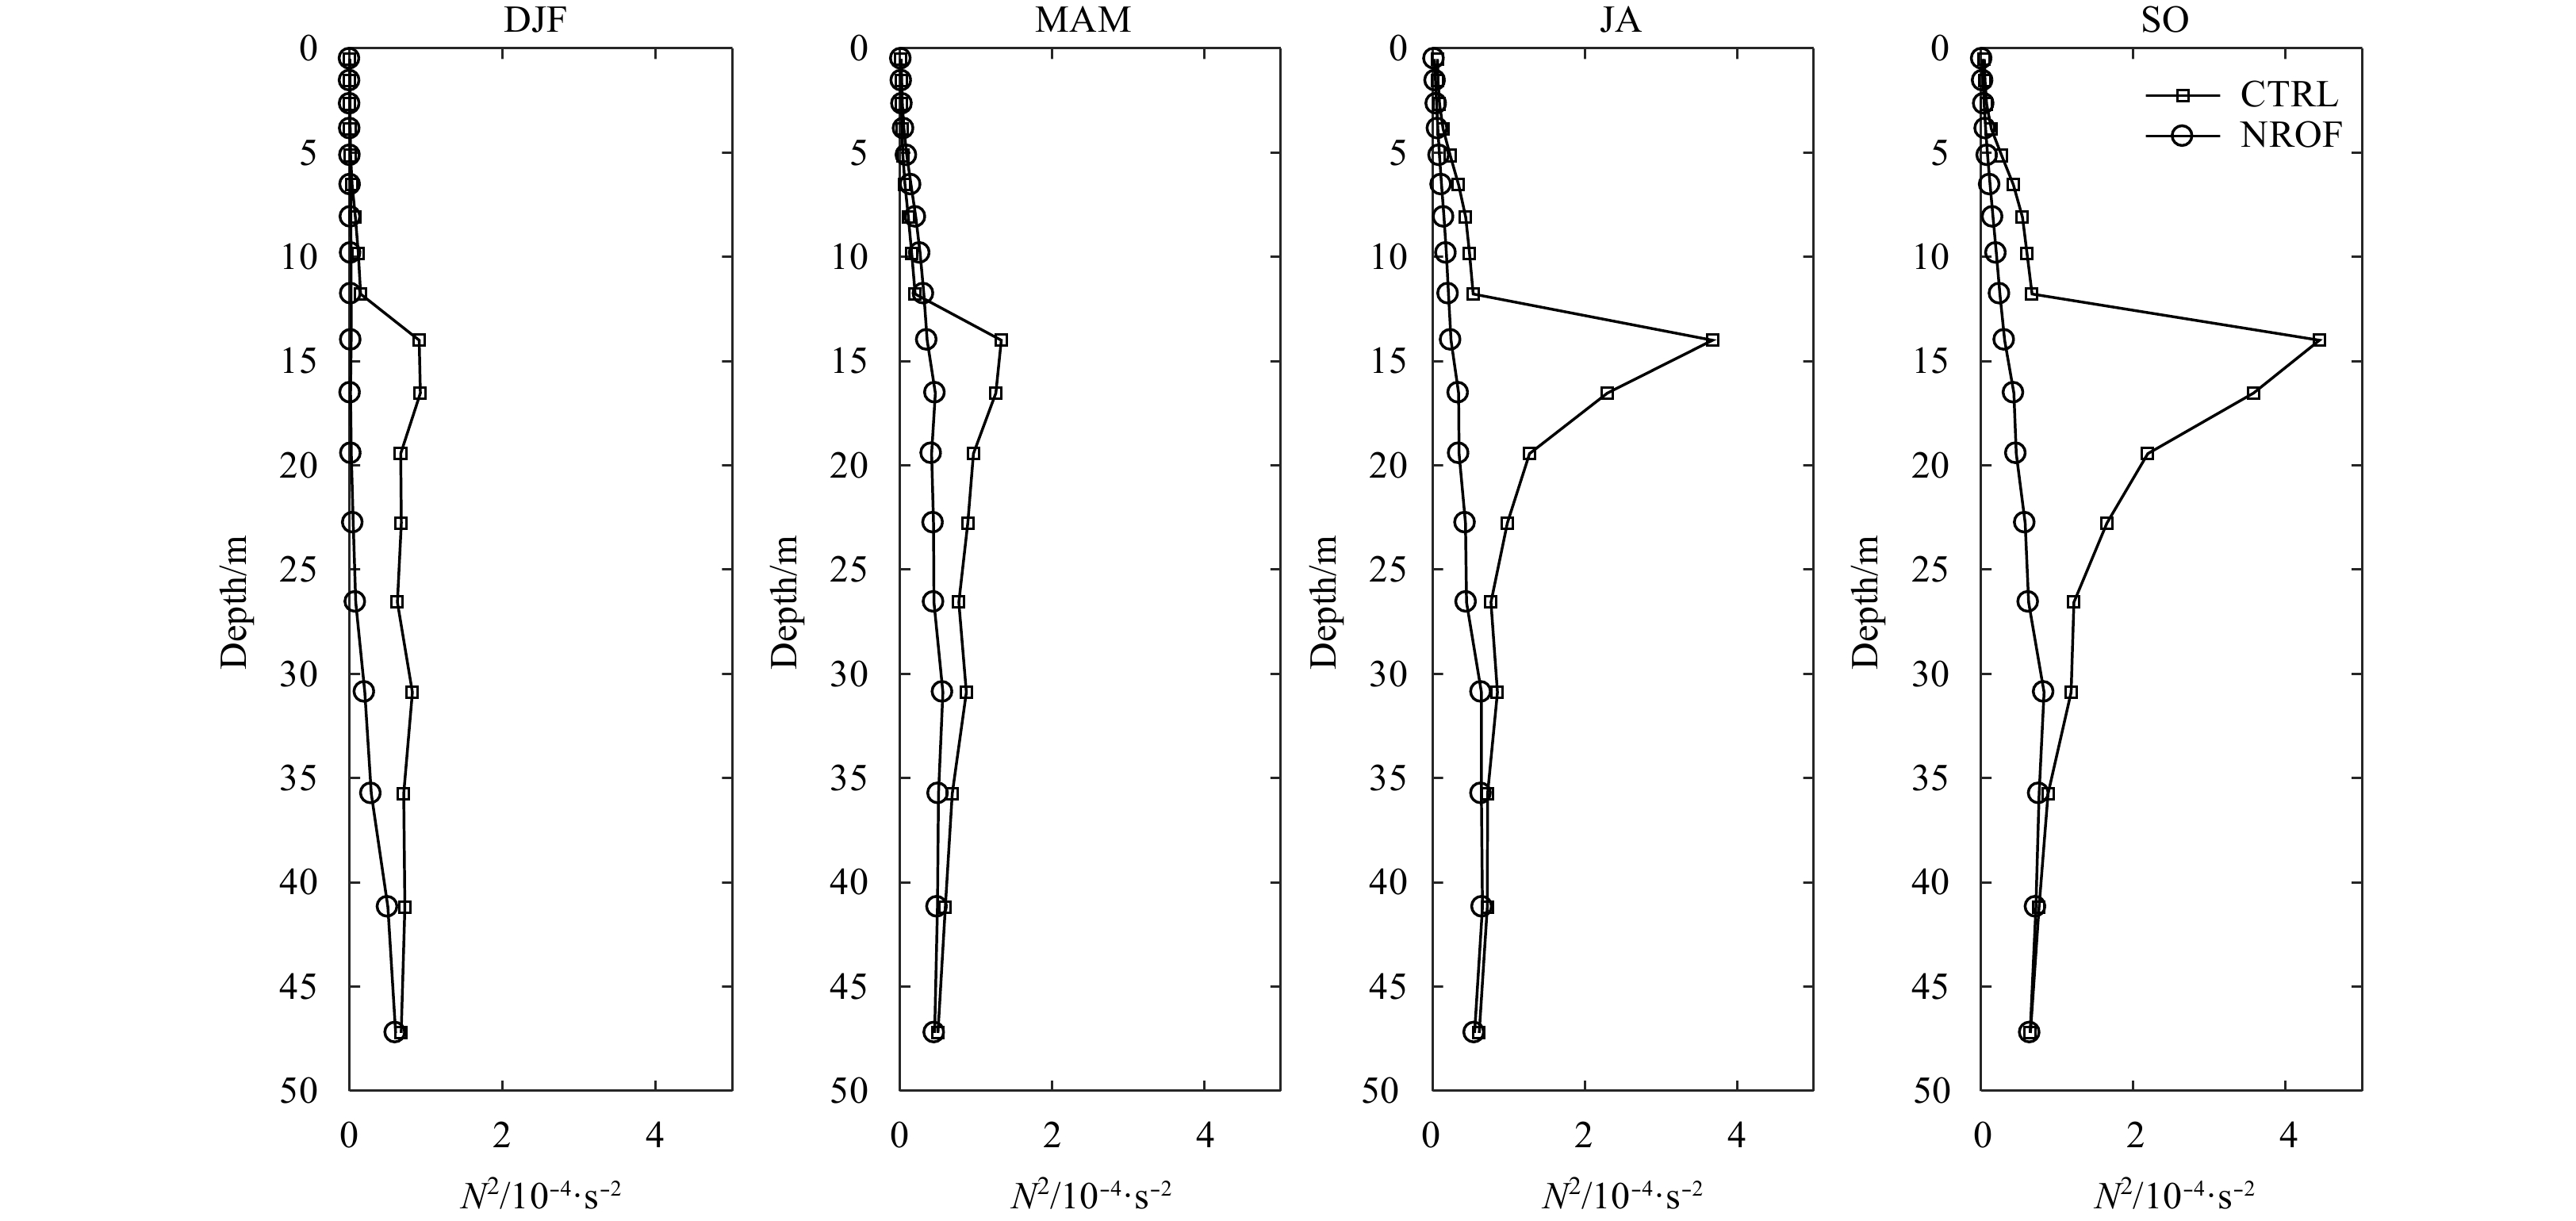
The stratification over the NIO plays an important role in mixing, upwelling and tropical cyclone. The stratification over the BoB is due to freshwater flux which modifies SSS and SST leading to change in oceanic vertical density. The vertical stratification in BoB is strongly influenced by vertical shear and Brunt Vaisala frequency. In order to study the individual effects over the stratification we compare S2 and N2, when S2 >N2 then instability and turbulence would occur because vertical shear is enough to start the vertical motion against the gravity and also start the mixing of the ocean water (Smyth and Moum, 2013). However, when N2 >S2 the ocean will be stratified and stable. The vertical density gradient in the BoB is responsible for stable and unstable column of the ocean. The value of N2 (∂ρ/∂z) is negative (positive) then the layer of the ocean is stable (unstable). While in the case of S2 an opposite occurs. We plot in Fig. 12, the seasonal averaged (19º–22ºN, 87º–92ºE) of N2 in the Bay of Bengal for both the experiments. We observe that the N2 values of CTRL and NROF experiments are similar in top 10 m in DJF season, while in MAM, JA and SO seasons the differences reach up to 5 m depth. In NROF experiment the vertical density gradients (ρ/∂z) in DJF season is very less and almost near to zero up to 25 m because the winds are calm. In MAM, JA and SO months the density gradient has some positive values. On the other hand in CTRL run the N2 values are increasing indicating that the water column is more stratified in the presence of the river runoff. We notice that in all the seasons N2 values are larger in CTRL than NROF experiment beyond some depth. The N2 values are higher in JA and SO seasons in NROF experiment. The change in density gradient in DJF and MAM months occur below the depth of 10 m, whereas in JA and SO it occurs after 5 m in both the experiments. Thus we can see that as the river water spreads in the BoB the stability increases. An interesting feature is that, in all seasons from both the experiments density gradient remains same after 35–40 m. This indicates that river water influences the stratification of BoB only up to 35–40 m.
Figure
12.
Brunt Vaisala frequency (N2) average over the area (19º–22ºN, 87º–92ºE) in the BoB. The results from the CTRL and NROF experiments are represented by the square, and circle respectively.
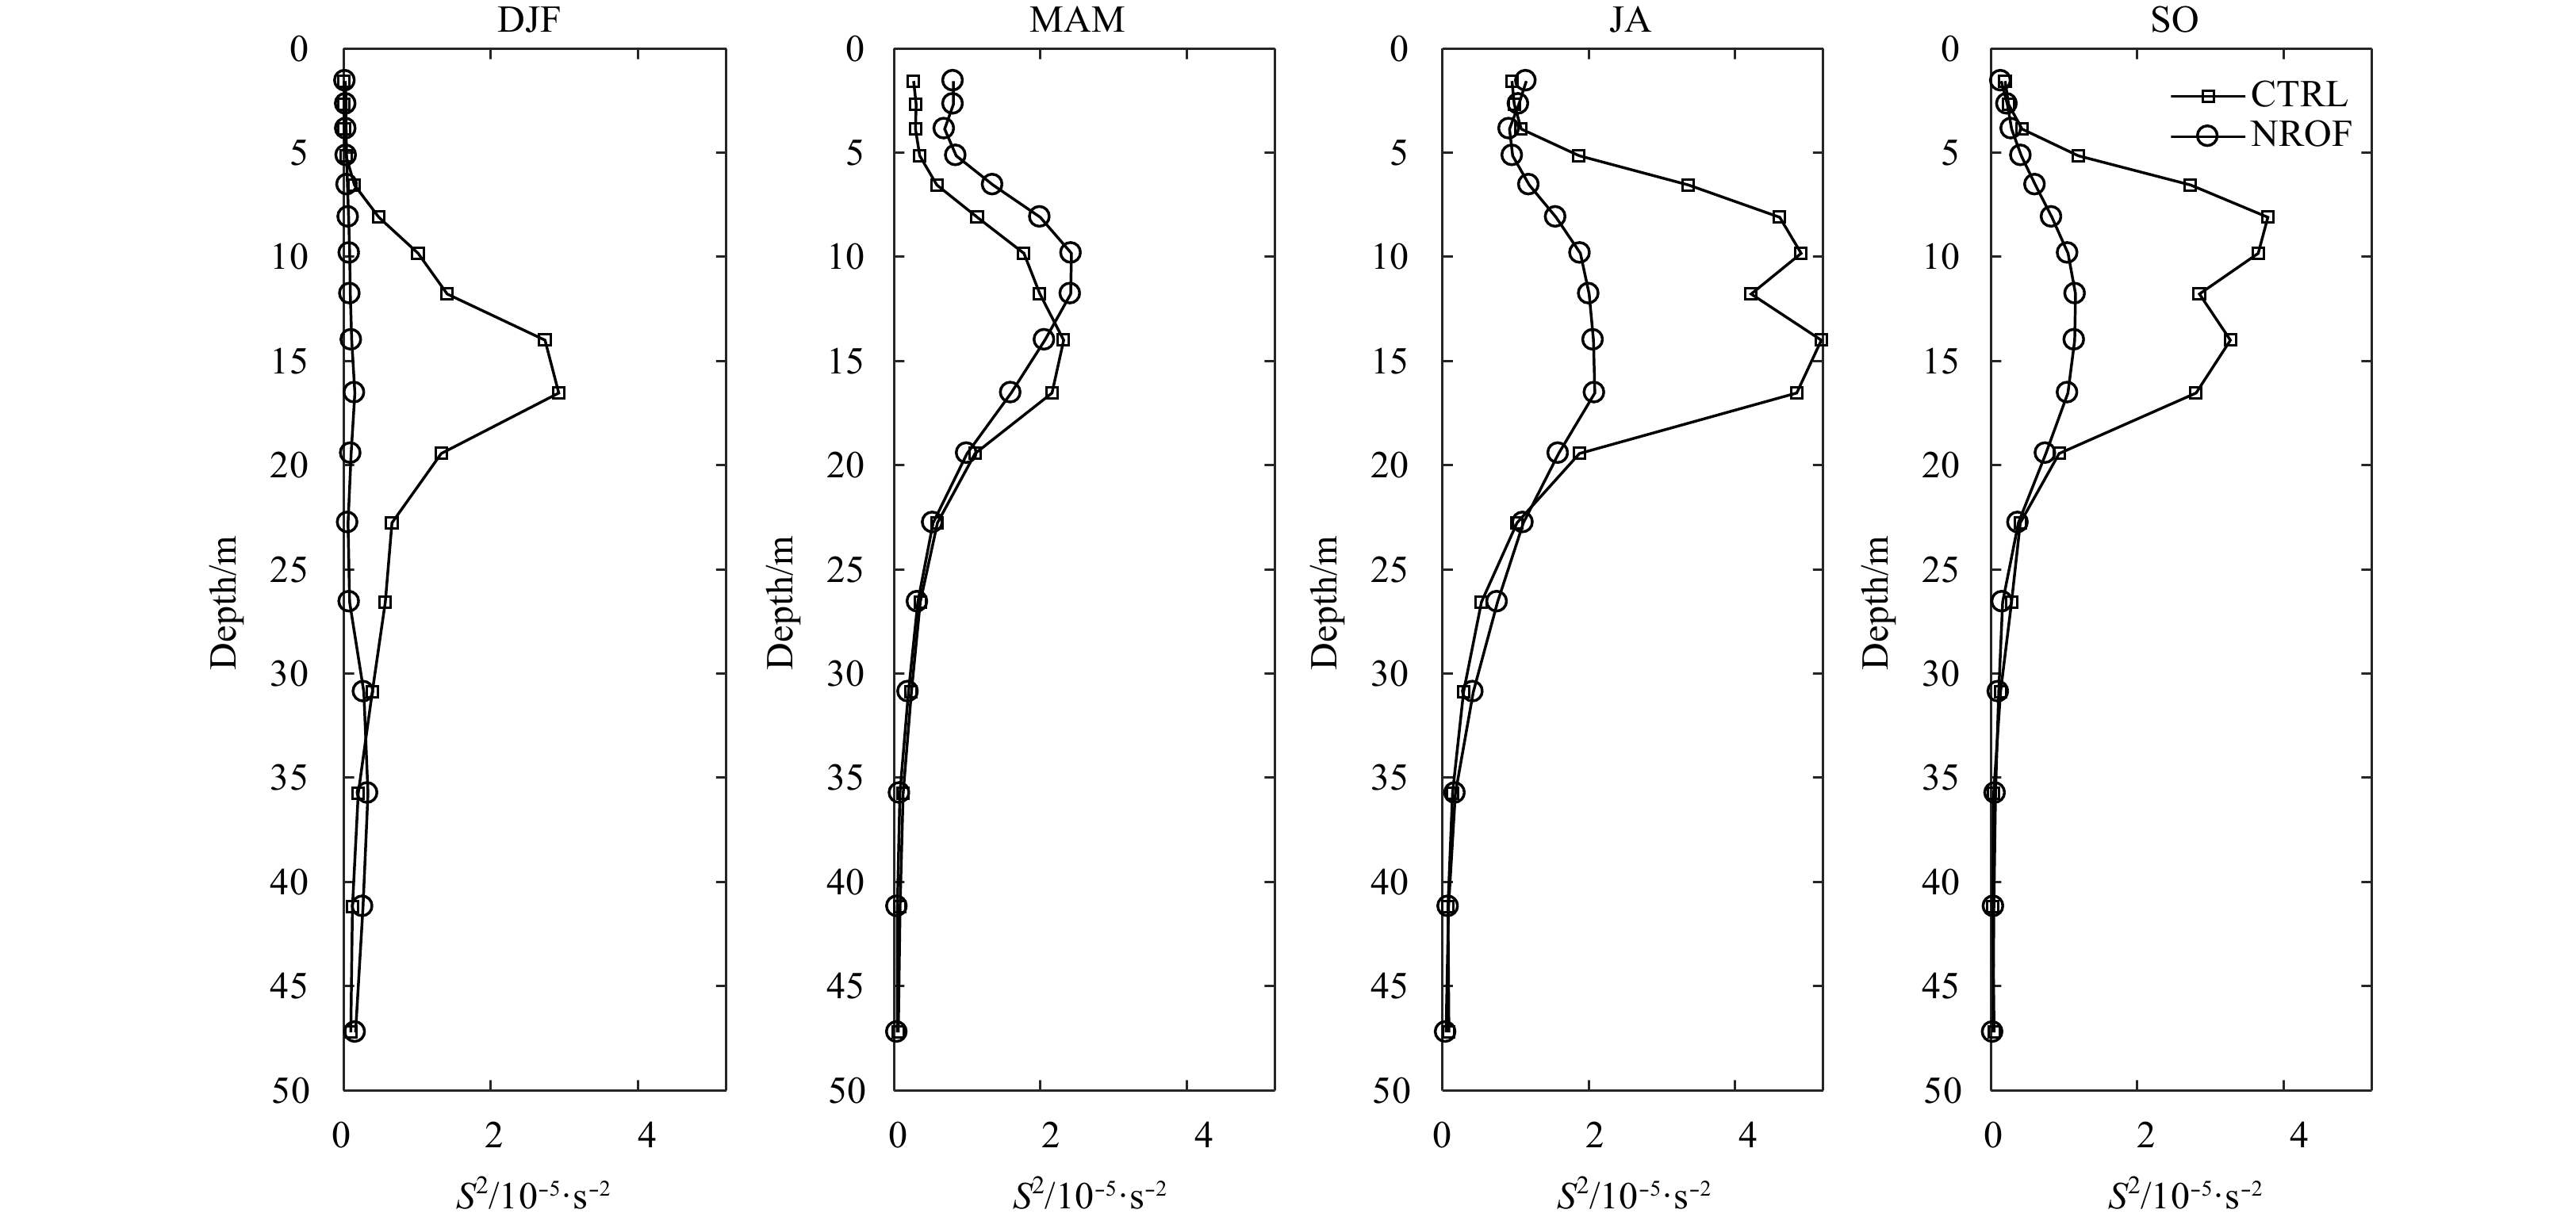
Similarly, in Fig. 13 the seasonal profile of S2 is shown for both experiments. We observe that the CTRL run (1st column) and NROF (3rd column) experiments are differing in all the seasons. Figure 13 suggests that due to river runoff vertical stability of the ocean is greater in all seasons than that without runoff. We also notice from the figure that values of S2 decrease after 20 m in both experiments for all season except DJF season. In the absence of river runoff, the zonal and meridional velocities will be larger and hence shear value is high in all seasons. The highest values of vertical current shear are observed during the monsoon (JA) season because of low stability in that season. Figure 13 also shows that that the vertical shear in the NROF is higher compared to CTRL in all the seasons. This may be due to stronger surface currents and higher vertical velocity gradients in the NROF as than in CTRL experiment.
Figure
13.
Vertical shear of the horizontal current (S2) average over the area (19º–22ºN, 87º–92ºE) in the BoB. The results from the CTRL and NROF experiments are represented by the square, and circle respectively.
The spatial map of the seasonal variability of the ERM over the study area is shown in Fig. 14 for CTRL run and NROF experiments. Due to low salinity of the surface waters in the BoB, the mean ERM in the BoB is generally greater than that in the AS, except during summer season (MAM). In the absence of river runoff, the ERM decreases as a result reduced stratification. Along the BoB coast, the ERM is seen to be larger in CTRL than in NROF. The NROF experiment has small effect on ERM over the AS and southern part of the BoB region.
Figure
14.
Maps of Energy Required for Mixing (ERM) over the Indian Ocean from ORAS4 (1st row), CTRL (2nd row), NROF (3rd row) and difference of CTRL and NROF experiments (4th row).
We analysed the seasonal climatological features of impact of river runoff in NIO especially over BoB using with high vertical resolution of 75 layers. We found that due to river runoff, salinity in northern BoB reduced upto 6 in SO season. Due to river runoff, the stratification peaks in JA and SO season. This is reflected as a peak in Brunt Vaisala frequency around 15 m depth. Due to river runoff, the seasonal MLD decreased up to 15 m and SST increased by 0.2ºC in SO season over northern BoB. We found that the EICC strengthened from 2 to 3 cm/s in SO season over coastal BoB due to river runoff and carried freshwater from northern part BoB to southern part of BoB. Fresh water from head BoB is carried by strengthened EICC in CTRL. Vertical shear is found to peak in JA and SO season. The change in shear, likely results in higher MLD in SO season along the east coast, despite high ERM. It is concluded that river runoff plays an important role in maintaining stratification by controlling the buoyancy frequency in the upper ocean especially over BoB. The maximum influence of vertical shear and Brunt Vaisala frequency over stratification is seen in the upper 35 m of ocean.
Acknowledgments
This study was done under MOES-NERC BoBBLE project. We also thank NCEP/NCAR, CORE 2, OSCAR and other data centres for providing reanalysis and observations data publicly for research purpose. OSCAR is generated by Earth Space Research (ESR) https://www.esr.org/research/oscar. We also express our thanks to Head NCMRWF for encouraging this study. We also thank the NEMO consortium for making the NEMO model code available.
Akhil V P, Durand F, Lengaigne M, et al. 2014. A modeling study of the processes of surface salinity seasonal cycle in the Bay of Bengal. Journal of Geophysical Research: Oceans, 119(6): 3926–3947. doi: 10.1002/2013JC009632
[2]
Anitha G, Ravichandran M, Sayanna R. 2008. Surface buoyancy flux in Bay of Bengal and Arabian Sea. Annales Geophysicae, 26(3): 395–400. doi: 10.5194/angeo-26-395-2008
[3]
Balmaseda M A, Mogensen K, Weaver A T. 2013. Evaluation of the ECMWF ocean reanalysis system ORAS4. Quarterly Journal of the Royal Meteorological Society, 139(674): 1132–1161. doi: 10.1002/qj.2063
[4]
Behara A, Vinayachandran P N. 2016. An OGCM study of the impact of rain and river water forcing on the Bay of Bengal. Journal of Geophysical Research: Oceans, 121(4): 2425–2446. doi: 10.1002/2015JC011325
[5]
Bonjean F, Lagerloef G S E. 2002. Diagnostic model and analysis of the surface currents in the tropical Pacific Ocean. Journal of Physical Oceanography, 32(10): 2938–2954. doi: 10.1175/1520-0485(2002)032<2938:DMAAOT>2.0.CO;2
[6]
Callaghan A H, Ward B, Vialard J. 2014. Influence of surface forcing on near-surface and mixing layer turbulence in the tropical Indian Ocean. Deep Sea Research Part I: Oceanographic Research Papers, 94: 107–123. doi: 10.1016/j.dsr.2014.08.009
[7]
Chamarthi S P, Ram P S, Josyula L. 2008. Effect of river discharge on Bay of Bengal circulation. Marine Geodesy, 31(3): 160–168. doi: 10.1080/01490410802265476
[8]
Chowdary J S, Srinivas G, Fousiya T S, et al. 2016. Representation of Bay of Bengal upper-ocean salinity in general circulation models. Oceanography, 29(2): 38–49. doi: 10.5670/oceanog.2016.37
[9]
Da-Allada C Y, Gaillard F, Kolodziejczyk N. 2015. Mixed-layer salinity budget in the tropical Indian Ocean: seasonal cycle based only on observations. Ocean Dynamics, 65(6): 845–857. doi: 10.1007/s10236-015-0837-7
[10]
Dai Aiguo, Qian Taotao, Trenberth K E, et al. 2009. Changes in continental freshwater discharge from 1948 to 2004. Journal of Climate, 22(10): 2773–2792. doi: 10.1175/2008JCLI2592.1
[11]
de Boyer Montégut C, Mignot J, Lazar A, et al. 2007. Control of salinity on the mixed layer depth in the world ocean: 1. General description. Journal of Geophysical Research: Oceans, 112(C6): C06011
[12]
Durand F, Papa F, Rahman A, et al. 2011. Impact of Ganges-Brahmaputra interannual discharge variations on Bay of Bengal salinity and temperature during 1992–1999 period. Journal of Earth System Science, 120(5): 859–872. doi: 10.1007/s12040-011-0118-x
[13]
Gan Jianping, Li Li, Wang Dongxia, et al. 2009. Interaction of a river plume with coastal upwelling in the northeastern South China Sea. Continental Shelf Research, 29(4): 728–740. doi: 10.1016/j.csr.2008.12.002
[14]
Gaspar P, Grégoris Y, Lefevre J M. 1990. A simple eddy kinetic energy model for simulations of the oceanic vertical mixing: Tests at station Papa and Long-Term Upper Ocean Study site. Journal of Geophysical Research: Oceans, 95(C9): 16179–16193. doi: 10.1029/JC095iC09p16179
[15]
Gera A, Mitra A K, Mahapatra D K, et al. 2013. Sea surface height and upper ocean heat content variability in Bay of Bengal during contrasting Monsoons 2009 and 2010. NCMRWF research report, NMRF/RR/OCN-1/2013, 1–27
[16]
Gopalakrishna V V, Johnson Z, Salgaonkar G, et al. 2005. Observed variability of sea surface salinity and thermal inversions in the Lakshadweep Sea during contrast monsoons. Geophysical Research Letters, 32(18): L18605
[17]
Gordon A L, Susanto R D, Vranes K. 2003. Cool Indonesian throughflow as a consequence of restricted surface layer flow. Nature, 425(6960): 824–828. doi: 10.1038/nature02038
[18]
Halkides D J, Waliser D E, Lee T, et al. 2015. Quantifying the processes controlling intraseasonal mixed-layer temperature variability in the tropical Indian Ocean. Journal of Geophysical Research: Oceans, 120(2): 692–715. doi: 10.1002/2014JC010139
[19]
Harenduprakash L, Mitra A K. 1988. Vertical turbulent mass flux below the sea surface and air-sea interaction-monsoon region of the Indian Ocean. Deep Sea Research Part A. Oceanographic Research Papers, 35(3): 333–346. doi: 10.1016/0198-0149(88)90014-3
[20]
Howden S D, Murtugudde R. 2001. Effects of river inputs into the Bay of Bengal. Journal of Geophysical Research: Oceans, 106(C9): 19825–19843. doi: 10.1029/2000JC000656
[21]
Jana S, Gangopadhyay A, Chakraborty A. 2015. Impact of seasonal river input on the Bay of Bengal simulation. Continental Shelf Research, 104: 45–62. doi: 10.1016/j.csr.2015.05.001
[22]
Jensen T G. 2001. Arabian Sea and Bay of Bengal exchange of salt and tracers in an ocean model. Geophysical Research Letters, 28(20): 3967–3970. doi: 10.1029/2001GL013422
[23]
Large W G, Yeager S G. 2009. The global climatology of an interannually varying air–sea flux data set. Climate Dynamics, 33(2–3): 341–364
[24]
Madec G. 2012. NEMO-Team. Note du Pôle de modélisation, Institut Pierre-Simon Laplace (IPSL), France. NEMO ocean engine, 27
[25]
Mahapatra D K, Rao A D. 2017. Redistribution of low-salinity pools off east coast of India during southwest monsoon season. Estuarine, Coastal and Shelf Science, 184: 21–29. doi: 10.1016/j.ecss.2016.10.037
[26]
Momin I M, Mitra A K, Mahapatra D K, et al. 2013. Indian Ocean simulation results from NEMO global ocean model. Indian Journal of Geo-Marine Sciences, 42(4): 425–430
[27]
Momin I M, Mitra A K, Mahapatra D K, et al. 2014. Impact of model resolutions on Indian Ocean simulations from Global NEMO Ocean Model. Indian Journal of Geo-Marine Sciences, 43(9): 1667–1674
[28]
Neetu S, Lengaigne M, Vincent E M, et al. 2012. Influence of upper-ocean stratification on tropical cyclone-induced surface cooling in the Bay of Bengal. Journal of Geophysical Research: Oceans, 117(C12): C12020
[29]
Perigaud C, McCreary J P Jr, Zhang K Q. 2003. Impact of interannual rainfall anomalies on Indian Ocean salinity and temperature variability. Journal of Geophysical Research: Oceans, 108(C10): 3319. doi: 10.1029/2002JC001699
[30]
Prasad T G. 1997. Annual and seasonal mean buoyancy fluxes for the tropical Indian Ocean. Current Science, 73(8): 667–674
[31]
Prasanna K S, Narvekar J, Kumar A, et al. 2004. Intrusion of the Bay of Bengal water into the Arabian Sea during winter monsoon and associated chemical and biological response. Geophysical Research Letters, 31(15): L15304. doi: 10.1029/2004GL020247
[32]
Rao R R, Sivakumar R. 1999. On the possible mechanisms of the evolution of a mini-warm pool during the pre-summer monsoon season and the genesis of onset vortex in the South-Eastern Arabian Sea. Quarterly Journal of the Royal Meteorological Society, 125(555): 787–809. doi: 10.1002/qj.49712555503
[33]
Rao R R, Sivakumar R. 2003. Seasonal variability of sea surface salinity and salt budget of the mixed layer of the north Indian Ocean. Journal of Geophysical Research: Oceans, 108(C1): 9-1–9-14
[34]
Sengupta D, Ravichandran M. 2001. Oscillations of Bay of Bengal Sea surface temperature during the 1998 summer monsoon. Geophysical Research Letters, 28(10): 2033–2036. doi: 10.1029/2000GL012548
[35]
Sengupta D, Ray P K, Bhat G S. 2002. Spring warming of the eastern Arabian Sea and Bay of Bengal from buoy data. Geophysical Research Letters, 29(15): 24-1–24-4. doi: 10.1029/2002GL015340
[36]
Sengupta D, Bharath Raj G N, Shenoi S S C. 2006. Surface freshwater from Bay of Bengal runoff and Indonesian throughflow in the tropical Indian Ocean. Geophysical Research Letters, 33(22): L22609. doi: 10.1029/2006GL027573
[37]
Sengupta D, Senan R, Goswami B N, et al. 2007. Intraseasonal variability of equatorial Indian Ocean zonal currents. Journal of Climate, 20(13): 3036–3055. doi: 10.1175/JCLI4166.1
[38]
Shenoi S S C, Shankar D, Shetye S R. 2002. Differences in heat budgets of the near-surface Arabian Sea and Bay of Bengal: Implications for the summer monsoon. Journal of Geophysical Research: Oceans, 107(C6): 5-1–5-14
[39]
Shetye S R, Gouveia A D, Shankar D, et al. 1996. Hydrography and circulation in the western Bay of Bengal during the northeast monsoon. Journal of Geophysical Research: Oceans, 101(C6): 14011–14025. doi: 10.1029/95JC03307
[40]
Shu Yeqiang, Wang Dongxiao, Zhu Jiang, et al. 2011. The 4-D structure of upwelling and Pearl River plume in the northern South China Sea during summer 2008 revealed by a data assimilation model. Ocean Modeling, 36(3–4)): 228–241
[41]
Shu Yeqiang, Chen Ju, Yao Jinglong, et al. 2014. Effects of the Pearl River plume on the vertical structure of coastal currents in the northern South China Sea during summer 2008. Ocean Dynamics, 64: 1743–1752. doi: 10.1007/s10236-014-0779-5
[42]
Smyth W D, Moum J N. 2013. Marginal instability and deep cycle turbulence in the eastern equatorial Pacific Ocean. Geophysical Research Letters, 40(23): 6181–6185. doi: 10.1002/2013GL058403
[43]
Srivastava A, Dwivedi S, Mishra A K. 2018. Investigating the role of air-sea forcing on the variability of hydrography, circulation, and mixed layer depth in the Arabian Sea and Bay of Bengal. Oceanologia, 60(2): 169–186. doi: 10.1016/j.oceano.2017.10.001
[44]
Thomson R E, Fine I V. 2003. Estimating mixed layer depth from oceanic profile data. Journal of Atmospheric and Oceanic Technology, 20(2): 319–329. doi: 10.1175/1520-0426(2003)020<0319:EMLDFO>2.0.CO;2
[45]
Varkey M J, Murty V S N, Suryanarayana A. 1996. Physical oceanography of the Bay of Bengal and Andaman Sea. Oceanography and Marine Biology: An Annual Review, 34: 1–70
[46]
Vinayachandran P N, Iizuka S, Yamagata T. 2002. Indian Ocean dipole mode events in an ocean general circulation model. Deep Sea Research Part II: Topical Studies in Oceanography, 49(7–8): 1573–1596
[47]
Vinayachandran P N, Jahfer S, Nanjundiah R S. 2015. Impact of river runoff into the ocean on Indian summer monsoon. Environmental Research Letters, 10(5): 054008. doi: 10.1088/1748-9326/10/5/054008
[48]
Weller R A, Fischer A S, Rudnick D L, et al. 2002. Moored observations of upper-ocean response to the monsoons in the Arabian Sea during 1994–1995. Deep Sea Research Part II: Topical Studies in Oceanography, 49(12): 2195–2230. doi: 10.1016/S0967-0645(02)00035-8
[49]
Zweng M M, Reagan J R, Antonov J I, et al. 2013. World ocean atlas 2013. Volume 2: Salinity. Silver Spring, MD
Figure 1. Bathymetry (shaded) of the study area. Black boxes represent the river discharge locations from the rivers in the NIO(a), Monthly plot of river runoff (mm/d) and freshwater flux (mm/d) in the AS (0º–26ºN, 50º–80ºE) and BoB (0º–22ºN, 80º–95ºE) (b).
Figure 2. Latitude-depth map of temperature (ºC) at 90ºE from ORAS4 (1st row), CTRL (2nd row) NROF (3rd row), difference of CTRL and ORAS4 observation (4th row).
Figure 3. Latitude-depth map of salinity at 90ºE from ORAS4 (1st row), CTRL (2nd row) NROF (3rd row), difference of CTRL and ORAS4 observation (4th row).
Figure 4. Seasonal Sea Surface Temperature (SST) over the Indian Ocean from ORAS4 (1st row), CTRL (2nd row), NROF (3rd row) and difference of CTRL and NROF experiments (4th row).
Figure 5. Latitude-depth plot of temperature at 90ºE from ORAS4 (1st row), CTRL (2nd row), NROF (3rd row) and difference of CTRL and NROF experiments (4th row).
Figure 6. Time-depth plots of temperature average over the area(19º–22ºN, 87º–92ºE) from ORAS4 (1st column), CTRL (2nd column), NROF (3rd column) and difference of CTRL and NROF experiments (4th column).
Figure 7. Seasonal Sea Surface salinity (SSS) over the Indian Ocean from ORAS4 (1st row), CTRL (2nd row), NROF (3rd row) and difference of CTRL and NROF experiments (4th row).
Figure 8. Latitude-depth map of salinity at 90ºE from ORAS4 (1st row), CTRL (2nd row), NROF (3rd row) and difference of CTRL and NROF experiments (4th row).
Figure 9. Time-depth plot of salinity average over the area(19º–22ºN, 87º–92ºE) from ORAS4 (1st column), CTRL (2nd column), NROF (3rd column) and difference of CTRL and NROF experiments (4th column).
Figure 10. Seasonal MLD over the Indian Ocean from ORAS4 (1st row), CTRL (2nd row), NROF (3rd row) and difference of CTRL and NROF experiments (4th row).
Figure 11. Seasonal variability of the surface currents over the Indian Ocean from OSCAR (1st row), CTRL (2nd row), NROF (3rd row) and difference of CTRL and OSCAR4 observation (4th row).
Figure 12. Brunt Vaisala frequency (N2) average over the area (19º–22ºN, 87º–92ºE) in the BoB. The results from the CTRL and NROF experiments are represented by the square, and circle respectively.
Figure 13. Vertical shear of the horizontal current (S2) average over the area (19º–22ºN, 87º–92ºE) in the BoB. The results from the CTRL and NROF experiments are represented by the square, and circle respectively.
Figure 14. Maps of Energy Required for Mixing (ERM) over the Indian Ocean from ORAS4 (1st row), CTRL (2nd row), NROF (3rd row) and difference of CTRL and NROF experiments (4th row).


 DownLoad:


 DownLoad: