
Figure
1.
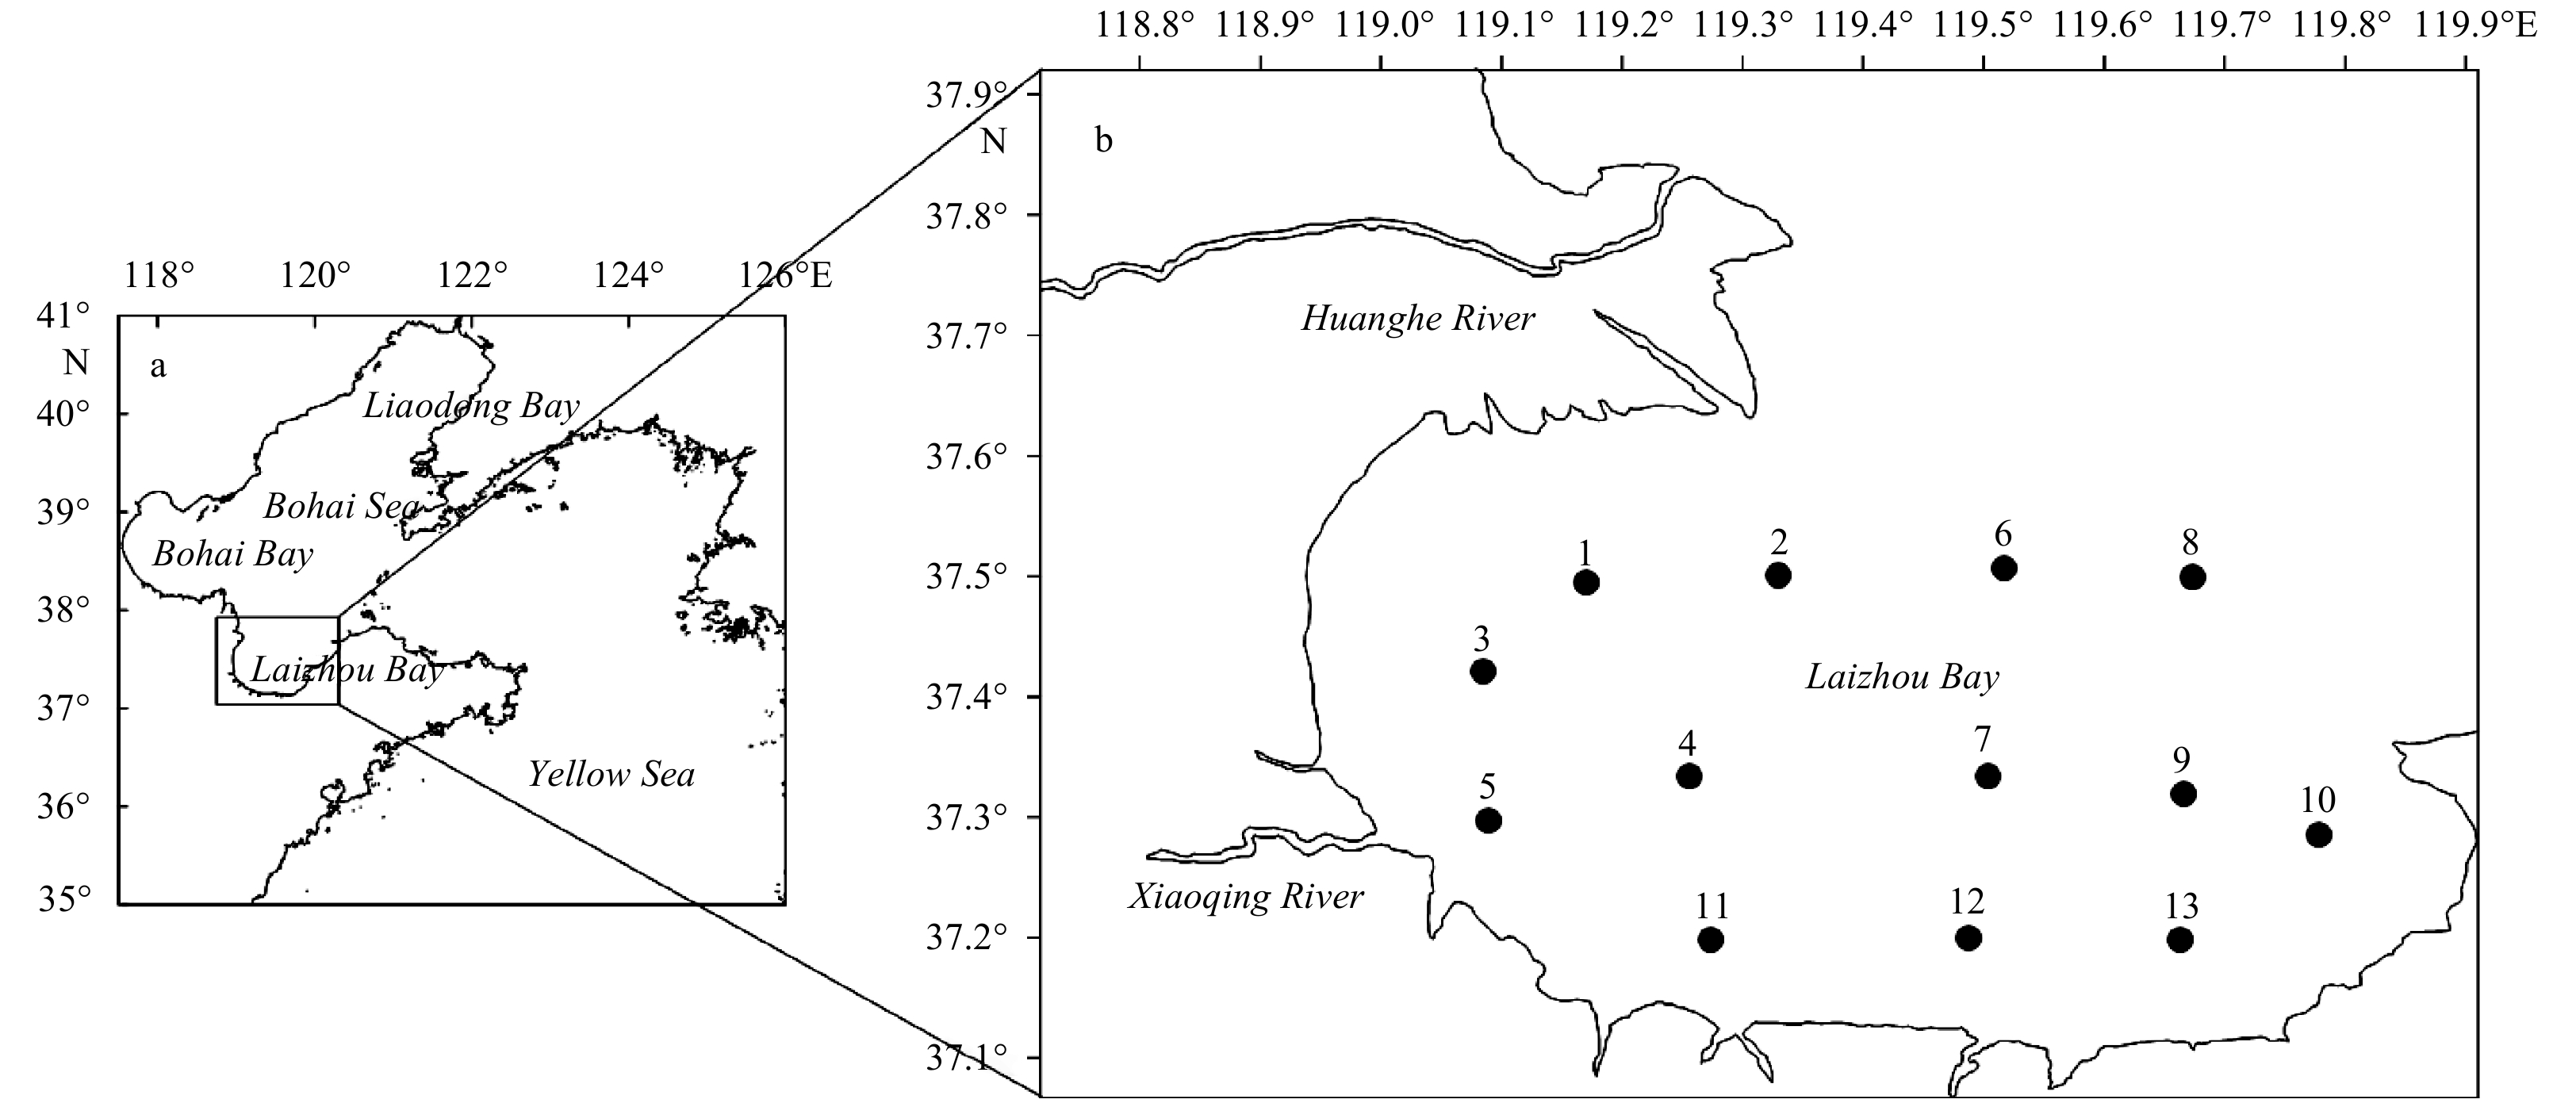
The Laizhou Bay study area (a) and the distribution of the 13 sampling stations (b).
| Citation: | Li Wang, Xianxiang Luo, Jianqiang Yang, Juan Zhang, Yuqing Fan, Jiayu Shen. Assessing benthic habitat quality using biotic indices in the Laizhou Bay, China[J]. Acta Oceanologica Sinica, 2020, 39(2): 49-58. doi: 10.1007/s13131-020-1552-x

|
The degradation of coastal eco-environmental quality caused by human activities and climate change will directly affect marine ecosystem health and sustainable provision services for humanity. It will eventually threaten human health and safety (Halpern et al., 2012). Objectively evaluating the marine eco-environmental quality is a prerequisite for maintaining the health and safety of marine environments. The macrobenthos has a relatively stable habitat, sedentary lifestyle and longevity (Pearson and Rosenberg, 1978; Bakalem et al., 2009). Macrobenthic communities and species composition are sensitive to environmental disturbances and changes. Therefore, the biotic indices, for example, Shannon-Wiener index (H′) (Shannon and Weaver, 1963), infaunal trophic index (ITI) (Word, 1978), benthic index of biotic integrity (B-IBI) (Weisberg et al., 1997), AZTI’s marine biotic index (AMBI) (Borja et al., 2000), multivariate AMBI (M-AMBI) (Muxika et al., 2007) and benthic opportunistic annelida amphipods index (BO2A) (Dauvin and Ruellet, 2009), are widely used to evaluate the benthic habitat health in the coastal waters (Brauko et al., 2016). Among them, the H′ is widely used to evaluate the quality of aquatic ecosystems because the calculation of this index is simple, and it can accurately reflect the stability of the benthic community structure (Shannon and Weaver, 1963). The AMBI is based on species’ sensitivity/tolerance to an environmental stress gradient (Borja et al., 2000). The M-AMBI is a comprehensive index that integrates species richness, the H′ and the AMBI through discriminant analysis and factor analysis (Muxika et al., 2007). This index has been inter-calibrated with other European methods according to the Water Framework Directive (WFD) principles (Borja et al., 2007) and has been widely used to evaluate benthic habitat quality in the coastal waters of Europe (Pitacco et al., 2018), Americas (Checon et al., 2018), Asia (Sun et al., 2018), and Africa (Sigamani et al., 2015). The three biotic indices have been successfully applied to evaluate the ecological status of estuaries and coastal waters impacted by strong human disturbances. However, there has been relatively few reports researching on the suitability of AMBI and M-AMBI in assessing the EQS in the estuary and coastal areas of China, only including the Changjiang (Yangtze) River Estuary (Cai et al., 2013a), Bohai Bay (Cai et al., 2014), Huanghe (Yellow) River Estuary (Luo et al., 2016), Laizhou Bay culture area (Li et al., 2017) and Liaodong Bay (Cai et al., 2013b). At present, the evaluation of the applicability and feasibility of the existing indices remains a challenge (Vačkář et al., 2012). Different indices need to be calibrated in specific areas or compared with other environmental quality factors (Labrune et al., 2006; Simboura and Reizopoulou, 2007).
The Laizhou Bay, one of the three major bays in the Bohai Sea, serves as a spawning and hatching site for many marine organisms (Gao et al., 2015), which is one of the main components of China’s coastal economic belt (Xu et al., 2017). Due to the coastal development and sewage discharge, the environment of the Laizhou Bay is under enormous pressure (Jiang et al., 2015). For instance, the opportunity polychaete account for 37.5% in dominant polychaete species of the Laizhou Bay, which indicates that the polychaete species has been negatively affected by environmental pollution (Zhang et al., 2012). In the Xiaoqing River Estuary, the severe organic contamination and oxygen depletion have led to the low richness of macrobenthos species and the species composition simplification (Luo et al., 2014). The ABC curves showed that most sampling stations were under moderate disturbance and have been polluted in different degrees (Liu et al., 2014). The macrobenthic community is dominated by opportunistic species, which indicates the macrobenthic community are obviously polluted (Luo et al., 2017). The evaluation of the comprehensive ecological health index (CEHI), which is based on the water quality and sedimentary chemical parameters, showed that the marine ecosystem in the Laizhou Bay is in an sub-health state (Song et al., 2017a). While the health status of the Xiaoqing River Estuary was the worst, which could be attributed by the terrestrial pollution and the following eutrophication. The water quality of coastal waters in the southwest of the Laizhou Bay was more seriously polluted than that in central and eastern regions evaluated by the habitat quality composite index (HQI) and ecological response composite index (ERI) (Yang et al., 2014). Considering that the comprehensive multi-parameter evaluation indices rely heavily on the parameter weights, the biotic indices are more suitable for ecological health assessment in coastal waters affected by human activities (Garaffo et al., 2017).
Based on a benthic habitat quality assessment in the Laizhou Bay using the Shannon-Wiener index, AMBI and M-AMBI, this study compares the consistency and differences in the evaluation results of the three indices, analyses the relationships among the dominant species, three indices and environmental pressure gradient in order to (1) test the applicability of the three biotic indices for assessing the benthic habitat health of the Laizhou Bay, (2) promote the application of biotic indices in ecological environment quality assessments in the coastal waters of China, and (3) provide services for China’s offshore environment protection and management.
The Laizhou Bay is located next to the northern part of the Shandong Peninsula and lies between the Qimu Reef in the east and the Huanghe River Estuary in the west. It is one of three bays in the Bohai Sea of China, with an area of 6 966 km2 and a mean depth less than 10 m. The Laizhou Bay is a typical semi-enclosed shallow bay, and the water exchange capacity is weak (Zhuang and Gao, 2015). The Huanghe River, Xiaoqing River and other rivers flow into the area containing bountiful nutrient substances. As an important fishery and sea salt production area in northern China, the Laizhou Bay has rich fishery resources, including crab, clam and shrimp (Zhang et al., 2017). However, due to urbanization along the coast, the rapid development of aquaculture and reclamation projects, the marine ecological environment of the Laizhou Bay has experienced some negative effects, which indicates that the area has been polluted to varying degrees and the macrobenthos have been disturbed (Yang et al., 2014; Song et al., 2017a). In August of 2011 to 2014, a total of 13 sampling stations were established in the Laizhou Bay and its adjacent areas (37°10′–37°40′N, 119°00′–120°00′E) (Fig. 1). Four ecological survey cruises were conducted to obtain 52 surface sediment and macrobenthos samples. During these crusies, we measured the water depth and salinity at the sampling stations.
The surface sediment and macrobenthos samples were collected using a 0.05 m2 Van Veen grab. According to the marine monitoring standard, the mud was collected five times per station as one sample. Biological samples were washed with seawater through a 0.05 mm mesh. The macrobenthos specimens and residues were transferred to vials, fixed with a 5% (v/v) formalin solution, and then taken to the laboratory for quantitative analysis. The sulphide content was analysed using the volatile acid separation-iodine method. The concentration of petroleum hydrocarbons (TPH) was measured using fluorescence spectrophotometry. We ground air-dried sediment samples and passed them through an 80-mesh sieve. To remove the inorganic carbon, we mixed the sample with hydrochloric acid. The total organic carbon (TOC) was analysed using an elemental analyser (FLASH2000, Elementar, USA). A portable 301 CTD sensor was used to continually measure the depth and salinity of the water on site. The dissolved oxygen (DO) was continually measured using a YSI-500 dissolved oxygen meter.
The macrobenthos abundance was represented by the number of individuals per square metre in the surface sediments (ind./m2). The characteristics of the macrobenthos in the study area were analysed using the Shannon-Wiener index (H′) (Shannon and Weaver, 1963). The dominant species were determined by dominance index (Y) (Chen et al., 1995), which consider both the abundance and occurrence frequency of macrobenthos, and it can well reflect the status of each species in the community. The indices were calculated using the following formulas:
| $$ \begin{aligned} & Y = {n_i}/N \times{f_i},\\ & H' = - \mathop \sum \limits_{i = 1}^S {P_i}{\rm{lo}}{{\rm{g}}_2}{P_i}, \end{aligned} $$ |
where ni is the abundance of species i, N is the abundance of all species, fi is the frequency of species i at all stations, S is the total number of collected species, and Pi is the percent abundance of species i. When Y is higher than or equal to 0.02, the species is defined as a dominant species (Chen et al., 1995).
The AMBI and M-AMBI values were calculated using the AMBI software (ver.5.0) on AZTI’s web page (http://ambi.azti.es). In this study, 11 macrobenthos species were not assigned to the AMBI list, and the proportion of unassigned taxa at each station was lower than 20%, so they did not affect the reliability of the AMBI results (Borja and Muxika, 2005). According to the suggestion of Forchino et al. (2011) the high reference conditions were determined by increasing the highest diversity and richness values by 15% and decreasing the lowest AMBI value of all the samples in the four cruises by 15%. The optimal number of reference species was 58, the Shannon-Wiener index value was 5.31, and the AMBI value was 0.859 6. For the bad status, the references were based upon the azoic conditions (diversity and richness equal to 0 and AMBI equal to 6) (Borja and Tunberg, 2011; Song et al., 2017b). The values and ecological quality classfications of H′, AMBI and M-AMBI were shown in Table 1. The Shannon-Wiener index value and the corresponding classification of ecological quality status (EQS) were defined by Cai et al. (2002). The classification of ecological quality status corresponding to the AMBI and M-AMBI values were defined by Borja and Tunberg (2011).
| H′ | AMBI | M-AMBI | Benthic community health | Site disturbance classification | EQS |
| H′>3 | 0<AMBI≤1.2 | >0.77 | normal/impoverished | undisturbed | High |
| 2<H′≤3 | 1.2<AMBI≤3.3 | 0.53–0.77 | unbalanced | slightly disturbed | Good |
| 1<H′≤2 | 3.3<AMBI≤4.3 | 0.38–0.53 | transitional to pollution | moderately disturbed | Moderate |
| 0<H′≤1 | 4.3<AMBI≤5.5 | 0.20–0.38 | polluted/transitional to heavy pollution | heavily disturbed | Poor |
| H′=0 | 5.5<AMBI≤7.0 | <0.20 | heavy polluted/azoic | extremely disturbed | Bad |
 DownLoad:
CSV
DownLoad:
CSV
CANOCO 5.0 software was used to analyse the relationships among the biotic indices, dominant species and environmental factors. Before the analysis, the values of both biotic indices, the abundance of dominant species and environmental variables were all log10(x+1) transformed. Detrended correspondence analysis (DCA) showed that the maximum gradient length was less than 3 SD, which was suitable for the redundancy analysis (RDA) based on the linear model (Šmilauer and Lepš, 2014). The significance of the correlations in the RDA was tested using Monte Carlo simulation.
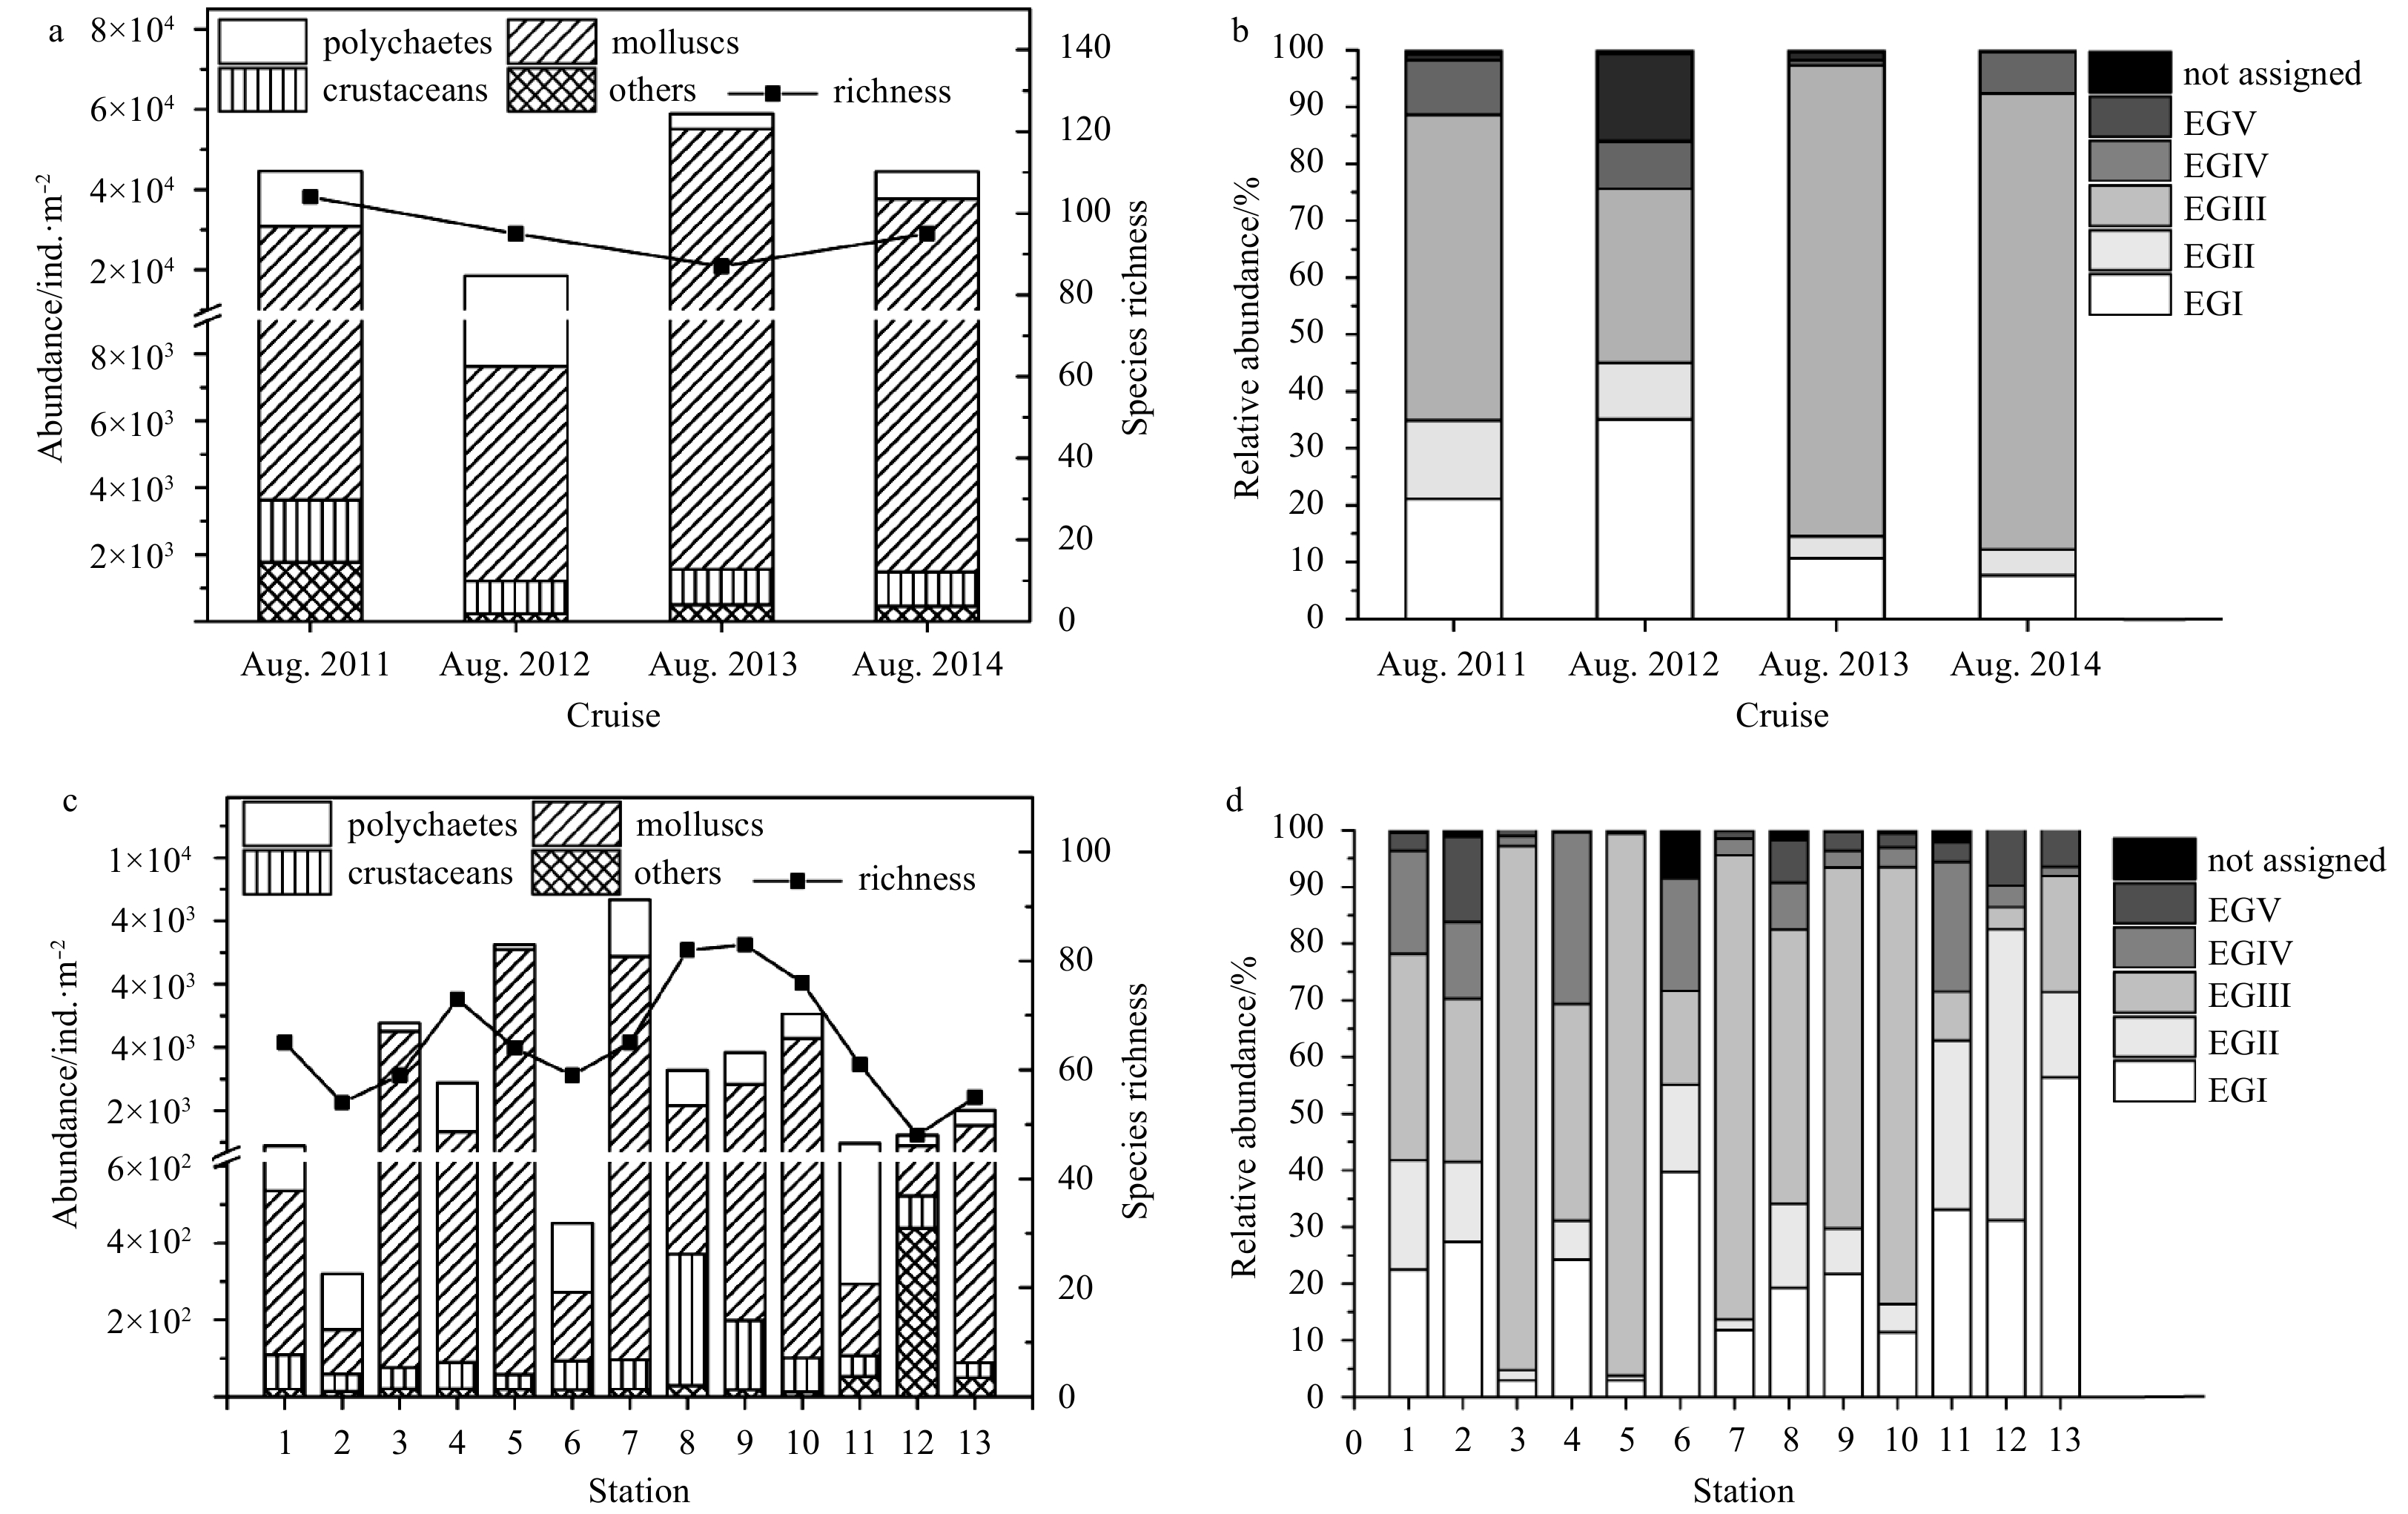
A total of 179 macrobenthos were identified during the four cruises: 62 were classified as Polychaetes, 57 were Molluscs, 45 were Crustaceans and 15 were members of other taxa, including Echinodermata, Nemertea and Coelenterata. The four cruises average number of species was 95, and the abundance ranged from 18 492 to 58 895 ind./m2. The macrobenthos was dominated by polychaetes in 2012, while the samples collected during the other cruises were dominated by molluscs (Fig. 2). The species abundance of EGⅢ accounted for a high proportion of the total abundance, accounting for more than 80% of the total abundance in both 2013 and 2014. This was due to the largest contribution being from Arcuatala senhousia, belonging to EGⅢ. High values of species richness were observed in the eastern Laizhou Bay (Stas 8, 9 and 10), while low values occurred in the southern area (Stas 12 and 13). The highest value of species abundance (8 664 ind./m2) was located at Sta. 7 in the central part of Laizhou Bay, while the lowest value of 320 ind./m2 was located at Sta. 2 near the Huanghe River Estuary. Except at Stas 6, 11, 12 and 13, EGⅢ accounted for the highest proportion of the total abundance. In addition, at Stas 5 and 6, there were some pollution indicators belonging to EGV, such as Capitella capitata. These results indicate that the macrobenthos in the Laizhou Bay area has suffered from environmental disturbance and pollution. The dominant species in the Laizhou Bay are shown in Table 2. The composition of dominant species showed great inter-year variation. The proportions of opportunistic species in EGIV and EGV were relatively high, and the dominance of Arcuatala senhousia in EGIII was significantly higher than that of other species.

| Dominant species | Ecological group | Dominance | |||
| Aug. 2011 | Aug. 2012 | Aug. 2013 | Aug. 2014 | ||
| Mesochaetopterus japonicus | EGI | 0.026 | 0.186 | + | + |
| Alvenius ojianus | EGI | 0.043 | + | + | + |
| Gammaridea sp. | EGI | + | 0.028 | + | + |
| Glycinde gurjanovae | EGII | 0.039 | + | + | + |
| Amaeana occidentalis | EGIII | 0.022 | + | + | + |
| Arcuatala senhousia | EGIII | 0.168 | 0.134 | 0.819 | 0.601 |
| Cirratulus cirratus | EGIV | 0.063 | 0.023 | – | + |
| Prionospio queenslandica | EGIV | – | 0.020 | + | + |
| Heteromastus filiformis | EGIV | + | + | + | 0.028 |
| Capitella capitata | EGV | + | 0.107 | + | – |
| Note: + and – indicate the dominant species present or absent during the different cruises. | |||||
DownLoad:
CSV
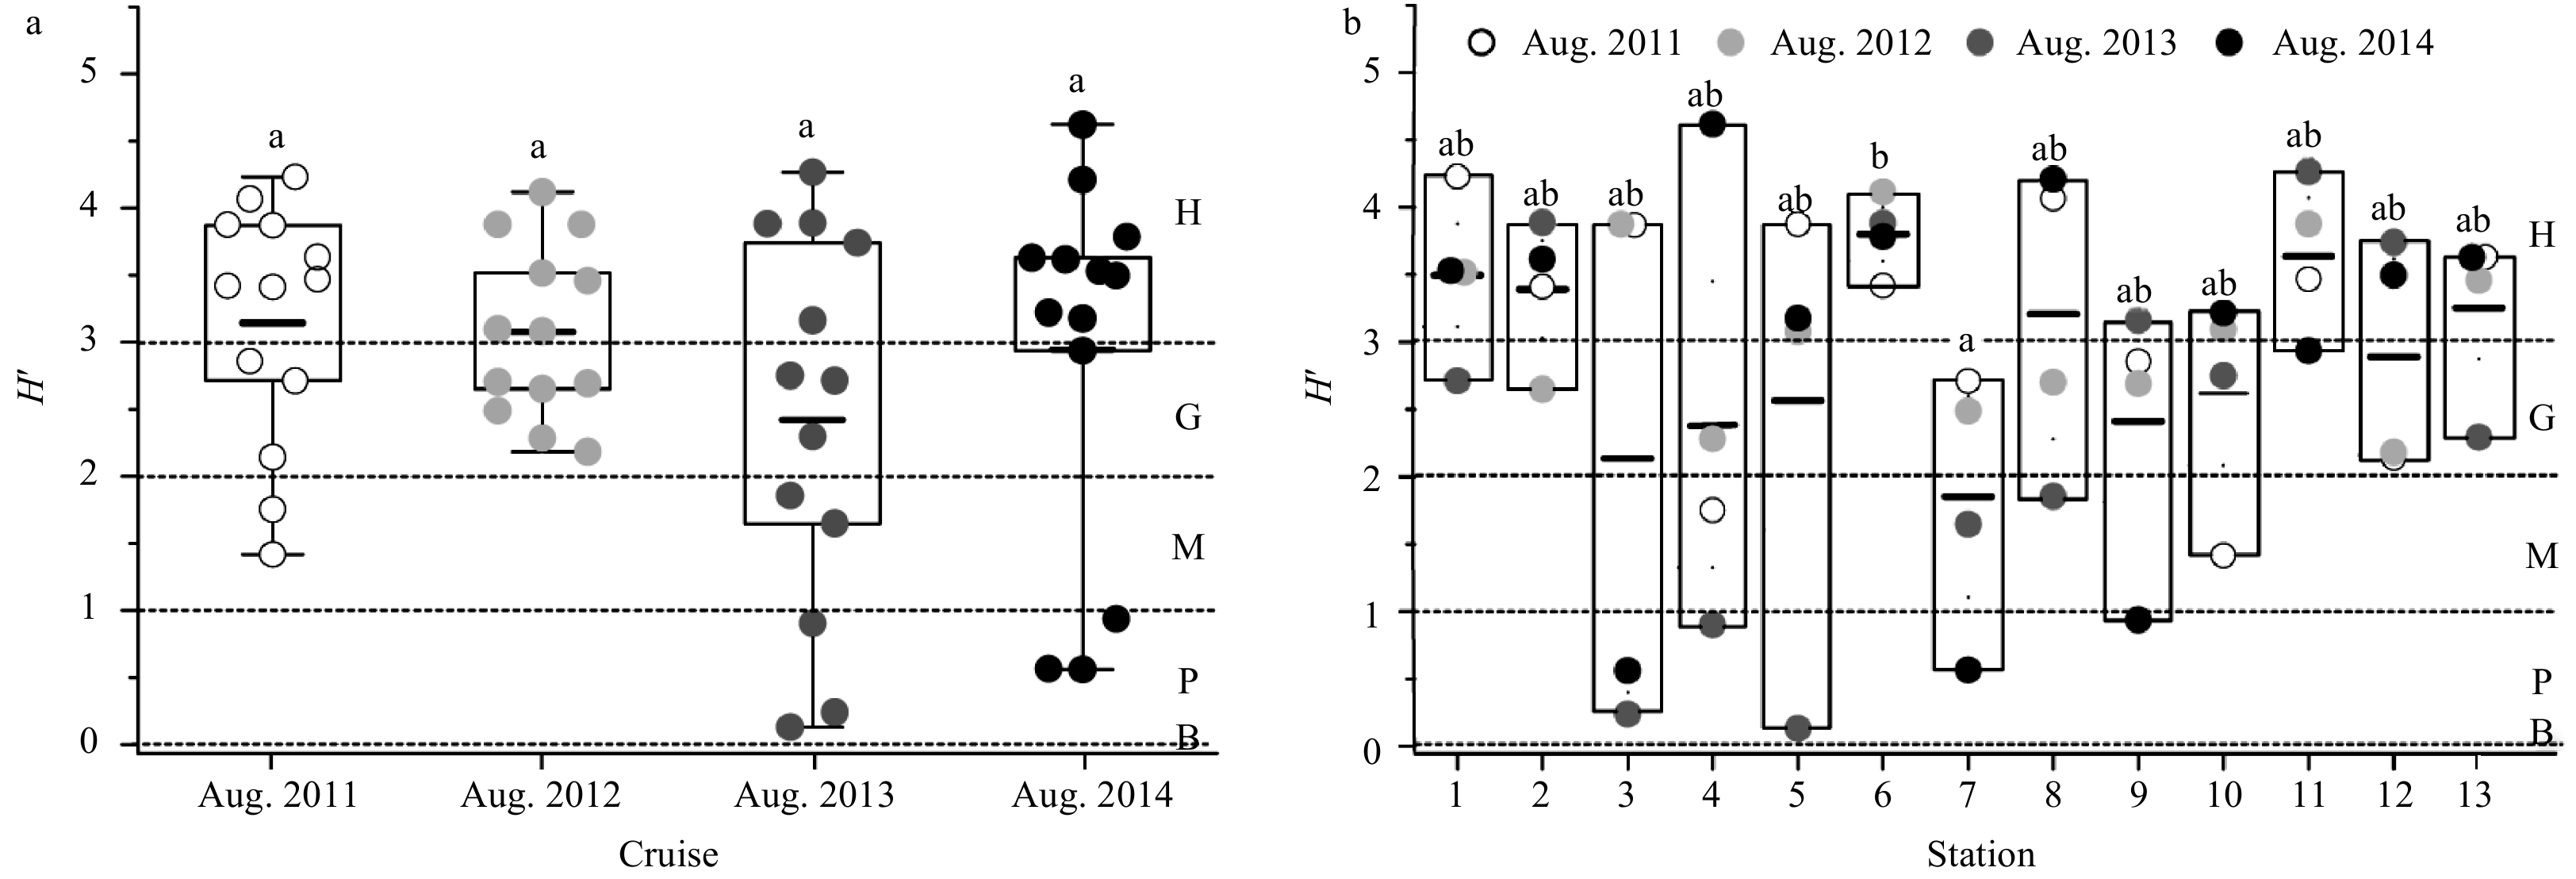
The Shannon-Wiener index has been widely used to monitor changes in marine benthic communities and to indicate and evaluate environmental pollution. In the study area, the H′ values of the 52 samples collected during the four cruises varied from 0.13 to 4.62, averaging 2.90, and the corresponding ecological quality status was “Good”. In 2011 and 2012, the mean H′ value was higher than 3, with “High” status. In 2013 and 2014, the mean H′ value was between 2 and 3, with “Good” status. The H′ values from the four cruises did not significantly differ (p>0.05, n=13) (Fig. 3a). The mean H′ value for Sta. 7, which was located in the mid-east portion of the bay, was between 1 and 2, with “Moderate” status, and the other stations had values higher than 2, with “High” or “Good” status. The H′ value of Sta. 7 was significantly lower than that of Sta. 6 (p<0.05, n=4), and there were no significant differences among the other stations according to ANOVA (Fig. 3b).

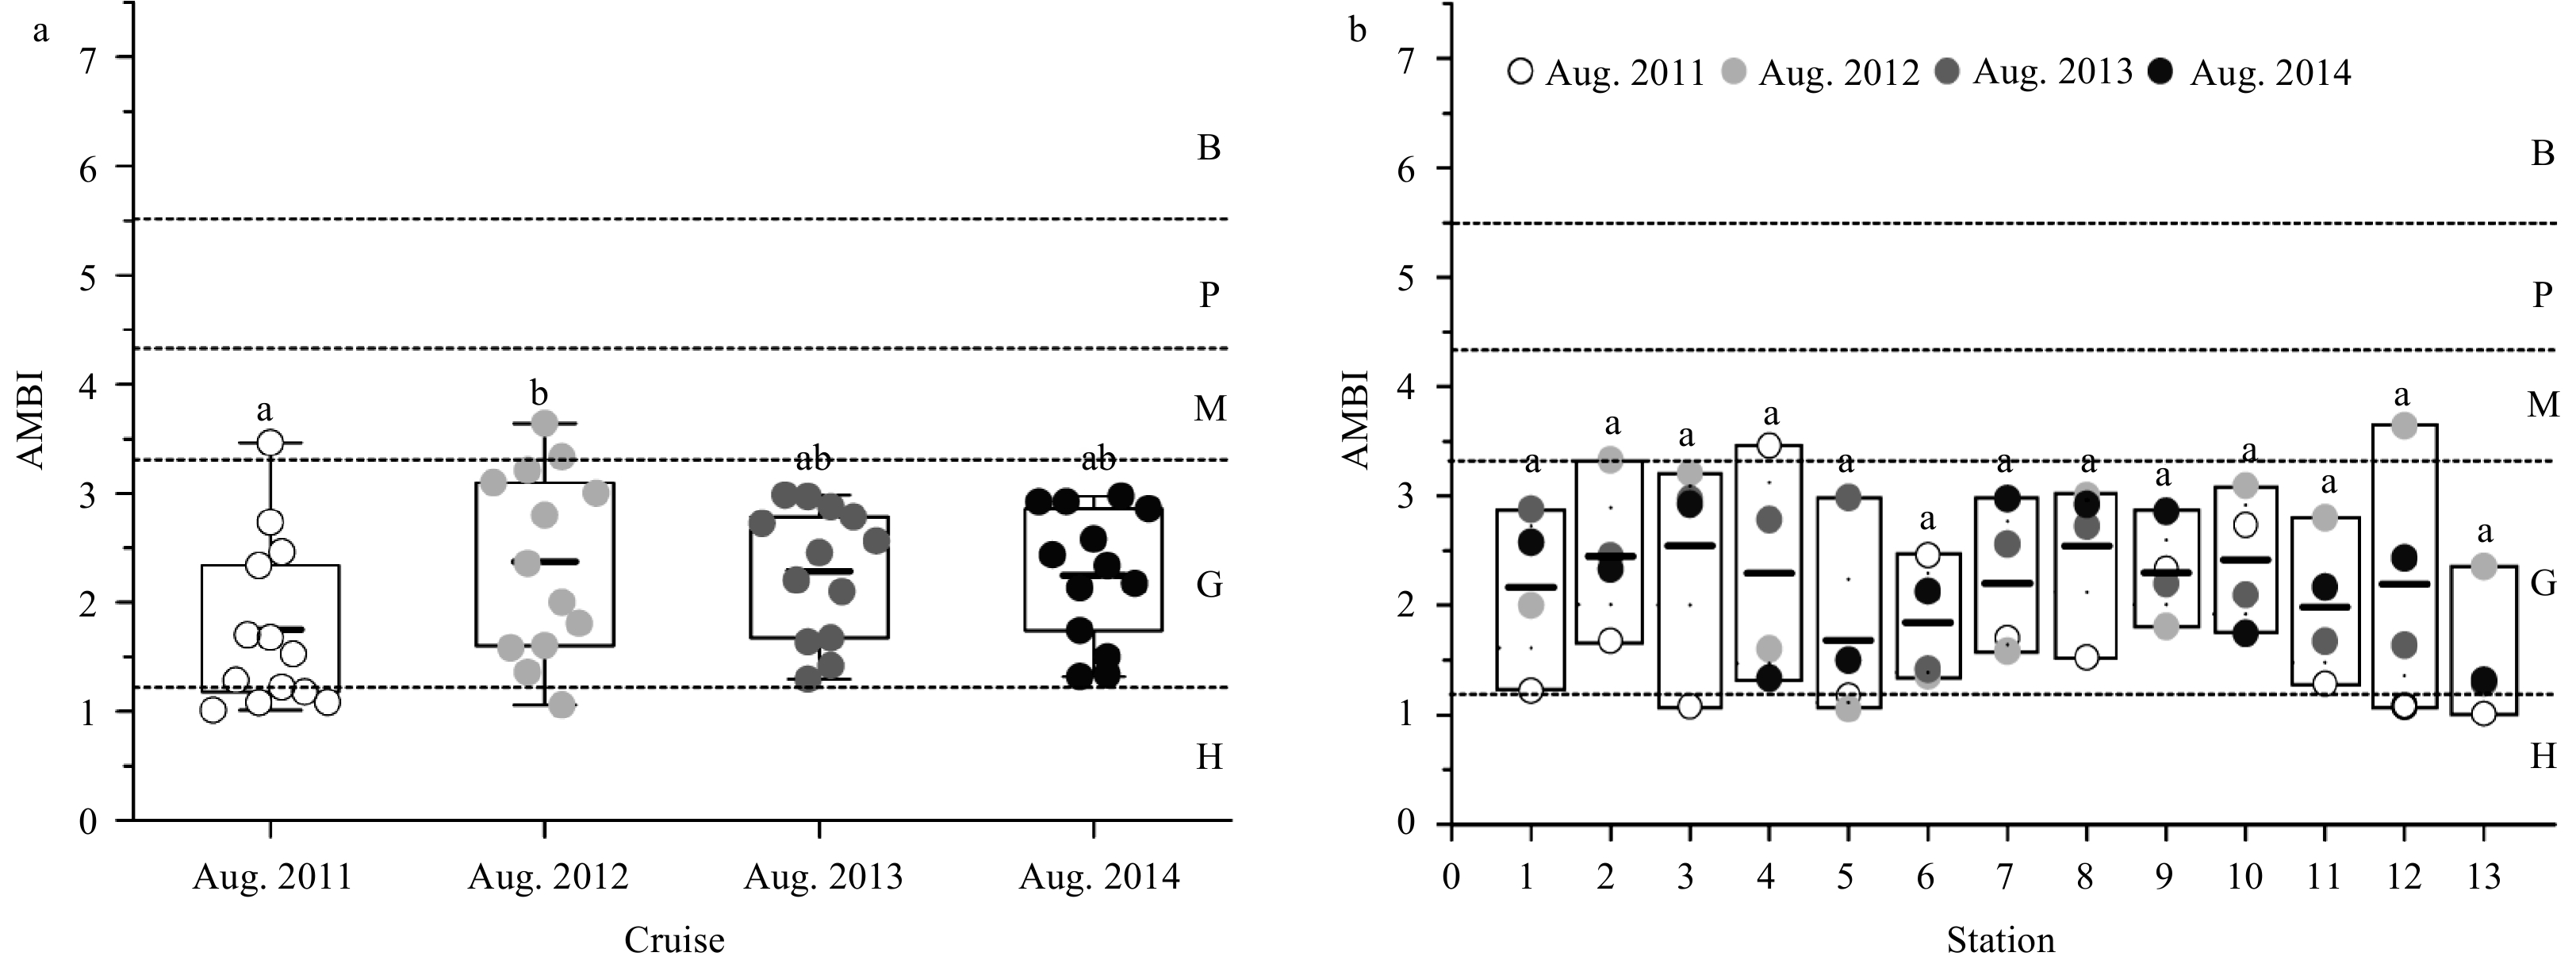
The AMBI values of the samples ranged from 1.01 to 3.64, averaging 2.16, and the corresponding ecological quality status was “Good”. The AMBI value in 2011 was significantly lower than that in 2012 (p<0.05, n=13). No significant differences were found among the other cruises (Fig. 4a). The mean AMBI values of the 13 stations ranged from 1.49 to 2.55, which indicated that the benthic habitat quality was generally at a “Good” level and that the benthos health was slightly disturbed. The AMBI values of all the stations did not significantly differ according to ANOVA (p>0.05, n=4) (Fig. 4b).

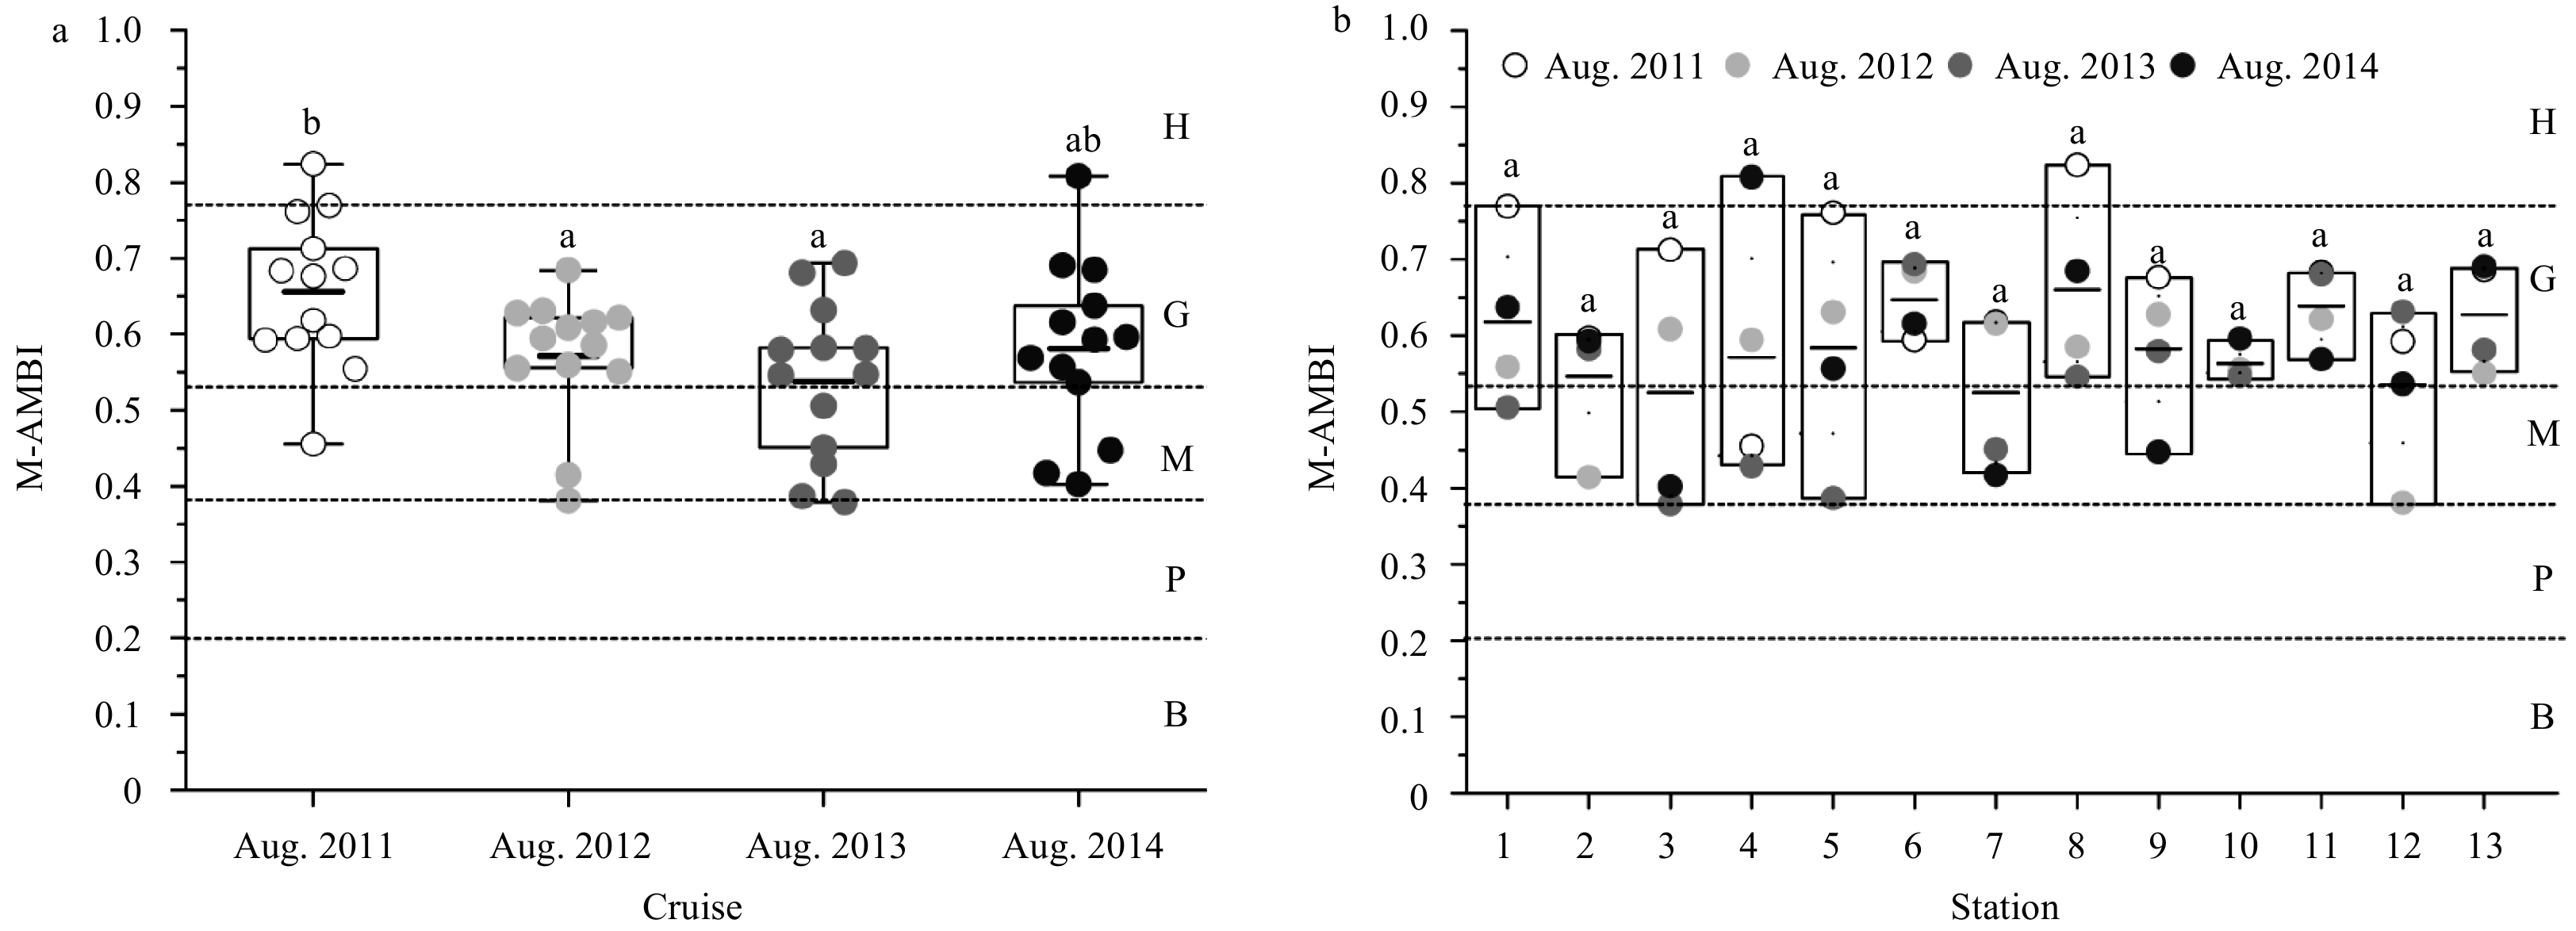
In the study area, the M-AMBI values of the samples ranged from 0.38 to 0.82, averaging 0.50, and the corresponding ecological quality status was “Good”. The mean M-AMBI values in 2012 and 2013 were significantly lower than that in 2011 (p<0.05, n=13). No significant differences were found among the other cruises (Fig. 5a). In addition, the mean M-AMBI values at Stas 3 and 7 were lower than 0.53, with “Moderate” status, and the values at the other stations were higher than 0.53, with “Good” status. The M-AMBI values at all the stations were not significantly different according to ANOVA (p>0.05, n=4) (Fig. 5b).

The H′, AMBI and M-AMBI have some differences in assessing the EQS of benthic habitats in the Laizhou Bay. In order to facilitate the comparative analysis between the indices, the EQS of benthic habitats were divided into two categories: “undegraded” and “degraded” (Borja et al., 2008). The undegraded condition corresponded to a “High” or “Good” EQS, which indicated that the benthic habitat was undisturbed or slightly disturbed and the benthic ecosystem was in a healthy state. “Moderate”, “Poor” or “Bad” EQS were defined as degraded conditions, which meant that the benthic habitat was moderately or more severely disturbed and the macrobenthos in the area was transitioning to a community indicative of contamination. Of the 52 samples used in the study, 42 samples (81%) were considered undegraded based on the H′ value, 49 samples (94%) were considered undegraded based on the AMBI, and 41 samples (79%) were considered undegraded based on the M-AMBI.
The result for the EQS as evaluated by the H′, AMBI and M-AMBI values could be broadly divided into four typical cases (Table 3). Case I contained 39 samples (75%), which were evaluated as undegraded conditions by the three indices. The sum of the relative abundances of EGI, EGII and EGIII was more than 50%, and the abundance of a single species accounted for less than 50% of the total abundance. The results above indicate that the three indices are highly consistent in identifying undegraded status.
| Case | Case I | Case II | Case III | Case IV |
| Characteristic | The sum of the relative abundances of EGI, EGII and EGIII was more than 50%, and the abundance of a single species accounted for more than 50% of the total abundance. | The sum of the relative abundances of EGI, EGII and EGIII was more than 50%, and the abundance of Arcuatala senhousia (EGIII) accounted for more than 50% of the total abundance. | The sum of the relative abundances of EGIV and EGV was more than 50%, and the abundance of Capitella capitata (EGV) accounted for 40% to 50% of the total abundance. | The sum of the relative abundances of EGIV and EGV was more than 50%, and the abundance of Cirratulus cirratus (EGIV) accounted for more than 70% of the total abundance. |
| Number of samples | 39 | 10 | 2 | 1 |
| The evaluation of the H′ | 100% of the samples were undegraded. | 10% of the samples were undegraded; 90% of the samples were degraded. | 100% of the samples were undegraded. | 100% of the samples were degraded. |
| The evaluation of the AMBI | 100% of the samples were undegraded. | 100% of the samples were undegraded. | 100% of the samples were degraded. | 100% of the samples were degraded. |
| The evaluation of the M-AMBI | 100% of the samples were undegraded. | 20% of the samples were undegraded; 80% of the samples were degraded. | 100% of the samples were degraded. | 100% of the samples were degraded. |
DownLoad:
CSV
Case II contained 10 samples. The sum of the relative abundances of EGI, EGII and EGIII was more than 50%, and the abundance of Arcuatala senhousia (EGIII) accounted for over 50% in each station. The H′ were classified as “Moderate” or “Bad” status in degraded conditions, the AMBI was classified as “Good” status in undegraded conditions, and 80% of the samples were classified as “Moderate” under degraded conditions by the M-AMBI. These results occurred because the value of the H′ mainly depend on the species richness and the homogeneity of the distribution of individuals among the species (Mulik et al., 2017). In this case, the relative abundance of Arcuatala senhousia was too high, which resulted a serious imbalance in the distribution of individuals among the species and desaerced the H′ value. The AMBI value is mainly based on the relative abundances of the five ecological groups (Borja and Tunberg, 2011). Because of the absolute advantage of Arcuatala senhousia (EGIII), which has a certain tolerance to organic pollution, the results of the AMBI were classified as having “Good” status under undegraded conditions. The M-AMBI is a comprehensive index based on the species richness, H′ and AMBI (Muxika et al., 2007). Therefore, the results of the M-AMBI were generally between the H′ and AMBI, and most samples were classified as having “Moderate” status under degraded conditions. According to the above results, the AMBI could have overestimated the EQS (Luo et al., 2016; Qiu et al., 2018) because the high relative abundance of the single species and the imbalance among species has been indicated that the environment has been polluted and disturbed.
Case III contained 2 samples. The sum of the relative abundances of EGIV and EGV was greater than 50%, the number of species was greater than 30, and the abundance of Capitella capitata (EGV) accounted for 40% to 50% of the total abundance. All information provided by the Shannon-Wiener index was equivalent (Simboura and Reizopoulou, 2007). Therefore, when the species richness was not low and the distribution of individuals among species was relatively homogeneous, the H′ value was high, and the results were classified as having “Good” status under undegraded conditions. However, the high proportion of opportunistic species, which belong to the EGIV and EGV groups, indicates that the environment had been moderately or severely disturbed and the health of the macrobenthic communities had begun to deteriorate (Borja et al., 2003). Therefore, the EQS evaluated by the AMBI and M-AMBI was “Moderate”. In this case, the H′ could have overestimated the benthic habitat quality. In Case IV, the sum of the relative abundances of EGIV and EGV was greater than 50%, and the abundance of Cirratulus cirratus (EGIV) accounted for over 70% of the total abundance. The three indices gave the same results, and only 1 sample (2%) was classified as “Moderate” or “Poor” status under degraded conditions.
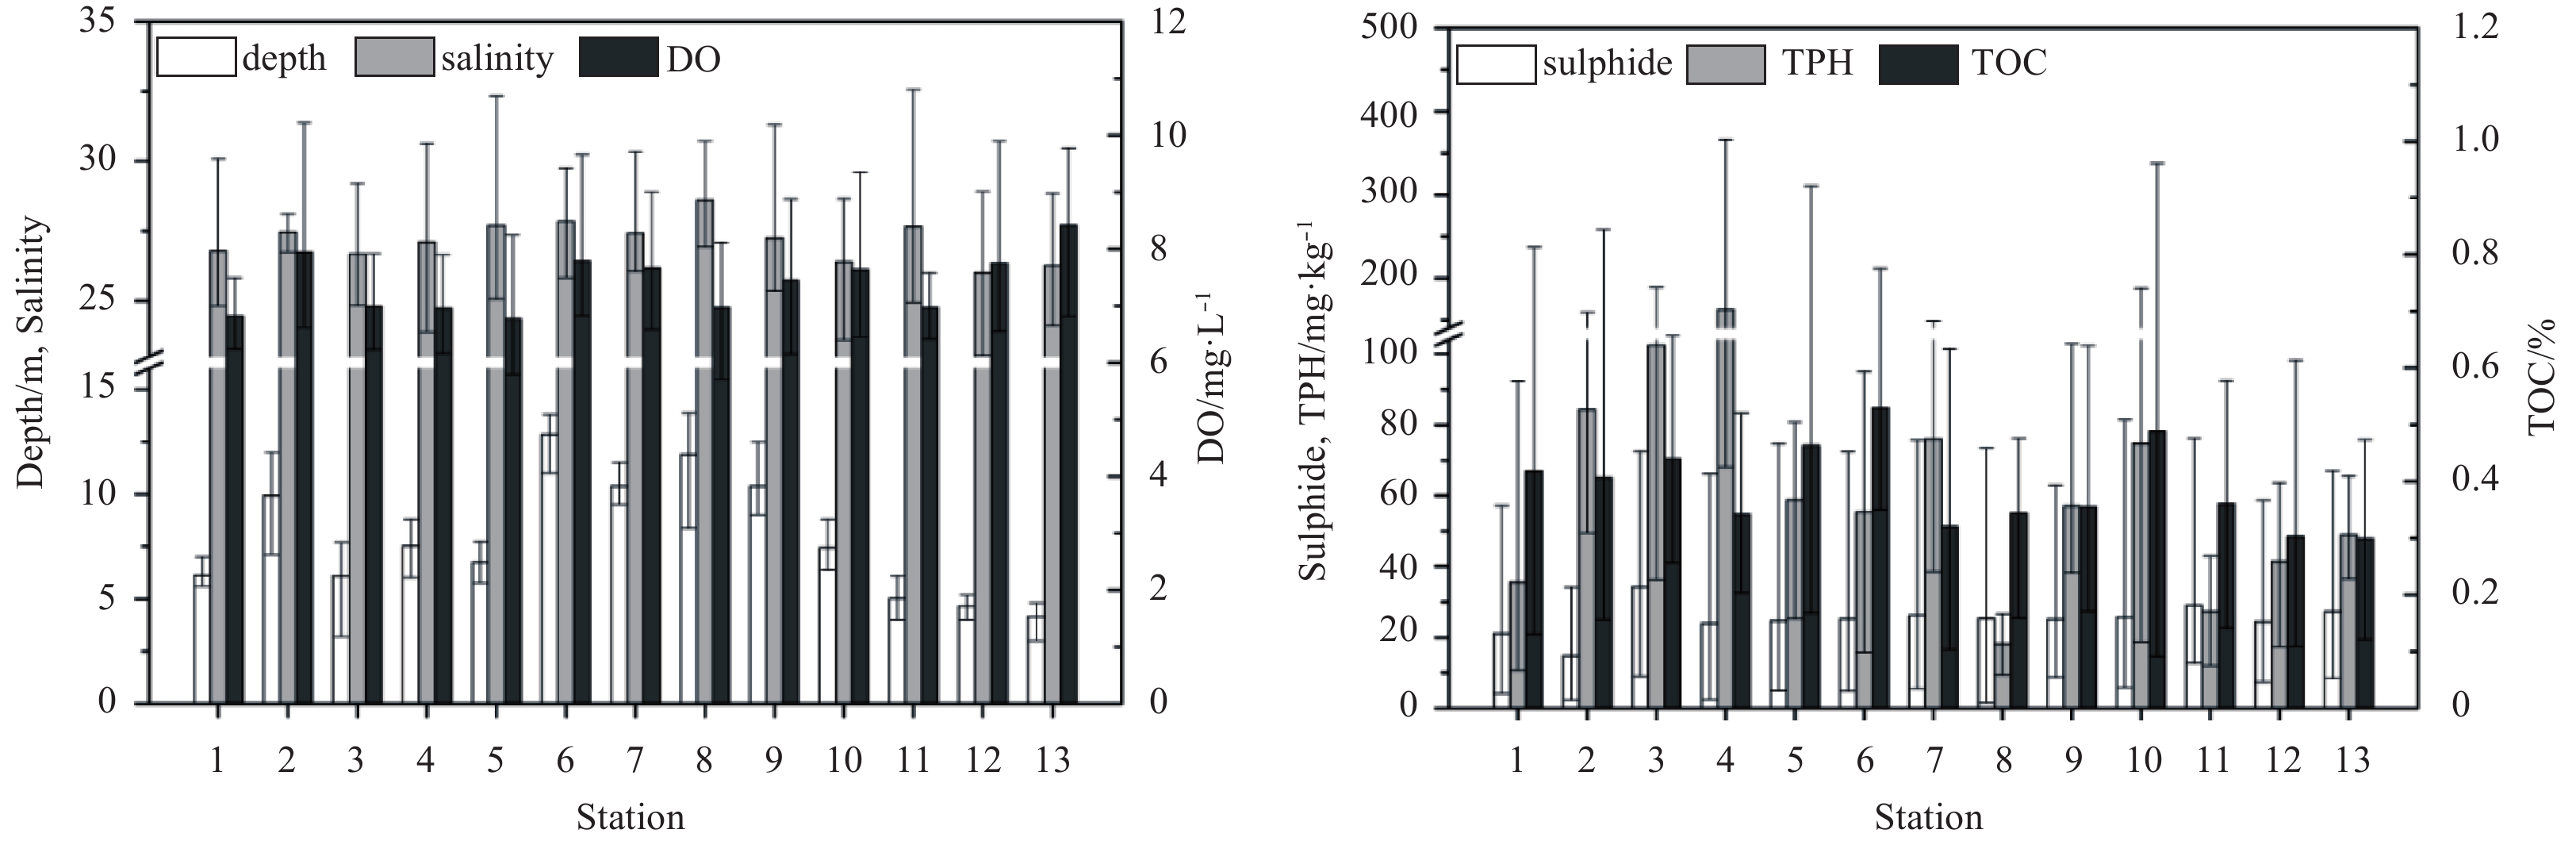
The relationship among the dominant species, the three biotic indices and the environmental pressure gradient indicates the sensitivity of the macrobenthos to environmental disturbances and pollution (Berthelsen et al., 2018). The closer the relationship is, the more sensitive the indices are. The water depth, salinity, DO and concentrations of the TOC, sulphide, and TPH in the surface sediments are shown in Fig. 6. In the Laizhou Bay, the water depth ranged from 3 to 15.5 m, averaging 7.7 m. The salinity ranged from 22 to 31, averaging 27. The DO concentration ranged from 5.7 to 10.22 mg/L, averaging 7.39 mg/L. The TOC concentration ranged from 0.09% to 0.96%, averaging 0.39%. The sulphide concentration ranged from 1.51 to 81.40 mg/kg, averaging 25.13 mg/kg. The concentration of TPH ranged from 9.41 to 366.00 mg/kg, averaging 64.80 mg/kg. Higher values of TPH were found in the Huanghe River Estuary and Xiaoqing River Estuary in the southwest of Laizhou Bay. According to the sea water quality standard (GB 3097-2007), the DO content of 96% of the sites met Standard I, while 4% of the sites exceeded Standard II. Although all the sedimentary chemical parameters conformed to the first class of the marine sediment quality standard (General Administration of Quality Supervision, Inspection and Quarantine of the People’s Republic of China, 2004), the contents of sulfides and TPH in sediments of different stations vary greatly, which showed that the sedimentary environment of the Laizhou Bay has been polluted to a certain extent.

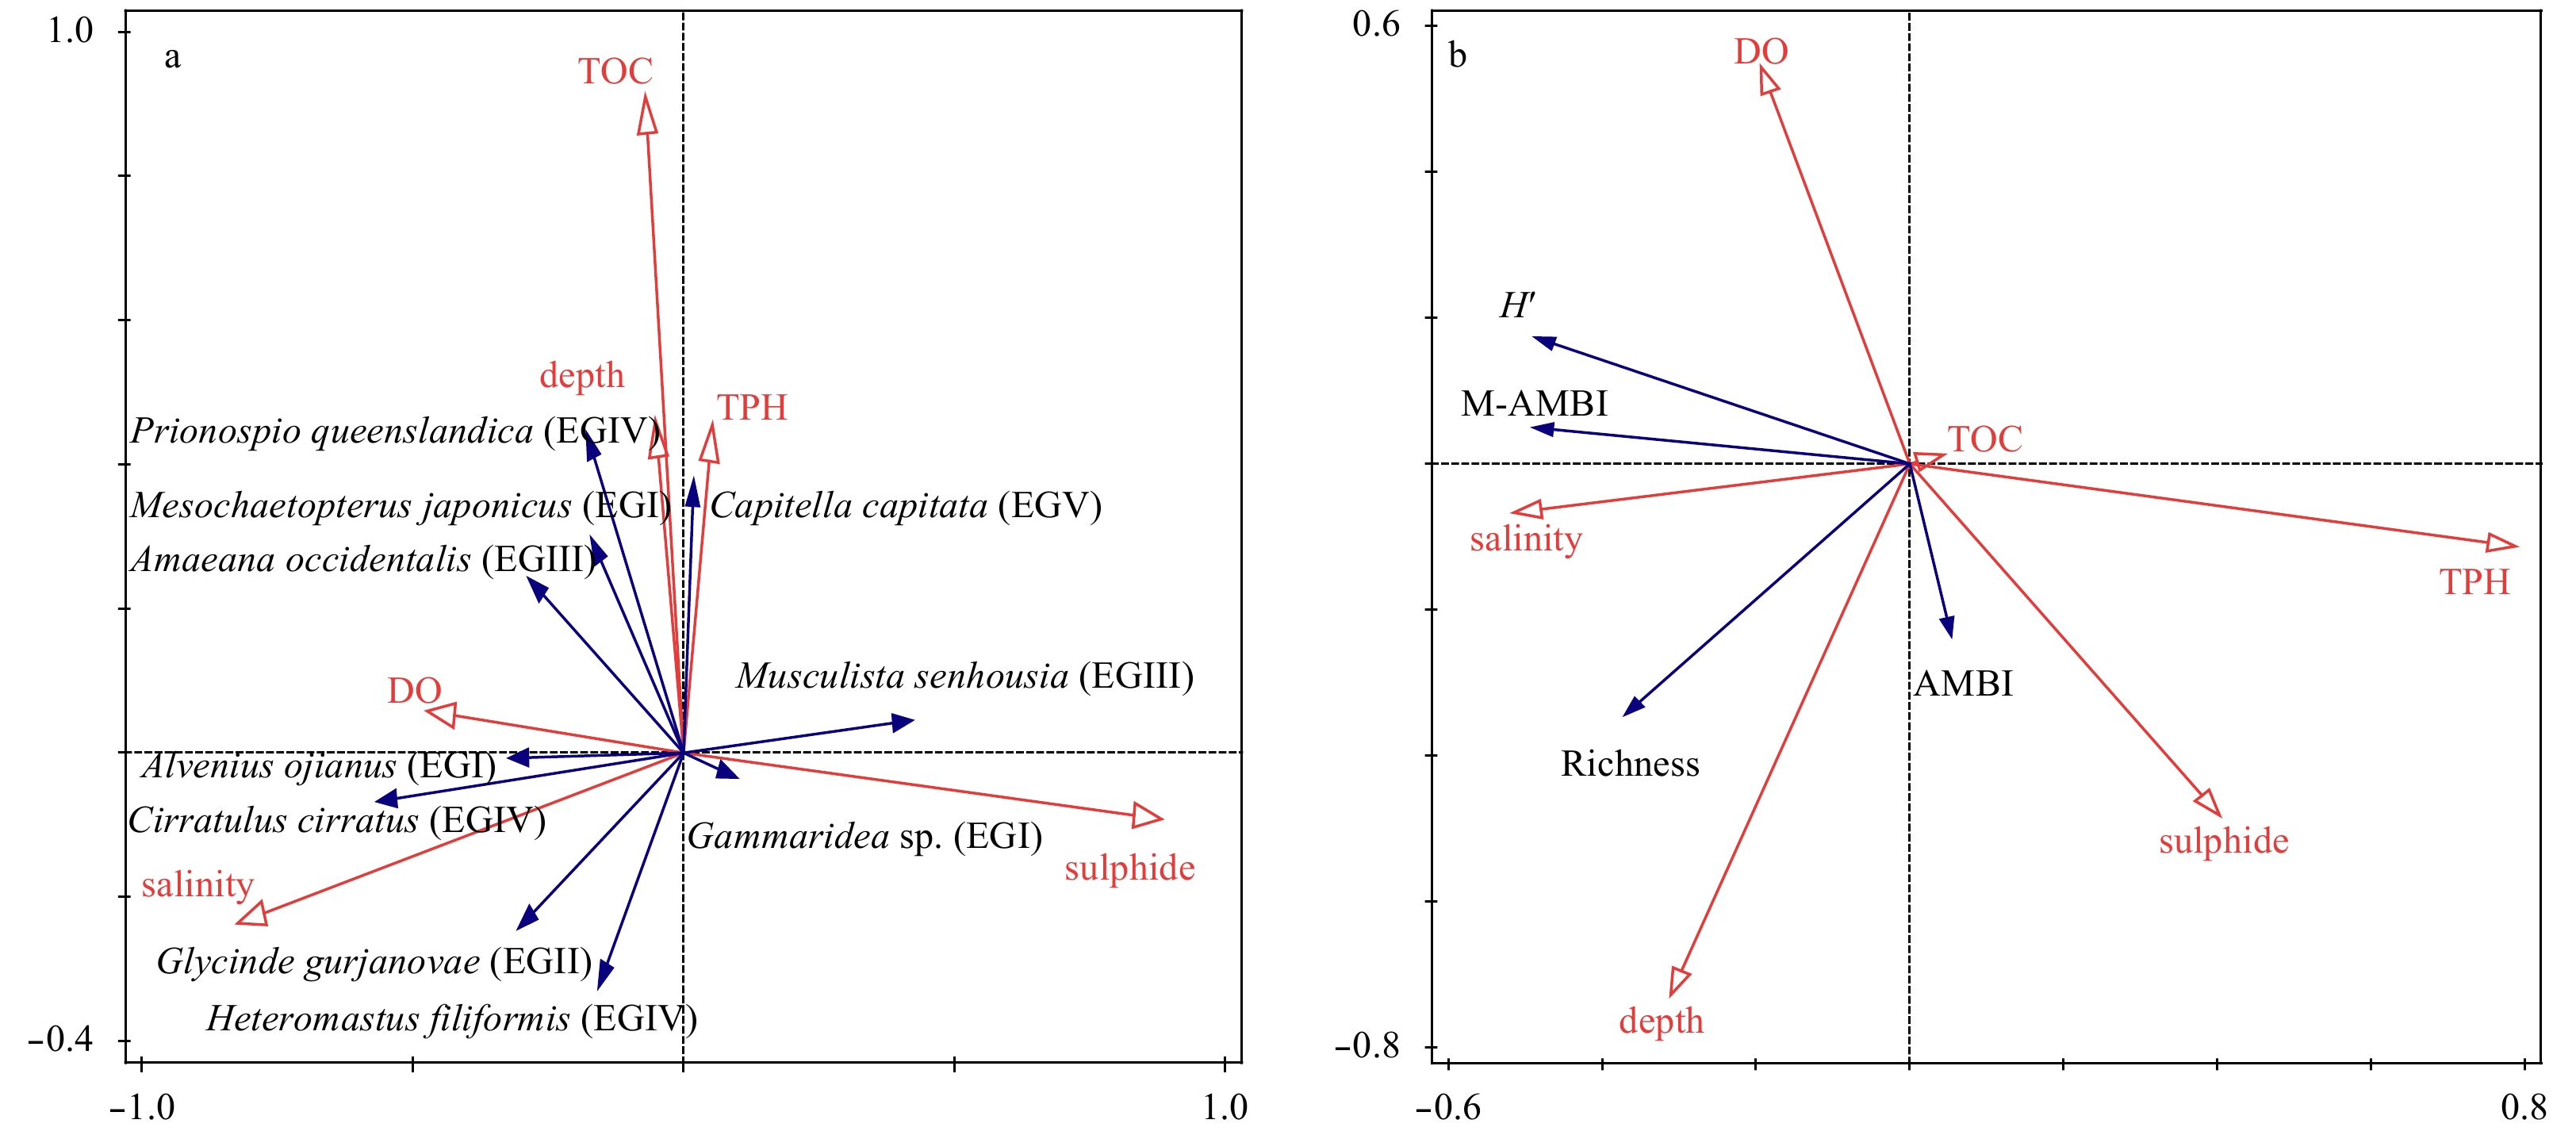
The redundancy analysis (RDA) was performed to explore the relationships between the macrobenthos and the environmental factors in the Laizhou Bay. The relationship between the abundance of dominant species and the environmental factors is demonstrated in the RDA ordination diagram in Fig. 7a. The eigenvalues of the first two RDA ordination axes were 0.687 and 0.604, respectively. Monte Carlo tests for the all ordination axes were highly significant (p=0.004, p<0.05), indicating that the results were credible (Peng et al., 2012). A total of 69.2% of the cumulative variance in the species-environment relation was explained by the first two RDA ordination axes.

The first axis was positively correlated with sulphide but negatively correlated with salinity and DO, while the second axis was positively correlated with TOC, depth and TPH. Arcuatala senhousia was positively correlated with sulphide and negatively correlated with DO. Capitella capitata and Prionospio queenslandica were positively correlated with TOC, depth and TPH. Alvenius ojianus and Cirratulus cirratus were positively correlated with DO and salinity but negatively correlated with sulphide. Heteromastus filiformis and Glycinde gurjanovae were positively correlated with salinity and negatively correlated with TOC, depth and TPH. Arcuatala senhousia, belonging to the EGIII group, has some tolerance to changes in ecological conditions. In the study area, the abundance of Arcuatala senhousia accounted for 64.4% of the total abundance, and this species had the highest dominance. Arcuatala senhousia was sensitive to environmental pollution, which abundance increased with an increase in sulphide content and a decrease in DO content. The H′and M-AMBI could well reflect the state of habitat degradation. The 2 samples in Case II had the high TOC content, which lead to high abundance of Capitella capitata. The pollution indicator species Capitella capitata is the first opportunistic species belonging to the EGV group. The abundance of Capitella capitata increased with an increase in TPH and TOC, which indicated that Capitella capitata responds well to organic pollution in benthic habitats. The AMBI and M-AMBI could well reflect the degradation state. The 1 sample in Case IV had the high TPH content, the abundance of Cirratulus cirratus (EGIV) accounted for more than 70% of the total abundance, and the evaluation result of the three indices were degraded. These were consistent with the chemical contamination of sediments.
The relationship between the biotic indices and environmental factors is indicated by the RDA ordination diagram in Fig. 7b. The eigenvalues of the first two RDA ordination axes were 0.602 and 0.390, respectively. The Monte Carlo tests for all ordination axes were highly significant (p=0.008, p<0.05), which indicated that the results were credible (Peng et al., 2012). A total of 97.0% of the cumulative variance in the species-environment relation was explained by the first two RDA ordination axes. The first axis was positively correlated with sulphide and TPH but negatively correlated with salinity, while the second axis was positively correlated with DO and negatively correlated with depth. The number of macrobenthic species was positively correlated with depth and salinity. H′ and M-AMBI were positively correlated with salinity and negatively correlated with TPH and sulphide. The AMBI was positively correlated with depth, TPH and sulphide but negatively correlated with DO. In the study area, the macrobenthos was sensitive to the salinity gradient. With an increase in salinity, the species richness, H′ and M-AMBI increased, and the benthic habitat quality became better (Luo et al., 2016). The high concentrations of sulphides and TPH in the sediments indicate that the organic pollution in the sedimentary environment is serious. Based on the relationship among the biotic indices, sulphides and TPH, it is obvious that the three indices can well reflect the tendency towards organic pollution in the sedimentary environment. Samples from areas with serious organic pollution and poor habitat quality had low Shannon-Wiener index (H′) and M-AMBI values, but the AMBI value was high (Keeley et al., 2012).
In comparison with European and American countries, water quality management in China mainly relies upon physical and chemical monitoring data. There is still a large gap between biological monitoring and evaluation technologies. However, there is no doubt that the health of biocenoses can directly reflect the ecological water quality. The AMBI, M-AMBI and other biotic indices were initially designed for specific geographical areas and used to evaluate the environmental quality in European coastal waters (Gillett et al., 2015), but these indices have been used in China recently (Li et al., 2017; Luo et al., 2016; Cai et al., 2014). Considering the complexity and diversity of the global offshore environment, these indices need to be applied in different areas and be inter-calibrated with physical, chemical parameters and other biotic indices. According to the assessment of benthic habitat quality in the Laizhou Bay, we found that the results of the H′, which has been widely used to indicate ecological quality in China, and the AMBI and M-AMBI, which were designed to evaluate the ecological status of coastal areas in Europe, were highly consistent in undegraded conditions but showed significant differences in degraded conditions. When the relative abundance of a single species in a sample is too high and the macrobenthic community is imbalanced, the AMBI could overestimate the benthic habitat quality. Similarly, the H′ overestimated the EQS, when the relative abundance of opportunistic species belonging to EGIV and EGV was high. The three biotic indices were sensitive to hydro-chemical and sedimentary chemical parameter gradients, so it could well reflect environmental changes. Arcuatala senhousia and Capitella capitata in the Laizhou Bay could be regarded as indicators, when the environment was disturbed and polluted.
We are grateful to the staff of the North China Sea Branch of Ministry of Natural Resources and the Shandong Marine Resources and Environment Research Institute for assistance with sampling and the analysis of the macrobenthos and environmental parameters in the Laizhou Bay. We especially thank Angél Borja from the Spanish AZTI–Tecnalia Center I for identifying the EGs of the macrobenthic organisms.
| [1] |
Bakalem A, Ruellet T, Dauvin J C. 2009. Benthic indices and ecological quality of shallow Algeria fine sand community. Ecological Indicators, 9(3): 395–408. doi: 10.1016/j.ecolind.2008.05.008
|
| [2] |
Berthelsen A, Atalah J, Clark D, et al. 2018. Relationships between biotic indices, multiple stressors and natural variability in New Zealand estuaries. Ecological Indicators, 85: 634–643. doi: 10.1016/j.ecolind.2017.10.060
|
| [3] |
Borja Á, Dauer D M, Díaz R, et al. 2008. Assessing estuarine benthic quality conditions in Chesapeake Bay: a comparison of three indices. Ecological Indicators, 8(4): 395–403. doi: 10.1016/j.ecolind.2007.05.003
|
| [4] |
Borja Á, Franco J, Muxika I. 2003. Classification tools for marine ecological quality assessment: the usefulness of macrobenthic communities in an area affected by a submarine outfall. In: ICES CM 2003/Session J-02. Vol 2. Copenhagen: ICES, 1–10
|
| [5] |
Borja Á, Franco J, Pérez V. 2000. A marine biotic index to establish the ecological quality of soft-bottom benthos within European estuarine and coastal environments. Marine Pollution Bulletin, 40(12): 1100–1114. doi: 10.1016/S0025-326X(00)00061-8
|
| [6] |
Borja Á, Josefson A B, Miles A, et al. 2007. An approach to the intercalibration of benthic ecological status assessment in the North Atlantic ecoregion, according to the European Water Framework Directive. Marine Pollution Bulletin, 55(1–6): 42–52. doi: 10.1016/j.marpolbul.2006.08.018
|
| [7] |
Borja Á, Muxika I. 2005. Guidelines for the use of AMBI (AZTI’s Marine Biotic Index) in the assessment of the benthic ecological quality. Marine Pollution Bulletin, 50(7): 787–789. doi: 10.1016/j.marpolbul.2005.04.040
|
| [8] |
Borja Á, Tunberg B G. 2011. Assessing benthic health in stressed subtropical estuaries, eastern Florida, USA using AMBI and M-AMBI. Ecological Indicators, 11(2): 295–303. doi: 10.1016/j.ecolind.2010.05.007
|
| [9] |
Brauko K M, Muniz P, de Castro Martins C, et al. 2016. Assessing the suitability of five benthic indices for environmental health assessment in a large subtropical South American estuary. Ecological Indicators, 64: 258–265. doi: 10.1016/j.ecolind.2016.01.008
|
| [10] |
Cai Lizhe, Ma Li, Gao Yang, et al. 2002. Analysis on assessing criterion for polluted situation using species diversity index of marine macrofauna. Journal of Xiamen University (Natural Science) (in Chinese), 41(5): 641–646
|
| [11] |
Cai Wenqian, Borja Á, Liu Lusan, et al. 2014. Assessing benthic health under multiple human pressures in Bohai Bay (China), using density and biomass in calculating AMBI and M-AMBI. Marine Ecology, 35(2): 180–192. doi: 10.1111/maec.12067
|
| [12] |
Cai Wenqian, Meng Wei, Liu Lusan, et al. 2013a. Assessing the benthic ecological status in Yangtze River Estuary using AMBI and M-AMBI. Environment Science (in Chinese), 34(5): 1725–1734
|
| [13] |
Cai Wenqian, Meng Wei, Zhuo Yanzhong, et al. 2013b. Assessing benthic ecological status in stressed Liaodong Bay (China) with AMBI and M-AMBI. Chinese Journal of Oceanology and Limnology, 31(3): 482–492. doi: 10.1007/s00343-013-2177-0
|
| [14] |
Checon H H, Corte G N, Muniz P, et al. 2018. Unraveling the performance of the benthic index AMBI in a subtropical bay: The effects of data transformations and exclusion of low-reliability sites. Marine Pollution Bulletin, 126: 438–448. doi: 10.1016/j.marpolbul.2017.11.059
|
| [15] |
Chen Yaqu, Xu Zhaoli, Wang Yunlong, et al. 1995. An ecological study on zooplankton in plume front zone of Changjiang (Yangtze) river estuarine area I biomass distribution of dominant species. Journal of Fishery Sciences of China (in Chinese), 2(1): 49–58
|
| [16] |
Dauvin J C, Ruellet T. 2009. The estuarine quality paradox: is it possible to define an ecological quality status for specific modified and naturally stressed estuarine ecosystems?. Marine Pollution Bulletin, 59(1–3): 38–47. doi: 10.1016/j.marpolbul.2008.11.008
|
| [17] |
Forchino A, Borja Á, Brambilla F, et al. 2011. Evaluating the influence of off-shore cage aquaculture on the benthic ecosystem in Alghero Bay (Sardinia, Italy) using AMBI and M-AMBI. Ecological Indicators, 11(5): 1112–1122. doi: 10.1016/j.ecolind.2010.12.011
|
| [18] |
Gao Xuelu, Zhuang Wen, Chen C T A, et al. 2015. Sediment quality of the SW coastal Laizhou Bay, Bohai Sea, China: a comprehensive assessment based on the analysis of heavy metals. PLoS One, 10(3): e0122190. doi: 10.1371/journal.pone.0122190
|
| [19] |
Garaffo G V, Jaubet M L, Becherucci M E, et al. 2017. Assessing environmental health using ecological indices for soft bottom in sewage-affected rocky shores: The case of the largest seaside resort of SW Atlantic. Marine Pollution Bulletin, 115(1–2): 233–239. doi: 10.1016/j.marpolbul.2016.12.017
|
| [20] |
General Administration of Quality Supervision, Inspection and Quarantine of the People’s Republic of China. 2004. GB 18668–2002 Marine sediment quality (in Chinese). Beijing: Standards Press of China, 1–2
|
| [21] |
Gillett D J, Weisberg S B, Grayson T, et al. 2015. Effect of ecological group classification schemes on performance of the AMBI benthic index in US coastal waters. Ecological Indicators, 50: 99–107. doi: 10.1016/j.ecolind.2014.11.005
|
| [22] |
Halpern B S, Longo C, Hardy D, et al. 2012. An index to assess the health and benefits of the global ocean. Nature, 488(7413): 615–620. doi: 10.1038/nature11397
|
| [23] |
Jiang Shenghui, Zhu Longhai, Hu Rijun, et al. 2015. The hydrodynamic response to reclamation in Laizhou Bay. Periodical of Ocean University of China (in Chinese), 45(10): 74–80
|
| [24] |
Keeley N B, Forrest B M, Crawford C, et al. 2012. Exploiting salmon farm benthic enrichment gradients to evaluate the regional performance of biotic indices and environmental indicators. Ecological Indicators, 23: 453–466. doi: 10.1016/j.ecolind.2012.04.028
|
| [25] |
Labrune C, Amouroux J M, Sarda R, et al. 2006. Characterization of the ecological quality of the coastal Gulf of Lions (NW Mediterranean). A comparative approach based on three biotic indices. Marine Pollution Bulletin, 52(1): 34–47
|
| [26] |
Li Baoquan, Li Xiaojing, Bouma T J, et al. 2017. Analysis of macrobenthic assemblages and ecological health of Yellow River Delta, China, using AMBI & M-AMBI assessment method. Marine Pollution Bulletin, 119(2): 23–32. doi: 10.1016/j.marpolbul.2017.03.044
|
| [27] |
Liu Xiaoshou, Zhao Rui, Hua Er, et al. 2014. Macrofaunal community structure in the Laizhou Bay in summer and the comparison with historical data. Marine Science Bulletin (in Chinese), 33(3): 283–292
|
| [28] |
Luo Xianxiang, Lin Song, Yang Jianqiang, et al. 2017. Benthic habitat quality assessment based on biological indices in Xiaoqing River estuary and its adjacent sea of Laizhou Bay, China. Journal of Ocean University of China, 16(3): 537–546. doi: 10.1007/s11802-017-3038-9
|
| [29] |
Luo Xianxiang, Sun Kaijing, Yang Jianqiang, et al. 2016. A comparison of the applicability of the Shannon-Wiener index, AMBI and M-AMBI indices for assessing benthic habitat health in the Huanghe (Yellow River) Estuary and adjacent areas. Acta Oceanologica Sinica, 35(6): 50–58. doi: 10.1007/s13131-016-0842-9
|
| [30] |
Luo Xianxiang, Zhang Juan, Yang Jianqiang, et al. 2014. Assessing the benthic habitat quality in the Huanghe (Yellow River) Estuary and its adjacent areas using AMBI and M-AMBI. Acta Oceanologica Sinica, 33(9): 117–124. doi: 10.1007/s13131-014-0522-6
|
| [31] |
Mulik J, Sukumaran S, Srinivas T, et al. 2017. Comparative efficacy of benthic biotic indices in assessing the Ecological Quality Status (EcoQS) of the stressed Ulhas estuary, India. Marine Pollution Bulletin, 120(1–2): 192–202. doi: 10.1016/j.marpolbul.2017.05.014
|
| [32] |
Muxika I, Borja Á, Bald J. 2007. Using historical data, expert judgement and multivariate analysis in assessing reference conditions and benthic ecological status, according to the European Water Framework Directive. Marine Pollution Bulletin, 55(1–6): 16–29. doi: 10.1016/j.marpolbul.2006.05.025
|
| [33] |
Pearson T H, Rosenberg R. 1978. Macrobenthic succession in relation to organic enrichment and pollution of the marine environment. Oceanography and Marine Biology Annual Review, 16: 229–311
|
| [34] |
Peng Shitao, Qin Xuebo, Shi Honghua, et al. 2012. Distribution and controlling factors of phytoplankton assemblages in a semi-enclosed bay during spring and summer. Marine Pollution Bulletin, 64(5): 941–948. doi: 10.1016/j.marpolbul.2012.03.004
|
| [35] |
Pitacco V, Lipej L, Mavrič B, et al. 2018. Comparison of benthic indices for the evaluation of ecological status of three Slovenian transitional water bodies (northern Adriatic). Marine Pollution Bulletin, 129(2): 813–821. doi: 10.1016/j.marpolbul.2017.10.085
|
| [36] |
Qiu Baochao, Zhong Xin, Liu Xiaoshou. 2018. Assessment of the benthic ecological status in the adjacent waters of Yangtze River Estuary using marine biotic indices. Marine Pollution Bulletin, 137: 104–112. doi: 10.1016/j.marpolbul.2018.10.006
|
| [37] |
Shannon C E, Weaver W W. 1963. The Mathematical Theory of Communication. Urbana: University of Illinois
|
| [38] |
Sigamani S, Perumal M, Arumugam S, et al. 2015. AMBI indices and multivariate approach to assess the ecological health of Vellar-Coleroon estuarine system undergoing various human activities. Marine Pollution Bulletin, 100(1): 334–343. doi: 10.1016/j.marpolbul.2015.08.028
|
| [39] |
Simboura N, Reizopoulou S. 2007. A comparative approach of assessing ecological status in two coastal areas of Eastern Mediterranean. Ecological Indicators, 7(2): 455–468. doi: 10.1016/j.ecolind.2006.05.003
|
| [40] |
Šmilauer P, Lepš J. 2014. Multivariate Analysis of Ecological Data Using CANOCO 5. 2nd ed. Cambridge: Cambridge University Press
|
| [41] |
Song Debin, Gao Zhiqiang, Zhang Hua, et al. 2017a. GIS-based health assessment of the marine ecosystem in Laizhou Bay, China. Marine Pollution Bulletin, 125(1–2): 242–249. doi: 10.1016/j.marpolbul.2017.08.027
|
| [42] |
Song Qiaochu, Zou Xinqing, Zhang Hu, et al. 2017b. An approach based on M-AMBI for assessing benthic ecological status of a broad intertidal zone: A case study in the Jiangsu intertidal zone, China. Marine Pollution Bulletin, 116(1–2): 87–94. doi: 10.1016/j.marpolbul.2016.12.066
|
| [43] |
Sun Yuanmin, Chen Bin, Wu Haiyan, et al. 2018. Assessing benthic ecological status in subtropical islands, China using AMBI and Bentix indices. Estuarine, Coastal and Shelf Science, 207: 345–350. doi: 10.1016/j.ecss.2017.11.033
|
| [44] |
Vačkář D, ten Brink B, Loh J, et al. 2012. Review of multispecies indices for monitoring human impacts on biodiversity. Ecological Indicators, 17: 58–67. doi: 10.1016/j.ecolind.2011.04.024
|
| [45] |
Weisberg S B, Ranasinghe J A, Dauer D M, et al. 1997. An Estuarine Benthic Index of Biotic Integrity (B-IBI) for Chesapeake Bay. Estuaries, 20(1): 149–158. doi: 10.2307/1352728
|
| [46] |
Word J Q. 1978. The infaunal trophic index. In: Annual Report 1978. Los Angeles, California: Southern California Coastal Water Research Project, 19-41
|
| [47] |
Xu Li, Wang Tieyu, Wang Jihua, et al. 2017. Occurrence, speciation and transportation of heavy metals in 9 coastal rivers from watershed of Laizhou Bay, China. Chemosphere, 173: 61–68. doi: 10.1016/j.chemosphere.2017.01.046
|
| [48] |
Yang Jianqiang, Zhu Yonggui, Song Wenpeng, et al. 2014. The eco-environmental evaluation based on habitat quality and ecological response of Laizhou Bay. Acta Ecologica Sinica (in Chinese), 34(1): 105–114
|
| [49] |
Zhang Ying, Liu Yuanjin, Zhang Ying, et al. 2012. Ecological characteristics of benthic polychaete community and its responses to environmental change in Laizhou Bay, Shandong Province of East China. Chinese Journal of Ecology (in Chinese), 31(4): 888–895
|
| [50] |
Zhang Anguo, Wang Lili, Zhao Shilan, et al. 2017. Heavy metals in seawater and sediments from the northern Liaodong Bay of China: Levels, distribution and potential risks. Regional Studies in Marine Science, 11: 32–42. doi: 10.1016/j.rsma.2017.02.002
|
| [51] |
Zhuang Wen, Gao Xuelu. 2015. Distributions, sources and ecological risk assessment of arsenic and mercury in the surface sediments of the southwestern coastal Laizhou Bay, Bohai Sea. Marine Pollution Bulletin, 99(1–2): 320–327. doi: 10.1016/j.marpolbul.2015.07.037
|
| 1. | Jian Liang, Chae-Woo Ma, Kwang-Bae Kim, et al. Can the Ecological Quality of Several Bays in South Korea Be Accurately Assessed Using Multiple Benthic Biotic Indices?. Journal of Marine Science and Engineering, 2024, 12(7): 1179. doi:10.3390/jmse12071179 | |
| 2. | Jian Liang, Chae-Woo Ma, Dae-Sun Son. Using the Heavy Metal and Biotic Indices to Assess Ecological Quality in the Central Area of the East Sea, South Korea. Water, 2024, 16(9): 1230. doi:10.3390/w16091230 | |
| 3. | Xin Gao, Wen Li, Yunlei Zhang, et al. Integrated Assessment of Ecological Quality Combining Biological and Environmental Data in the Yellow River Estuary. Water, 2024, 16(11): 1615. doi:10.3390/w16111615 | |
| 4. | Jian-Yu Dong, Xuefeng Wang, Gorka Bidegain, et al. Assessment of the benthic ecological quality status (EcoQs) of Laizhou Bay (China) with an integrated AMBI, M−AMBI, BENTIX, BO2A and feeding evenness index. Ecological Indicators, 2023, 153: 110456. doi:10.1016/j.ecolind.2023.110456 | |
| 5. | Chen Song, Runxuan Yan, Maowang Jiang, et al. Testing the applicability of marine biotic indices for ecological quality in the northern East China Sea. Journal of Sea Research, 2023, 195: 102441. doi:10.1016/j.seares.2023.102441 | |
| 6. | Hai-Yan Wu, Shi-Feng Fu, Wen-Jia Hu, et al. Response of different benthic biotic indices to eutrophication and sediment heavy metal pollution, in fujian coastal water, East China sea. Chemosphere, 2022, 307: 135653. doi:10.1016/j.chemosphere.2022.135653 | |
| 7. | Anguo Zhang, Yanbin Gu, Xiutang Yuan, et al. Benthic Habitat Quality Assessment in Estuarine Intertidal Flats Based on Long-Term Data with Focus on Responses to Eco-Restoration Activity. Water, 2022, 14(23): 3846. doi:10.3390/w14233846 | |
| 8. | Yun-Wen Liu, Liang Zhao, Gui-Rong Tan, et al. Evaluation of multidimensional simulations of summer air temperature in China from CMIP5 to CMIP6 by the BCC models: From trends to modes. Advances in Climate Change Research, 2022, 13(1): 28. doi:10.1016/j.accre.2021.12.001 | |
| 9. | Heidy Q. Dias, Soniya Sukumaran, Jyoti Mulik, et al. Ecological quality status assessment of tropical estuaries with benthic indices using differently derived reference conditions. Marine Pollution Bulletin, 2022, 177: 113457. doi:10.1016/j.marpolbul.2022.113457 | |
| 10. | Sheng Zhang, Guoxiang Han, Ran Yu, et al. The Sustainable Development Path of the Gold Exploration and Mining of the Sanshan Island-Jiaojia Belt in Laizhou Bay: A DID-SVAR Approach. Sustainability, 2021, 13(21): 11648. doi:10.3390/su132111648 | |
| 11. | Jian-Yu Dong, Xin Sun, Yuyang Zhang, et al. Assessing benthic habitat ecological quality using four benthic indices in the coastal waters of Sanshandao, Laizhou Bay, China. Ecological Indicators, 2021, 129: 107980. doi:10.1016/j.ecolind.2021.107980 | |
| 12. | Swades Pal, Swapan Talukdar, Ripan Ghosh. Damming effect on habitat quality of riparian corridor. Ecological Indicators, 2020, 114: 106300. doi:10.1016/j.ecolind.2020.106300 |

Figures(7) / Tables(3)

Supported by:
Beijing Renhe Information Technology Co. Ltd

Li Wang, Xianxiang Luo, Jianqiang Yang, Juan Zhang, Yuqing Fan, Jiayu Shen. Assessing benthic habitat quality using biotic indices in the Laizhou Bay, China[J]. Acta Oceanologica Sinica, 2020, 39(2): 49-58. doi: 10.1007/s13131-020-1552-x

| H′ | AMBI | M-AMBI | Benthic community health | Site disturbance classification | EQS |
| H′>3 | 0<AMBI≤1.2 | >0.77 | normal/impoverished | undisturbed | High |
| 2<H′≤3 | 1.2<AMBI≤3.3 | 0.53–0.77 | unbalanced | slightly disturbed | Good |
| 1<H′≤2 | 3.3<AMBI≤4.3 | 0.38–0.53 | transitional to pollution | moderately disturbed | Moderate |
| 0<H′≤1 | 4.3<AMBI≤5.5 | 0.20–0.38 | polluted/transitional to heavy pollution | heavily disturbed | Poor |
| H′=0 | 5.5<AMBI≤7.0 | <0.20 | heavy polluted/azoic | extremely disturbed | Bad |
DownLoad:
CSV
| Dominant species | Ecological group | Dominance | |||
| Aug. 2011 | Aug. 2012 | Aug. 2013 | Aug. 2014 | ||
| Mesochaetopterus japonicus | EGI | 0.026 | 0.186 | + | + |
| Alvenius ojianus | EGI | 0.043 | + | + | + |
| Gammaridea sp. | EGI | + | 0.028 | + | + |
| Glycinde gurjanovae | EGII | 0.039 | + | + | + |
| Amaeana occidentalis | EGIII | 0.022 | + | + | + |
| Arcuatala senhousia | EGIII | 0.168 | 0.134 | 0.819 | 0.601 |
| Cirratulus cirratus | EGIV | 0.063 | 0.023 | – | + |
| Prionospio queenslandica | EGIV | – | 0.020 | + | + |
| Heteromastus filiformis | EGIV | + | + | + | 0.028 |
| Capitella capitata | EGV | + | 0.107 | + | – |
| Note: + and – indicate the dominant species present or absent during the different cruises. | |||||
DownLoad:
CSV
| Case | Case I | Case II | Case III | Case IV |
| Characteristic | The sum of the relative abundances of EGI, EGII and EGIII was more than 50%, and the abundance of a single species accounted for more than 50% of the total abundance. | The sum of the relative abundances of EGI, EGII and EGIII was more than 50%, and the abundance of Arcuatala senhousia (EGIII) accounted for more than 50% of the total abundance. | The sum of the relative abundances of EGIV and EGV was more than 50%, and the abundance of Capitella capitata (EGV) accounted for 40% to 50% of the total abundance. | The sum of the relative abundances of EGIV and EGV was more than 50%, and the abundance of Cirratulus cirratus (EGIV) accounted for more than 70% of the total abundance. |
| Number of samples | 39 | 10 | 2 | 1 |
| The evaluation of the H′ | 100% of the samples were undegraded. | 10% of the samples were undegraded; 90% of the samples were degraded. | 100% of the samples were undegraded. | 100% of the samples were degraded. |
| The evaluation of the AMBI | 100% of the samples were undegraded. | 100% of the samples were undegraded. | 100% of the samples were degraded. | 100% of the samples were degraded. |
| The evaluation of the M-AMBI | 100% of the samples were undegraded. | 20% of the samples were undegraded; 80% of the samples were degraded. | 100% of the samples were degraded. | 100% of the samples were degraded. |
DownLoad:
CSV
| H′ | AMBI | M-AMBI | Benthic community health | Site disturbance classification | EQS |
| H′>3 | 0<AMBI≤1.2 | >0.77 | normal/impoverished | undisturbed | High |
| 2<H′≤3 | 1.2<AMBI≤3.3 | 0.53–0.77 | unbalanced | slightly disturbed | Good |
| 1<H′≤2 | 3.3<AMBI≤4.3 | 0.38–0.53 | transitional to pollution | moderately disturbed | Moderate |
| 0<H′≤1 | 4.3<AMBI≤5.5 | 0.20–0.38 | polluted/transitional to heavy pollution | heavily disturbed | Poor |
| H′=0 | 5.5<AMBI≤7.0 | <0.20 | heavy polluted/azoic | extremely disturbed | Bad |
| Dominant species | Ecological group | Dominance | |||
| Aug. 2011 | Aug. 2012 | Aug. 2013 | Aug. 2014 | ||
| Mesochaetopterus japonicus | EGI | 0.026 | 0.186 | + | + |
| Alvenius ojianus | EGI | 0.043 | + | + | + |
| Gammaridea sp. | EGI | + | 0.028 | + | + |
| Glycinde gurjanovae | EGII | 0.039 | + | + | + |
| Amaeana occidentalis | EGIII | 0.022 | + | + | + |
| Arcuatala senhousia | EGIII | 0.168 | 0.134 | 0.819 | 0.601 |
| Cirratulus cirratus | EGIV | 0.063 | 0.023 | – | + |
| Prionospio queenslandica | EGIV | – | 0.020 | + | + |
| Heteromastus filiformis | EGIV | + | + | + | 0.028 |
| Capitella capitata | EGV | + | 0.107 | + | – |
| Note: + and – indicate the dominant species present or absent during the different cruises. | |||||
| Case | Case I | Case II | Case III | Case IV |
| Characteristic | The sum of the relative abundances of EGI, EGII and EGIII was more than 50%, and the abundance of a single species accounted for more than 50% of the total abundance. | The sum of the relative abundances of EGI, EGII and EGIII was more than 50%, and the abundance of Arcuatala senhousia (EGIII) accounted for more than 50% of the total abundance. | The sum of the relative abundances of EGIV and EGV was more than 50%, and the abundance of Capitella capitata (EGV) accounted for 40% to 50% of the total abundance. | The sum of the relative abundances of EGIV and EGV was more than 50%, and the abundance of Cirratulus cirratus (EGIV) accounted for more than 70% of the total abundance. |
| Number of samples | 39 | 10 | 2 | 1 |
| The evaluation of the H′ | 100% of the samples were undegraded. | 10% of the samples were undegraded; 90% of the samples were degraded. | 100% of the samples were undegraded. | 100% of the samples were degraded. |
| The evaluation of the AMBI | 100% of the samples were undegraded. | 100% of the samples were undegraded. | 100% of the samples were degraded. | 100% of the samples were degraded. |
| The evaluation of the M-AMBI | 100% of the samples were undegraded. | 20% of the samples were undegraded; 80% of the samples were degraded. | 100% of the samples were degraded. | 100% of the samples were degraded. |
 DownLoad: