College of Mathematics and Physics, Beijing University of Chemical Technology, Beijing 100029, China
2.
Beijing Key Laboratory of Environmentally Harmful Chemicals Analysis, Beijing University of Chemical Technology, Beijing 100029, China
Funds:
The National Natural Science Foundation of China under contract No. 61471024; the National Marine Technology Program for Public Welfare under contract No. 201505002.
A new paradigm for ship detection in polarimetric synthetic aperture radar (Pol-SAR) image is presented. We firstly utilize the scattering similarity parameters to investigate the differences of scattering mechanism between ships and sea clutter. Based on these differences, we propose a novel ship detection metric, denoted as the scattering similarity based metric (SSM), to conduct ship detection task. The distribution model of SSM metric is investigated and modeled by kernel density estimation (KDE). Based on the statistical distribution, an adaptive constant false alarm rate (CFAR) detection scheme is implemented. We compare the proposed SSM with two classic polarimetric metrics, i.e., the polarimetric cross-entropy (PCE) and the reflection symmetry metric (RSM). The experimental results conducted on C-band RADARSAT-2 Pol-SAR data demonstrate the feasibility and advantage of the proposed SSM metric both in sea clutter modeling and in ship detection.
Ship detection plays an important role in the field of marine surveillance applications, such as fisheries management, search and rescue of vessels, and pollution monitoring (Lang et al., 2014). The synthetic aperture radar (SAR), due to the ability to image through cloud cover and independence of illumination, together with a fine spatial resolution, has become the key remote sensing tool to observe metallic targets at sea. With the development of sensor techniques, advanced polarimetric SAR (Pol-SAR) systems, which contain multiple channels, provide a more complete description of target scattering behavior than traditional single-channel SAR systems. Recent years, ship detection using Pol-SAR data has drawn much attention (Wang et al., 2015).
The literature focusing on ship detection techniques based on Pol-SAR data is extensive. A recent survey of ship detection techniques can be found in (Ouchi, 2016). Fundamentally, polarimetric analysis techniques can be divided into two categories: one exploits different polarimetric channels as independent measurements for the same scene (Wang et al., 2015); the other constructs a specific measurement metric that can jointly exploit information from polarimetric data and then be linked to a decision criterion (Liu et al., 2005). The latter is rather popular. The key issue is the construction of a reasonable and feasible metric based on the scattering differences of the physical characteristics between sea clutter and ships.
The polarimetric scattering similarity parameter proposed by Yang et al. (2001) is an effective and convenient method to understand the scatterer. By checking the similarity between a given scatterer and some other canonical scatterers, a direct characterization of the scatterer can be obtained. However, Yang’s parameter can only measure the similarity between two single scatterers. To overcome this shortcoming, a random similarity parameter is proposed by Li et al., which can measure the similarity of any two scatterers (Li and Zhang, 2015). In this paper, we utilize Li’s parameter to analyze the scattering mechanism of ships and sea clutter. The experimental results reveal the differences between them. Based on these differences, a novel metric denoted as the scattering similarity based metric (SSM) is proposed for ship detection. Then the probability density function (PDF) of SSM is modeled by the method of the kernel density estimation (KDE), which yields much smaller bias than some widely used fitting methods. Based on the statistical model, the constant false alarm rate (CFAR) detection is conducted. Experiments performed on the RADARSAT-2 Pol-SAR data demonstrate the effectiveness of the new metric and the usefulness of the model for practical ship detection applications.
2.
Data and methods
2.1
Scattering mechanism analysis
As for a given mixed scatterer T and a canonical mixed scatterer Tc, the similarity parameters modified by Li and Zhang (2015) can be defined as
where Trace (·) denotes the operation of matrix trace, superscript H denotes the operation of conjugate transpose. According to Eq. (1) and the coherence matrix of canonical scatterer, the similarity parameters corresponding to the different canonical targets can be derived and listed in Table 1.
We utilize two real SAR images as shown in Fig. 1 to analyze the SSM between ships and sea clutter. A Pol-SAR data set acquired by RADARSAT-2 is processed to analyze the scattering mechanism of ships and sea clutter and validate the proposed method in this paper. The detailed information of Data#1 and Data#2 is listed in Table 2.
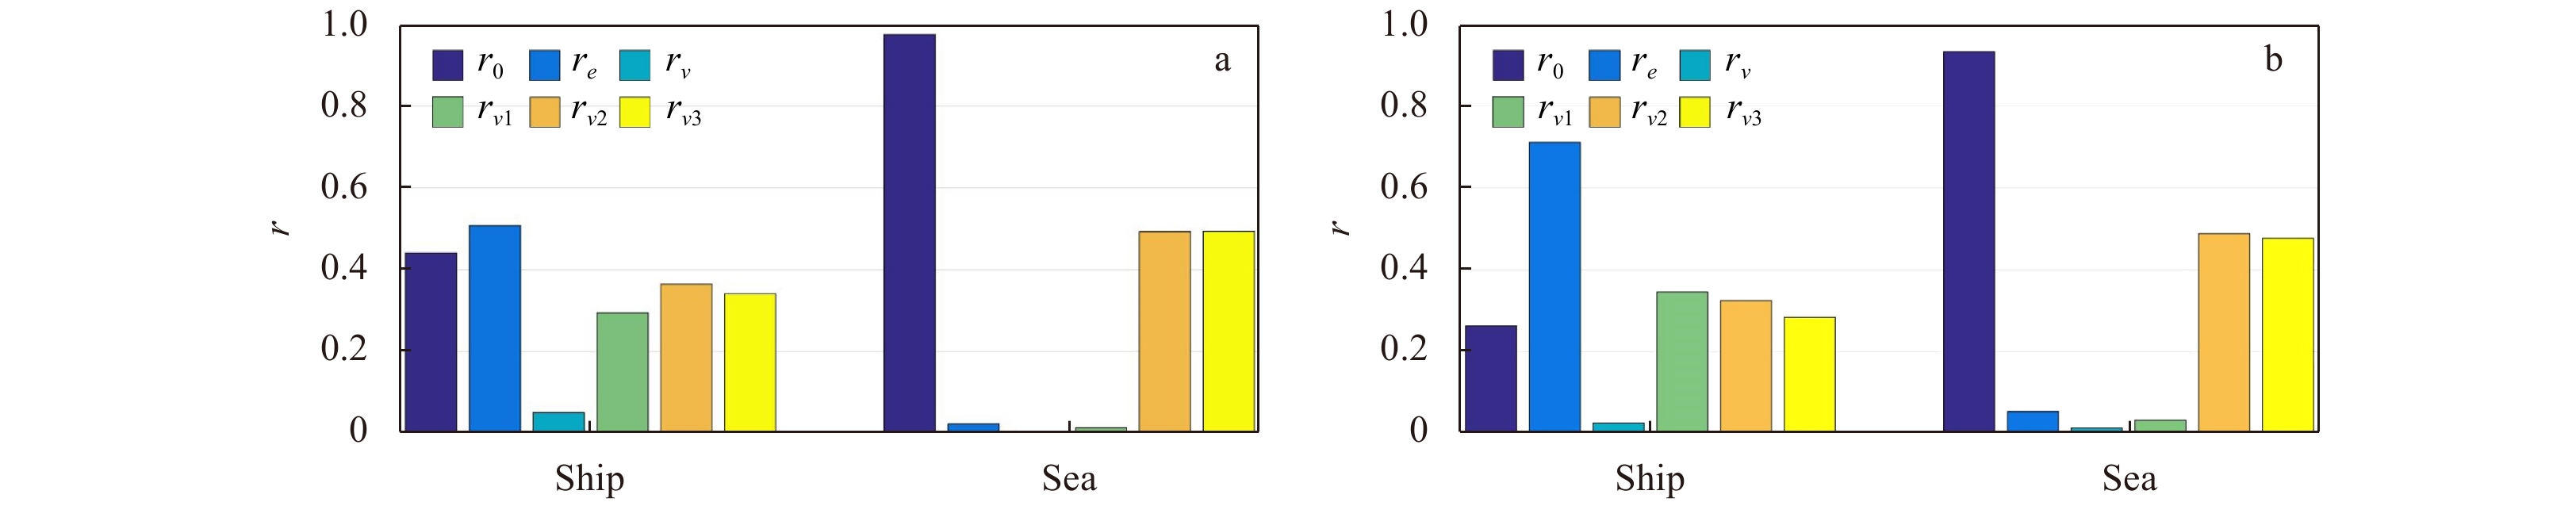
In order to statistically analyze the scattering mechanism of ships and sea clutter, we first manually sampled the pixel of ships and sea in two SAR images. After the sampling is completed, according to the similarity parameters corresponding to the different canonical targets as shown in Table 1, we calculate the similarity parameters of each pixel corresponding to the odd-bounce scatterers, the even-bounce scatterers, the volume scatterers, and the extension volume scatterers, respectively. Then we calculate the average values of the similarity parameters of the pixels belonging to ships and sea clutter separately. The results are shown in Fig. 2. In the process of sampling, we acquire more than 105 sampling points of ships and more than 106 sampling pixels of sea clutter on each SAR image, to ensure the validity of the statistical results.
Figure
2.
Main scattering mechanism analysis of the Data#1 (a) and Data#2 (b).
According to Fig. 2, as the extension of rv, the parameter rv1, rv2 and rv3 is competent to model the highly random volume scattering resulted from the even-bounce and odd-bounce structures. They are not competitive but cooperative. The mean of these parameters belonging to ships and sea clutter is calculated respectively. As shown in Fig. 2, for ro, re and rv, ships are dominated by ro and re, while sea clutter is dominated by ro, which is much larger than that of ships. Although both ships and sea are not dominated by rv, rv for ships are slightly larger than that for sea clutter; for rv1, rv2 and rv3, sea clutter is dominated by rv2 and rv3, ships are dominated by them all at the same time, and rv1 of ships is larger than that of sea clutter obviously. The reason behind the phenomenon above is that the even-bounce scattering of ships may mainly attributed to the dihedral reflectors, such as the deck-hatch, deck-cargo handling gears structure (Xi et al., 2017), while the volume scattering is mainly caused by some complex structures on board; the odd bounce, for ships, may mainly be contributed by the trihedral and the flat structure, the odd bounce for the rather rough sea surface is mainly caused by the Bragg scattering
2.2
Detection metric
As analyzed above, the scattering similarity parameters reveal the differences between ships and sea background, which motivates us to construct a metric for ship detection. The re, rv and rv1 of ships are larger than those of sea clutter, while the ro, rv2 and rv3 of sea clutter are larger than those of ships, therefore a new ship metric can be constructed as Eq. (2). Obviously, the SSM of ships is much larger than that of sea clutter, which can improve the ship-sea contrast effectively. In Eq. (2), λ3 is the third eigenvalue of the coherency matrix which can discriminate the system noise (Sun et al., 2012).
As we can see, the sum of the polarimetric scattering similarity parameters corresponding to odd-bounce, even-bounce and volume scattering is equal to one. Theoretically, this indicates the combination of ro, re and rv can achieve a good cover of the scattering mechanism; thus good characterization is guaranteed. In other words, the scattering mechanism of each scatterer can be fully represented by them. Another similar case is the polarimetric scattering similarity parameters rv1, rv2 and rv3. On the other hand, the metric constructed by these two sets of the similarity parameters meets the law of conservation of energy.
2.3
Kernel density estimation
To implement the CFAR technique according to the SSM, a crucial and fundamental issue is to develop a precise and effective distribution to model the SSM. Kernel density estimation (KDE) is a nonparametric procedure for probability density modeling, which has been widely and successfully used in various fields (Bors and Nasios, 2009). In KDE, a kernel function is assigned to each data sample $\left\{ {{X_i},} \right.\left. {i = 1, 2,\cdots,N} \right\}$, and the probability density function (PDF) that represents these data is approximated by
where κ is the kernel function, and h is the kernel bandwidth. The kernel function and bandwidth are two fundamental parameters that control the smoothness and modeling ability of the KDE. We follow the existing studies and choose the Gaussian as the kernel function due to its properties of approximation and for having the derivatives of all orders defined over the entire space (Jones et al., 1996). A classical bandwidth estimation method derives from minimizing the error between the underlying distribution and its estimation (Sheather, 2004), and the optimal bandwidth can be obtained
where σ is the standard deviation of the given data $\left\{ {{X_i},} \right.i\left. { = 1, 2,\cdots,{N}} \right\}$.
3.
Experiments
3.1
Experiments data
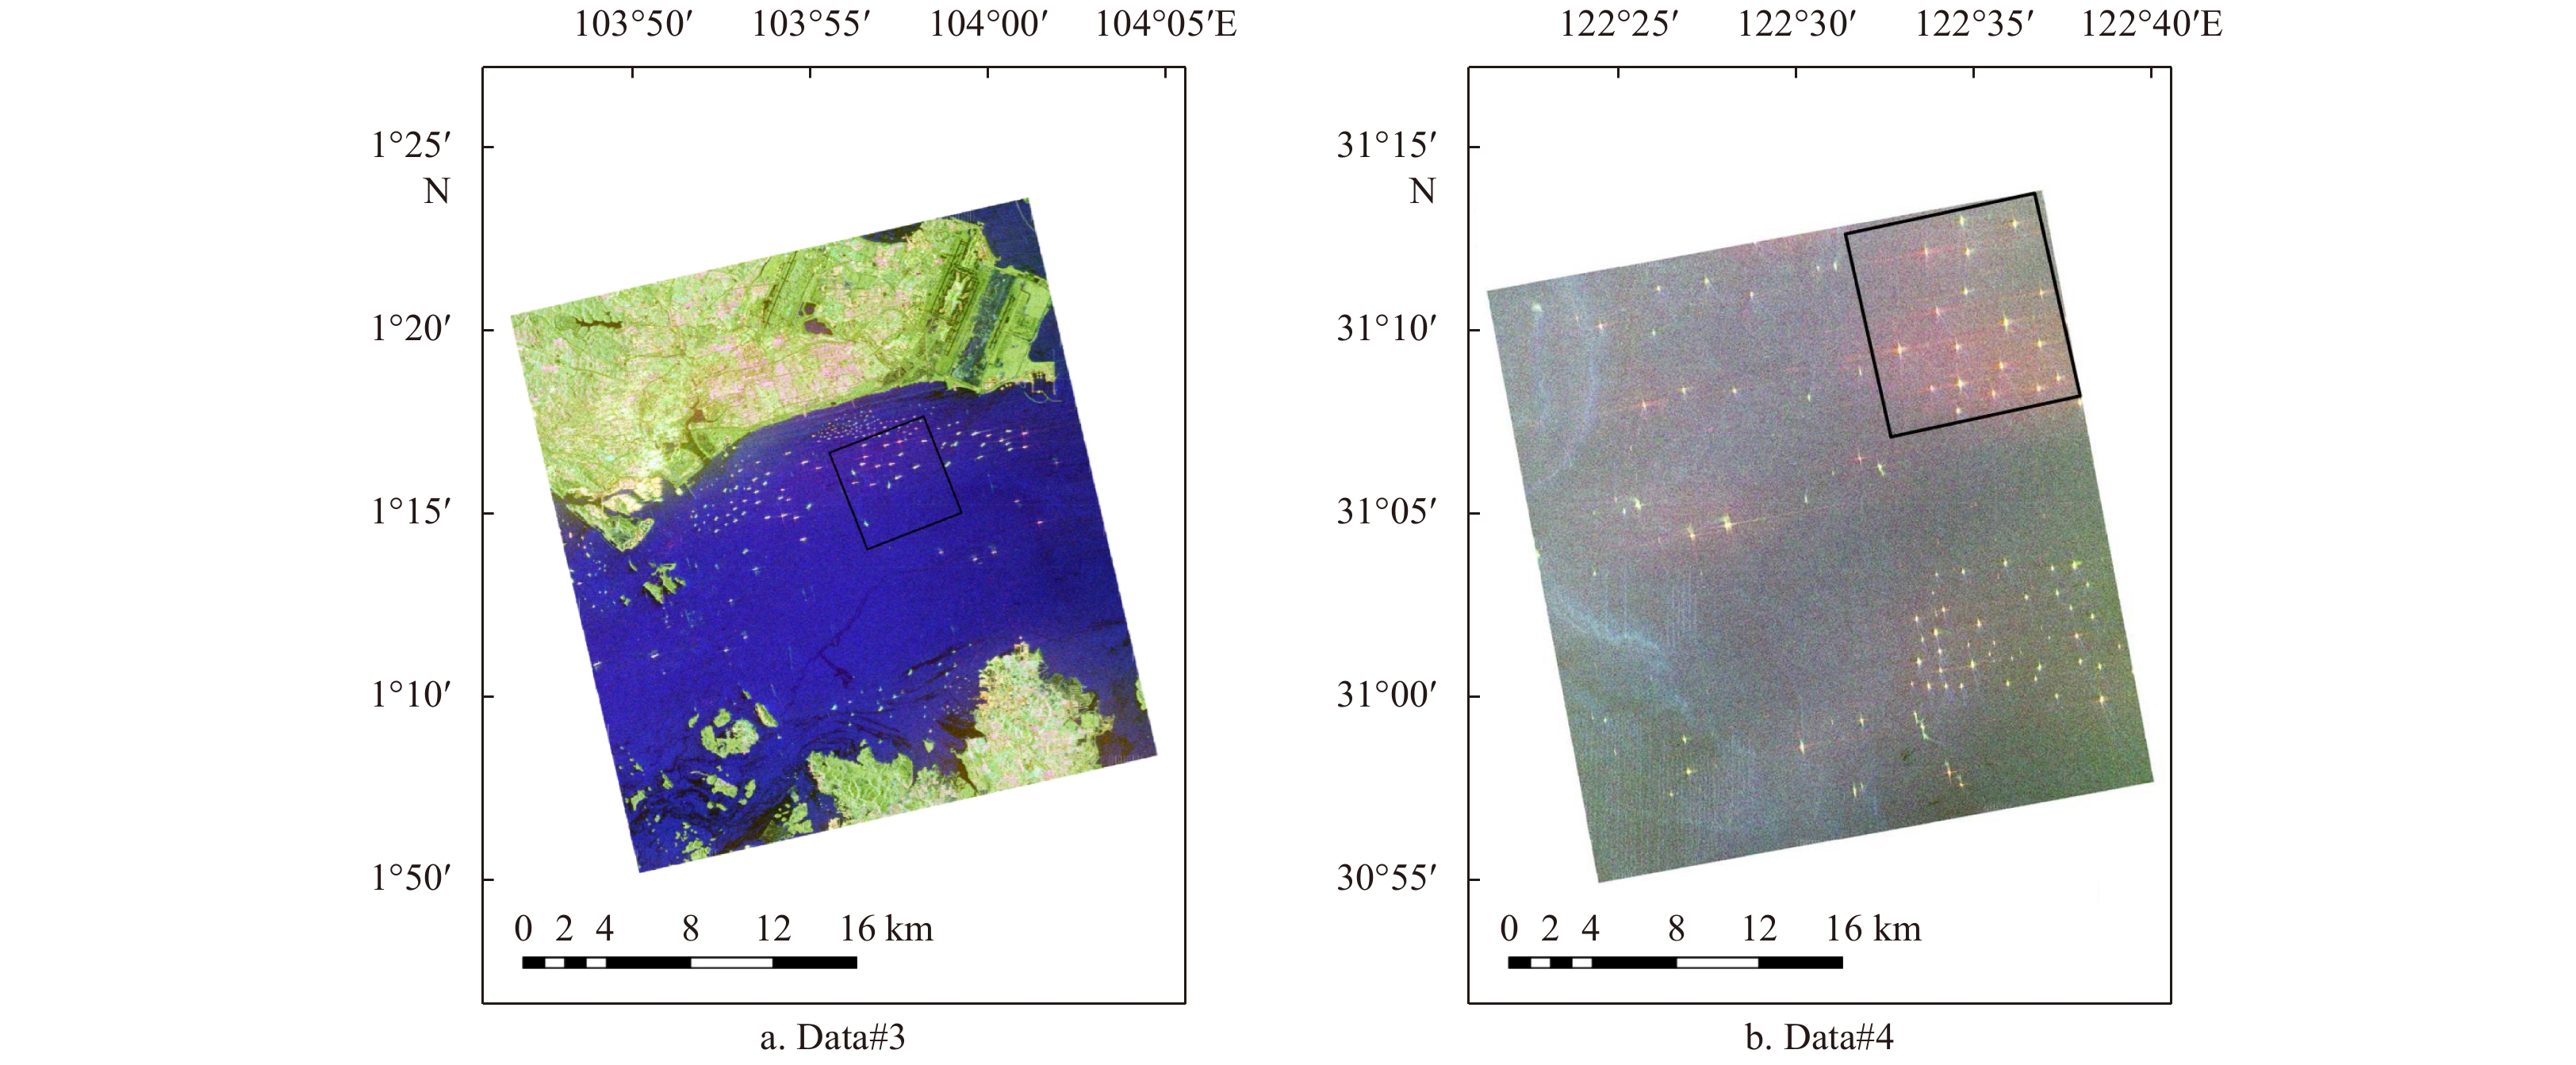
We utilize two real SAR images as shown in Fig. 3 to test the fitting performance and detection performance of the method we proposed. The detailed information of two SAR images is listed in the Table 3. Data#3 is a multi-look PolSAR data with 3-look in azimuth direction and 1-look in range direction while Data#4 is a multi-look PolSAR data with 2-look in azimuth direction and 1-look in range direction. We sampled two sub-regions consisting of 356×386 pixels from the Data#3 and 1 061×1 161 pixels from the Data#4, respectively to conduct our experiments.
Figure
3.
RADARSAT-2 data. The region of interest (black rectangle) is used in the detection experiment.
The proposed KDE methodology is applied on the test data. For comparison, some widely used fitting models such as the K distribution, Weibull distribution (WBL), logarithmic normal distribution (LGN), are also used to fit the test data. Furthermore, to provide a quantitative comparison, the commonly used symmetric Kullback-Leibler (KL) distance (Kullback and Leibler, 1951), which measures global similarity between estimated and theoretical PDFs, is employed as the goodness-of-fit (GoF) measure in our experiments. Figure 4 and Table 4 provides the fitting results and the KL values of different distributions for the test data. For Data#3, the KL value of proposed KDE is just 0.002 3, which is almost 85% smaller than the WBL, whose KL value 0.015 3 is second best in all compared methods. For Data#4, the KL value of proposed KDE is just 0.001 8, which is almost 97% smaller than the LGN, whose KL value 0.065 0 is the second best in all compared methods. The visual inspection also clearly shows that the proposed distribution almost perfectly matches the real SSM statistics histograms.
Figure
4.
Sea clutter modeling with different comparative methods.
After the effectiveness of the proposed modeling method for the SSM is validated, the next goal is to investigate its suitability and capability in practical ship detection applications. To complete this task, the experiment is performed on two sub-regions as shown in Fig. 3. Because of the lack of available automatic identification system (AIS) data for the region, the ships are identified by experts in SAR image analysis, as shown in Fig. 5a and Fig. 6a. For Data#3, to present a detailed understanding of the proposed metric, we conduct a series of experiments by varying probability of false alarm (PFA) from 0.000 07 to 0.001 at an interval of 0.000 005. For Data#4, we conduct a series of experiments by varying probability of false alarm (PFA) from 0.000 1 to 0.01 at an interval of 0.000 05. For each experiment, we employ pixel-level figure of merit (FoM) to evaluate the ship detection performance, which can be defined as
Figure
5.
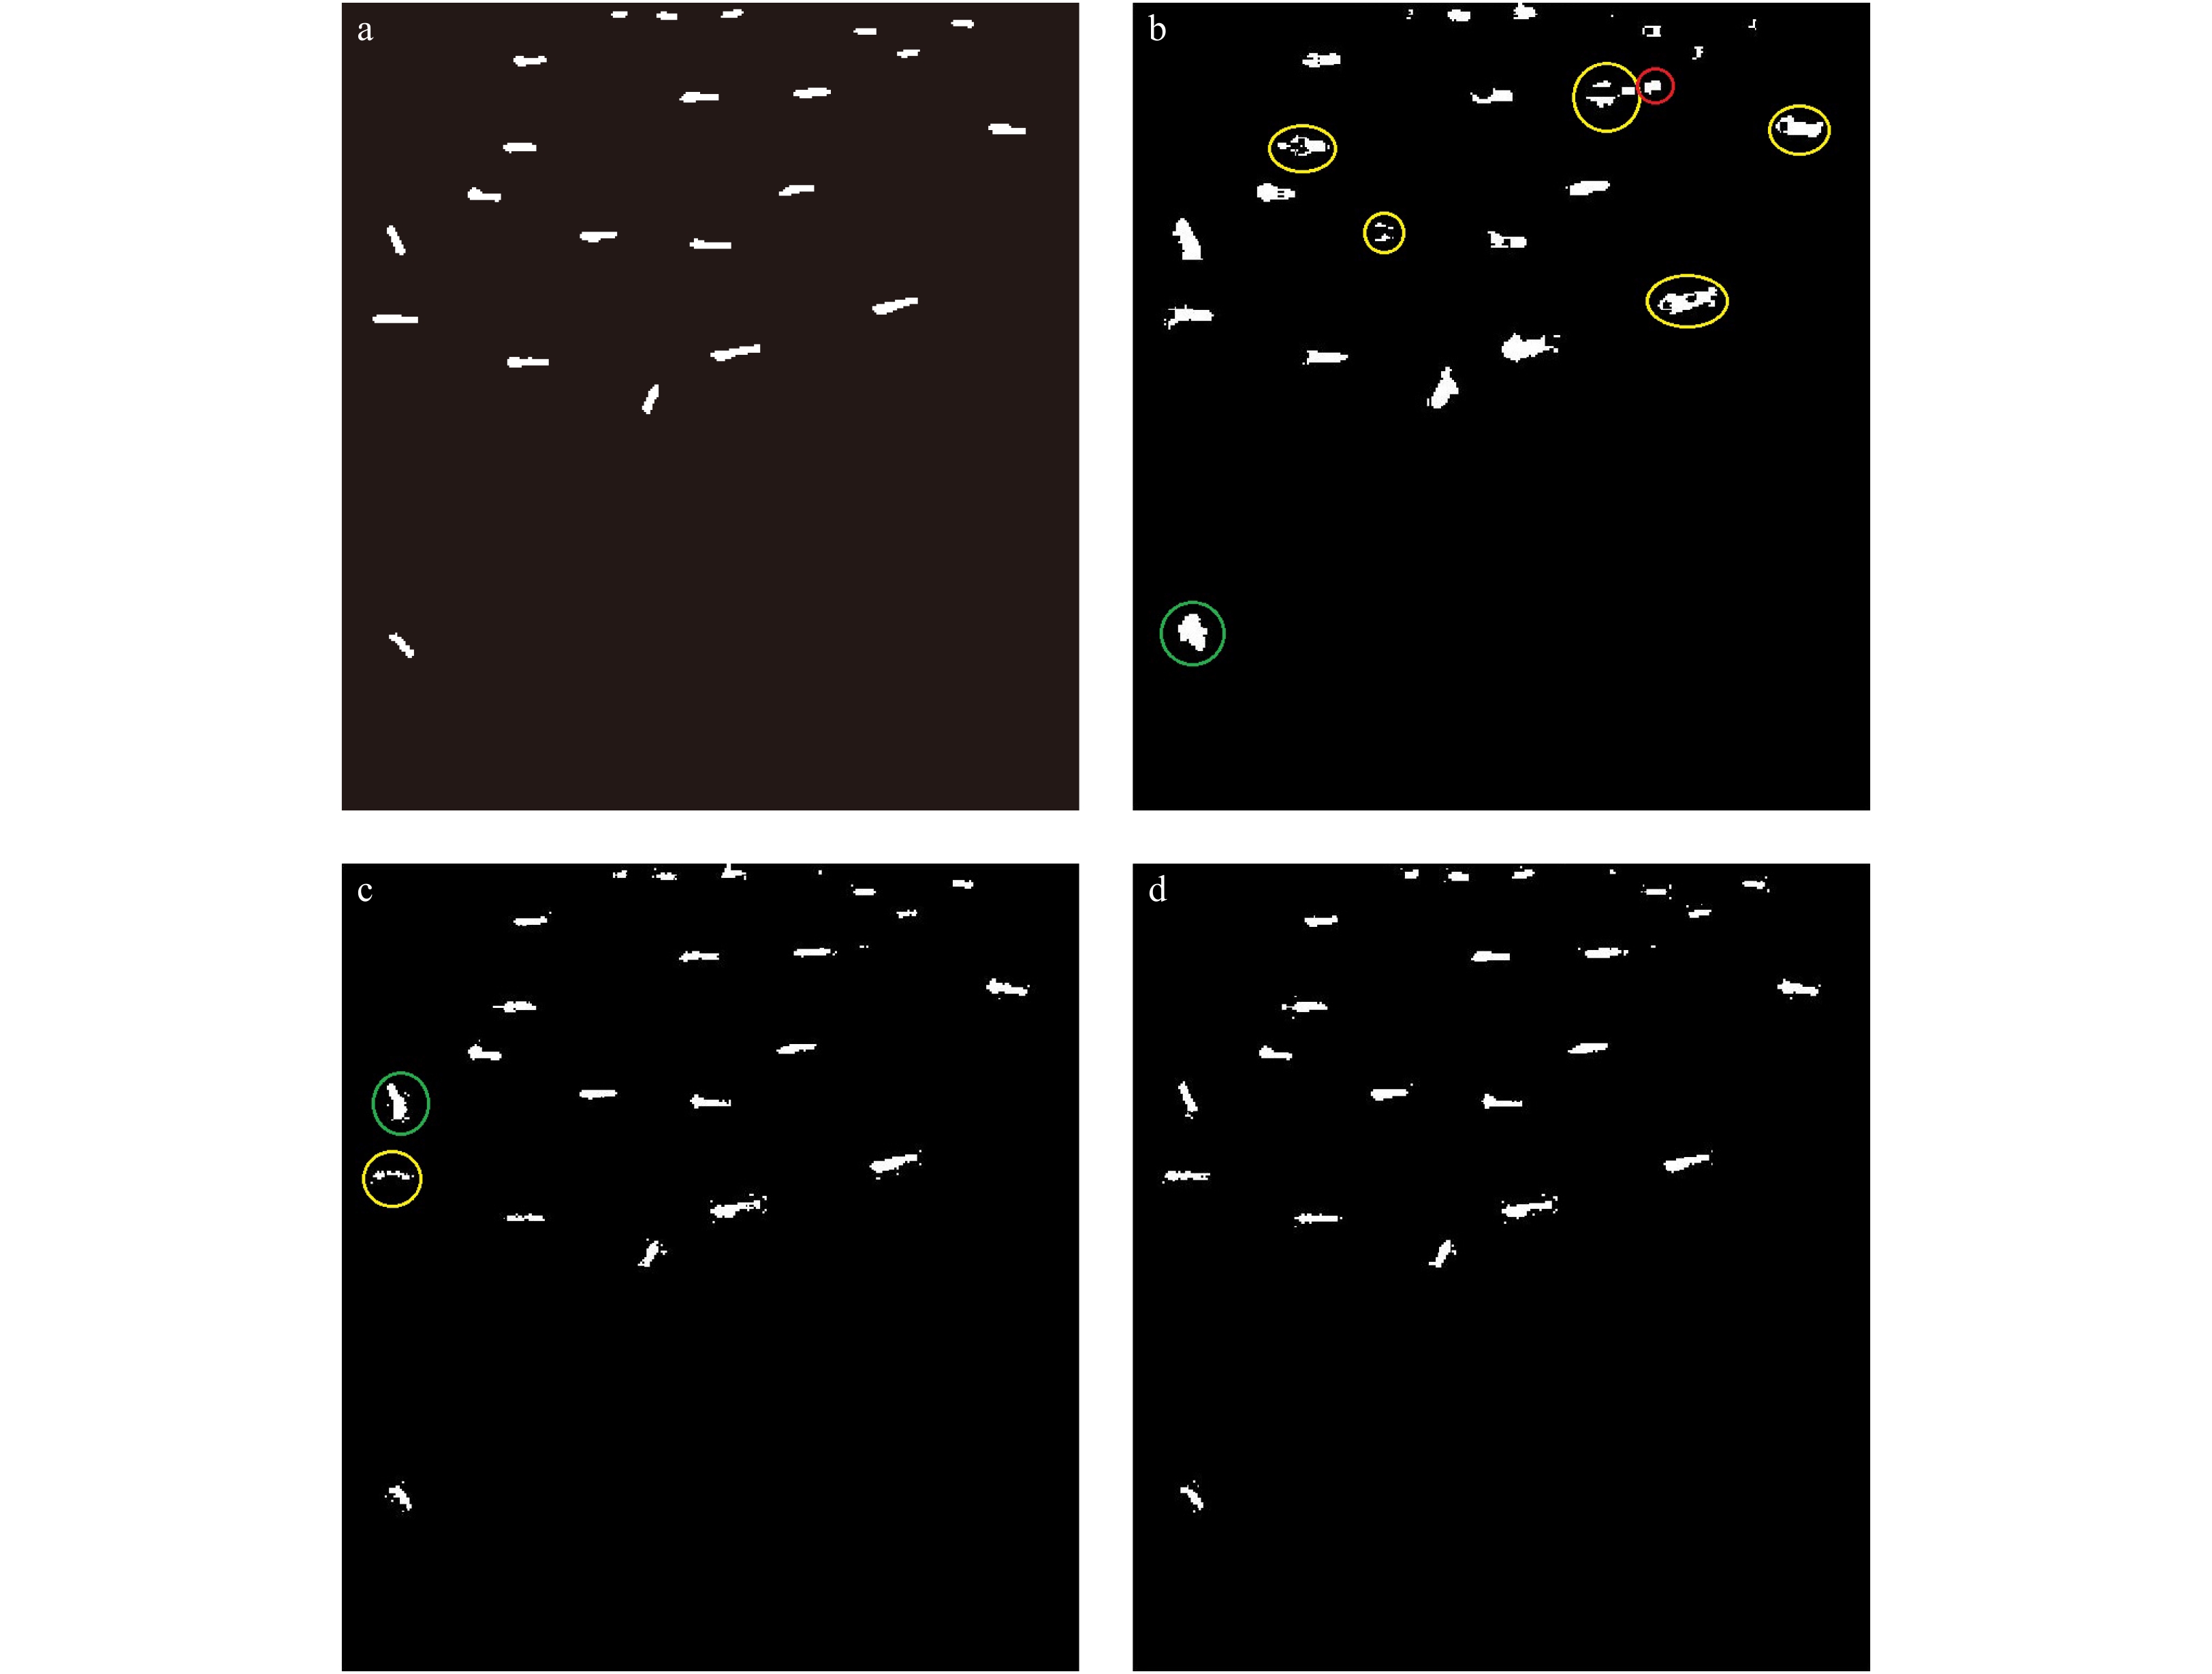
The detection results for Data#3. a. Visual interpretation image, b. the PCE detection result corresponding to FoM 0.355 0, c. the RSM detection result corresponding to FoM 0.762 1, and d. the SSM detection result corresponding to FoM 0.850 8. The red circle indicates the false alarm target, the yellow circle indicates that the target shape is incomplete, and the green circle indicates that the target area is significantly larger.
Figure
6.
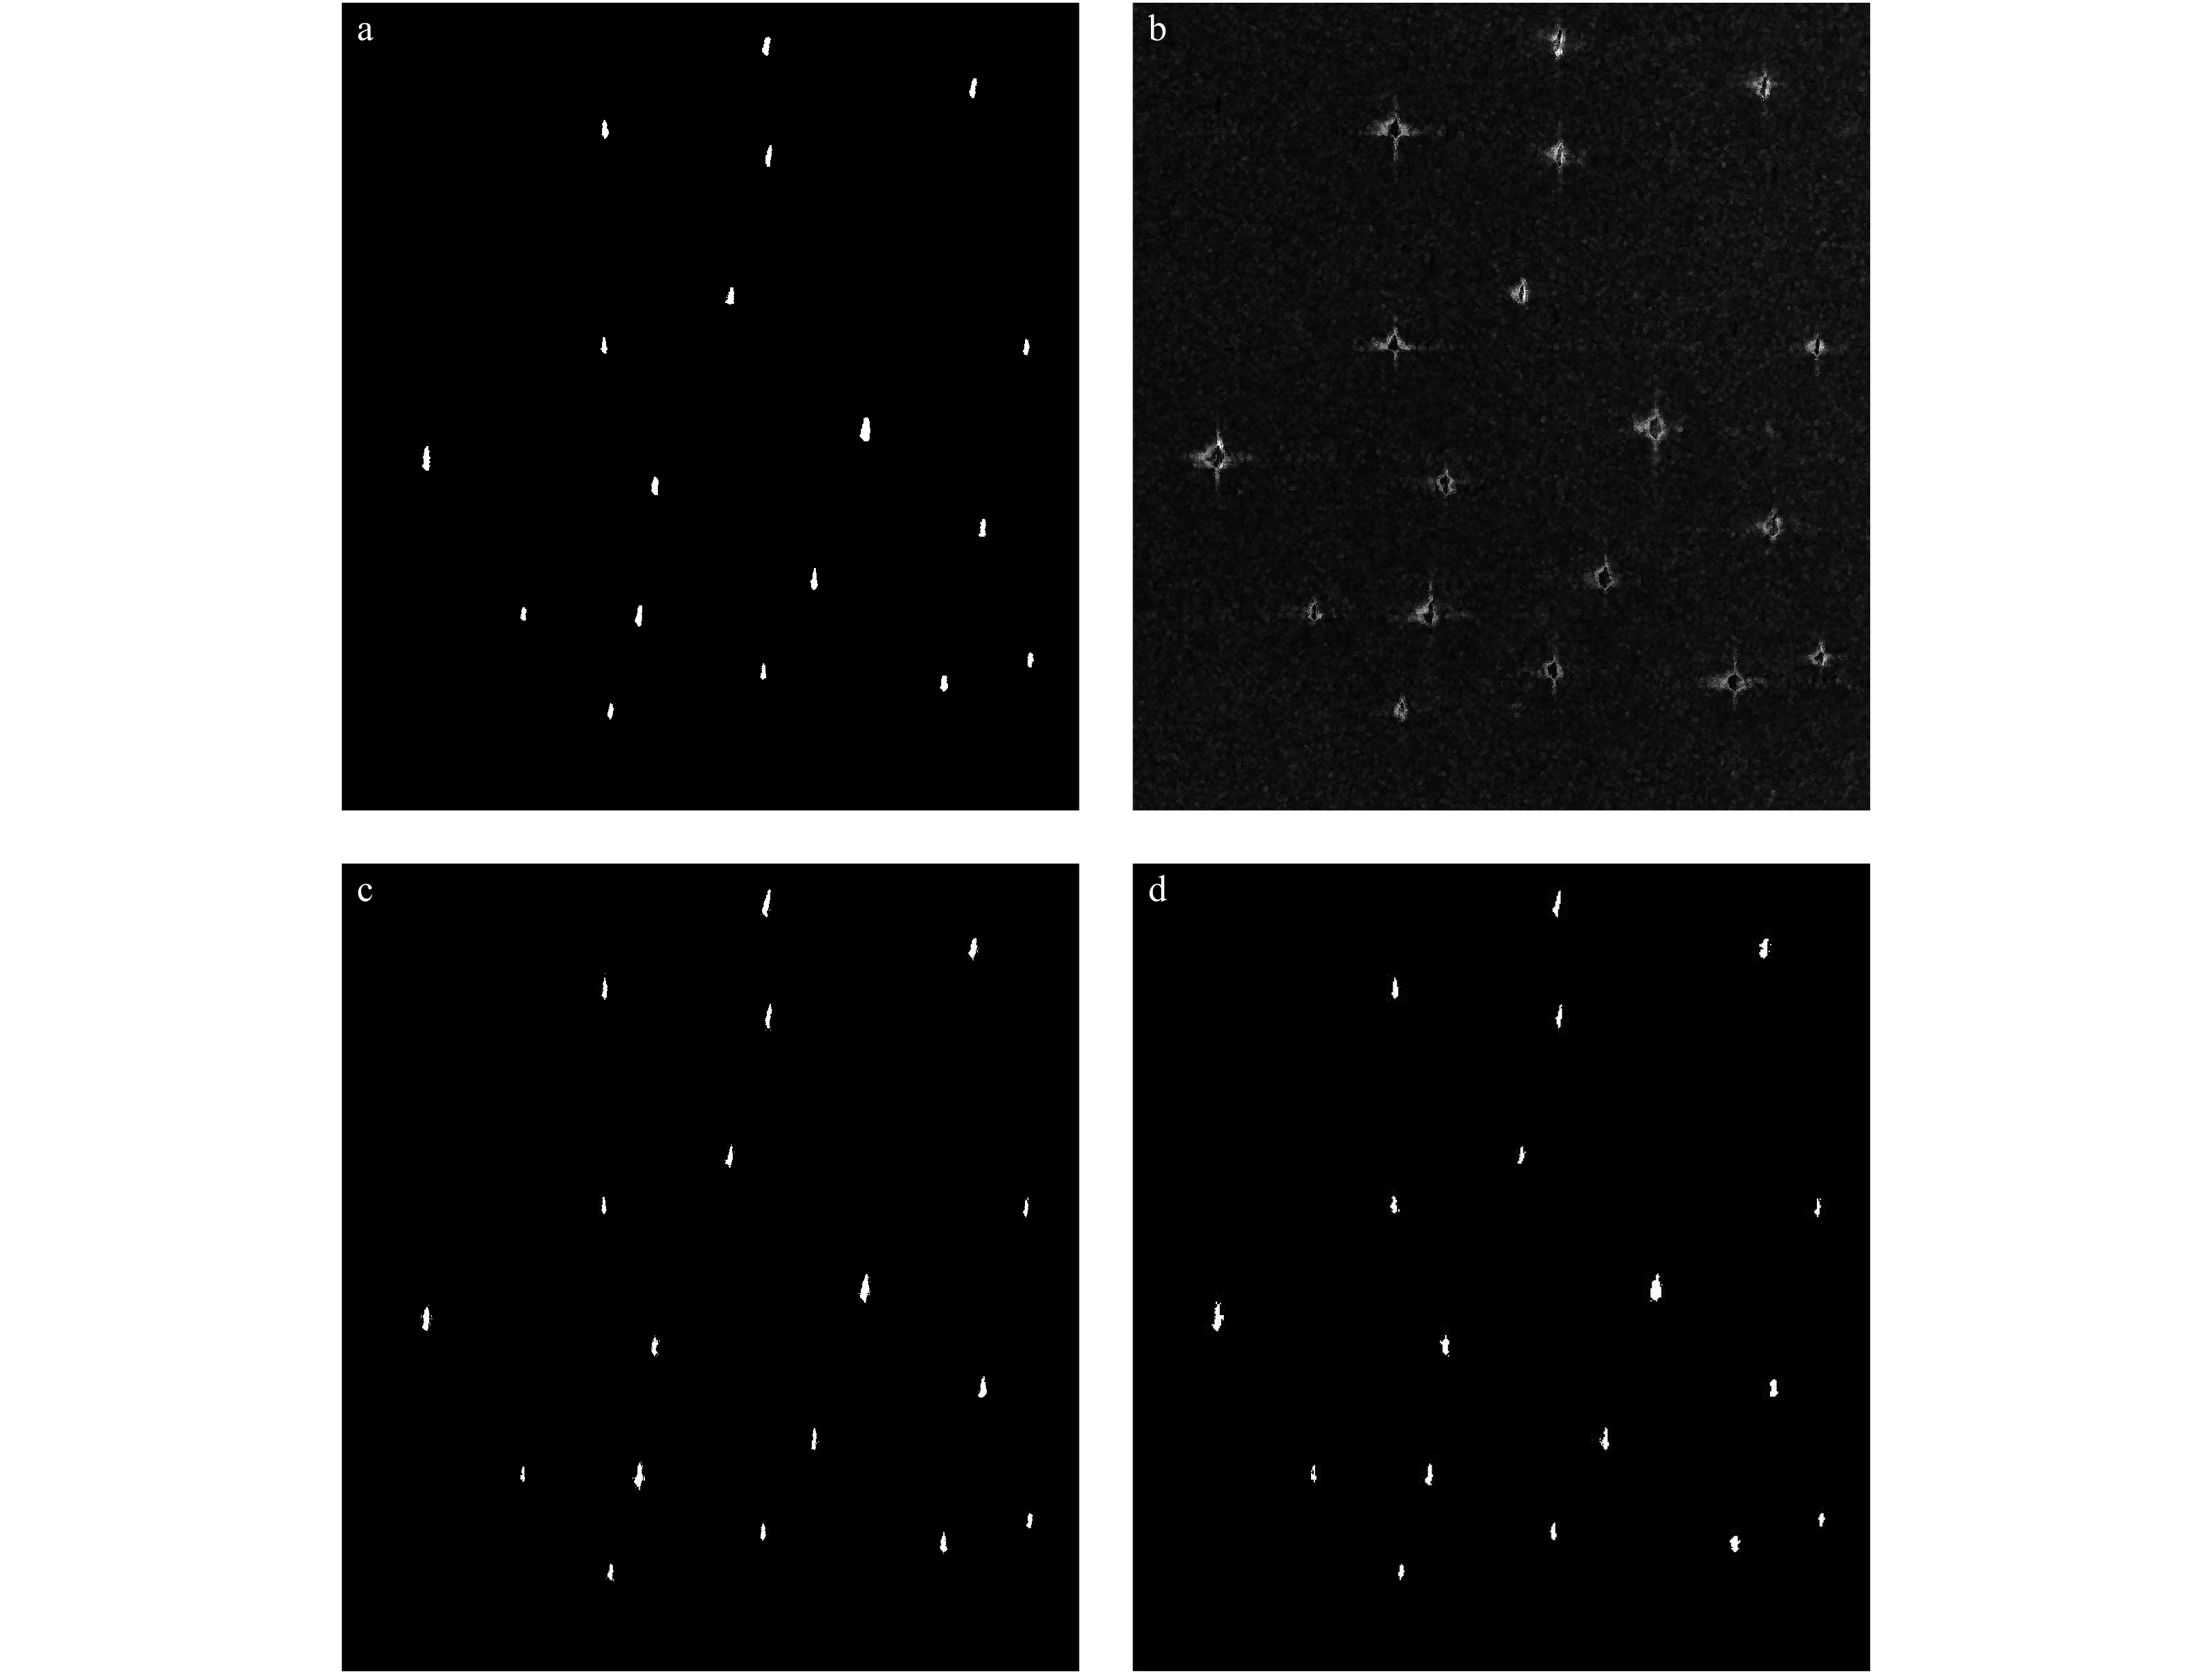
The detection results for Data#4. a. Visual interpretation image, b. the PCE detection result corresponding to FoM 0.088 9, c. the RSM detection result corresponding to FoM 0.6081, and d. the SSM detection result corresponding to FoM 0.712 8.
where Nd denotes the number of correctly detected pixels, Nf is the number of false alarm pixels, and Nt is the ground truth number of ship target pixels.
For Data#3, with the increment of PFA, the FoM of SSM detector increases gradually, and the maximum FoM 0.850 8 is acquired when PFA is 0.000 3, the corresponding detection result is shown in Fig. 5d. where twenty-two targets are detected correctly and there is no false alarm target. The performance of the proposed method is compared with two classic polarimetric approaches, i.e., the polarimetric cross-entropy (PCE) (Chen et al., 2009) and reflection symmetry metric (RSM) (Nunziata et al., 2012). PCE output, as shown in Fig. 5b, witnesses that in this case the filter is not able to work properly. Although the targets have been correctly detected, many false alarms are present in the sea clutter area and part of targets are incomplete, leading to the FoM of PCE only 0.355 0. The output of the RSM is shown in Fig. 5c. Although the targets have been correctly detected and no false positive is present, the FoM of RSM is only 0.762 1, many pixels belonging to ships are missing.
For Data#4, with the increment of PFA, the FoM of SSM detector increases gradually, and the maximum FoM 0.712 8 is acquired when PFA is 0.002 9, the corresponding detection result is shown in Fig. 6d. where eighteen targets are detected correctly and there is no false alarm target. The performance of the proposed method is compared with two classic polarimetric approach, i.e., the PCE and RSM. PCE output, as shown in Fig. 6b, witnesses that in this case the filter is not able to work properly. Only the sidelobes around the ship targets are highlighted and many false alarms are present in the sea clutter area, leading to the FoM of PCE just 0.088 9. This odd result is inherently due to the norm that PCE filter uses to distinguish targets from clutter, i.e., the polarimetric entropy. The output of the RSM is shown in Fig. 6c. Although the targets have been correctly detected and no false positive is present, the FoM of RSM is only 0.608 1, many pixels belonging to ships are missing.
4.
Conclusions
In this paper, we have investigated the scattering mechanism of ships and sea clutter using the scattering similarity parameters. Based on the differences between them, we propose a new detection metric SSM, and the third eigenvalue of the coherency matrix is utilized to suppress the disturbances. At the same time, we develop a statistical model of the metric with KDE method and based on which a CFAR detection scheme is achieved. The extensive experiments verify the good performance of the developed statistical model and demonstrates the advantage of the CFAR detection based on the proposed SSM metric.
Bors A G, Nasios N. 2009. Kernel bandwidth estimation for nonparametric modeling. IEEE Transactions on Systems, Man, and Cybernetics, Part B (Cybernetics), 39(6): 1543–1555. doi: 10.1109/TSMCB.2009.2020688
[2]
Chen Jiong, Chen Yilun, Yang Jian. 2009. Ship detection using polarization cross-entropy. IEEE Geoscience and Remote Sensing Letters, 6(4): 723–727. doi: 10.1109/LGRS.2009.2024224
[3]
Jones M C, Marron J S, Sheather S J. 1996. A brief survey of bandwidth selection for density estimation. Journal of the American Statistical Association, 91(433): 401–407. doi: 10.1080/01621459.1996.10476701
[4]
Kullback S, Leibler R A. 1951. On information and sufficiency. The Annals of Mathematical Statistics, 22(1): 79–86. doi: 10.1214/aoms/1177729694
[5]
Lang Haitao, Zhang Jie, Zhang Ting, et al. 2014. Hierarchical ship detection and recognition with high-resolution polarimetric synthetic aperture radar imagery. Journal of Applied Remote Sensing, 8(1): 083623. doi: 10.1117/1.JRS.8.083623
[6]
Li Dong, Zhang Yunhua. 2015. Random similarity between two mixed scatterers. IEEE Geoscience and Remote Sensing Letters, 12(12): 2468–2472. doi: 10.1109/LGRS.2015.2484383
[7]
Liu C, Vachon P W, Geling G W. 2005. Improved ship detection with airborne polarimetric SAR data. Canadian Journal of Remote Sensing, 31(1): 122–131. doi: 10.5589/m04-056
[8]
Nunziata F, Migliaccio M, Brown C E. 2012. Reflection symmetry for polarimetric observation of man-made metallic targets at sea. IEEE Journal of Oceanic Engineering, 37(3): 384–394. doi: 10.1109/JOE.2012.2198931
[9]
Ouchi K. 2016. Current status on vessel detection and classification by synthetic aperture radar for maritime security and safety. In: Proceedings of the 38th Symposium on Remote Sensing for Environmental Sciences. Japan: Aichi.
[10]
Sheather S J. 2004. Density estimation. Statistical Science, 19(4): 588–597. doi: 10.1214/088342304000000297
[11]
Sun Yuan, Zhang Bo, Wang Chao, et al. 2012. Ship detection based on eigenvalue-eigenvector decomposition and OS-CFAR detector. In: Proceedings of 2012 International Conference on Computer Vision in Remote Sensing. Xiamen, China: IEEE, 350–355
[12]
Wang Wenguang, Ji Yu, Lin Xiaoxia. 2015. A novel fusion-based ship detection method from pol-SAR images. Sensors, 15(10): 25072–25089. doi: 10.3390/s151025072
[13]
Xi Yuyang, Lang Haitao, Tao Yunhong, et al. 2017. Four-component model-based decomposition for ship targets using polSAR data. Remote Sensing, 9(6): 621. doi: 10.3390/rs9060621
[14]
Yang Jian, Peng Yingning, Lin Shiming. 2001. Similarity between two scattering matrices. Electronics Letters, 37(3): 193–194. doi: 10.1049/el:20010104
Tao Liu, Ziyuan Yang, Armando Marino, et al. PolSAR Ship Detection Based on Neighborhood Polarimetric Covariance Matrix. IEEE Transactions on Geoscience and Remote Sensing, 2021, 59(6): 4874. doi:10.1109/TGRS.2020.3022181
3.
Xun Wang, Yunhua Zhang, Dong Li, et al. Effect of Ionospheric Faraday Rotation on Polarimetric Scattering Similarity. 2024 Photonics & Electromagnetics Research Symposium (PIERS), doi:10.1109/PIERS62282.2024.10618360
Figure 2. Main scattering mechanism analysis of the Data#1 (a) and Data#2 (b).
Figure 3. RADARSAT-2 data. The region of interest (black rectangle) is used in the detection experiment.
Figure 4. Sea clutter modeling with different comparative methods.
Figure 5. The detection results for Data#3. a. Visual interpretation image, b. the PCE detection result corresponding to FoM 0.355 0, c. the RSM detection result corresponding to FoM 0.762 1, and d. the SSM detection result corresponding to FoM 0.850 8. The red circle indicates the false alarm target, the yellow circle indicates that the target shape is incomplete, and the green circle indicates that the target area is significantly larger.
Figure 6. The detection results for Data#4. a. Visual interpretation image, b. the PCE detection result corresponding to FoM 0.088 9, c. the RSM detection result corresponding to FoM 0.6081, and d. the SSM detection result corresponding to FoM 0.712 8.


 DownLoad:

 DownLoad:


 DownLoad: