


Figure
1.
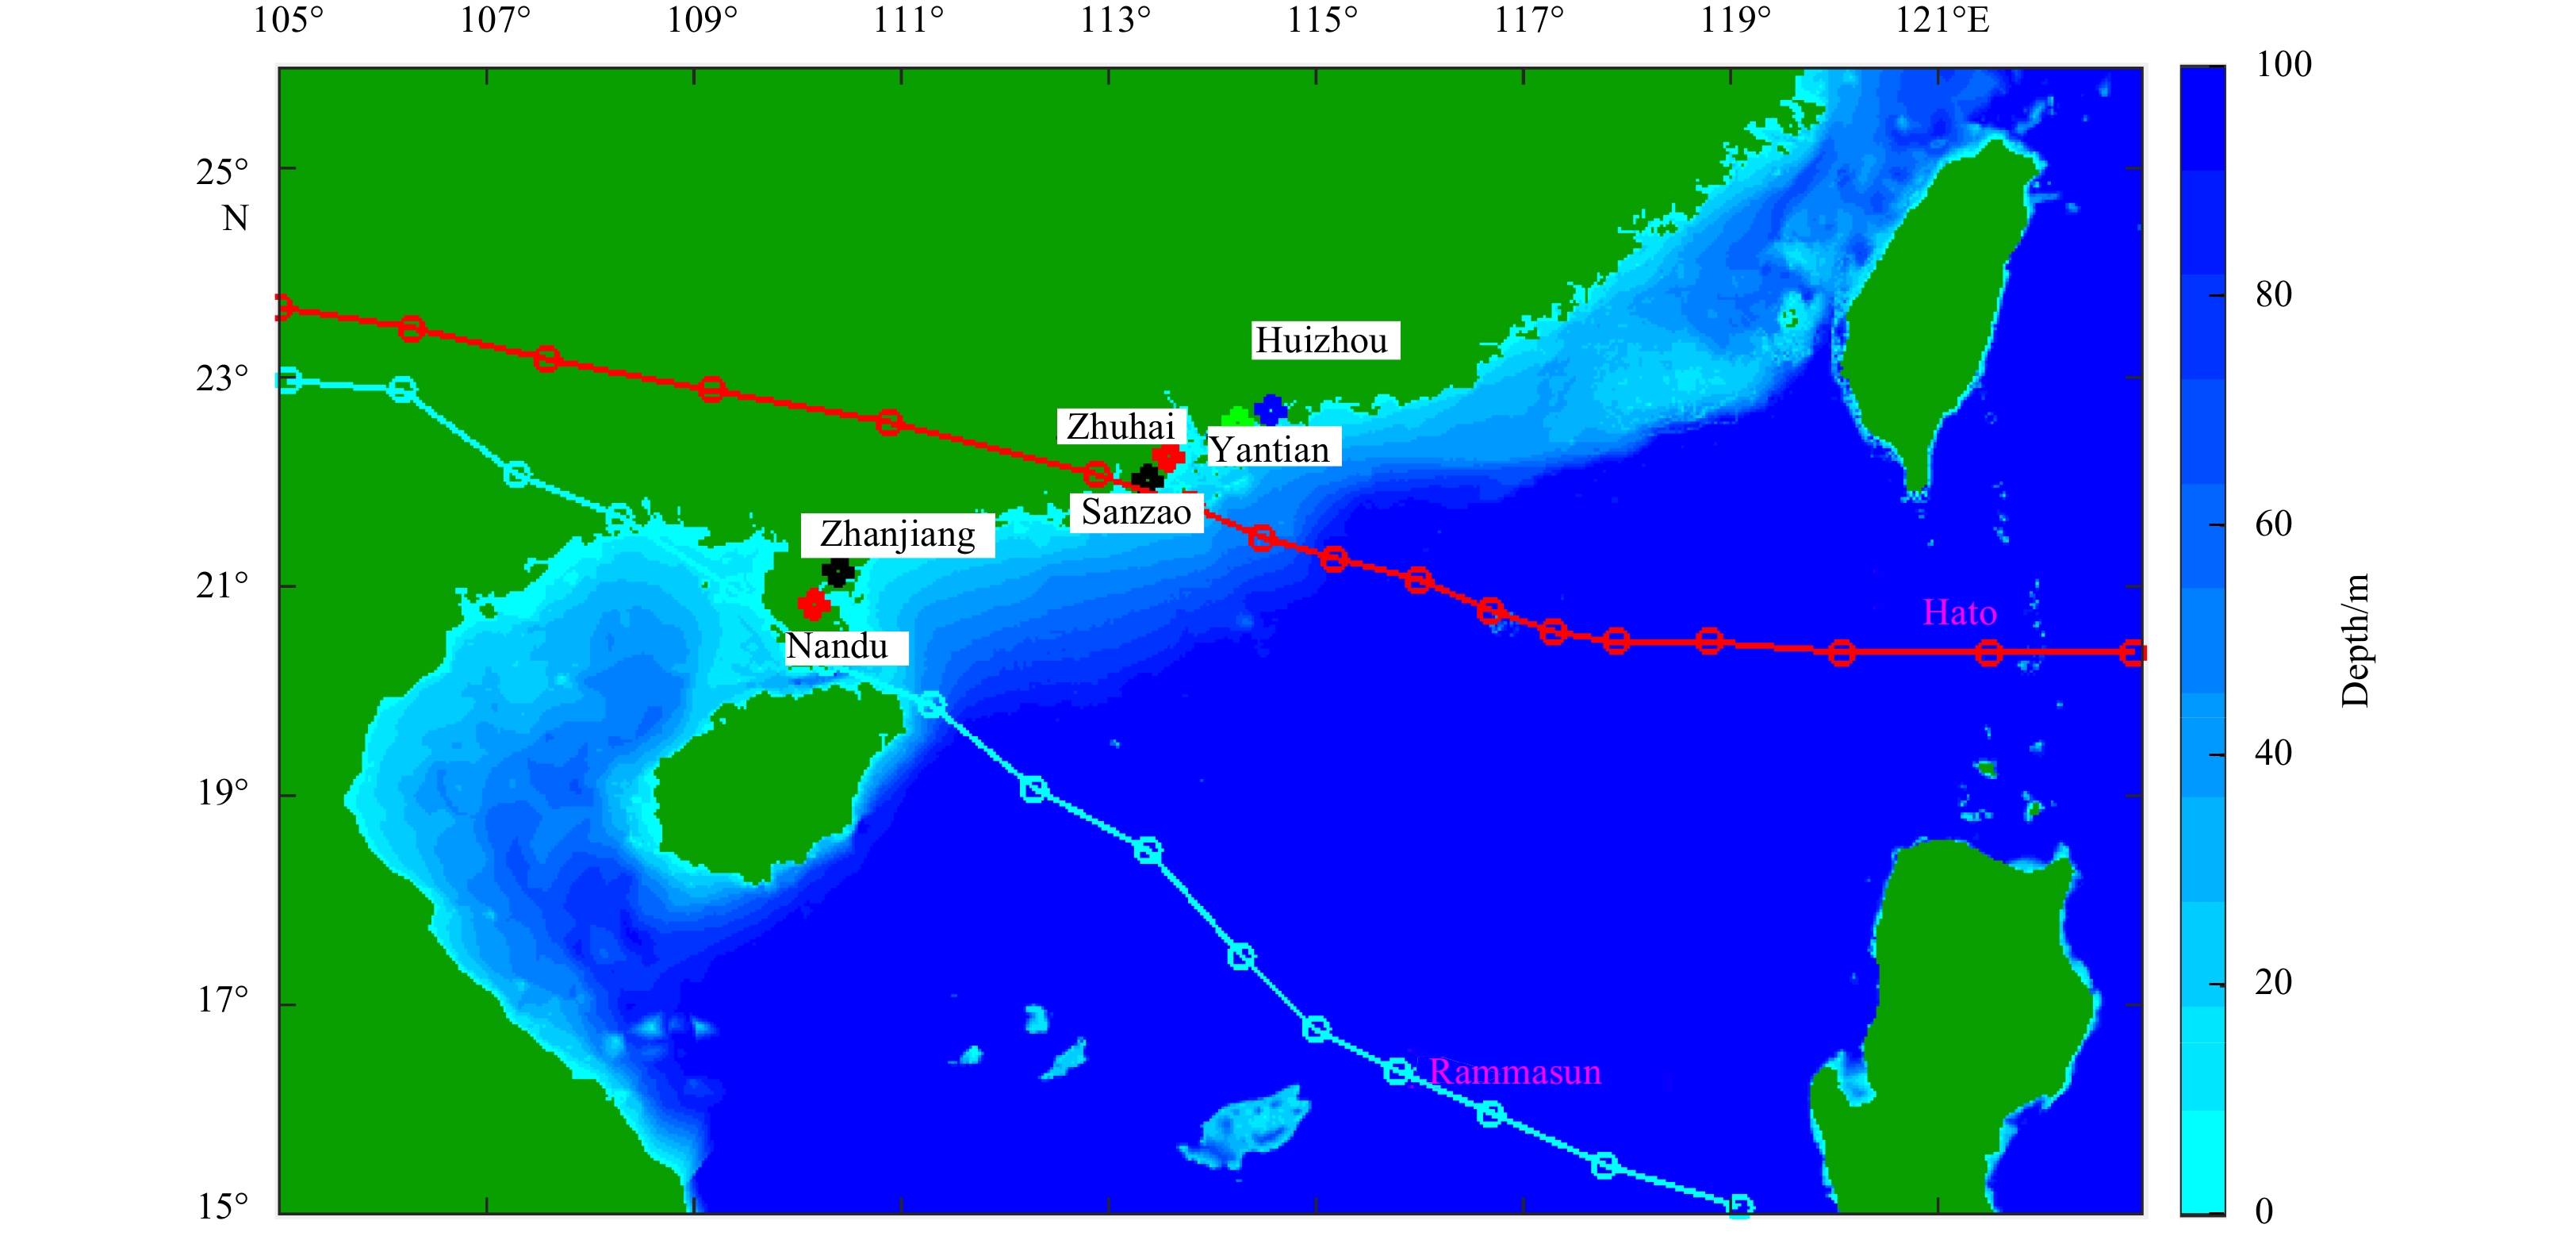
Model domain and bathymetry.
| Citation: | Qiuxing Liu, Jinrong Jiang, Fujiang Yu, Changkuan Zhang, Jianxi Dong, Xiaojiang Song, Yuzhu Wang. Typhoon storm surge ensemble forecast based on GPU technique[J]. Acta Oceanologica Sinica, 2020, 39(5): 77-86. doi: 10.1007/s13131-020-1570-8

|
Storm surges are among the most frequent and devastating of natural hazards, leading to significant casualties, property losses, and damage in many coastal areas around the world. China is located in the northwestern Pacific coastal area, and is at risk of being seriously hit by storm surges. Accurate forecasting of these storm surges is therefore critical for protecting coastal cities from flooding and minimizing the damage from these storms. However, accurately forecasting the timing and magnitude of storm surges remains an operational challenge. One reason for this is the atmospheric field forecast at the sea surface, which can vary substantially depending on the meteorological situation. To reduce the errors caused by inaccuracies in the atmospheric forcing field, the storm surge ensemble forecast technique was developed. The Met Office Global and Regional Ensemble Forecast System, a barotropic storm surge model covering the North Atlantic and European domain, has a 24 km grid length and provides 24 different forecasts of meteorological evolution for extratropical storm surges. The verification results from this model are encouraging (Flowerdew et al., 2009).
The track and intensity of a typhoon are critical factors in forecasting the resulting storm surge. The uncertainty of a typhoon’s track and intensity can lead to significant errors in typhoon storm surge forecasts. In recent years, the extensive application of data assimilation techniques has led to great improvements in the accuracy of typhoon forecasting. Currently, the mean error of typhoon track forecasts is 60–90 km for a 24-h lead time (Lei et al., 2017)①. However, this degree of error is still unacceptable for storm surge forecasting.
Regarding the uncertainty of typhoon tracks, the concept of a “probability circle” has been widely adopted for storm surge ensemble forecasting in Fujian coastal areas (Wang et al., 2010). In this approach, four perturbed typhoon tracks (right track, left track, quick track, and slow track) are generated according to the control typhoon track. The radius of the circle depends on the typhoon’s track forecast error at different lead times. An ensemble of fifteen groups of typhoon parameters, formed by combining the five typhoon tracks with the three maximum wind speeds, is used to drive the storm surge model and generate storm surge probability forecasts (Ding et al., 2016). The storm surge ensemble forecast system is run eight times a day by the Japan Meteorological Agency to provide a 33-h forecast of storm surges when a typhoon enters a certain region around Japan (Higaki et al., 2009). Salighehdar et al. (2017) found that even the simplest ensemble produces results that are superior to those from any single forecast. However, while the ensemble forecast methods mentioned above improve the accuracy of typhoon storm surge forecasts to some extent, two problems still exist: (1) Although the uncertainty of typhoon tracks is considered, the real physical progress of a typhoon’s evolution is not considered; (2) The number of ensemble members must be large to obtain an acceptable forecast, resulting in enormously expensive computation costs for operational use.
A more promising high-performance computing technique that is accessible even on general workstations involves the use of Graphics Processing Units (GPUs). GPUs are commonly used in the video games industry, but have only recently been applied to scientific computing (Brodtkorb, 2013). The hundreds of processing elements on a single GPU provide far more powerful parallel computing capability than a conventional Central Processing Unit (CPU). The benefit of using GPUs in high-performance computing is evident. In less than a decade, numerous GPU-accelerated models have been developed and used in many areas of scientific computing, e.g., computational fluid dynamics, magnetohydrodynamics, signal processing, molecular dynamics simulations, and gas dynamics (Amouzgar et al., 2016; Bard and Dorelli, 2014; Chauhan et al., 2016; Liang et al., 2016). However, GPU techniques have not been used in the field of storm surge ensemble forecasting.
The objective of this study is to investigate storm surge ensemble forecasts for the Guangdong coastal areas of China using GPU techniques. A high-resolution storm surge model was applied to simulate storm surges in the study area, and a GPU technique was employed to improve the computational efficiency. A total of 150 typhoon cases were used to drive the storm surge model. Large-scale computations from storm surge ensemble forecasting can be realized on a regular workstation. The simulated results can be used as an important reference for disaster mitigation. The model description is presented in Section 2. Section 3 describes the GPU improvement method and its validation based on the simulation results. The results are discussed in Section 4, and our conclusions are presented in Section 5.
Hydrodynamic models are widely used for operational storm surge predictions in China. They provide highly accurate solutions to mathematical formulations of the hydrodynamic situation in coastal and estuarine regions (Yu and Zhang, 2002; Dong et al., 2008). In the Spherical coordinate system, the model integrates the continuity equation and the equations of momentum vertically to give:
| $$\frac{{\partial \zeta }}{{\partial t}} + \frac{1}{{R {\rm {cos}}\varphi }}\left[ {\frac{{\partial \left({Du} \right)}}{{\partial \theta }} + \frac{{\partial \left({Dv {\rm {cos}}\varphi } \right)}}{{\partial \varphi }}} \right] = 0, $$ | (1) |
| $$ \begin{split} & \frac{{\partial u}}{{\partial t}} + \frac{u}{{R {\rm {cos}}\varphi }}\frac{{\partial u}}{{\partial \theta }} + \frac{v}{R}\frac{{\partial u}}{{\partial \varphi }} - \frac{{uv {\rm {tan}}\varphi }}{R} - fv \\ & = - \frac{g}{{R {\rm {cos}}\varphi }}\frac{{\partial \zeta }}{{\partial \theta }} - \frac{1}{{\rho R {\rm {cos}}\varphi }}\frac{{\partial {P_a}}}{{\partial \theta }} + \frac{1}{{\rho D}}\left({{F_s} - {F_b}} \right) \end{split} , $$ | (2) |
| $$ \begin{split} & \frac{{\partial v}}{{\partial t}} + \frac{u}{{R{\rm {cos}}\varphi }}\frac{{\partial v}}{{\partial \theta }} + \frac{v}{R}\frac{{\partial v}}{{\partial \varphi }} + \frac{{{u^2}{\rm {tan}}\varphi }}{R} + fu \\ & = - \frac{g}{R}\frac{{\partial \zeta }}{{\partial \varphi }} - \frac{1}{{\rho R}}\frac{{\partial {P_a}}}{{\partial \varphi }} + \frac{1}{{\rho D}}\left({{G_s} - {G_b}} \right). \end{split}$$ | (3) |
The terms in these equations denote the following: t is time; θ and φ are the spherical coordinates; ζ is the elevation of the sea surface; Pa is atmospheric pressure; u, v conponents are the depth-mean current velocity; Fs, Gs components are the wind stress on the sea surface; D is the total water depth; ρ is the density of sea water; R is the radius of earth; g is the acceleration of gravity; f is the Coriolis parameter. Fb,Gb components are Bottom friction
A semi-implicit finite difference scheme with Arakawa C mesh is used to integrated. Implicit finite difference scheme of the bottom friction is adopted to improve the stability of model. The initial conditions include that currents and surface elevation are zero; Lateral boundary conditions are also assumed to be zero for normal flow to the rigid boundary. the water boundary is drived by atmospheric pressure.
In this study, the structured grid covers the area from 15°N to 26°N and 105°E to 123°E. The computational domain includes the coastal areas of Fujian, Taiwan, Guangdong, Hainan, and Guangxi. The grid resolution of the model is 1’. There are 1 080 grid cells in the x-direction and 660 grid cells in the y-direction. The coastal water depth data were obtained by field measurements. The other bathymetry was supplemented by the GEBCO database with a high resolution of (1/120°). The two bathymetries were combined and interpolated into the computational grid. The bathymetry data used in this study are illustrated in Fig. 1, where the maximum water depth is set to 100 m for places where the real water depth is equal to or greater than 100 m. A wide continental shelf can clearly be observed in the computational domain. The meteorological data used in this study were obtained from the CMA-STI Best Track Dataset for Tropical Cyclones over the Western North Pacific (www.typhoon.gov.cn). The data include the typhoon tracks and intensities over the Western Pacific since 1949.
The typhoon wind field and atmospheric pressure distribution play an important role in storm surge simulations. The formulas derived by Fujita and Takahashi are adopted to represent the atmospheric pressure distributions:
| $$ \begin{split} {P_r} =& \left({{P_\infty } - {P_0}} \right)\left({1 - \frac{1}{{\sqrt {1 + 2\left({\dfrac{{{r^2}}}{{{R^2}}}} \right)} }}} \right) + {P_0},\\ & 0 \leqslant r \leqslant 2R\;\;\left( {{\rm {Takahashi}}} \right), \end{split} $$ | (4) |
| $${P_r} = \left({{P_\infty } - {P_0}} \right)\left({1 - \frac{1}{{1 + r/R}}} \right) + {P_0},\;\;\;\;2R \leqslant r \leqslant \infty \;\;\left({{\rm {Fujita.T.}}} \right).$$ | (5) |
The wind field has two parts: a rotating wind field that is proportional to the wind gradient and a basic wind field that is dependent on the typhoon’s translation speed. The basic wind field is assumed to be represented by the Veno Takeo formula:
| $$ {{\overrightarrow V_{sm}}} = {V_x}\exp \left({ - \frac{{\text π} }{4}\frac{{\left| {r - R} \right|}}{R}} \right)\vec i + {V_y}\exp \left({ - \frac{{\text π} }{4}\frac{{\left| {r - R} \right|}}{R}} \right)\vec j . $$ | (6) |
The specific validations of the rotating wind field formula were introduced by Wang (1991, 2001).
The compute unified device architecture (CUDA) is a parallel computing architecture developed by the NVIDIA Corporation, providing an interface for developing and running parallel code on compatible GPUs. CUDA employs Fortran or C as the programming language for wider computing developments. With the development of GPU techniques, Chauhan et al. (2016) accelerated a high-arithmetic-intensity storm surge model using CUDA C.
The Arakawa C-grid is adopted in the hydrodynamic model, whereby a time integration algorithm is used to simulate the storm surge. In each time step, the algorithm processes stay the same, with three subroutines responsible for computing the wind field, solving the shallow water equations, and smoothing the results; these are executed sequentially in each iteration. As the computation of the three subroutines is time-consuming, parallel computing is necessary.
Based on the characteristics of the model and the codes above, the CUDA-based heterogeneous computing of the model proceeds as follows. Firstly, the three subroutines are split into seven algorithm modules in order of their calculation to eliminate data dependencies among modules. Threads and computing tasks can then be scheduled dynamically and executed in an asynchronous manner, which greatly enhances the computing speed of the program. The specific method is to decompose tasks in the horizontal grid direction, and dynamically allocate local computing tasks to different threads. At the same time, the entire algorithm process is split into seven kernel functions. Secondly, the data required for internal calculation of each kernel function can be read from the global memory and updated by the thread itself. No data computing is performed by the external thread, which means the multiple threads in each kernel function have no data dependencies. Thirdly, if data dependencies exist between kernel functions, data communication between threads is executed through the global memory of CUDA or by synchronization between threads.
The process of the algorithm is as follows: (1) initialized data are transferred from the CPU to GPUs and threads are allocated to GPUs to complete computing tasks; (2) specific intensive computing tasks are performed by GPUs; (3) the computation results are returned to the CPU by the GPUs.
The GPU technique is used to initiate storm surge ensemble forecasting and reduce the computational load to meet the requirements of operational storm surge forecasts.
For the test runs conducted in this study, the GPU-based model was executed on an NVIDIA Tesla K20 GPGPU card. To illustrate the superiority of the CUDA-based parallel method, and to compare with serial computing on a CPU, the speedup was calculated as:
| $$S = \frac{{T_s}}{{T_p}},$$ | (11) |
where Ts is the time required by the serial model and Tp is the time required by GPU-based model.
Overall, it took 22 min to simulate three days of storm surge data using a traditional serial model, and only 11.8 s using the GPU model. Thus, Ts= 22 min and Tp = 11.8 s, so the speedup ratio S = 1 320/11.8 ≈ 112. The GPU model was also implemented on a mobile PC with 8 GB internal memory and one Nvidia Quadro M1000M card. Only 24.5 s was required to simulate three days of storm surge data, a speedup ratio of 54 compared with the serial model.
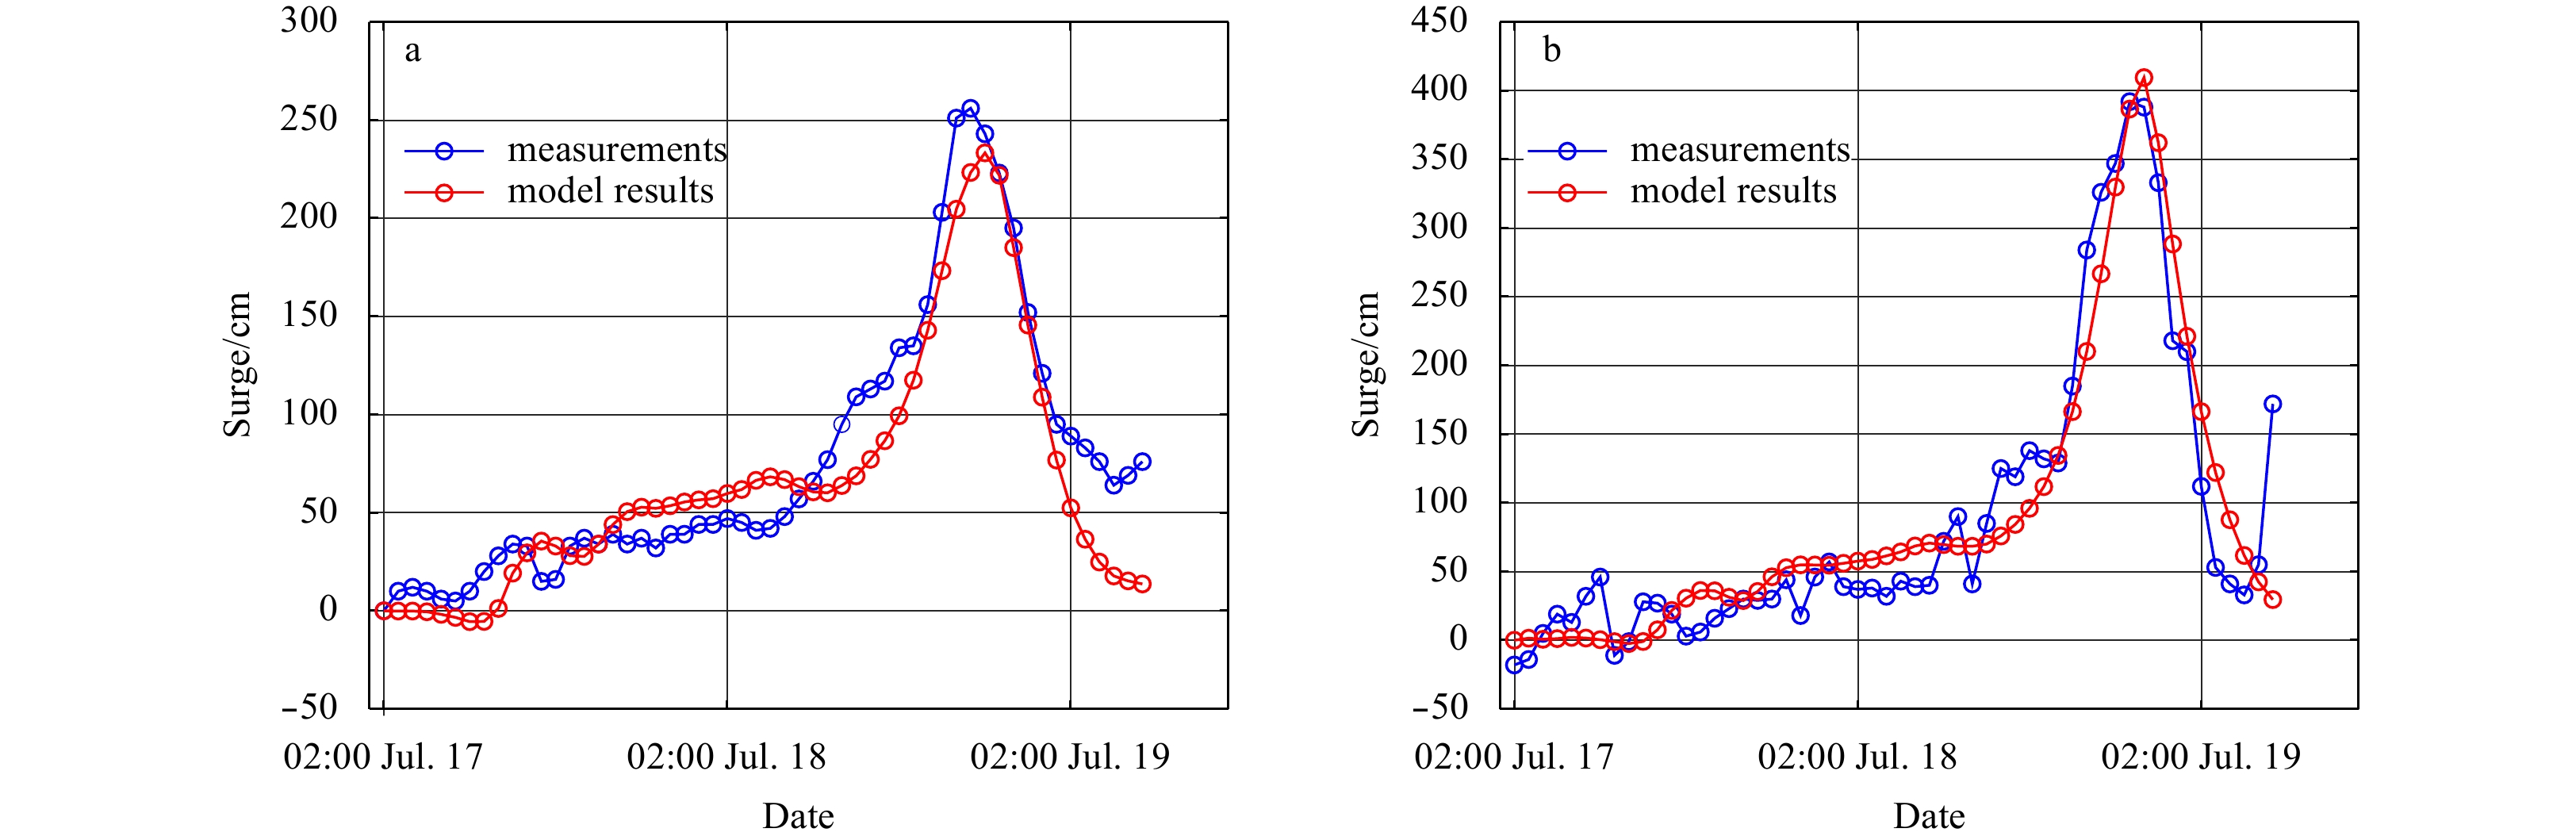
In recent years, many super typhoons and their induced storm surges have impacted the South China coastal area. Typhoons Rammasun in 2014 and Hato in 2017 are two representative cases. The typhoon tracks and tidal station distribution are shown in Fig. 2. The hydrodynamic model was applied to simulate the storm surges caused by Rammasun (Fig. 3) and Hato (Fig. 4). The tidal stations near the typhoon tracks in the coastal areas are considered in the following discussion.


To test the performance of the model, the relative error (RE) between the simulated and observed peak values of the storm surge were calculated as:
| $${\rm{RE}} = {\rm{Abs}}\left({{O_p} - {S_p}} \right)/{O_p} ,$$ | (5) |
where Op is the observed peak storm surge and Sp is the simulated peak storm surge. Examining the two surge cases, it can be seen that the numerical results coincide with the measurements at peak values, with deviations of less than 15%. This error may be caused by differences between the wind field used for simulation and the real wind field. The accuracy of the coastline and water depth may also require further improvement, which may be another source of error. Further work will compare the model with observed data from more stations to make the results more accurate. As the stations that provide data are scattered around the model domain, the simulation can be considered a fair representation of the storm surge in the computational domain.
Figure 5 compares the simulated storm surge given by the original model with that from the GPU model at stations along the coastal areas. The simulated results from the GPU model are consistent with the output from the serial model, confirming the credibility of the results simulated using the GPU technique.

Data assimilation and other important changes to the weather forecast model (such as more coupled physical elements) have led to the typhoon forecast product from the European Centre for Medium-Range Weather Forecasts (ECMWF) being widely accepted by users. Thus, this product plays a dominant role in the predictions generated by many forecast agencies. Fifty perturbed ensemble members are generated by the ECWMF weather forecast model (Sha et al., 2015), but the results generally underestimate the intensity. Therefore, the typhoon intensity forecasts are taken from the China Meteorological Administration (CMA). Considering the uncertainty of intensity forecasts, another two possible intensities are derived on the basis of the CMA forecast results (±10 hPa). By combining the 50 perturbed typhoon tracks with the three possible central minimum pressures, an ensemble of 150 storm surge cases are generated.
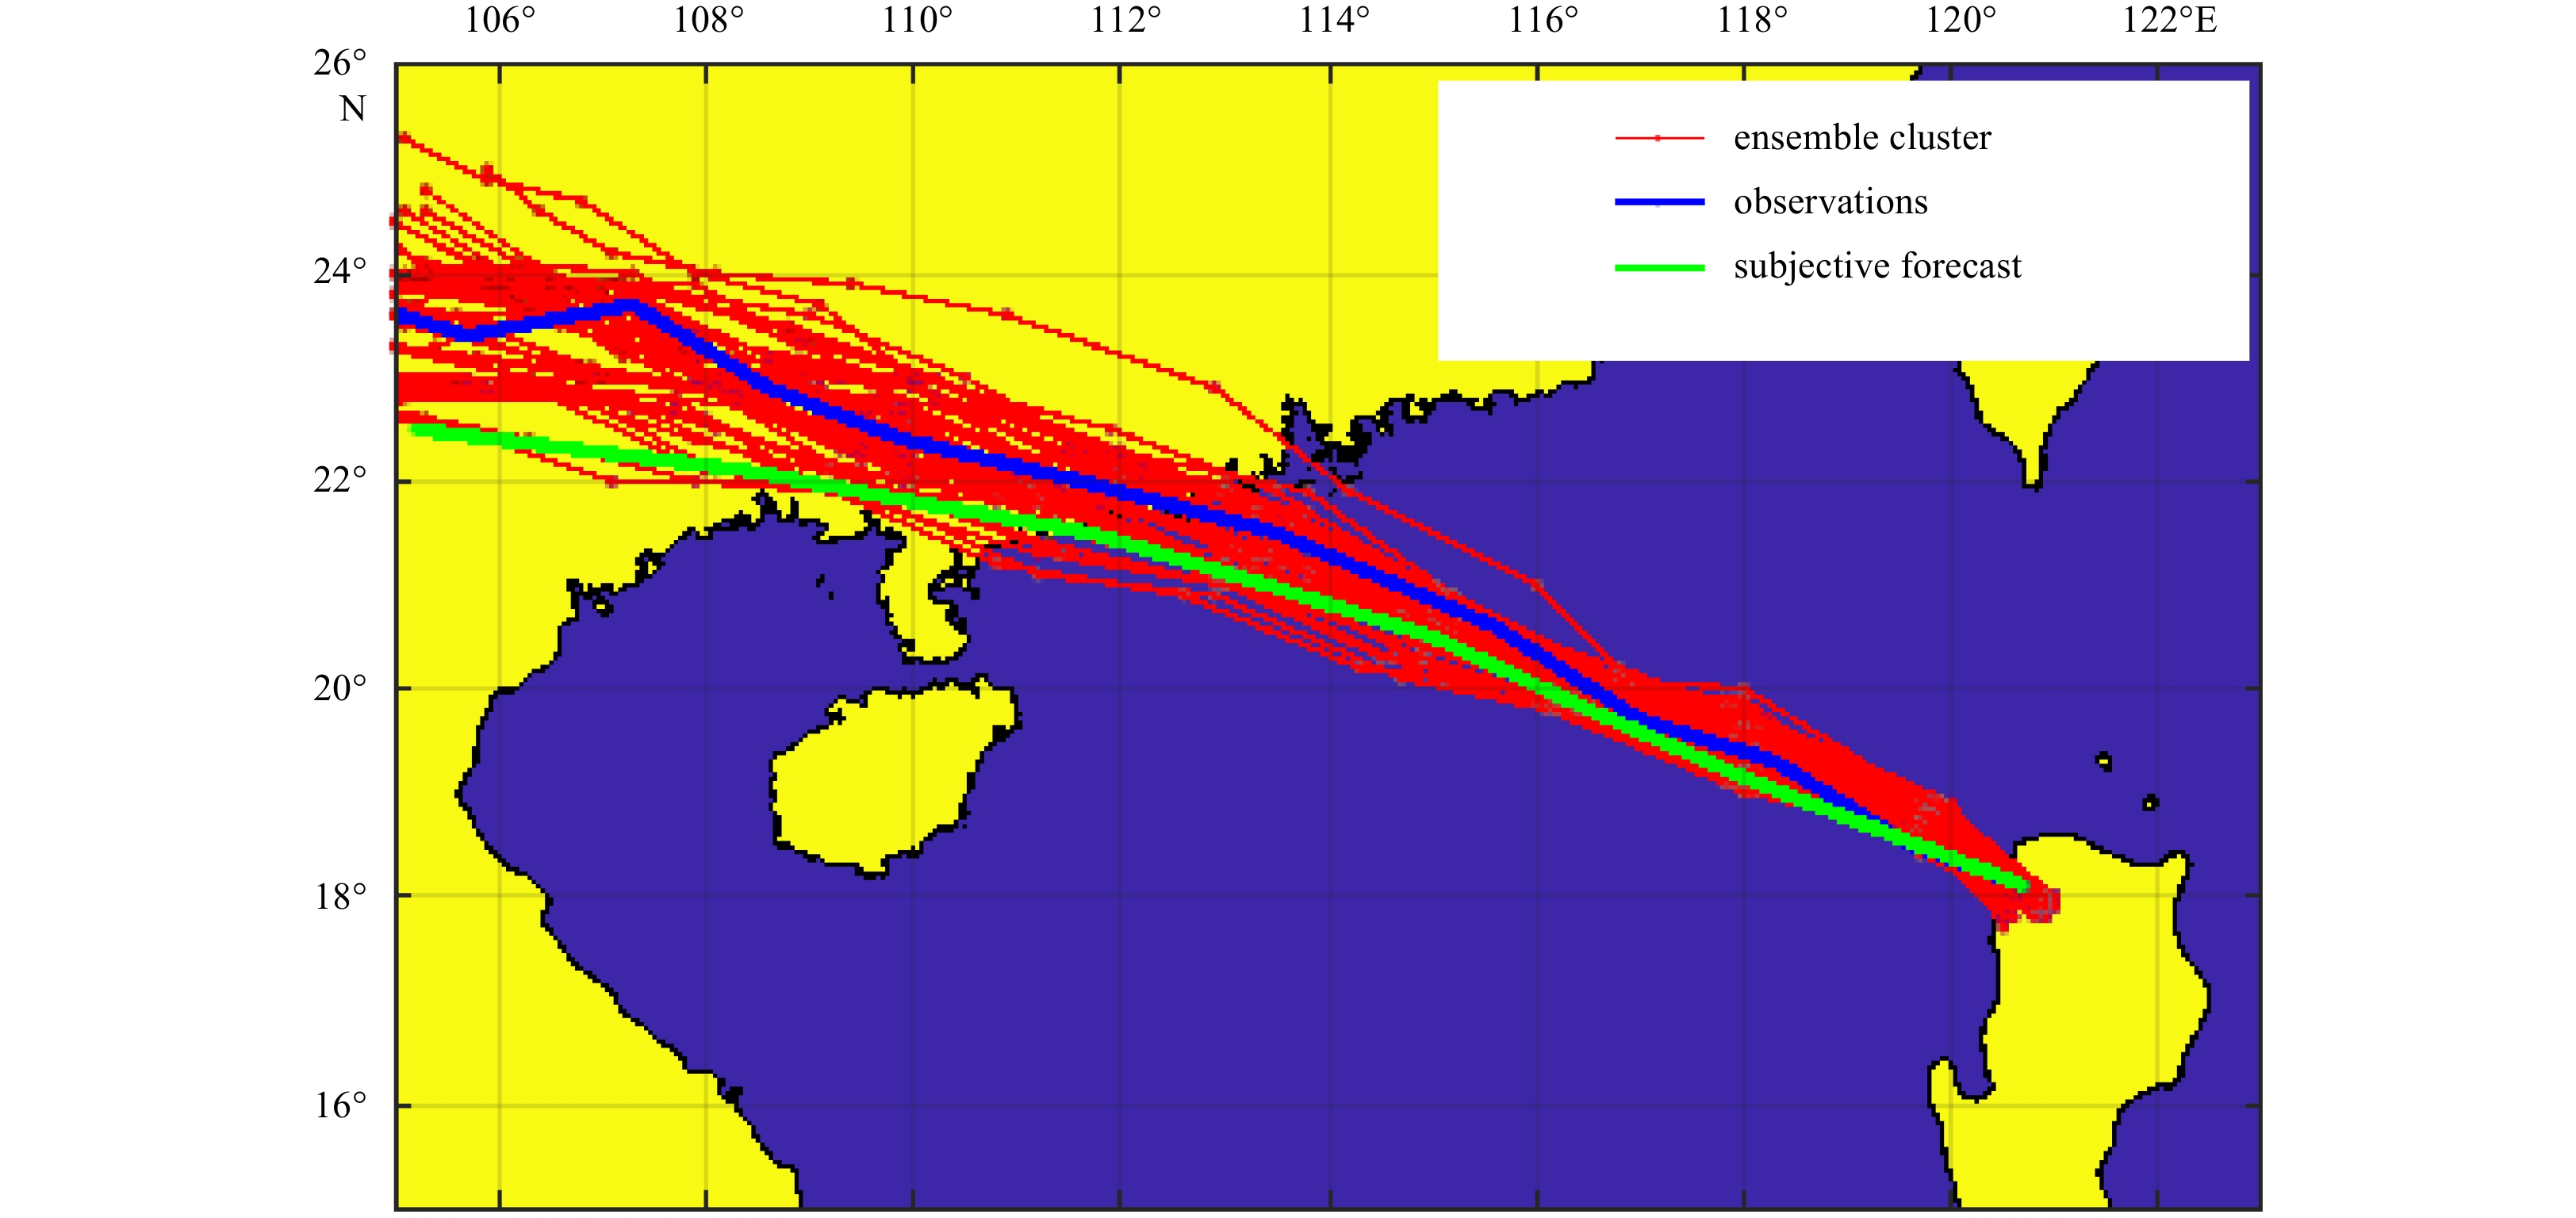
Consider the example of Typhoon Mangkhut, which struck the Luzon Island on September 15, 2018. This was the strongest typhoon to strike Luzon since Typhoon Megi in 2010, and the strongest typhoon to make landfall in the Philippines since Typhoon Haiyan in November 2013. Mangkhut weakened while traversing the mountains of Luzon, before emerging over the South China Sea on September 15. The typhoon subsequently made landfall again on the Taishan coast of Jiangmen, Guangdong Province, China, on the afternoon of September 16. Figure 6 shows the typhoon’s real track (blue line), subjective forecast track (green line), and the perturbed tracks (red lines).

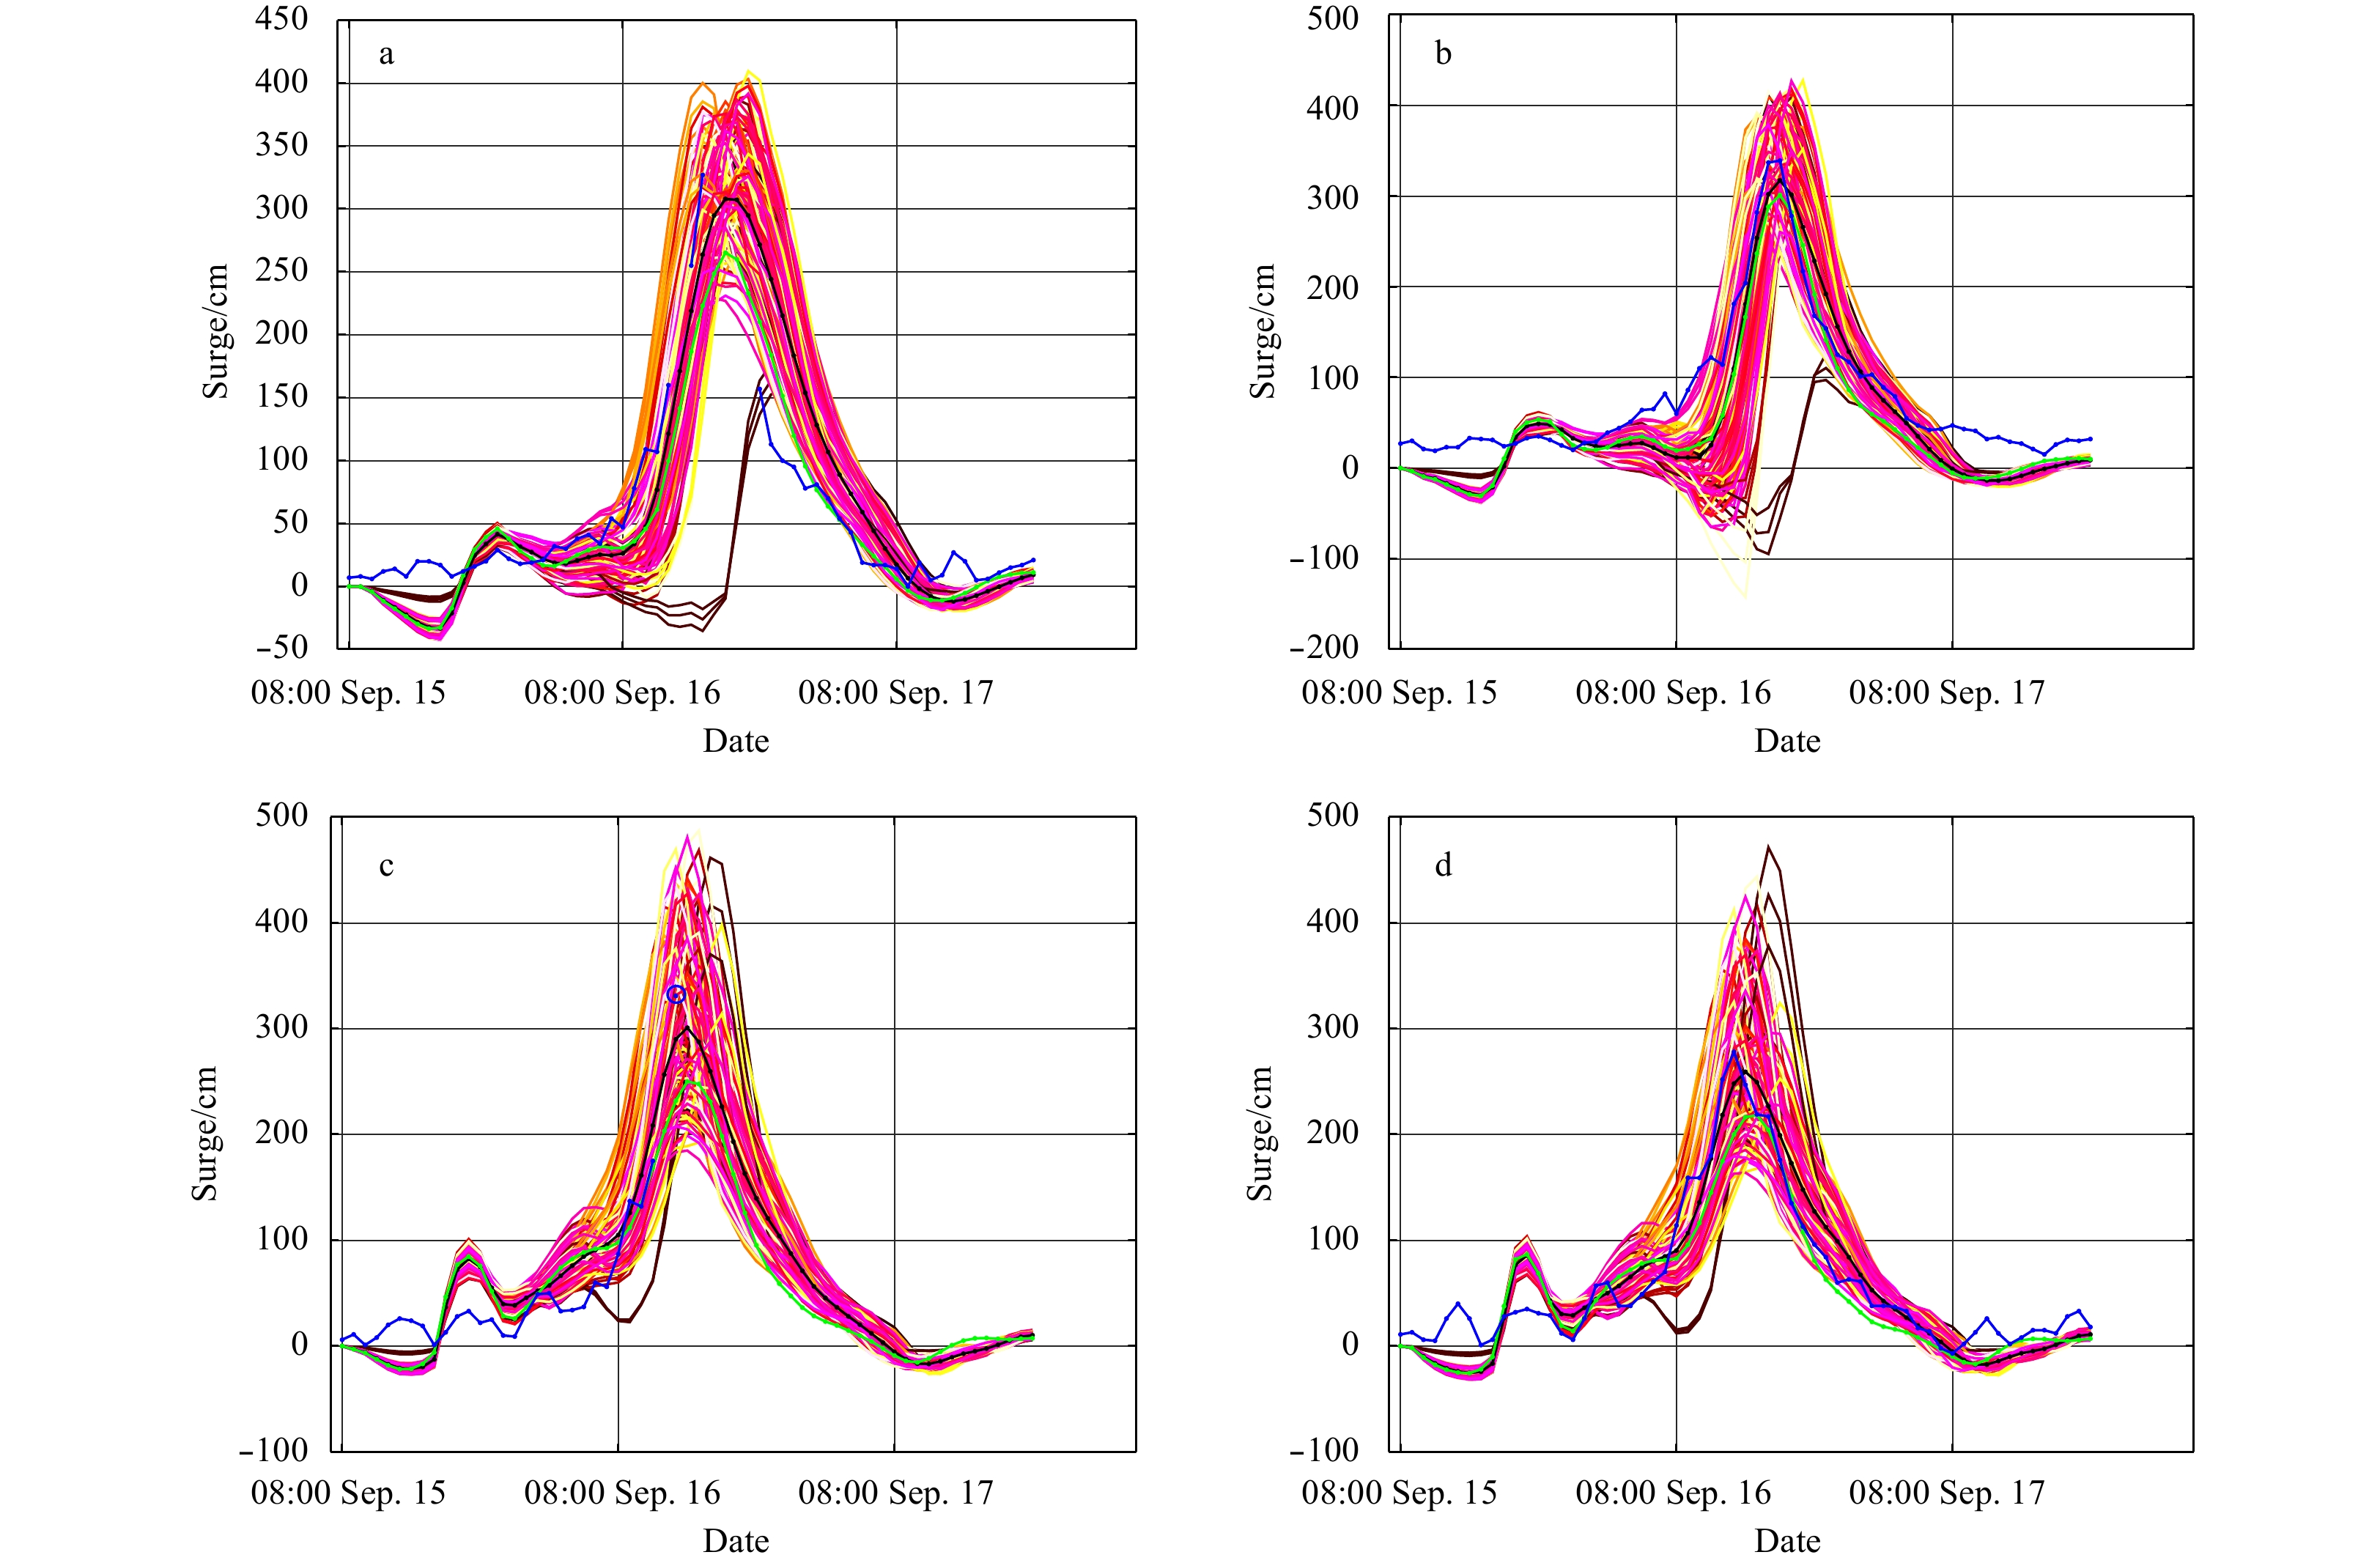
Figure 7 presents the storm surge at specific stations as simulated by the ensemble forecast members and the subjective forecast from CMA. The ensemble forecast results give a comprehensive indication of the possible storm surges. The forecast results not only cover the main vibration phase of the observed data, but also cover the peak value of the storm surge and the occurrence time. The mean ensemble forecast exhibits the highest forecast skill, with a peak value error of 11.4%, followed by the traditional forecast results based on subjective typhoon forecast, which have a peak error of 16.0% (Fig. 7). However, with the lead time of more than 30 h, the simulated surge arrives several hours earlier or later than the observed surge at some stations.

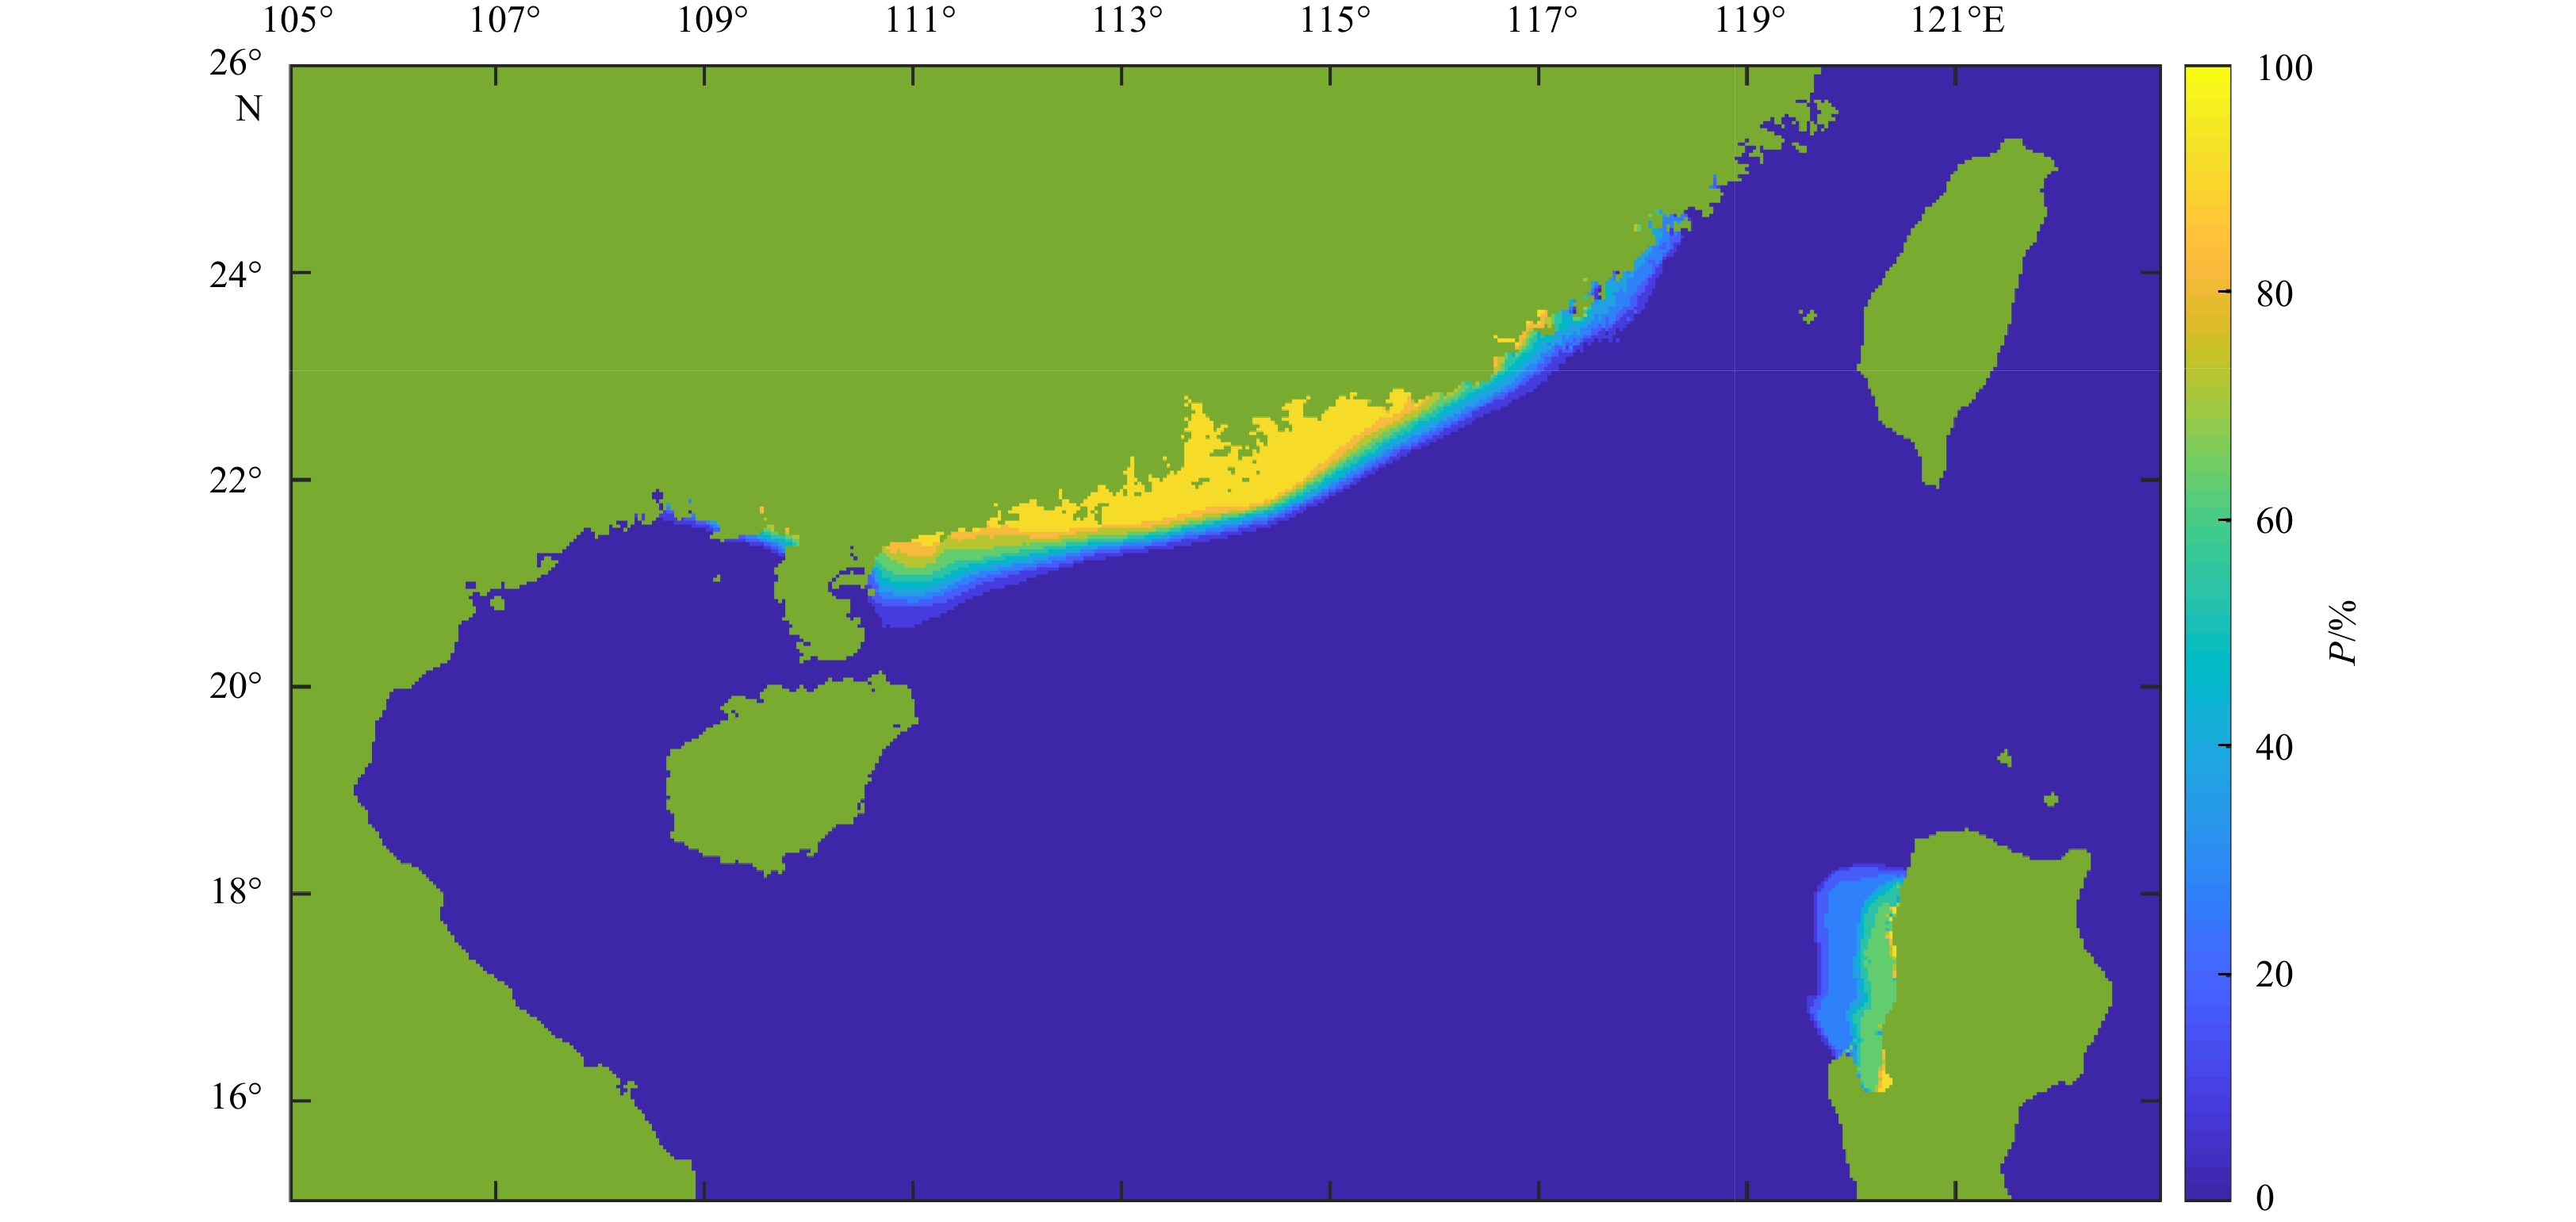
As the error in the atmospheric input far exceeds the error in the model, a probabilistic approach for the input is desirable. The probabilistic typhoon surge method was developed to calculate the probability of the storm surge from an ensemble of forecasts. The specific predicted results provide references for preparedness decisions when faced with storm surges. There are two types of probabilistic surge products: one gives the probability of storm surges greater than X meters, whereas the other provides the height distribution that is exceeded by Y% of the ensemble storm predictions. The storm surge probability forecast product is based on 150 equally weighted ensemble storm surge members. The greater the probability, the more credible the storm surge distribution. Figures 8–10 present probability distribution maps of the storm surge height exceeding 1 m, 2 m, and 3 m, respectively. The area with storm surge heights exceeding 1 m is distributed across a vast area from Shanwei City to Maoming City in Guangdong Province, and the probability is very high.


Storm surge heights exceeding 2 m are mainly distributed from Huizhou City to Yangjiang City with high probability. Heights exceeding 3 m are mainly distributed around the Pearl (Zhujiang) River estuary and have a high probability. Taking the example of typical tidal stations in Guangdong Province (Table 1), the probability that a storm surge will exceed 1 m reaches more than 98%, that for 2 m reaches more than 88%, and that for 3 m reaches more than 50% for Zhuhai, Sanzao, and Yantian tidal stations. This is very consistent with the measurement results.
| Tidal station | Observation /cm | P/% (surge> 100 cm) | P/% (surge> 200 cm) | P/% (surge> 300 cm) |
| Zhuhai | 327 | 100 | 98 | 78 |
| Sanzao | 339 | 98 | 98 | 88.7 |
| Yantian | 343 | 100 | 98 | 52 |
| Huizhou | 278 | 100 | 88 | 28.7 |
 DownLoad:
CSV
DownLoad:
CSV
As the storm surge height increases, the extent of the probability distribution along coastal areas decreases. The larger probabilities of a strong storm surge are mainly concentrated from the Pearl River mouth to Yangjiang City. In particular, when the storm surge height reaches 2 m, only a small area from the Pearl River to Yangjiang City has a relatively high probability of reaching that value. The results are in good agreement with the actual situation.
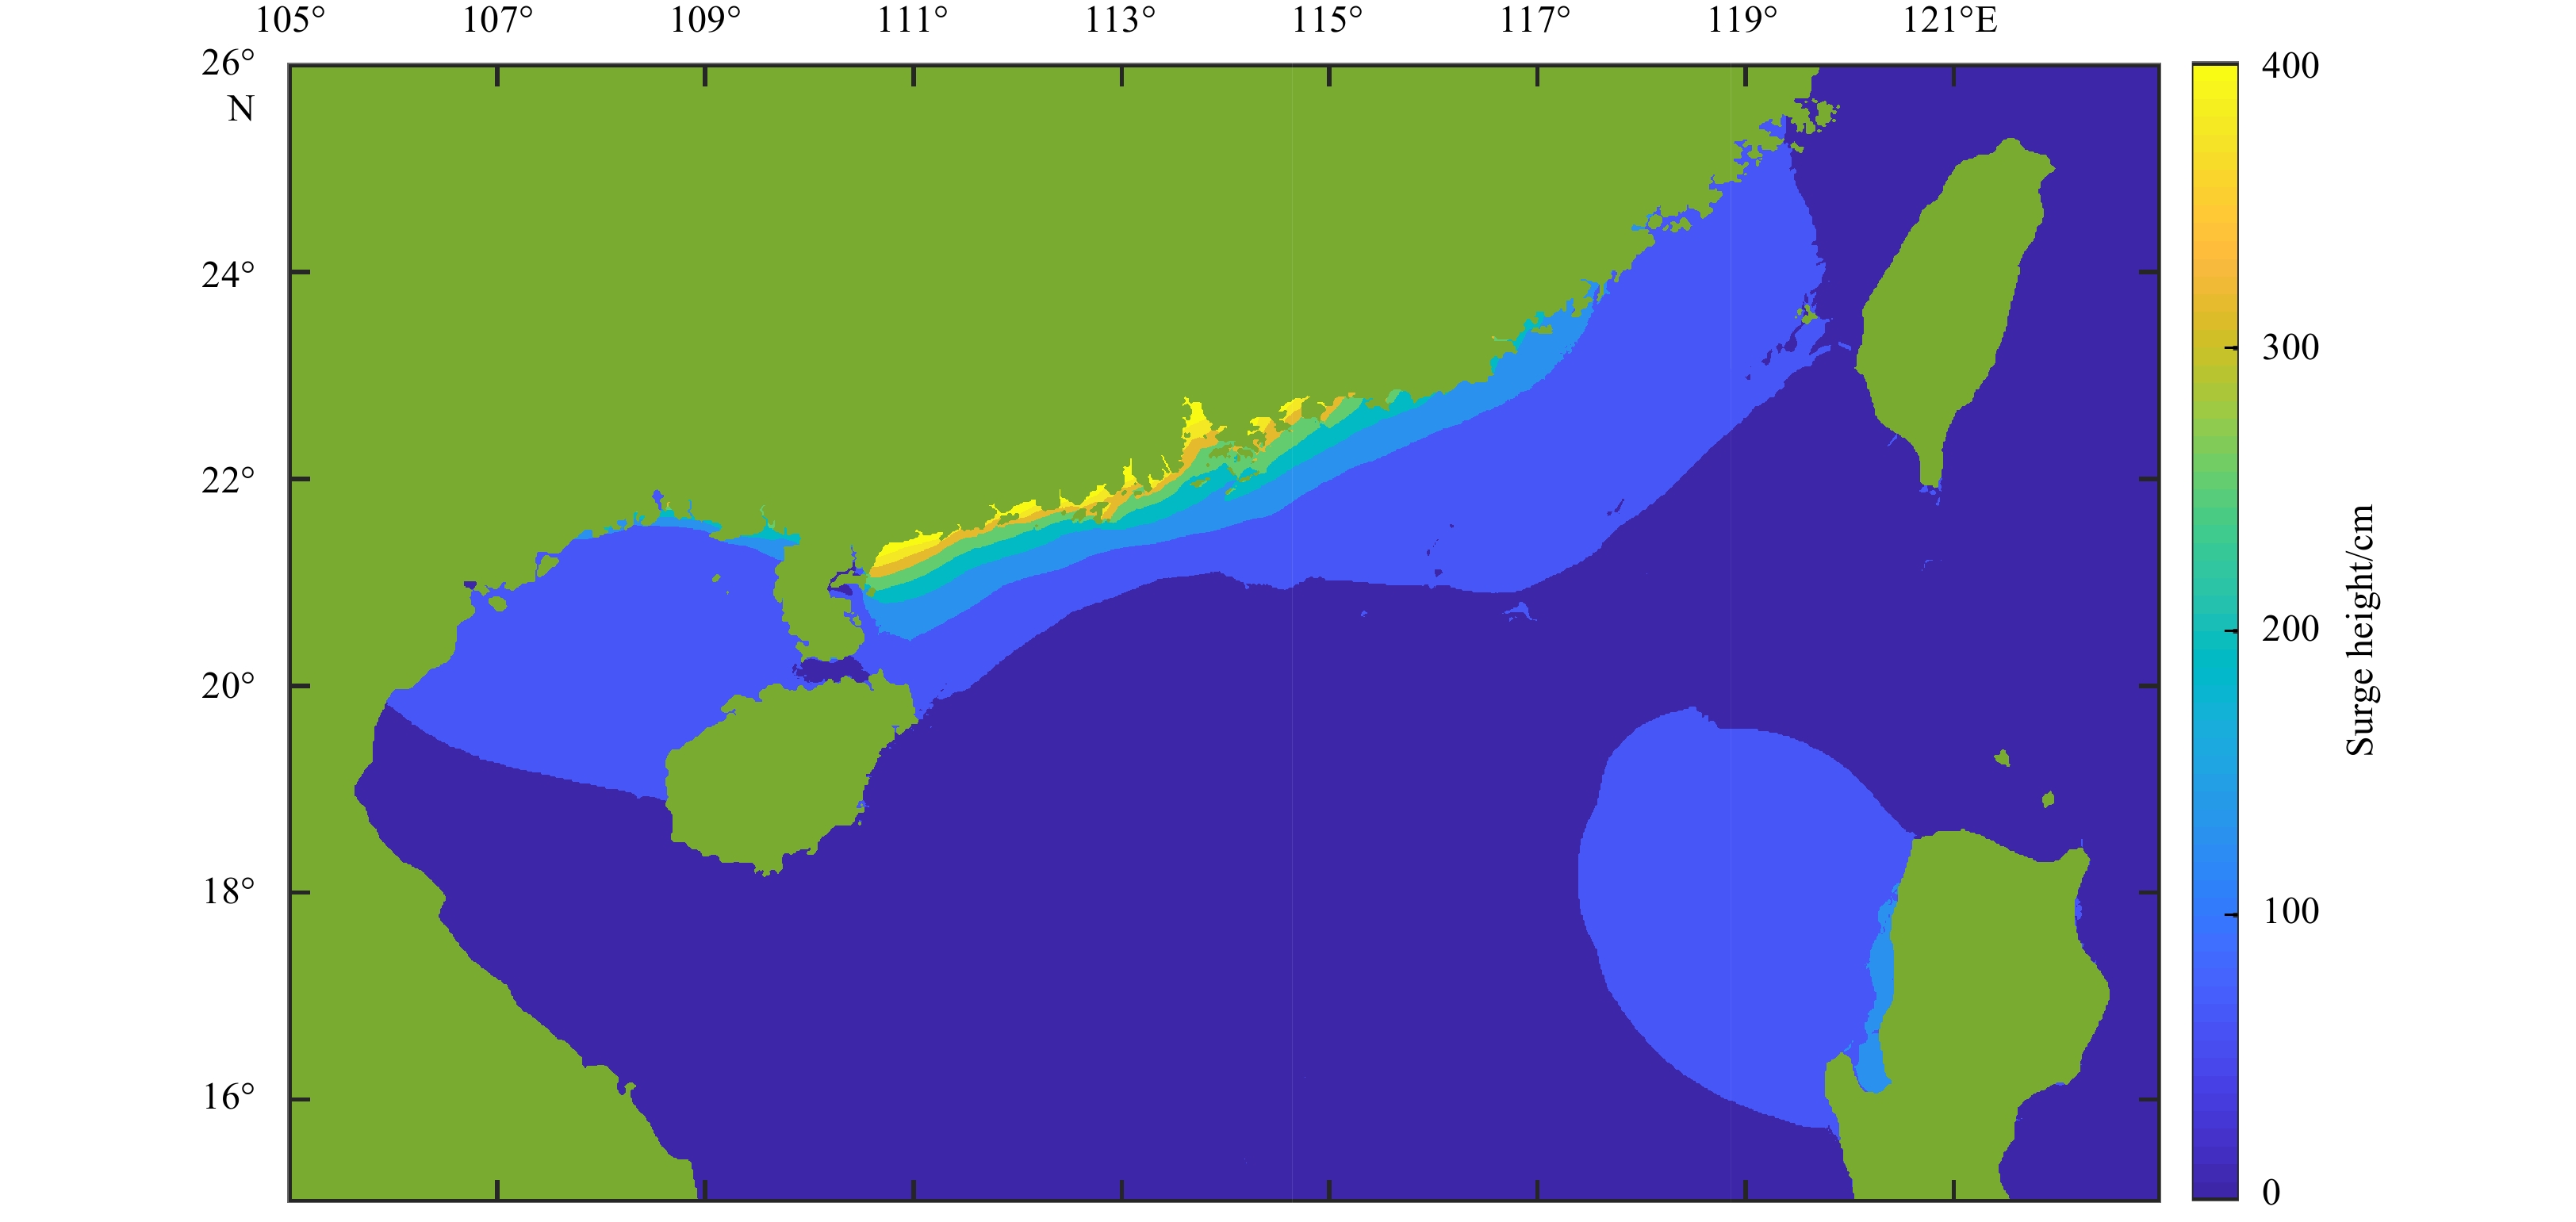
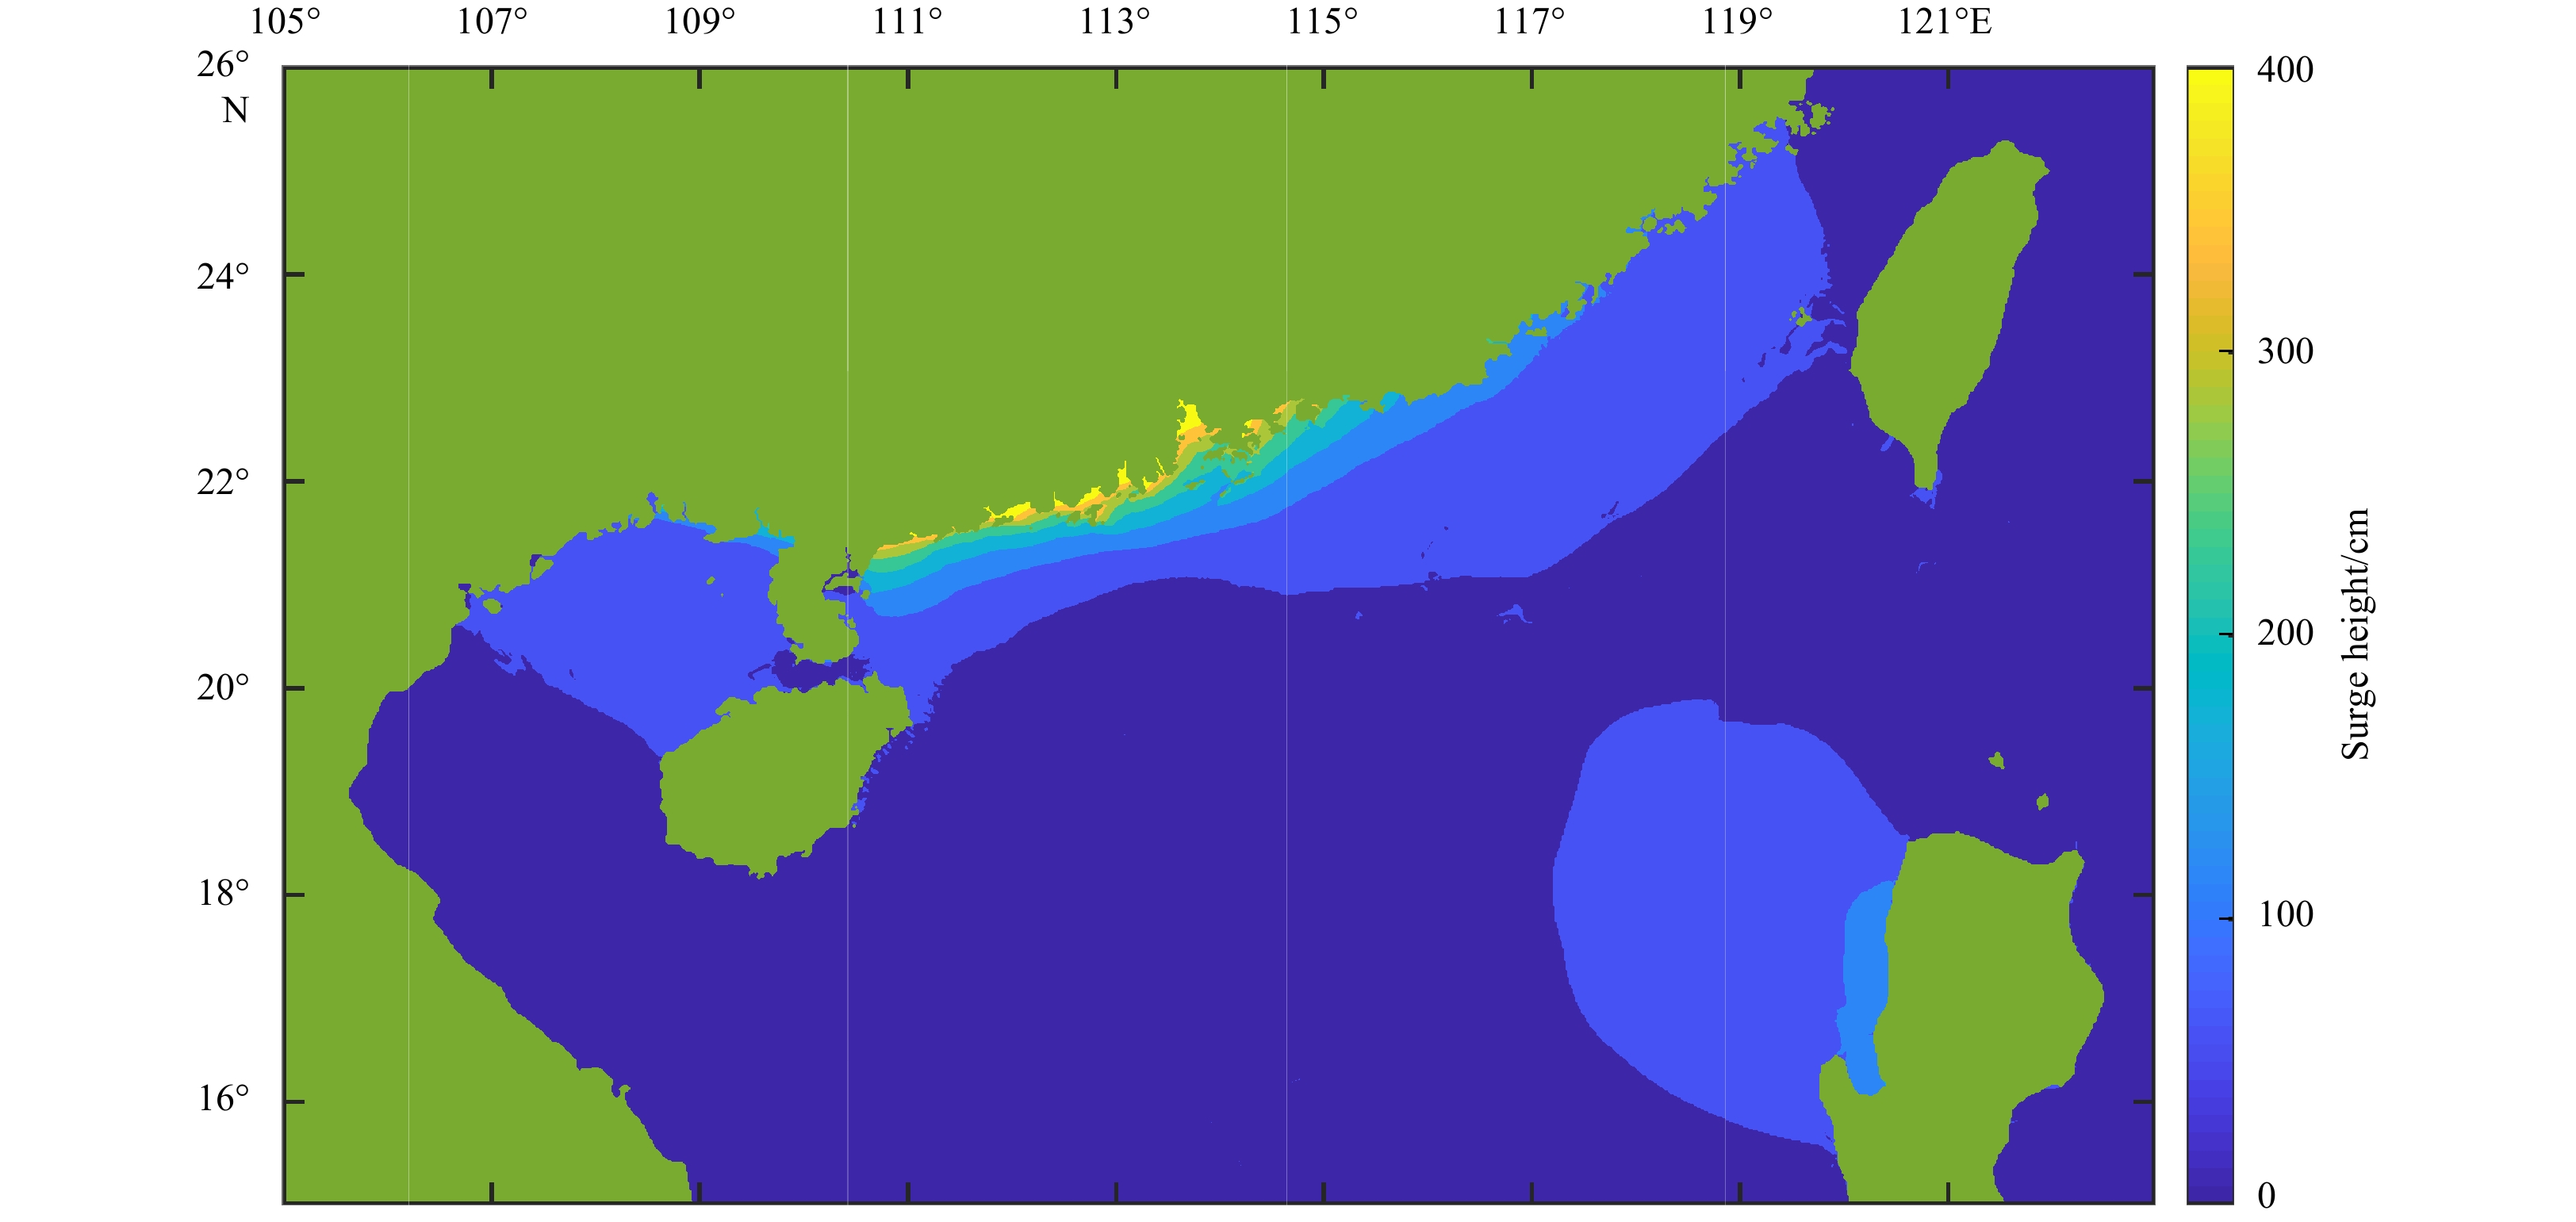
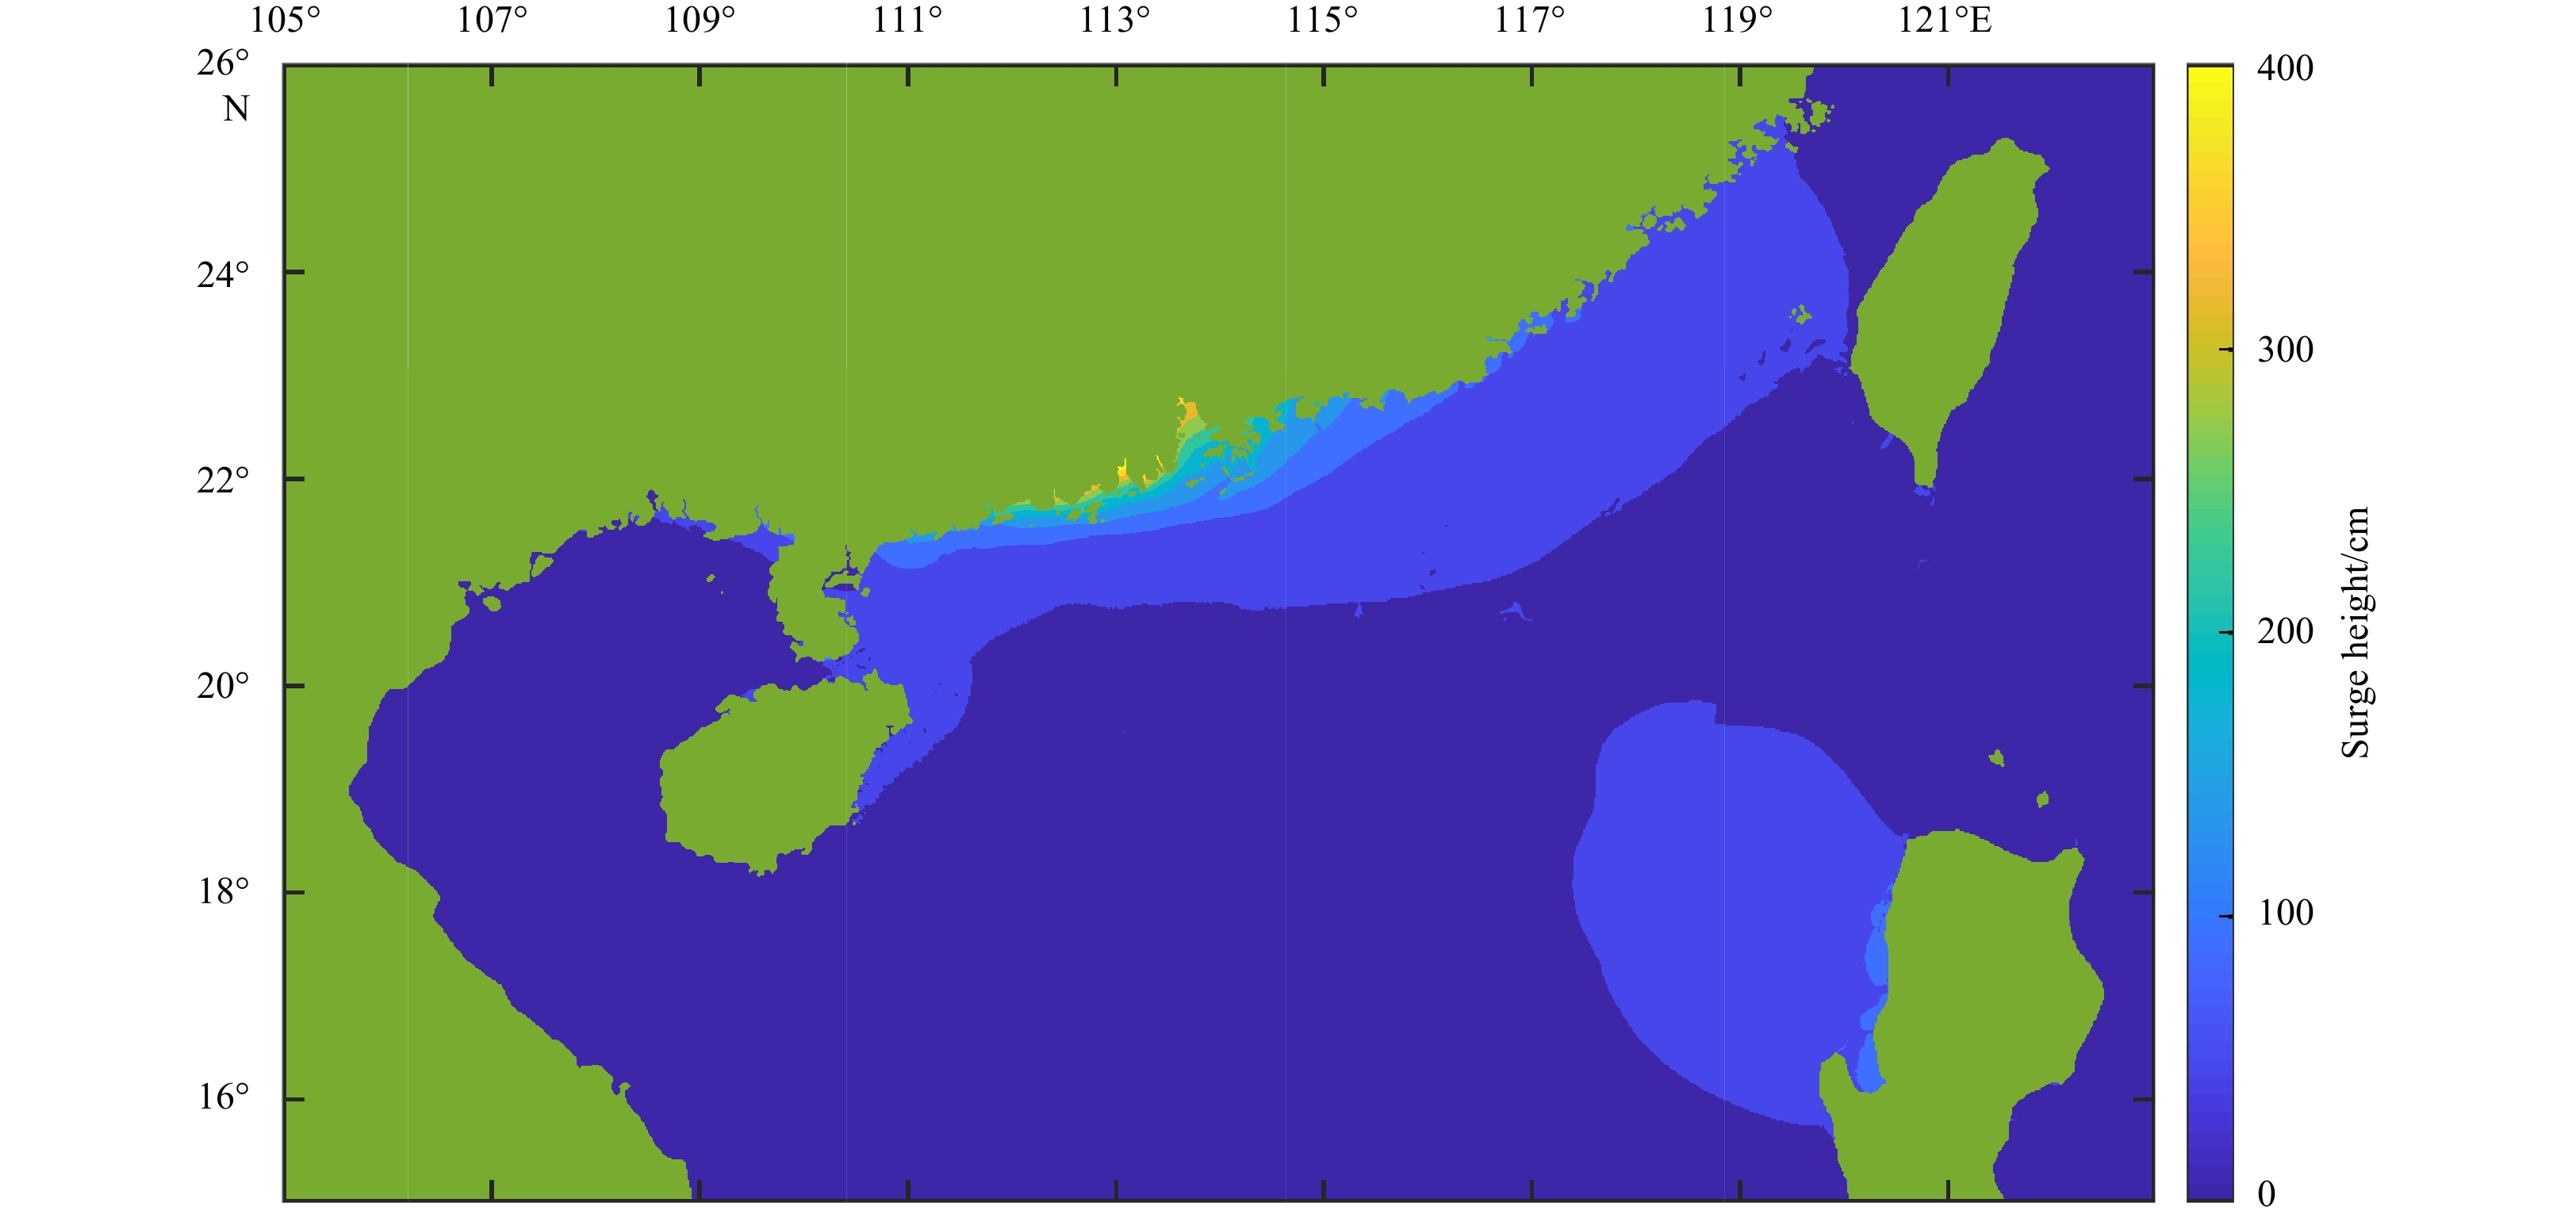
Another category of storm surge probability product shows the storm surge height distribution that has a certain chance of being exceeded. Figure 11 shows the maximum storm surge height distribution among all possible storm surge events. The maximum envelope of the storm surge provides a worst-case basin snapshot for the possible storm track and intensity. Figure 12 shows the storm surge height distribution that has a 10% chance of being exceeded. Compared with the maximum storm surge field, the elevation of the storm surge has been reduced significantly when there is a 10% chance of being exceeded along the coast of Guangdong Province. As the probability increases, the range and intensity of the storm surge shrinks (Figs 11–14). Note that the probabilities actually indicate the chance that damage could occur. A relatively small probability may still exist. Small probability events cannot be ignored for some vulnerable coastal areas.


In this study, a high-resolution and high-efficiency hydrodynamic model was built and a new storm surge ensemble forecast method was applied in the Southern China coastal areas. The major results are summarized below.
As the ensemble storm surge forecast can provide 150 results almost simultaneously, the forecast products can provide much more information than traditional forecasts. For instance, the time series of the ensemble forecast at specific points (Fig. 7) shows that the uncertainty varies over time at a specific site. In fact, some of these ensemble forecast products have already been proposed in previous studies, e.g., the storm surge forecast for the city of Venice (Mel and Lionello, 2014b). The probability forecast products provide maps of cumulative storm surge probabilities that indicate the overall chances of the indicated storm surge occurring at each location on the map during a given period. We could not determine which member is more possible, so every storm surge cases has the same weight in the probability forecast. Similar storm surge forecast products are issued by the National Hurricane Center (
The excellent time-efficiency of the ensemble storm surge forecasts in the study is the result of three main factors: (1) The GPU technique, which enhances computational efficiency significantly. The overall time cost of a three-day surge forecast is less than 25 s on a regular workstation. This is a significant saving compared with many other traditional storm surge forecast models, such as the models used by Ding et al. (2016) and Suh et al. (2015). (2) The typhoon tracks from ECWMF, which are generated under different perturbations and cover nearly all possible future typhoon tracks. The number of typhoon tracks is large compared with many other ensemble storm surge forecast models, such as that of Ding et al. (2016) and Wang et al. (2010). (3) The typhoon intensity forecasts provided by the CMA, which compensate for the ECWMF model underestimating the intensity forecast.
Although the storm surge prediction is generated by an ensemble forecast with 150 members, changes in the typhoon’s path and intensity can only be considered to a certain extent. In particular, the simulation results may be poor when there are rapid changes in intensity near to the shore. The main reason is that such extreme situations are not included in the typhoon ensemble.
In future work, studies will be conducted to derive more general results. The large degree of uncertainty in the determination of the radius of the maximum wind speed should be addressed, and more perturbations in typhoon tracks, intensity, and size should be considered. Additional probabilistic products will also be proposed.
A high-resolution 2-D hydrodynamic model based on shallow water equations was developed to simulate the storm surges resulting from typhoons off the coast of Guangdong Province, China. The predicted storm surges were shown to agree with measurements at specific tide gauge stations. The accuracy of the model was estimated in terms of the root mean square error. Comparisons with observed data indicate that the model results agree well with tidal gauge observations in the Guangdong coastal areas. To reduce the computation time, a GPU technique was used to improve the model efficiency. The computation time was reduced by up to 99% using the GPU-improved model, which can run on ordinary workstations and portable computers.
Based on the GPU-improved model, large-scale storm surge ensemble forecasts can be generated on workstations and PCs. A total of 150 typhoon events were generated based on 50 perturbed paths from ECWMF and three possible central pressures. The results provide specific storm surge heights along coastal stations. Probabilistic forecast products were also examined, providing the storm surge height field distribution that exceeds a certain probability and the probability field distribution that exceeds a certain storm surge height. Ensemble forecast products can also be used as a reference for storm surge height forecasts and disaster mitigation.
| [1] |
Amouzgar R, Liang Qiuhua, Clarke P J. 2016. Computationally efficient tsunami modeling on Graphics Processing Units (GPUs). International Journal of Offshore and Polar Engineering, 26(2): 154–160. doi: 10.17736/ijope.2016.ak10
|
| [2] |
Brodtkorb A R, Trond R H, Martin L S. 2013. Graphics processing unit (GPU) programming strategies and trends in GPU computing. Journal of Parallel and Distributed Computing, 73(1): 4–13. doi: 10.1016/j.jpdc.2012.04.003
|
| [3] |
Bard C M, Dorelli J C. 2014. A simple GPU-accelerated two-dimensional MUSCL-Hancock solver for ideal magnetohydrodynamics. Journal of Computational Physics, 259: 444–460. doi: 10.1016/j.jcp.2013.12.006
|
| [4] |
Chauhan M S, Hammoshi M, Al-Bahri B A S. 2016. Accelerating high arithmetic intensity storm surge model using CUDA. Recent Trends in Parallel Computing, 3(2): 9–21
|
| [5] |
Ding Xuelin, Chen Yongping, Pan Yi, et al. 2016. Fast ensemble forecast of storm surge along the coast of China. Journal of Coastal Research, 2: 1077–1081
|
| [6] |
Dong Jianxi, Fu Xiang, Wu Wei, et al. 2008. Operational Forecast and test of the high nesolution numerical storm surge forecast model for China sea. Marine Forecasts (in Chinese), 25(2): 11–17
|
| [7] |
Flowerdew J, Horsburgh K, Mylne K. 2009. Ensemble forecasting of storm surges. Marine Geodesy, 32(2): 91–99. doi: 10.1080/01490410902869151
|
| [8] |
Higaki M, Hayashibara H, Nozaki F. 2009. Outline of the Storm Surge Prediction Model at the Japan Meteorological Agency. Tokyo: Typhoon Center
|
| [9] |
Liang Qiuhua, Xia Xilin, Hou Jingming. 2016. Catchment-scale high-resolution flash flood simulation using the GPU-based technology. Procedia Engineering, 154: 975–981. doi: 10.1016/j.proeng.2016.07.585
|
| [10] |
Mel R, Lionello P. 2014b. Storm surge ensemble prediction for the city of Venice. Weather and Forecasting, 29(4): 1044–1057. doi: 10.1175/WAF-D-13-00117.1
|
| [11] |
Salighehdar A, Ye Ziwen, Liu Mingzhe, et al. 2017. Ensemble-based storm surge forecasting models. Weather and Forecasting, 32(5): 1921–1936. doi: 10.1175/WAF-D-17-0017.1
|
| [12] |
Sha Tianyang, Yang Guojie, Cheng Zhengquan. 2015. A brief account of the forecast products based on the forecast texts of ensemble prediction from ECMWF. Guangdong Meteorology (in Chinese), 37(1): 4–9
|
| [13] |
Suh S W, Lee H Y, Kim H J, et al. 2015. An efficient early warning system for typhoon storm surge based on time-varying advisories by coupled ADCIRC and SWAN. Ocean Dynamics, 65(5): 617–646. doi: 10.1007/s10236-015-0820-3
|
| [14] |
Wang Xinian. 2001. Storm surge forecast technique. Marine Forecasts (in Chinese), 19(2): 64–70
|
| [15] |
Wang Xinian, Yin Qingjiang, Zhang Baoming. 1991. Research and applications of a forecasting model of typhoon surges in China Seas. Advances in Water Science (in Chinese), 2(1): 1–10
|
| [16] |
Wang Peitao, Yu Fujiang, Liu Qiuxing, et al. 2010. Study of refined ensemble numerical typhoon surge forecast technology for Fujian coast. Marine Forecasts (in Chinese), 27(5): 7–15
|
| [17] |
Yu Fujiang, Zhang Zhanhai. 2002. Implementation and application of a nested numerical storm surge forecast model in the East China Sea. Acta Oceanologica Sinica, 21(1): 19–31
|
| 1. | Zeguo Wen, Fuming Wang, Jing Wan, et al. Assessment of the tropical cyclone-induced risk on offshore wind turbines under climate change. Natural Hazards, 2024. doi:10.1007/s11069-023-06390-3 | |
| 2. | Cifu Fu, Honglin Guo, Kaikai Cheng, et al. Improvement in Storm Surge Numerical Forecasting Based on Wave Buoys Data. Water, 2024, 16(8): 1079. doi:10.3390/w16081079 | |
| 3. | Xiang Fu, Jingming Hou, Qiuuxing Liu, et al. Evaluation of surge hazard based on a storm surge hazard indicator along the mainland coast of China. Natural Hazards, 2023, 116(3): 3481. doi:10.1007/s11069-023-05820-6 | |
| 4. | Qiuxing Liu, Mingjie Li, Sendong Liang, et al. Research on and application of the operational storm surge ensemble forecast model in the Bay of Bengal. Applied Ocean Research, 2023, 130: 103413. doi:10.1016/j.apor.2022.103413 | |
| 5. | Y. Pan, Y. Liu, Y.P. Chen, et al. Probability forecast of storm surge levels in the Changjiang Estuary induced by tropical cyclones based on the Error-Estimation Ensemble method. Ocean Engineering, 2022, 245: 110524. doi:10.1016/j.oceaneng.2022.110524 | |
| 6. | Hong Xu, Wan-Yu Wang, Hongguang Pan. A Method Based on Numerical Wind Field and Extreme Learning Machine for Typhoon Wind Speed Prediction of Wind Farm. Mathematical Problems in Engineering, 2021, 2021: 1. doi:10.1155/2021/7147973 |


Figures(14) / Tables(1)

Supported by:
Beijing Renhe Information Technology Co. Ltd

Qiuxing Liu, Jinrong Jiang, Fujiang Yu, Changkuan Zhang, Jianxi Dong, Xiaojiang Song, Yuzhu Wang. Typhoon storm surge ensemble forecast based on GPU technique[J]. Acta Oceanologica Sinica, 2020, 39(5): 77-86. doi: 10.1007/s13131-020-1570-8

| Tidal station | Observation /cm | P/% (surge> 100 cm) | P/% (surge> 200 cm) | P/% (surge> 300 cm) |
| Zhuhai | 327 | 100 | 98 | 78 |
| Sanzao | 339 | 98 | 98 | 88.7 |
| Yantian | 343 | 100 | 98 | 52 |
| Huizhou | 278 | 100 | 88 | 28.7 |
DownLoad:
CSV
 DownLoad:


 DownLoad: