Daohuan Xu, Ling Du, Jingkai Ma, Huangyuan Shi. Pathways of meridional atmospheric moisture transport in the central Arctic[J]. Acta Oceanologica Sinica, 2020, 39(5): 55-64. doi: 10.1007/s13131-020-1598-9
Citation:
Daohuan Xu, Ling Du, Jingkai Ma, Huangyuan Shi. Pathways of meridional atmospheric moisture transport in the central Arctic[J]. Acta Oceanologica Sinica, 2020, 39(5): 55-64. doi: 10.1007/s13131-020-1598-9
Daohuan Xu, Ling Du, Jingkai Ma, Huangyuan Shi. Pathways of meridional atmospheric moisture transport in the central Arctic[J]. Acta Oceanologica Sinica, 2020, 39(5): 55-64. doi: 10.1007/s13131-020-1598-9
Citation:
Daohuan Xu, Ling Du, Jingkai Ma, Huangyuan Shi. Pathways of meridional atmospheric moisture transport in the central Arctic[J]. Acta Oceanologica Sinica, 2020, 39(5): 55-64. doi: 10.1007/s13131-020-1598-9
Physical Oceanography Laboratory, Ocean University of China, Qingdao 266100, China
Funds:
The Global Change Research Program of China under contract No. 2015CB953902; the National Natural Science Foundation of China under contract Nos 41376008, 41330960 and 41576020.
Atmospheric moisture transport plays an important role in latent heat release and hydrologic interactions in the Arctic. In recent years, with the rapid decline in sea ice, this transport has changed. Here, we calculated the vertically integrated atmospheric moisture meridional transport (AMTv) from two global reanalysis datasets, from 1979–2015, and found moisture pathways into the central Arctic. Four stable pathways showed an occurrence frequency greater than 70%, and these pathways exhibited a perennial seasonal pattern in the atmosphere above the Laptev Sea Pathway (LSP), Canadian Arctic Archipelago Pathway (CAAP), both sides of the Greenland plateau. Another seasonal pathway appeared above the east of the Chukchi Sea (CSP) during the melting/freezing months (March to September). Through these pathways, AMTv contributed a total moisture exchange of 60%–80%—averaged over a 75°N circle—and focused on the low troposphere. Transports across the LSP, CSP and CAAP pathways likely create an enclosed moisture route. Meridional moisture fluxes are intensified in the Pacific sector of Arctic (PSA), especially during melting/freezing months. AMTv interannual variabilities are illustrated mainly in the Laptev Sea and the east Greenland pathway. Results indicate that accompanying a tendency for a stronger Beaufort Sea High in this sea level pressure field, AMTv through PSA pathways, switched from output to input, and approximately 960 km3 of equivalent liquid water was transferred into the central Arctic during each decade. The detrended AMTv increment is highly correlated with the rapid decline of old ice areas (correlation coefficient is –0.78) for their synchronous fluctuations in the 1980s and the last decade.
During the last few decades, the observed Arctic surface temperature showed a remarkable warmer trend than global average (Polyakov et al., 2002; Serreze et al., 2009; Hartmann et al., 2013). Global warming, and a decline in September sea ice extent, have led to an increasing temperature, resulting in an intensification of the regional hydrological cycle in the Arctic, and a rapidly changing Arctic. From 2007–2012, Arctic air circulation showed a persistent change in early summer wind patterns, relative to previous decades (Overland et al., 2012), which contributes to the changing atmospheric moisture transport (AMT). AMT plays an important role in Arctic atmospheric latent heat release and hydrological interactions, and it’s a significant component in the Arctic Ocean freshwater budget (Rosen et al., 1979), and accompanies the accelerating melt rate of the Greenland ice sheet (Mioduszewski et al., 2016). Corresponding with a study by Peterson et al. (2002), Zhang et al. calculated the net AMT over Eurasian Arctic river basins and pointed out its connection with the increased river discharges from 1948–2008 (Zhang et al., 2013). Furthermore, increases precipitation over the Arctic-subarctic region (Higgins and Cassano, 2009) implies Arctic are experiencing a wetting state (Rinke et al., 2009).
Throughout the last few decades, the increasing Arctic moisture was primarily dependent on the transport of moisture from extratropical regions into the Arctic, while the influence of evaporation is not strong (Gimeno et al., 2015). Meridional AMT at 70°N shows an apparent poleward advection, except in equatorward fluxes above the Canadian Arctic archipelago (Serreze et al., 1995). Previous study reveals that subtropical and southern extratropical Pacific and Atlantic Oceans, North America, and Siberia are the major moisture sources (Vázquez et al., 2016), and Dufour et al. suggest poleward AMT concentrates in three main regions of the North Atlantic, Baffin Bay and North Pacific at 70°N latitude band (Dufour et al., 2016). Divided Arctic regions into Arctic Ocean and 13 major subdomains, a general decrease in moisture transport appears in summer and enhanced moisture transport are in autumn and early winter, with different contributions depending on the moisture source and ocean sub-region (Gimeno-Sotelo et al., 2018). However, further exploration of the spatial and temporal characteristics of AMT, as well as the steady moisture transport pathways, is needed in the central Arctic region, north of 75°N.
An anomalous transport of moisture is frequently occurred in recent years, and 2007 and 2012 are two typical ca although patterns differed in each year (Vázquez et al., 2017). A study by Liu et al. (2012) suggests that the reduction of sea ice drives increase in atmospheric water vapor content in the Arctic region during late autumn and winter, which provided an associated increase in heavy snowfall in Europe during early winter of that year (Liu et al., 2012). Reduction of sea ice will also lead to the saturation vapor pressure rising and more vapor entered to the atmosphere (Higgins and Cassano, 2009). Thus, the intensification of the atmospheric water cycle may be driven by local evaporation over ice-free oceans or by stronger moisture advection from subpolar and mid-latitudes (Bintanja and Selten, 2014; Kopec et al., 2016), while the enlarged area of open ocean leads to increased atmospheric moisture. In contrast, melt onset over Arctic sea ice is initiated by positive anomalies of moisture transport, clouds, and air temperatures that increase downwelling longwave radiation to the surface (Mortin et al., 2016). The enhanced transport of humid air leads to an anomalous convergence of humidity and increased cloudiness, which further enhance the greenhouse effect (Kapsch et al., 2013). Furthermore, physical features of sea ice are changing. For example, Stroeve et al. (2012) reported that September sea ice extent exhibited distinct decreasing linear trends of –12.4% decade–1 (per decade). Additionally, the multiyear ice extent and area are declining at the rapid rates of –15.1% and –17.2% decade–1, respectively (Comiso, 2012). Thus, Arctic sea ice plays as an important role in the regulation of heat and moisture exchange between atmosphere and ocean.
Here, we performed statistical analyses of meridional moisture exchange between the Arctic and subarctic and found steady pathways of the meridional atmospheric moisture transport (AMTv), as well as an interaction between moisture transport and sea ice variation. In Section 2 we introduce the data and methods used in this study. In Section 3, we present the four perennial pathways and one seasonal pathway in the central Arctic region, and discuss their spatial pattern and the vertical structures of meridional atmospheric moisture. In Section 4, we focus on the interannual variability and long-term trend of AMTv across pathways. Finally, in Section 4, we analyze the possible connection between the Pacific-Arctic AMTv and the Arctic sea ice variations.
2.
Data and methodology
The primary reanalysis datasets used in this study come from the National Center for Atmospheric Research/National Center for Environmental Prediction reanalysis 1 (NCEP-NCAR R1) and the European Centre for Medium-Range Weather Forecasts reanalysis (ERA-Interim). NCEP-NCAR R1 and ERA-Interim provide continuous atmospheric views over several decades by combining numerical weather forecasts with historical atmospheric observations from 1979–2015. The spatial resolutions of NCEP-NCAR R1 is 2.5° × 2.5°, and selected 0.5° × 0.5° resolution atmospheric product from ERA-Interim dataset, respectively. There is an apparent overestimation of NCEP-NCAR R1 AMTv calculations in complex orography, such as Alaska, Scandinavia, and Greenland because of the lower spatial resolution of the R1 dataset (Dufour et al., 2016). After examining the difference between two datasets carefully, NCEP-NCAR R1 results were quite close to ERA-interim in other regions, particularly in high latitude oceanic regions.
We used vertically integrated methods based on Serreze et al. (1995), whose equation has been used in several related studies (Zhang et al., 2013; Dufour et al., 2016). At each grid, we computed AMTv, from the surface to a maximum height of 300 hPa, using the following equation:
where P0 is surface pressure, PN is the 300 hPa pressure level, g (gravity) equals 9.8 m/s2, q is monthly-averaged specific humidity (unit: g/kg), v presents monthly meridional wind speed (m/s), and AMTv is divided by 1 000 to coverts its unit into kg/(m·s), as the previous studies (Zhang et al., 2013). NCEP-NCAR R1 contains 8 levels of specific humidity and 17 levels of wind (of which the lower 8 levels are in accordance), while ERA-Interim contains 37 levels. Thus, we chose 8 layers from surface to 300 hPa. Furthermore, the vertical integral of the variable followed the trapezoidal rule.
The equivalent liquid water (We) through the pathways during the specific period of time is calculated by using the following equation:
where k infers the individual AMTv pathway, ρw is water density, t1 and t2 (unit: s) represent the beginning and ending times, which represents the first and last second of the month, l2–l1 presents the length of the pathway (unit: m) and We describes the equivalent liquid water, whose units are in km3 by applying the conversion factor is 10–9 (1 m3=10–9 km3).
AMTv characteristics are investigated by the statistical methods, such as Empirical Orthogonal Function (EOF) analysis, wavelet analysis, and Stochastic Dynamic Method (SDM). The SDM method decomposes the raw data into the polynomial, periodical and random terms. Thus, the method can distinguish the interior fluctuations and long-term trend of the raw data (Epstein, 1969). In Section 3.1.2, we apply the maximum entropy spectrum method to find the comparatively precise cycles of AMTv interannual variations, considering the simultaneous linear trend. The comprehensive introduction about the method can be found from Zuo et al. (2018). Pearson’s correlation coefficient and partial correlation coefficient are calculated in this paper.
Ice age and ice concentration data came from the American National Snow and Ice Data Center (NSIDC) and were used to discuss the connection between old ice and AMT during melting/freezing the months of March to September (Mar.–Sep.) in Section 3.2. Additionally, we used edited Goddard climate data records, of passive microwave monthly sea ice concentrations, from 1979–2015. September ice area was calculated for ice concentrations greater than 15%. Weekly sea ice age data were from the first week of 1984 to the last week of 2014, and the spatial distribution was 12.5 km × 12.5 km. For each corresponding grid cell, the ice concentration above 15% throughout the melt season was assumed to have survived the summer, and its age was incremented by one year (Maslanik et al., 2007).
3.
Results
3.1
Spatial and temporal variability of AMTv
3.1.1
Pathways of AMTv over the central Arctic
To determine the characteristics of atmospheric moisture flux, we examined the spatial distribution, vertical features, and transport pathways north of 70°N. Moisture exchange, between the Arctic and subarctic, mapped geographical variability. To obtain steady moisture pathways in the central Arctic, we chose 70% as the critical value of statistical frequency for determining their geographic positions. The transport frequency and magnitude of meridional AMT are both considered of the positions of pathways, the 70% frequency threshold is similar to the 5 kg/(m·s) moisture transport threshold, and we regard the regions limited by two thresholds as the meridional moisture transport pathways. Moisture exchange showed that AMTv core regions, which were higher than the critical value, were located at a latitude of 75°N. There were four perennial pathways located in Greenland, the Canadian Arctic Archipelago, and the Laptev Sea, as well as a seasonal pathway above the Chukchi Sea, which mostly appeared from Mar.–Sep., when most sea ice melt was observed. Long-term averages showed that the four perennial pathways consisted of the major meridional moisture transport, crossed 30% of the area, and contained 70% AMTv in the Arctic (Fig. 1, Table 1). Table 1 shows characteristics of the four pathways in the two datasets. In our study, we focus on the meridional moisture transport pathways, i.e., the moisture exchange between the central Arctic and subarctic but not the moisture source. Furthermore, it can be inferred that AMT through pathways comes from the moisture source regions, that previous study has used Lagrangian diagnosis model FLEXPART to localize that four major moisture sources for the Arctic region: the subtropical and southern extratropical Pacific and Atlantic Oceans, North America, and Siberia (Vázquez et al., 2016).
Figure
1.
Vertical integrated AMTv climatology for the polar cap during 1979–2015. Shading color represents AMTv based on NCEP-NCAR R1 datasets, and the positive value means poleward transport, while the negative value means equatorward transport. Areas surrounded by pink solid line are the regions where meridional moisture transport frequency is more than 70%. The solid lines mark the four perennial pathways and a seasonal pathway which only appears in Mar.−Sep., and all of them are at 75°N circle. Sea level pressure isobaths, titled as 1 013, 1 015 and 1 017 hPa, are signed (dash dot lines).
Table
1.
The moisture transports of two datasets at 75°N circle during 1979–20151)
Pathways (location)
WGP
LSP
CAAP
EGP
70º–35ºW
120º–150ºE
125º–85ºW
30º–10ºW
Average contribution 2)
56.0% (48.7%)
12.6% (15.0%)
–57.6% (–47.4%)
–22.3% (–24.0%)
Average strength / kg·m–1·s–1
23.6 (16.4)
6.2 (5.9)
–12.2 (–8.8)
–10.0 (–10.9)
Statistical frequency
99% (99%)
75% (78%)
–91% (–86%)
–78% (–84%)
Transport capacity 3) / km3·mon–1
62.8 (44.2)
14.1 (13.5)
–37.0 (–33.4)
–15.2 (–16.9)
Note: 1) The positive values present poleward moisture transport, while negative value means equatorward transport. The values are shown as the results by NCEP-NCAR R1, and the results in parentheses from ERA–Interim datasets. 2) The average contribution is the transport capacity ratio of the AMTv pathways to the 75°N circle exchange (in the same direction).3) Transport capacity is calculated by AMTv zonal integral along a specified latitude.
In the Pacific Sector of the Arctic Ocean (PSA), there were two perennial pathways and one seasonal pathway—the Canadian Arctic Archipelago Pathway (CAAP), the Laptev Sea Pathway (LSP), and the Chukchi Sea Pathway (CSP), respectively (Fig. 1). Moisture through the CAAP showed an intense equatorward transport of approximately –15 kg/(m·s). This indicates the large moisture departure in the Arctic, and precisely covers the old ice region. Old ice variations may be related to moisture transport, which will be discussed in Section 4. As for LSP, although the value was relatively small (10 kg/(m·s)) it is an important pathway for bringing warm vapor from the Eurasian continent to the Arctic Ocean, and often extends to north of 85°N. Furthermore, LSP highlights the regions where sea ice diminished rapidly. CSP is only a seasonal AMTv pathway in the Arctic, and appears in Mar.–Sep. when poleward frequency is more than 70%. In autumn and winter, AMTv along CSP is weakened that sometimes the transport direction could be reverse. The pathways over the Canadian Arctic Archipelago, Laptev Sea, and Chukchi Sea accounted for the moisture import and export of the PSA during Mar.–Sep.
These pathways reveal an inherent and complex connection. According to the sea level pressure field, moisture through CAAP primarily comes from all input pathways. Low pressure over Baffin Bay leads the cyclonic moisture transport, then vapor from Greenland enters into the Canadian Arctic Archipelago, where the Pearson’s correlation coefficient between AMTv along WGP and CAAP can reach –0.54 (–0.46 for ERA-Interim). LSP suggests a relatively weak coefficient compared with the West Greenland Pathway (WGP). However, during frozen seasons, a pressure isobar connects the LSP and CAAP. This indicates that these two pathways may be under the control of the same atmospheric pressure system, as their correlation coefficient can reach –0.56 in February. However, in spring and summer, enlarged open water and energetic air-sea interaction may disturb this connection. Since the seasonal CSP appears with an anti-cyclone over Beaufort Sea, CAAP variations may arise from moisture originating in the north Pacific whose correlation coefficients are –0.60, –0.58 and –0.54 in June, July and August respectively.
For poleward AMTv, there is a local moisture exchange cycle, which is established on opposite sides of Greenland, and which clearly illustrates the influence of topographical features. A strong and stable transport occurs along the WGP, with maximum transport reaching 25 kg/(m·s) and a frequency of up to 0.95. Moisture along the WGP may be modulated by the westerly jet and large-scale circulation variations. Moisture transport through WGP diminishes along the west coast of Greenland, where the zonal component is small, compared with the meridional component. This implies that the AMTv convergence is likely subjected to precipitation. Meanwhile, heat flux, carried by meridional moisture exchange along Greenland, is significant, and would influence Greenland glacial melt.
In east Greenland, there exists a pathway called the East Greenland Pathway (EGP), which exhibits weaker features than the WGP—in both magnitude and width. Compared with the WGP, EGP is relatively unstable, with an equatorward frequency of 70%–80%. Sometimes EGP transport flows in the opposite direction because of eastward enlargement of the WGP. ERA-Interim suggests a similar spatial pattern and poleward frequency, but a lower WGP transport value of 18 kg/(m·s).
Moisture transport is modulated on specific humidity and wind, and we calculate the partial correlation coefficient to explore how AMTv depends on these factors. Generally, AMTv is highly connected with Arctic meridional wind. Furthermore, the more AMTv is subjected to greater influence from specific humidity AMTv, the more stable the pathways are. The humidity field is relatively weak compared with that of land and the Greenland-Iceland-Norwegian sea. Higher correlation coefficients with specific humidity are mainly found along these latter pathways (the coefficient can reach 0.8 in WGP and –0.8 in CAAP, respectively). The correlations are ~0.4–0.8 in other pathways. Thus, the partial correlation between AMTv and specific humidity acts as additional evidence of the pathway locations. The entire central Arctic exhibits high correlations between AMTv and meridional wind at about 0.7–0.9, with the two reanalysis datasets indicating similar results.
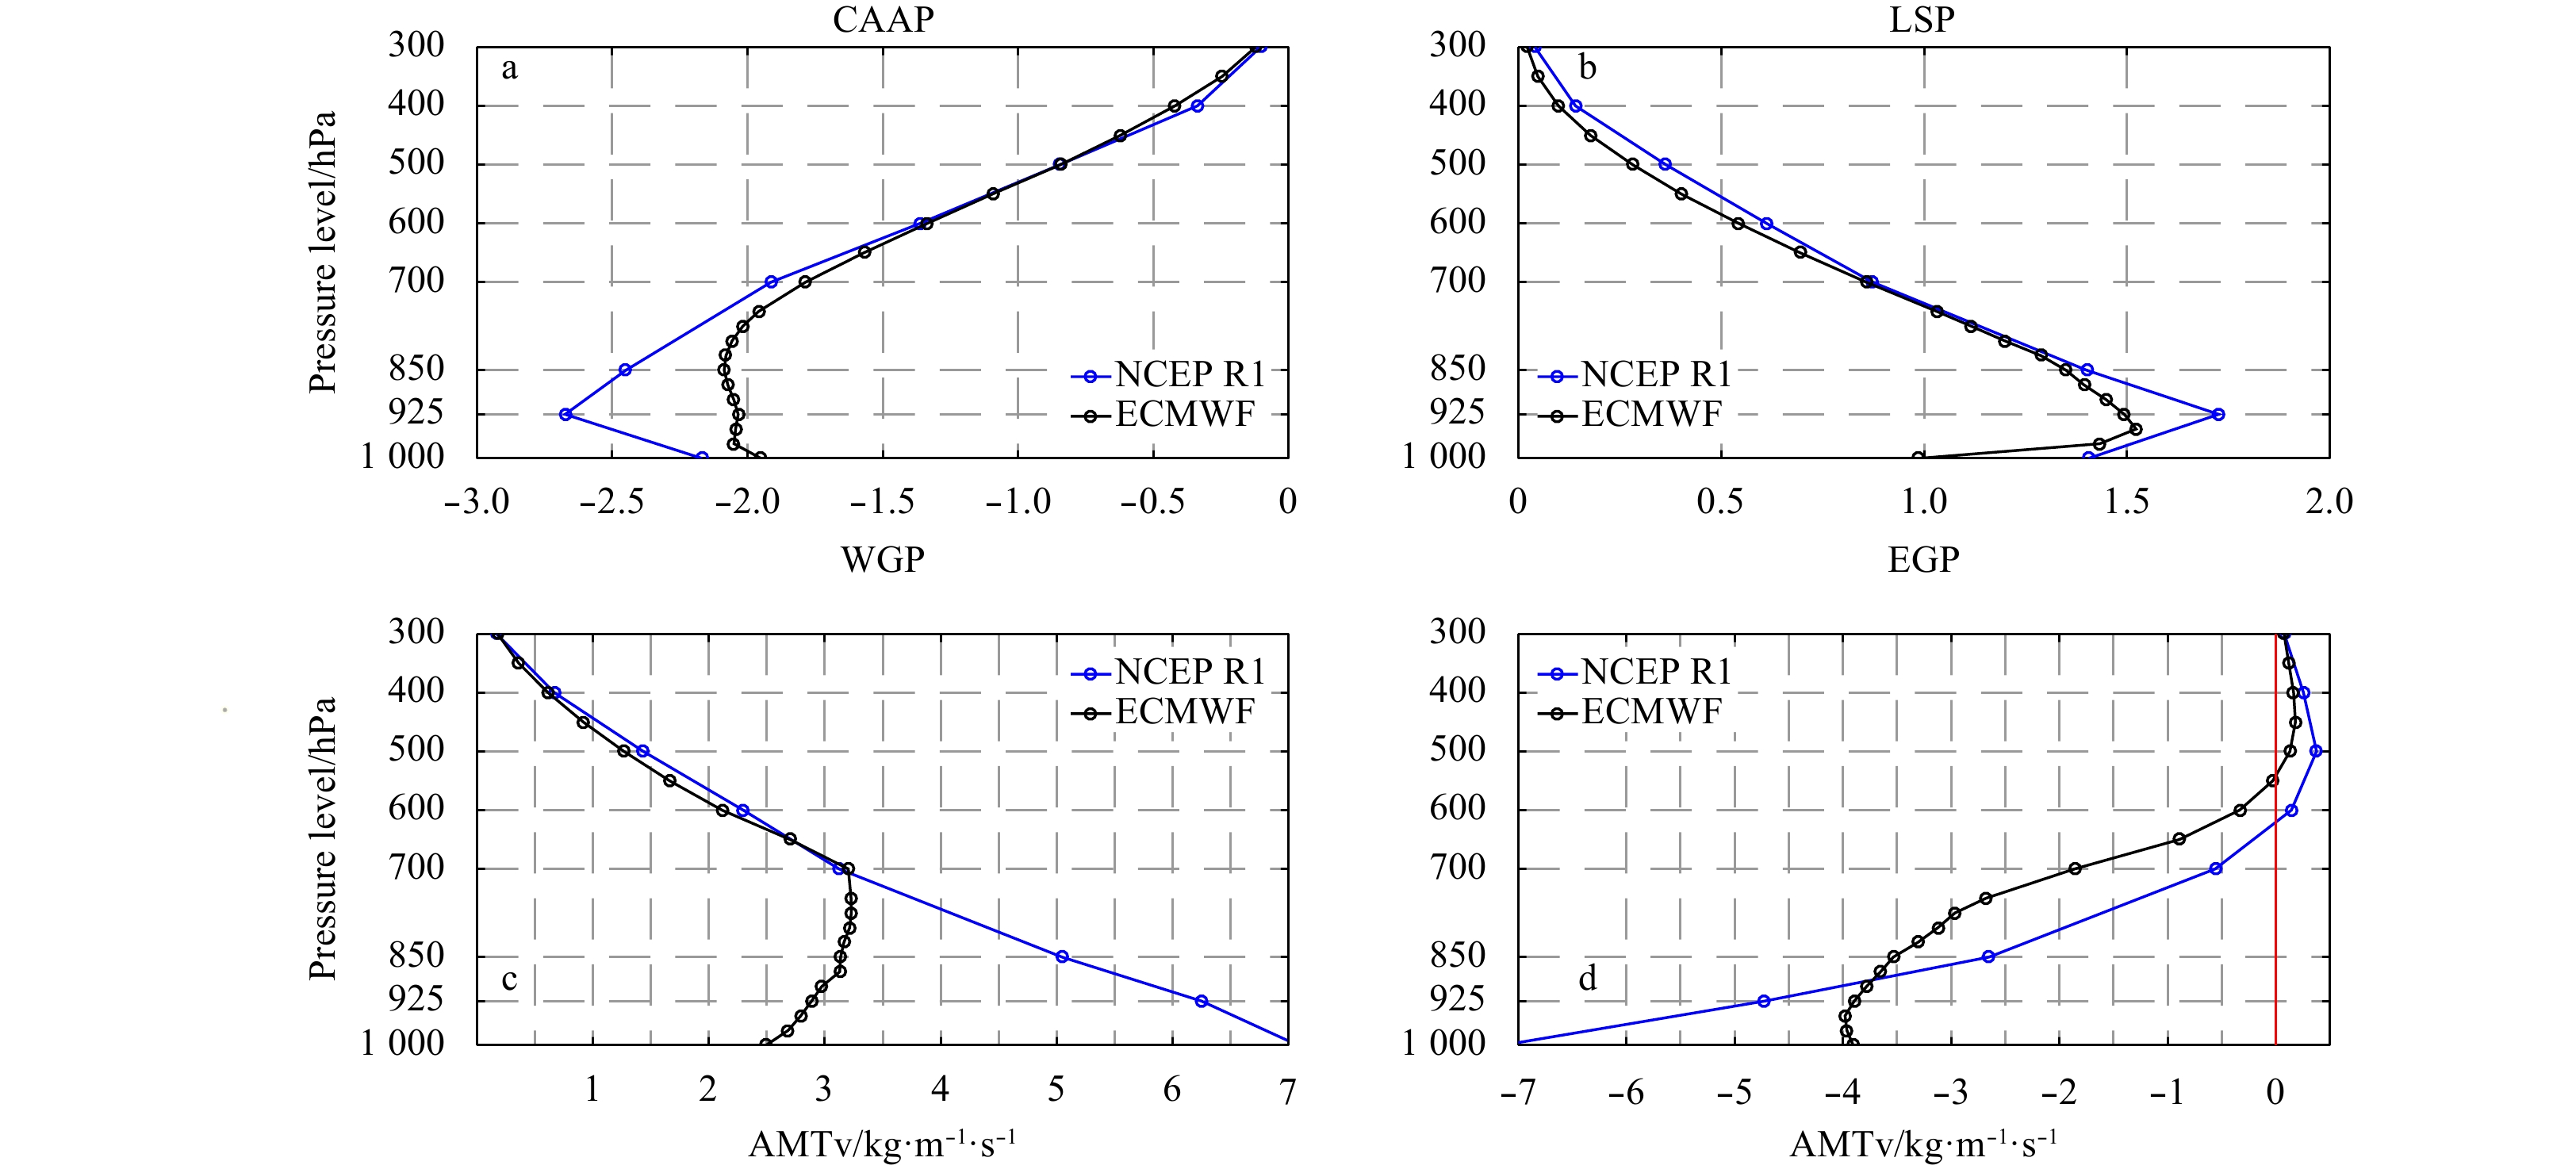
The vertical structure of AMTv variation exhibited almost consistent characteristics in the four pathways. Furthermore, moisture fluxes were significant in the lower troposphere and decreased with altitude, so that 80% of AMTv variance was fixed under altitude of 600-hPa pressure level (Fig. 2). The vertical pattern of AMTv was more comparable with specific humidity, but differed from meridional wind. In contrast, the gale wind was widespread at high levels. We also found the EGP pathway to be the only one whose moisture transport changed direction at ~600 hPa, due to the southward to northward wind, which may be influenced by the topography. The low-level north wind, induced by the Greenland Plateau, carries vapor out of the Arctic, making it appropriate to assume that this is a local moisture transport stream around Greenland. And the Moreover, the two datasets illustrate a similar pattern with respect to AMTv, specifically through PSA pathways with an average difference of less than 10%. In contrast, their differences are obvious in the Greenland pathways. For example, NCEP-NCAR R1 results can reach 2–3 times that of the ERA-Interim near surface level. Inconsistency, associated with large transports, may be induced by the model uncertainty from the wind fields estimation (Serreze et al., 2016), as well as model meshing techniques over regions with complex orography in Greenland (Dufour et al., 2016).
Figure
2.
AMTv vertical structure of the four perennial pathways by the NCEP-NCAR R1 (blue) and ERA-Interim (black) reanalyses. As shown in Fig. 1, Canadian Arctic Archipelago pathway (a, CAAP) and Laptev Sea pathway (b, LSP) mostly span ocean areas. West Greenland pathway (c, WGP) and east Greenland pathway (d, EGP) are over two sides of Greenland.
On the interannual timescale, AMTv significantly varied in 2- and 3-year periods, and showed large amplitudes, primarily in the PSA, based on the stochastic dynamic method. This method can distinguish different interior fluctuations of a time series (Epstein, 1969). The 14 significant interannual periods, are highlighted in the power spectrum. Combining the two methods, a two-peak structure was shown in the probability density function (Fig. 3), including biennial (21.4–25.0 months) and quasi-triennial (30.0–33.3 months) oscillations, which accounted for roughly 27% and 41% (43% and 24% in ERA-Interim) probability. This interannual variation was most obvious in the Laptev Sea, where amplitudes were ~4 kg/(m·s). Wavelet analysis of LSP transport revealed a significant period shift from biennial to triennial cycles at around 2000. This suggests that the meridional moisture exchange between the subarctic and central Arctic has been changed, and AMTv redistribution has been experienced in the Laptev sea.
Figure
3.
Probability density functions of the significant periods on interannual timescale (a) and the geographical distributions of AMTv amplitudes in two years (21.4–25.0 month) (b) and three years (30.0–33.3 months) (c) oscillations by NCEP-NCAR R1 dataset. Significant amplitudes above 95% confidence level are shaded.
AMTv revealed an enhancement trend in the Pacific-Arctic and Greenland, especially in the last decade. Almost all the PSA regions experienced a rapid AMTv increase, with average AMTv values of 3–5 kg/(m·s), which are higher than all previous decades. Matsumura also suggests that the intensified anticyclonic circulation over Pacific Sector has played a contributing role in accelerating the sea ice decline observed during the last two decades (Matsumura et al., 2014). It seems that the moisture from the Eurasian continent and tropical Pacific may more easily reach and influence the central Arctic processes (details will be discussed in Section 4). Furthermore, EOF analysis are performed on monthly AMTv whose domain is 70°N and above. Its first EOF mode revealed a seesaw pattern between the PSA and the Atlantic sector of the Arctic ocean. Additionally, the long-term trend of meridional transport in Greenland can reach 0.4 kg/(m·s) per decade, which infers a more energetic moisture exchange between the Atlantic sector and Greenland. This intensified AMTv would carry additional warm vapor to the Greenland ice sheet, and is considered to be the mechanism that drives the surface melt range from hemispheric-scale energy transport (Mioduszewski et al., 2016). Evidence of this mechanism can be seen in narrow band ice-melt along the margin zone (Forsberg et al., 2017). However, as the most important moisture output in central Arctic, there are no obvious trends for AMTv through CAAP.
AMTv trends in every month, indicate that there is discordance between these transports through the PSA into the Arctic, primarily occurring in the spring and summer, which are the PSA melting/freezing seasons (Fig. 4). For LSP and CSP, the positive trends mean the moisture transport has been intensified in the past 37 years, while the negative trend indicates strengthening of the output transports across CAAP pathway. Thus the average monthly trends of the three PSA pathways are calculate by (TrendLSP+ TrendCSP–TrendCAAP)/3, which are illustrated in Fig. 4 by gray bars. From Mar.–Sep., clear fluctuations of moisture transport were shown in all pathways, both poleward and equatorward. Through CSP, the moisture showed continuous positive trends in the melting/freezing months, and increases of over 4 kg/(m·s)·decade–1, with the only exception occurring in July, with a small negative trend. Another input AMTv over the LSP, has shown a significant increase from July to August, with a long-term trend of >10 kg/(m·s)·decade–1, as it experienced a shift from an output to an input pathway (details in Section 3.2). This shift may have been dynamically influenced by the different atmospheric circulation patterns. For summer (June through August) anomalies of sea level pressure point toward significant increases north of the Canadian Arctic Archipelago and Alaska, which were accompanied by significant negative trends over northern Eurasia from 2006 to 2015 (Serreze et al., 2016). This could have led to positive anomalies of anticyclonic circulation in the Canada Basin north of Alaska and the Canadian Arctic Archipelago, while making moisture more prone to enter into the central Arctic (Matsumura et al., 2014; Crawford et al., 2018). Furthermore, the wetter atmospheric background of the Arctic was another notable factor. The increasing water vapor was most prominent over the western Arctic in summer, when moisture in the Eurasian continental also increased (Rinke et al., 2009). In winter, the Arctic experiences drought, and air circulation is relatively steady, while long-term variations in the pathways are smooth. As a response to the atmospheric circulation shift, CAAP was the only equatorward pathway in the PSA. Its transport out of polar region infers a weakening trend in July to August, which got significantly stronger in September, and influenced sea ice conditions in autumn. As the result of these three PSA transports, the positive summer trend tends to cause more atmospheric moisture in the Arctic.
Figure
4.
Long-term AMTv trend in every month through three PSA pathways from 1979–2015. The trends of AMTv are calculated by the least-squares linear method using NCEP-NCAR R1 datasets. Three ocean-pathways are signed in marked colors that red for LSP, blue for CSP, yellow for CAAP and the gray bar represents the average trend of PSA moisture transport.
3.2
Relationships between Mar.–Sep. AMTv and sea ice
Arctic sea ice area (SIA) has been rapidly declining in recent years, in both perennial ice and multiyear ice (Comiso, 2012). This decline may be a consequence of complicated physical processes, such as the increase of downward longwave radiation, intensified evaporation, and anomalous moisture transport (Cui et al., 2015; Lee et al., 2017). The loss of sea ice causes a series of complex physical processes in weather and climate variability (Francis and Vavrus, 2012). For example, poleward Rossby waves lead to enhanced Arctic warming, which results in further loss of sea ice (Lee et al., 2011). Based on the complex physical processes involved in sea ice and atmospheric activity, we now turn to the relationship between meridional moisture transport and SIA changes within different ages of ice in the PSA. Sea ice age data were used to calculate the September SIA of the old ice. Here, we calculated the 5+ year ice (named as the “old” ice), which indicates sea ice that has survived at least five summers, and young ice (1–2 year ice, which indicates first and second-year ice) (Zwally and Gloersen, 2008; Comiso, 2012; Stroeve et al., 2012).
Old ice has shown rapid melt in the past several decades, accompanied by the enlargement of young ice areas, especially in the PSA, as well as an enhanced AMTv and increasing sea level pressure in the Beaufort Sea (Fig. 5). By dividing 1984–2014 into three decades, we discovered that old ice could be found throughout most of the central Arctic in the first decade, with 5+ year ice covering nearly 40% of all ice areas. However, in the following two decades, this old ice has retreated in the east Siberia and Laptev Seas. In the second period (1994–2003), most regions of the Canada Basin and Beaufort Sea were still mainly covered by old ice, with ice areas slightly decreased in the Chukchi Sea. With drifting sea ice and changing ice conditions taken into consideration, the most recent decade (2004–2015) saw the shrinking of all old ice near the Canadian Arctic Archipelago shelf and Mendeleev Ridge (Fig. 5c). Old ice was also hard to find in the central Arctic Ocean. This notable retreat of old ice was accompanied by the increment of young ice areas in the central Arctic, while in the Laptev Sea, an ice-free ocean has become the standard condition in late summer. Simultaneously, the AMTv has significantly increased, and the intensity of poleward moisture AMTv through the PSA pathways has nearly doubled. This may be related to the positive anomaly of sea level pressure over the Beaufort Sea, which would lead the moisture through the CSP pathway and more easily into the central Arctic.
Figure
5.
Spatial distribution of September ice age and average AMTv for the three decades during 1984–2014 (three episodes: 1984–1993, 1994–2003 and 2004–2014). We calculate September ice age (a–c) by NSIDC datasets (35th to 39th week). The “old” ice means sea ice has survived at least four melt-freeze cycles or five summers. Young ice (1–2 year ice) is the sum of one- and two-year ice. AMTv distribution (d–f) are same as Fig. 1 but for the three decades, and these pathways are highlighted.
Average moisture transport across the PSA pathways has significantly increased in recent years—primarily the result of intensifying input (poleward) moisture transport (Fig. 6). During the third episode (2004–2014), increasing input moisture changed the net AMTv exchange through PSA pathways, which converted output into input transport. Through the input LSP and CSP pathways, average AMTv were 2.3 times and 1.4 times their previous values, respectively. In addition to these rapid changes in the condition of sea ice, the intensification of the Beaufort Sea High (BSH) in summer (Moore, 2012), may also have been an important cause of increased vapor from the north Pacific into the central Arctic. Under the control of BSH, the output AMTv through CAAP, seemed to vary synchronously with the input AMTv through CSP during the melting/freezing seasons (correlation coefficient = –0.61). Thus, the enhanced equatorward moisture transport was always accompanied by positive poleward AMTv from the north Pacific. And the AMTv through the LSP showed an interannual variation of quasi-triennial oscillations, while contributing to the accumulation of more vapor in the central PSA. Through the out pathways along the Atlantic-Arctic sectors, the output AMTv oscillated around the zero line and generated a slightly equatorward trend in the past 37 years.
Figure
6.
Averaged AMTv intensity in melting months (March-September) through the three PSA pathways (a. AMTv throught the CSP, b. AMTv throught the LSP and c. AMTv throught the CAAP) and their sum AMTv transport (d) by the NCEP-NCAR R1 (blue) and ERA-Interim (black) reanalysis datasets. The sum transports are conducted by considering the pathway length and Averaged intensity of AMTv. The long-term linear trend (red dashed line, unit: kg/(m·s) per decade) is calculated by least square method with NCEP-NCAR R1 datasets.
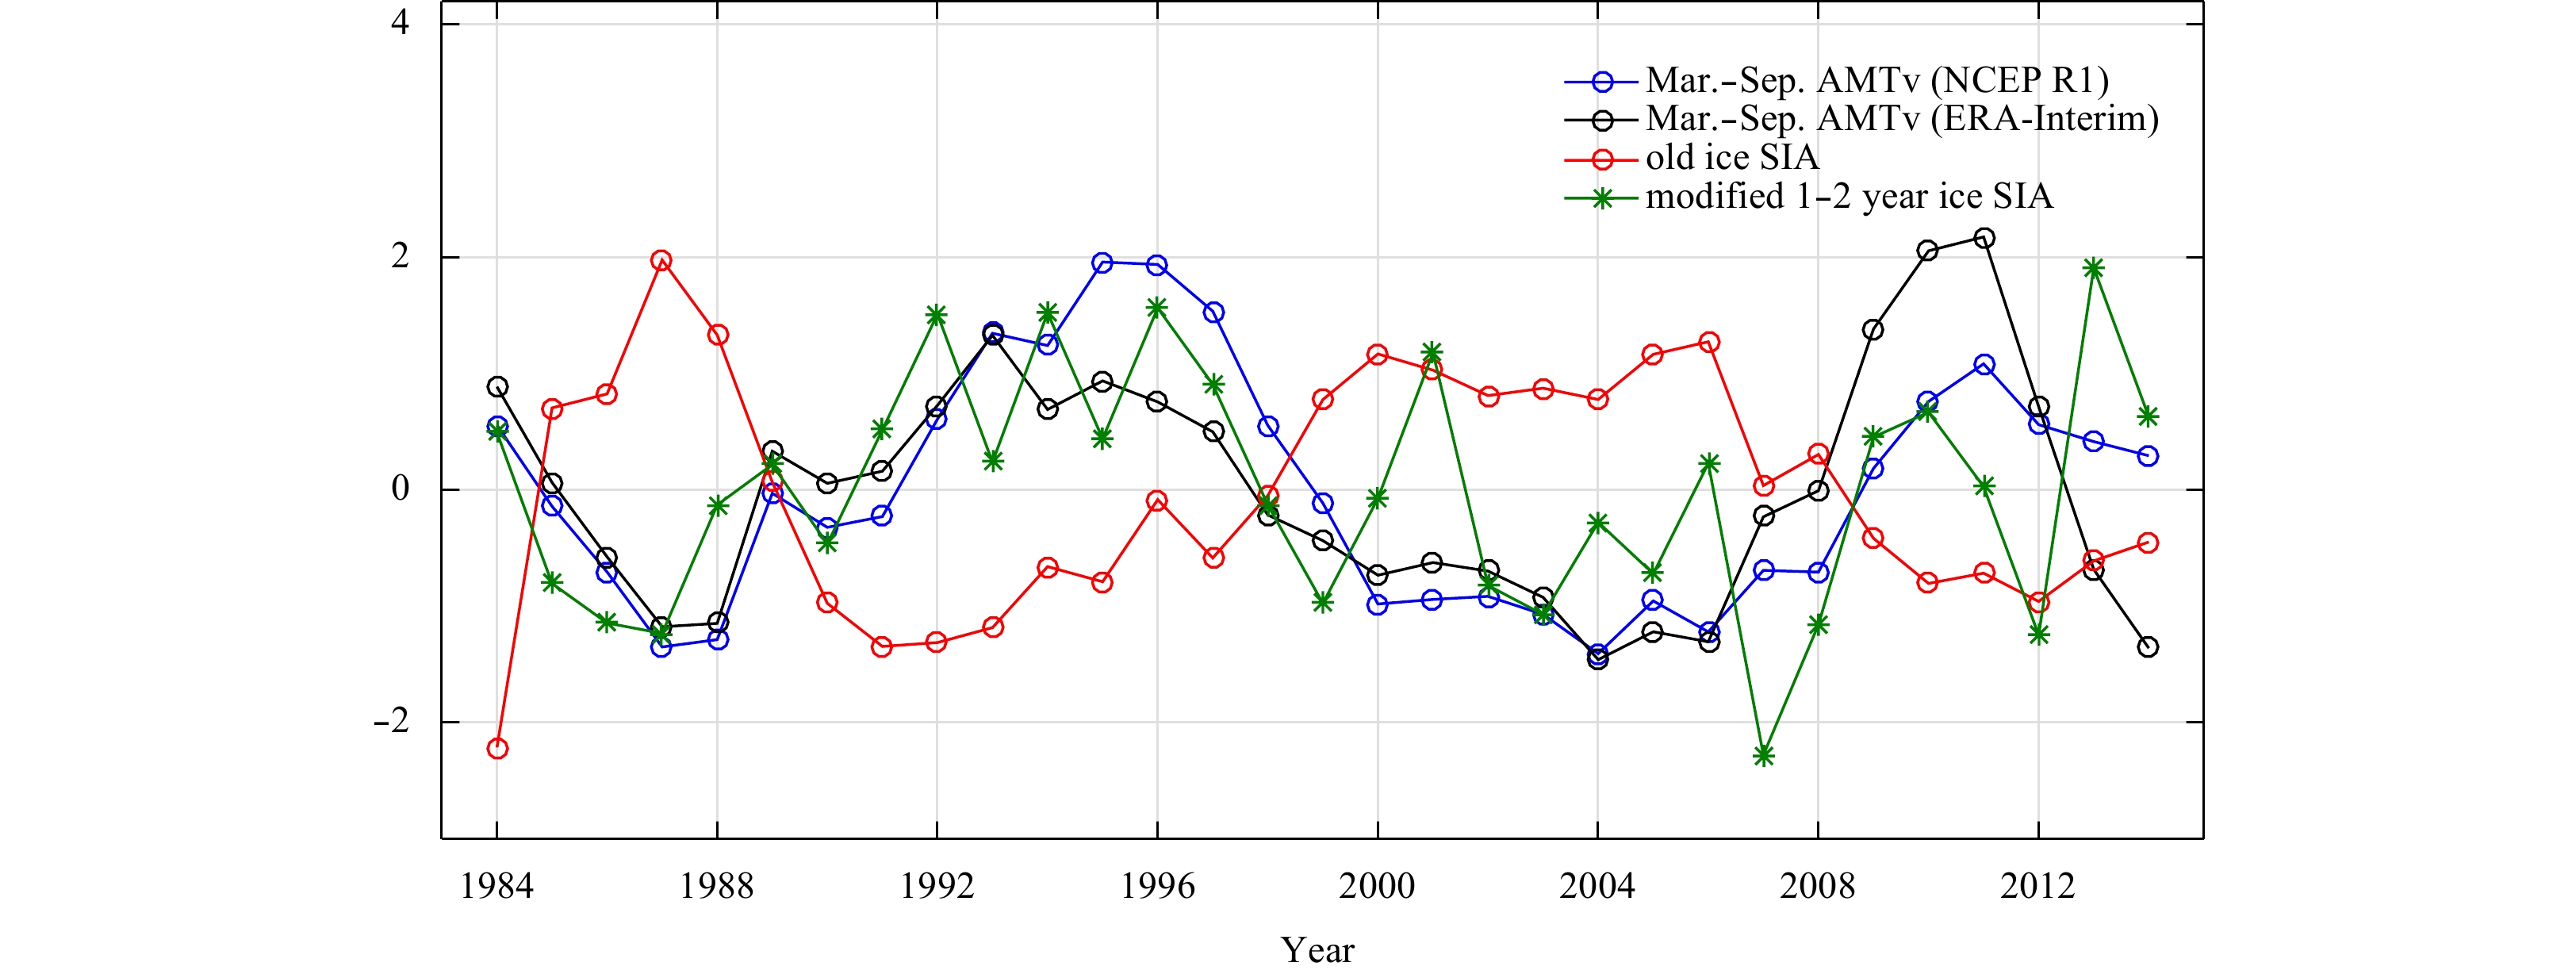
The increasing moisture transport, through PSA pathways, closely correlated with the decline of Arctic sea ice area. Here, the calculated SIA is defined in the regions from 120°E to 85°W, and north of 70°N. With respect to meridional moisture transport, we calculated average AMTv through three PSA moisture pathways during the melting/freezing season in Mar.–Sep. For their linear trend in the three episodes, old ice rapidly declined throughout the 1980s and the last decade, while contrary changes to the meridional moisture transport occurred. In contrast, the 1990s were a relatively stable stage. During 1984–2014, September old ice experienced a rapid decline, with the long-term trend reaching –6.0×10⁵ km2/decade and a decrease in area by roughly 90%. The net AMTv intensity, through the PSA pathways, simultaneously turned from equatorward (at –23.2 kg/(m·s)) to poleward (at 23.7 kg/(m·s)), and the increment presented the integral 960 km3 equivalent liquid water per decade (We from the Eq. (2)). It can clearly be seen that whether sea ice is young or old, sea ice area changed dramatically in the first and third decades, which were linked to corresponding variations of AMTv. A similar circumstance occurs in the second episode, with mild oscillations of ice area and AMTv. Taking the accumulating effect of the water vapor on sea ice change into consideration, we applied an algorithm to calculate AMTv through the PSA pathways, by the 5-year running mean combined with linear trend removed, in accordance with old and young ice SIA. Detrended AMTv through the PSA exhibited a close relationship with old ice areas, whose correlation coefficient was –0.78 (Fig. 7).
Figure
7.
Normalized time series of the detrended AMTv through PSA pathways in the melting months (Mar.–Sep.) and detrended September sea ice area (SIA) during 1984–2014. The 5-year running mean of Mar.–Sep. AMTv are derived from NCEP-NCAR R1 (blue) and ERA-Interim (black) respectively. Old ice SIA (red) is calculated for 5+ year sea ice with the NSIDC ice age data. Young ice area (green) is modified by the two SIA from ice age and ice concentration data. In detail, sea ice concentration is used to calculate the area anomaly, and sea ice age is used to calculate origin SIA. Then, young (1–2 year) ice area is derived by subtracting area anomaly from origin SIA.
AMTv in the central Arctic exhibited a non-uniform pattern. Furthermore, AMTv statistical characteristics and vertical structure, during 1979–2015, were investigated by the NCEP-NCAR R1 and ERA-Interim reanalysis datasets. AMTv into the central Arctic was found to primarily pass through four stable and perennial pathways and one seasonal pathway, which can explain 60%–80% of the moisture exchange averaged over a 75°N circle. The four pathways are located in the Laptev Sea, the Canadian Arctic Archipelago, and along both sides of Greenland, while the seasonal pathway is located east of the Chukchi Sea, and only appears during the melting/freezing season—similar features were found in the two reanalyses. Although there are complex spatial and temporal variations in Arctic AMTv, with respect to their dominating transport direction, the statistical occurrence frequency of AMTv through pathways can reach values above 70%, which infers that moisture in the Arctic could have been continuously exchanged with mid-latitudes during the past 37 years. Moisture transports into the Pacific Sector of the Arctic Ocean (PSA), along an apparent route that is enclosed by the Laptev Sea Pathway (LSP), the Canadian Arctic Archipelago Pathway (CAAP) and the seasonal Chukchi Sea Pathway (CSP), and moisture from the north Eurasian source could easily enter into the central Arctic. With respect to the vertical structure, AMTv through pathways focused on the low troposphere (80% of the magnitude occurs below 600 hPa) and decreased with altitude. The AMTv difference between the two datasets mainly occurs on the complex underlying topography, such as the Greenland plateau.
Linear trends in every month of moisture transport elucidated the summer moisture gain, which resulted from the intensifying poleward transport into PSA in melting/freezing months (Mar.–Sep.), while the output moisture showed a negative trend. The AMTv intensification through CSP in March–September, corresponded with a significant increase in transport over the Laptev Sea in July and August, which can result in more vapor from the Eurasian mainland reaching into high-latitude areas in summer. Sea level pressure fields showed a tendency toward a stronger Beaufort Sea High in the third episode (2004–2014; Fig.5f), and contributed to enhanced moisture import across the LSP, as well as seasonal CSP pathways in recent decades. Partial correlation indicated AMTv to be more connected with meridional wind, than vapor conditions. Furthermore, AMTv into the central Arctic fluctuates and is forced by atmospheric patterns and moisture source shifts. In winter, when high pressure moves eastward to the Chukchi Sea, the AMTv through LSP and CAAP, is more tightly connected. Superimposed on the long-term trend, 2- and quasi-3-year oscillations were found in the AMTv interannual variations in PSA. The large interannual amplitudes appeared mainly in the input passages, such as the Laptev Sea, but the output passages did not show the resultant variabilities. The opposite phenomena emerged in the regional Greenland pathways (EGP and WGP). As a consequence of AMTv spatial discrepancy, Arctic moisture redistribution on interannual timescales seems to be affected by the poleward transport in PSA, and the equatorward transport in the Atlantic sector.
The net AMTv during melting/freezing seasons has experienced an alternation from output (equatorward) to input (poleward) transport in PSA, and led to a bulk of equivalent liquid water, totaling nearly 960 km3, into the central Arctic during each decade. The 5-year running mean of AMTv showed a strong connection with the retreat of old ice SIA (correlation coefficient of detrend time series can reach –0.78). Thus, both infer the accumulative and synchronous fluctuations of multiyear sea ice and atmospheric vapor. The loss of old ice and the increase in moisture occurred primarily during two periods: the 1980s and within the last decade, with only slight variations in the 1990s. Possible causes of the phenomena can be deduced from the following aspects of air and sea ice interaction: (1) the atmospheric thermodynamics and dynamics response to increased vapor from the north Pacific Ocean and Eurasian continent into the Arctic; (2) moisture and the corresponding cloud water content change the specific humidity condition and downward radiation (Lee et al., 2017), thereby influencing the melting and freezing of sea ice; (3) Arctic sea ice retreat enhances surface evaporation, and amplifies the Arctic hydrological cycle (Bintanja and Selten, 2014), which are represented as the former AMTv increase.
In this study, we investigated monthly mean flow and attempted to detect the stable characteristics of meridional moisture transport, by omitting transient variations. This was done because the mean flow is one magnitude larger than transient eddies in most intense cyclone tracks (Dufour, 2016). Ultimately, a good agreement between old ice and AMTv was found. Furthermore, as Park et al. (2015) report, moisture transport on a synoptic scale could better explain recent sea ice decline in the Atlantic sector. However, the synoptic contribution modulated by long-term changes, needs to be further investigated.
Acknowledgements
We express our thanks to NOAA/ESRL Physical Sciences for providing access to the NCEP reanalysis and to ECMWF for the ERA-Interim reanalysis (Dee et al., 2011). Sea ice age data are available from the NSIDC (http://nsidc.org).
Bintanja R, Selten F M. 2014. Future increases in Arctic precipitation linked to local evaporation and sea-ice retreat. Nature, 509(7501): 479–482. doi: 10.1038/nature13259
[2]
Comiso J C. 2012. Large decadal decline of the Arctic multiyear ice cover. Journal of Climate, 25(4): 1176–1193. doi: 10.1175/JCLI-D-11-00113.1
[3]
Crawford A D, Horvath S, Stroeve J, et al. 2018. Modulation of sea ice melt onset and retreat in the Laptev Sea by the timing of snow retreat in the West Siberian Plain. Journal of Geophysical Research: Atmospheres, 123(16): 8691–8707. doi: 10.1029/2018JD028697
[4]
Cui Hongyan, Qiao Fangli, Shu Qi, et al. 2015. Causes for different spatial distributions of minimum Arctic sea-ice extent in 2007 and 2012. Acta Oceanologica Sinica, 34(9): 94–101. doi: 10.1007/s13131-015-0676-x
[5]
Dee D P, Uppala S M, Simmons A J, et al. 2011. The ERA‐interim reanalysis: configuration and performance of the data assimilation system. Quarterly Journal of the Royal Meteorological Society, 137(656): 553–597. doi: 10.1002/qj.828
[6]
Dufour A, Zolina O, Gulev S K. 2016. Atmospheric moisture transport to the Arctic: assessment of reanalyses and analysis of transport components. Journal of Climate, 29(14): 5061–5081. doi: 10.1175/JCLI-D-15-0559.1
Forsberg R, Sørensen L, Simonsen S. 2017. Greenland and Antarctica ice sheet mass changes and effects on global sea level. Surveys in Geophysics, 38: 89–104. doi: 10.1007/s10712-016-9398-7
[9]
Francis J A, Vavrus S J. 2012. Evidence linking Arctic amplification to extreme weather in mid-latitudes. Geophysical Research Letters, 39(6): L06801
[10]
Gimeno L, Vázquez M, Nieto R, et al. 2015. Atmospheric moisture transport: the bridge between ocean evaporation and Arctic ice melting. Earth System Dynamics, 6(2): 583–589. doi: 10.5194/esd-6-583-2015
[11]
Gimeno-Sotelo L, Nieto R, Vázquez M, et al. 2018. A new pattern of the moisture transport for precipitation related to the drastic decline in Arctic sea ice extent. Earth System Dynamics, 9(2): 611–625. doi: 10.5194/esd-9-611-2018
[12]
Hartmann D L, Tank A M G K, Rusticucci M, et al. 2013. Observations: atmosphere and surface. In: Stocker T F, Qin D, Plattner G K, et al., eds. Climate Change 2013: The Physical Science Basis. Contribution of Working Group I to the Fifth Assessment Report of the Intergovernmental Panel on Climate Change. Cambridge: Cambridge University Press, 159–254
[13]
Higgins M E, Cassano J J. 2009. Impacts of reduced sea ice on winter Arctic atmospheric circulation, precipitation, and temperature. Journal of Geophysical Research: Atmospheres, 114(D16): D16107. doi: 10.1029/2009JD011884
[14]
Kapsch M L, Graversen R G, Tjernström M. 2013. Springtime atmospheric energy transport and the control of Arctic summer sea-ice extent. Nature Climate Change, 3(8): 744–748. doi: 10.1038/nclimate1884
[15]
Kopec B G, Feng Xiahong, Michel F A, et al. 2016. Influence of sea ice on Arctic precipitation. Proceedings of the National Academy of Sciences of the United States of America, 113(1): 46–51. doi: 10.1073/pnas.1504633113
[16]
Lee S, Feldstein S, Pollard D, et al. 2011. Do planetary wave dynamics contribute to equable climates?. Journal of Climate, 24(9): 2391–2404. doi: 10.1175/2011JCLI3825.1
[17]
Lee H J, Kwon M O, Yeh S W, et al. 2017. Impact of poleward moisture transport from the north pacific on the acceleration of sea ice loss in the Arctic since 2002. Journal of Climate, 30(17): 6757–6769. doi: 10.1175/JCLI-D-16-0461.1
[18]
Liu Jiping, Curry J A, Wang Huijun, et al. 2012. Impact of declining Arctic sea ice on winter snowfall. Proceedings of the National Academy of Sciences of the United States of America, 109(11): 4074–4079. doi: 10.1073/pnas.1114910109
[19]
Maslanik J A, Fowler C, Stroeve J, et al. 2007. A younger, thinner Arctic ice cover: increased potential for rapid, extensive sea-ice loss. Geophysical Research Letters, 34(24): L24501. doi: 10.1029/2007GL032043
[20]
Matsumura S, Zhang Xiangdong, Yamazaki K. 2014. Summer Arctic atmospheric circulation response to spring Eurasian snow cover and its possible linkage to accelerated Sea Ice decrease. Journal of Climate, 27(17): 6551–6558. doi: 10.1175/JCLI-D-13-00549.1
[21]
Mioduszewski J R, Rennermalm A K, Hammann A, et al. 2016. Atmospheric drivers of Greenland surface melt revealed by self-organizing maps. Journal of Geophysical Research: Atmospheres, 121(10): 5095–5114. doi: 10.1002/2015JD024550
[22]
Moore G W K. 2012. Decadal variability and a recent amplification of the summer Beaufort Sea High. Geophysical Research Letters, 39(10): L10807
[23]
Mortin J, Svensson G, Graversen R G, et al. 2016. Melt onset over Arctic sea ice controlled by atmospheric moisture transport. Geophysical Research Letters, 43(12): 6636–6642. doi: 10.1002/2016GL069330
[24]
Overland J E, Francis J A, Hanna E, et al. 2012. The recent shift in early summer Arctic atmospheric circulation. Geophysical Research Letters, 39(19): L19804
[25]
Park D S R, Lee S, Feldstein S B. 2015. Attribution of the recent winter sea ice decline over the Atlantic sector of the Arctic Ocean. Journal of Climate, 28(10): 4027–4033. doi: 10.1175/JCLI-D-15-0042.1
[26]
Peterson B J, Holmes R M, McClelland J W, et al. 2002. Increasing river discharge to the Arctic ocean. Science, 298(5601): 2171–2173. doi: 10.1126/science.1077445
[27]
Polyakov I V, Alekseev G V, Bekryaev R V, et al. 2002. Observationally based assessment of polar amplification of global warming. Geophysical Research Letters, 29(18): 25–1
[28]
Rinke A, Melsheimer C, Dethloff K, et al. 2009. Arctic total water vapor: comparison of regional climate simulations with observations, and simulated decadal trends. Journal of Hydrometeorology, 10(1): 113–129. doi: 10.1175/2008JHM970.1
[29]
Rosen R D, Salstein D A, Peixoto J P. 1979. Variability in the annual fields of large-scale atmospheric water vapor transport. Monthly Weather Review, 107(1): 26–37. doi: 10.1175/1520-0493(1979)107<0026:VITAFO>2.0.CO;2
[30]
Serreze M C, Barrett A P, Stroeve J C, et al. 2009. The emergence of surface-based Arctic amplification. The Cryosphere, 3(1): 11–19. doi: 10.5194/tc-3-11-2009
Serreze M C, Stroeve J, Barrett A P, et al. 2016. Summer atmospheric circulation anomalies over the Arctic Ocean and their influences on September sea ice extent: a cautionary tale. Journal of Geophysical Research: Atmospheres, 121(19): 11463–11485. doi: 10.1002/2016JD025161
[33]
Stroeve J C, Serreze M C, Holland M M, et al. 2012. The Arctic’s rapidly shrinking sea ice cover: a research synthesis. Climatic Change, 110(3): 1005–1027
[34]
Vázquez M, Nieto R, Drumond A, et al. 2016. Moisture transport into the Arctic: source-receptor relationships and the roles of atmospheric circulation and evaporation. Journal of Geophysical Research: Atmospheres, 121(22): 13493–13509. doi: 10.1002/2016JD025400
[35]
Vázquez M, Nieto R, Drumond A, et al. 2017. Extreme sea ice loss over the Arctic: An Analysis Based on Anomalous Moisture Transport. Atmosphere, 8(2): 32
[36]
Zhang Xiangdong, He Juanxiong, Zhang Jing, et al. 2013. Enhanced poleward moisture transport and amplified northern high-latitude wetting trend. Nature Climate Change, 3(1): 47–51. doi: 10.1038/nclimate1631
[37]
Zuo Juncheng, Du Ling, Chen Meixiang, et al. 2018. Data Analysis Methods in Marine Hydrologic Elements (in Chinese). Beijing: Science Press, 31–36
[38]
Zwally H J, Gloersen P. 2008. Arctic sea ice surviving the summer melt: interannual variability and decreasing trend. Journal of Glaciology, 54(185): 279–296. doi: 10.3189/002214308784886108
Xiaowei Zou, Zhao Li, Diyi Yang, et al. Surface energy balance on a polythermal glacier, Arctic, and the role of poleward atmospheric moisture transport. Atmospheric Research, 2023. doi:10.1016/j.atmosres.2023.106910
2.
Mikhail M. Latonin, Leonid P. Bobylev, Igor L. Bashmachnikov, et al. Dipole pattern of meridional atmospheric internal energy transport across the Arctic gate. Scientific Reports, 2022, 12(1) doi:10.1038/s41598-022-06371-9
3.
Gina R. Henderson, Bradford S. Barrett, Lori J. Wachowicz, et al. Local and Remote Atmospheric Circulation Drivers of Arctic Change: A Review. Frontiers in Earth Science, 2021, 9 doi:10.3389/feart.2021.709896
4.
Hongjie Liang, Jie Su. Variability in Sea Ice Melt Onset in the Arctic Northeast Passage: Seesaw of the Laptev Sea and the East Siberian Sea. Journal of Geophysical Research: Oceans, 2021, 126(10) doi:10.1029/2020JC016985
Daohuan Xu, Ling Du, Jingkai Ma, Huangyuan Shi. Pathways of meridional atmospheric moisture transport in the central Arctic[J]. Acta Oceanologica Sinica, 2020, 39(5): 55-64. doi: 10.1007/s13131-020-1598-9
Daohuan Xu, Ling Du, Jingkai Ma, Huangyuan Shi. Pathways of meridional atmospheric moisture transport in the central Arctic[J]. Acta Oceanologica Sinica, 2020, 39(5): 55-64. doi: 10.1007/s13131-020-1598-9
Table
1.
The moisture transports of two datasets at 75°N circle during 1979–20151)
Pathways (location)
WGP
LSP
CAAP
EGP
70º–35ºW
120º–150ºE
125º–85ºW
30º–10ºW
Average contribution 2)
56.0% (48.7%)
12.6% (15.0%)
–57.6% (–47.4%)
–22.3% (–24.0%)
Average strength / kg·m–1·s–1
23.6 (16.4)
6.2 (5.9)
–12.2 (–8.8)
–10.0 (–10.9)
Statistical frequency
99% (99%)
75% (78%)
–91% (–86%)
–78% (–84%)
Transport capacity 3) / km3·mon–1
62.8 (44.2)
14.1 (13.5)
–37.0 (–33.4)
–15.2 (–16.9)
Note: 1) The positive values present poleward moisture transport, while negative value means equatorward transport. The values are shown as the results by NCEP-NCAR R1, and the results in parentheses from ERA–Interim datasets. 2) The average contribution is the transport capacity ratio of the AMTv pathways to the 75°N circle exchange (in the same direction).3) Transport capacity is calculated by AMTv zonal integral along a specified latitude.
Figure 1. Vertical integrated AMTv climatology for the polar cap during 1979–2015. Shading color represents AMTv based on NCEP-NCAR R1 datasets, and the positive value means poleward transport, while the negative value means equatorward transport. Areas surrounded by pink solid line are the regions where meridional moisture transport frequency is more than 70%. The solid lines mark the four perennial pathways and a seasonal pathway which only appears in Mar.−Sep., and all of them are at 75°N circle. Sea level pressure isobaths, titled as 1 013, 1 015 and 1 017 hPa, are signed (dash dot lines).
Figure 2. AMTv vertical structure of the four perennial pathways by the NCEP-NCAR R1 (blue) and ERA-Interim (black) reanalyses. As shown in Fig. 1, Canadian Arctic Archipelago pathway (a, CAAP) and Laptev Sea pathway (b, LSP) mostly span ocean areas. West Greenland pathway (c, WGP) and east Greenland pathway (d, EGP) are over two sides of Greenland.
Figure 3. Probability density functions of the significant periods on interannual timescale (a) and the geographical distributions of AMTv amplitudes in two years (21.4–25.0 month) (b) and three years (30.0–33.3 months) (c) oscillations by NCEP-NCAR R1 dataset. Significant amplitudes above 95% confidence level are shaded.
Figure 4. Long-term AMTv trend in every month through three PSA pathways from 1979–2015. The trends of AMTv are calculated by the least-squares linear method using NCEP-NCAR R1 datasets. Three ocean-pathways are signed in marked colors that red for LSP, blue for CSP, yellow for CAAP and the gray bar represents the average trend of PSA moisture transport.
Figure 5. Spatial distribution of September ice age and average AMTv for the three decades during 1984–2014 (three episodes: 1984–1993, 1994–2003 and 2004–2014). We calculate September ice age (a–c) by NSIDC datasets (35th to 39th week). The “old” ice means sea ice has survived at least four melt-freeze cycles or five summers. Young ice (1–2 year ice) is the sum of one- and two-year ice. AMTv distribution (d–f) are same as Fig. 1 but for the three decades, and these pathways are highlighted.
Figure 6. Averaged AMTv intensity in melting months (March-September) through the three PSA pathways (a. AMTv throught the CSP, b. AMTv throught the LSP and c. AMTv throught the CAAP) and their sum AMTv transport (d) by the NCEP-NCAR R1 (blue) and ERA-Interim (black) reanalysis datasets. The sum transports are conducted by considering the pathway length and Averaged intensity of AMTv. The long-term linear trend (red dashed line, unit: kg/(m·s) per decade) is calculated by least square method with NCEP-NCAR R1 datasets.
Figure 7. Normalized time series of the detrended AMTv through PSA pathways in the melting months (Mar.–Sep.) and detrended September sea ice area (SIA) during 1984–2014. The 5-year running mean of Mar.–Sep. AMTv are derived from NCEP-NCAR R1 (blue) and ERA-Interim (black) respectively. Old ice SIA (red) is calculated for 5+ year sea ice with the NSIDC ice age data. Young ice area (green) is modified by the two SIA from ice age and ice concentration data. In detail, sea ice concentration is used to calculate the area anomaly, and sea ice age is used to calculate origin SIA. Then, young (1–2 year) ice area is derived by subtracting area anomaly from origin SIA.


 DownLoad:
 DownLoad:


 DownLoad: