National Ocean Technology Center, Tianjin 300112, China
2.
National Satellite Ocean Application Service, Beijing 100081, China
3.
Tianjin Guohai Marine Engineering Survey Co. Ltd, Tianjin 300350, China
Funds:
The National Key R&D Program of China under contract No. 2018YFB0504900; the National Natural Science Foundation of China under contract Nos 41406204 and 41501417; Operational Support Service System For Natural Resources Satellite Remote Sensing.
Wanshan area has been chosen to be the specified field to calibrate and validate (Cal/Val) the HY-2 altimeter and its follow-on satellites. In March 2018, an experiment has been conducted to determine the sea surface height (SSH) under the HY-2A ground track (Pass No. 203). A GPS towing-body (GPS-TB) was designed to measure the SSH covering an area of about 6 km×28 km wide centered on the HY-2A altimeter satellite ground track. Three GPS reference stations, one tide gauge and a GPS buoy were placed in the research area, in order to process and resolve the kinematic solution and check the precision of the GPS-TB respectively. All the GPS data were calculated by the GAMIT/GLOBK software and TRACK module. The sea surface was determined by the GPS-TB solution and the tide gauge placed on Zhiwan Island. Then the sea surface of this area was interpolated by ArcGIS 10.2 with ordinary Kriging method. The results showed that the precision of the GPS-TB is about 1.10 cm compared with the tide gauge placed nearby, which has an equivalent precision with the GPS buoy. The interpolated sea surface has a bias of –1.5–4.0 cm with standard deviation of 0.2–2.4 cm compared with the checking line. The gradient of the measured sea surface is about 1.62 cm/km along the HY-2 orbit which shows a good agreement compared with the CLS11 mean sea surface (MSS). In the Cal/Val of satellites, the sea surface between the tide gauge/GPS buoy and the footprint of altimeter can be improved by this work.
There are primarily two approaches for monitoring and measuring sea surface height, mareographs and altimetry satellites (Bouin et al., 2009). Altimetry satellites provide near global coverage but only at ~10 to 100 km spatial resolution and have coarse temporal resolution. The precision of the satellite altimetry is contaminated by land or large islands and the radiometer measurements are also sensitive to land (Bonnefond et al., 2013). The GPS have been widely used in the measurement of sea surface height (SSH) and has a high accuracy (Foster et al., 2009; Watson et al., 2011; Maqueda et al., 2016). A GPS buoy was firstly designed for the calibration of TOPEX/Poseidon altimeter (Ménard et al., 1994). Then, the dedicated GPS buoy has been used in many in-situ satellite altimeter calibration and validation (Cal/Val) sites and campaigns (Watson et al., 2003; Bonnefond et al., 2003; Chen et al., 2014; Xu et al., 2016; Yang et al., 2017). The determination of accurate SSH need a support of a GPS reference station placed on land to provide a datum for the kinematic GPS solutions. The accuracy of the kinematic GPS buoy in a dedicated reference frame can reach to 1–4 cm, when the distance was less than 30 km from the GPS reference station (Zhai et al., 2016). The GPS buoy was also used to calibrate bottom tide gauges (Watson et al., 2008), and map the local mean sea surface (MSS) (Foster et al., 2009).
The sea surface was also measured using a geodetic GPS antenna equipped on catamaran (Bonnefond et al., 2003), Wave-Glider or ships (Liibusk and Jürgenson, 2009; Foster et al., 2009). The measurements help to improve the mean surface height or marine geoid. The GPS-catamanran has determined the geoid slope of Corsica to extrapolate the offshore altimetric footprints to on-shore tide-gauge locations, and yield a significant improvement in the agreement of altimeter bias (Bonnefond et al., 2003). The ship-based GPS observed the relative change of the geoid and then serve as a comparison to the gravimetric geoid solution (Bouin et al., 2009). A GPS wave glider was used to measure in-situ SSH with precision of about 0.05 m using both precise point positioning (PPP) and relative GPS techniques in Loch Ness, Scotland and the North Sea. The Glider measured sea surface has an ellipsoidal surface height gradient of –3 cm/km, which illustrated the fitness of the technology for marine geoid and mean dynamic topography (MDT) determinations (Maqueda et al., 2016; Penna et al., 2018). The accuracy of the GPS solution was also influenced by the attitude of the ship, the sea condition, the speed of the catamaran/ship and other elements.
HY-2 is the first satellite mission for dynamic environmental parameter measurement of China that has launched successfully on August 16, 2011 (Jiang et al., 2012), which is used to maintain continuous ocean observations for global measurements of sea surface wind fields, sea surface heights, significant wave heights (SWH) and sea surface temperatures. The Wanshan field has been chosen as the first in-situ Cal/Val area in China (Jiang et al., 2016). In the Cal/Val of SSH, the in-situ measurement equipment (such as GPS buoy, tide gauge) cannot be placed right at the footprint of the satellite. There exists a geodetic difference, which should be determined precisely (Bonnefond et al., 2003; Yang et al., 2017). From March 14–28, 2018, a campaign was conducted to measure the sea surface of this area using a GPS Towing-Body (GPS-TB) to provide a geodetic connection between the in-situ measurements and altimeter measurement points. It should be noted that the SSH means a kinematic solution of the GPS data achieved from the GPS-TB and GPS buoy. The sea surface represents a surface determined by the kinematic solution and the tide gauge, while the MSS stands for a sea surface of multi-year average. The main purpose is to determine the sea surface of the dedicated area and improve the accuracy of Cal/Val of altimeters.
2.
Description of the campaign and equipment
The altimeter calibration site of Wanshan field located at the footprint of HY-2A (Pass No. 203, Fig. 1). Tracked by the Runjiang 1 ship at a speed of about 3 m/s, the GPS-TB permitted us to cover an area of about 28 km long and 6 km wide centered on the HY-2 satellites ground track. The distance between every measuring line is about 400 m, in order to be in harmony with the measurements of depth, submarine topography, sediment investigation et al., which is not mentioned in this research.
Figure
1.
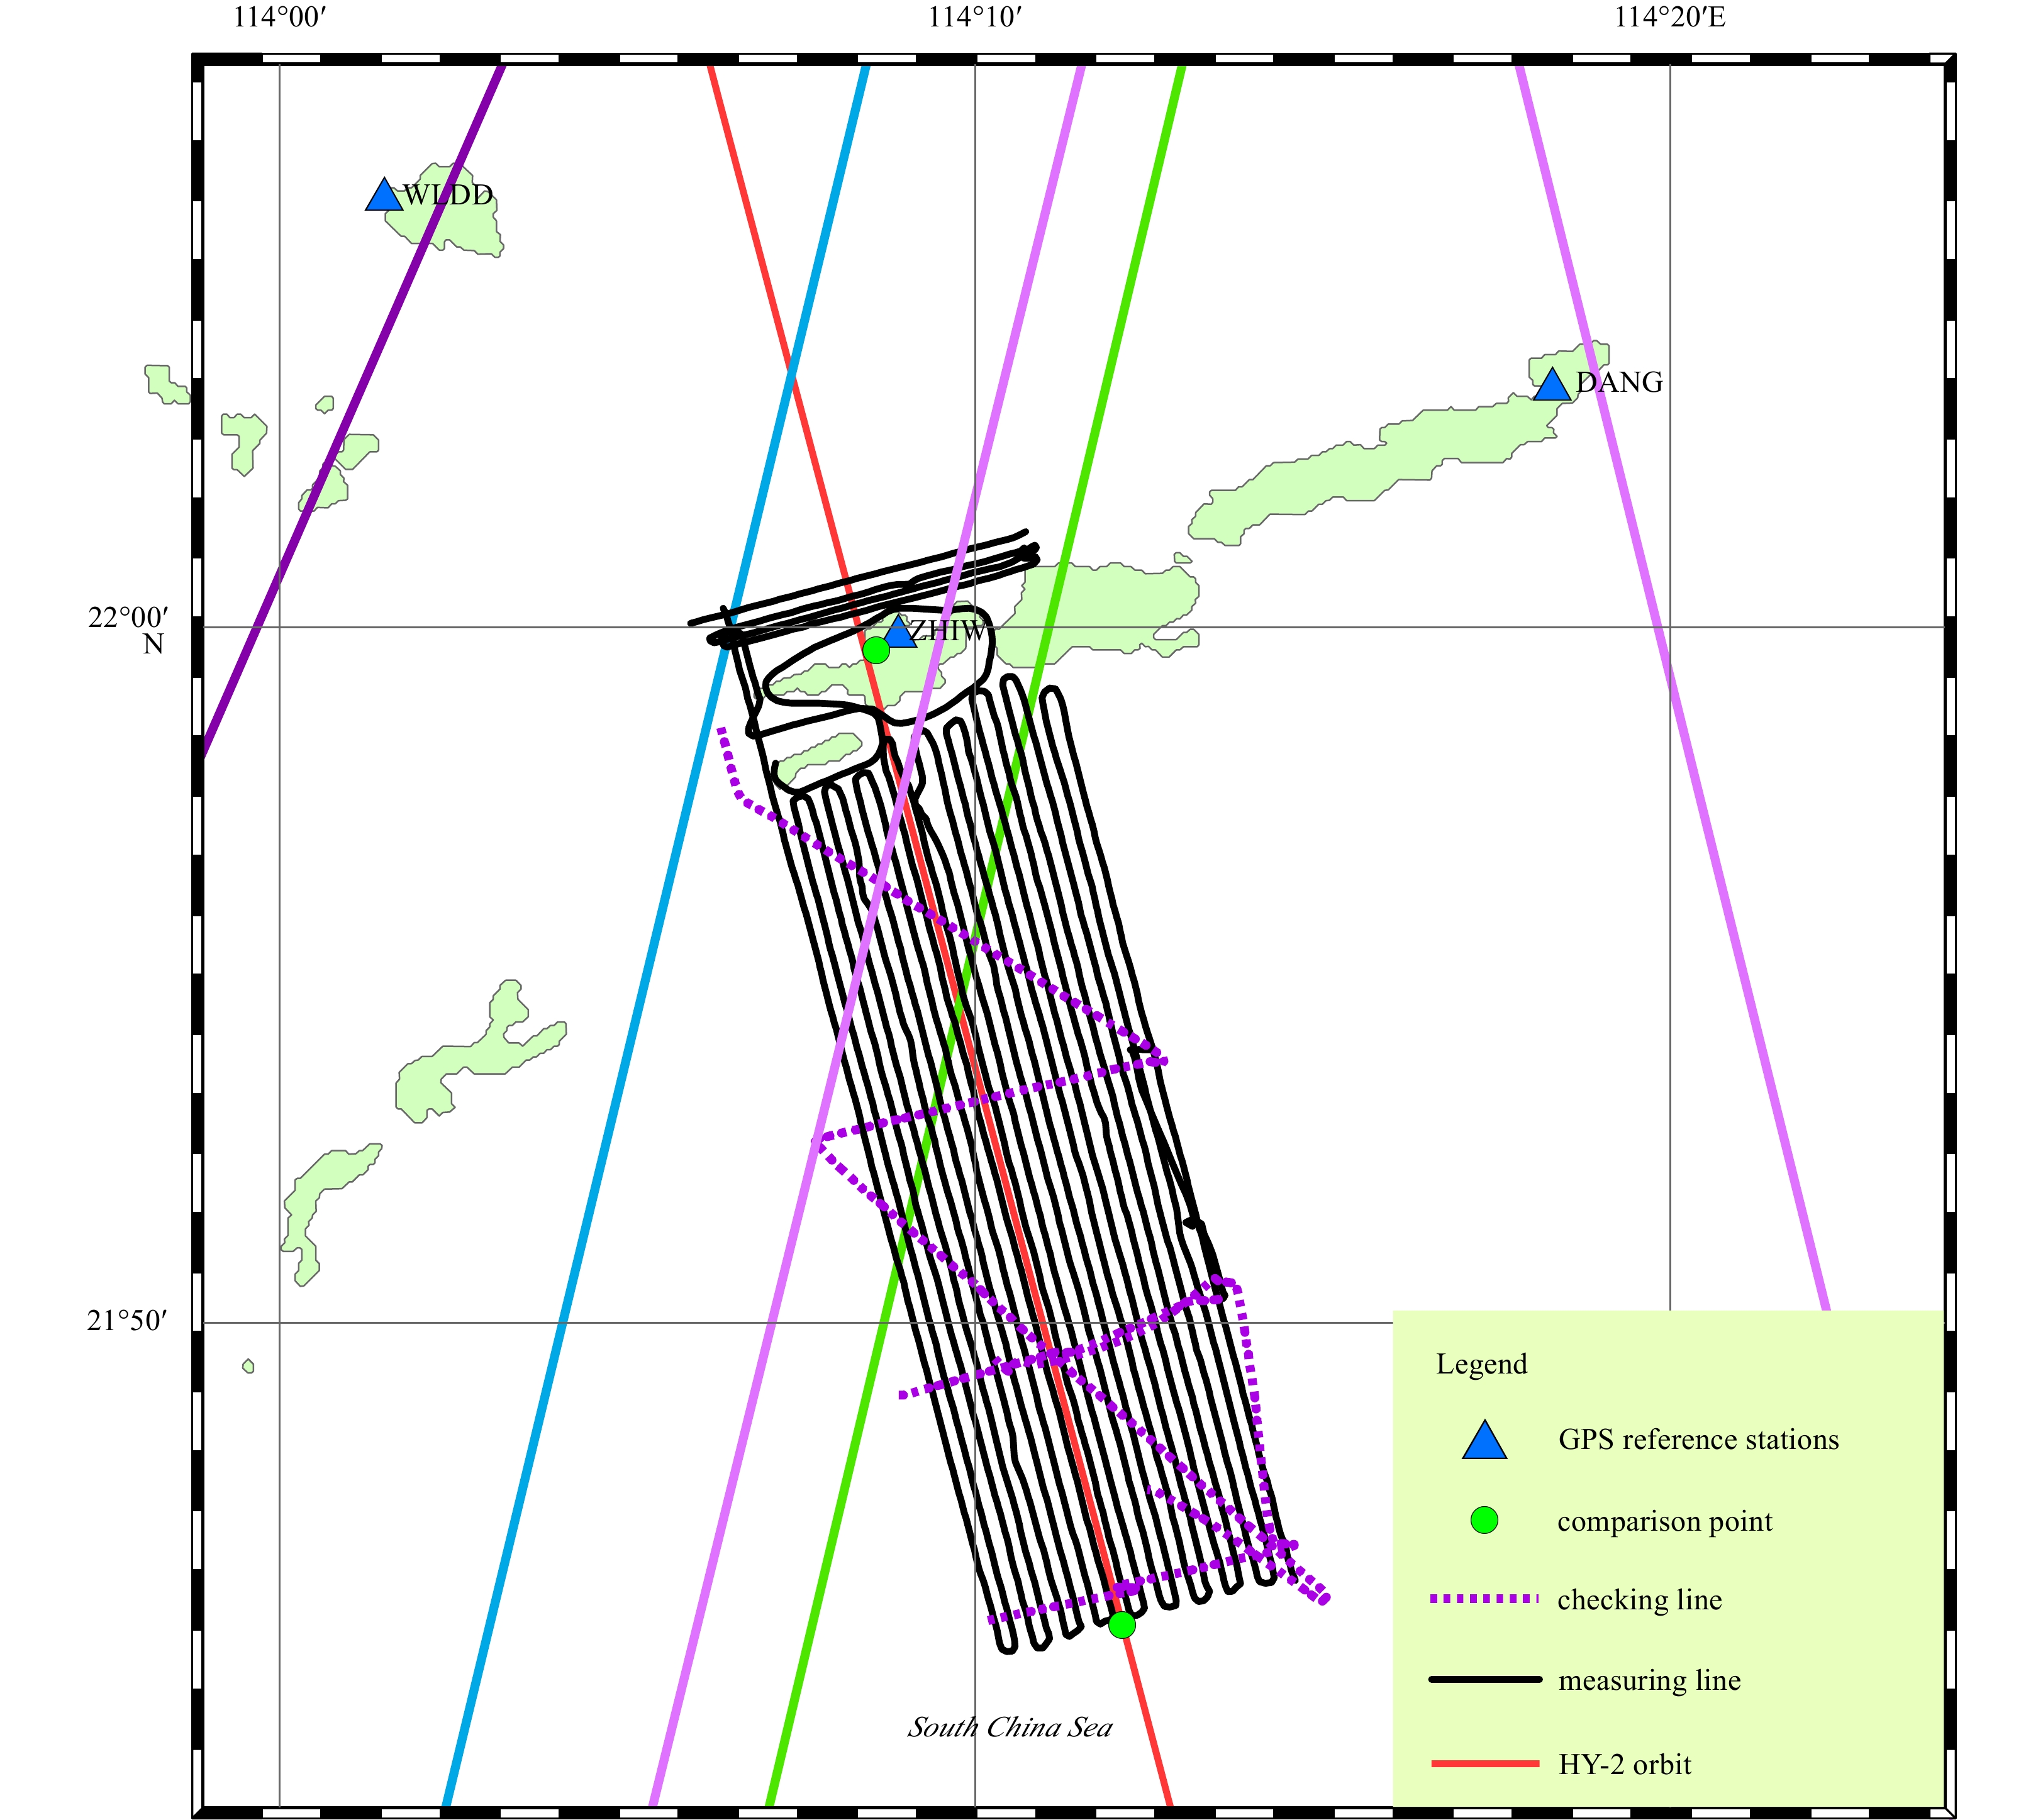
Research area. The GPS buoy is moored at the two circular points to evaluate the precision of the GPS-TB and the gradient of the sea surface. Three GPS reference stations (triangular points) have been placed at Wailingding Island (WLDD), Zhiwan Island (ZHIW) and Dangan Island (DANG), with a tide gauge at the port of the Zhiwan Island. The moorea blue, green, heliotrope and dark amethyst lines represent the altimeterfootprint of ERS, ENVISAT, Sentinel-3A, T/P and Jason-1/2/3, respectively.
The initial 15 min speed of every measuring line is relatively slow to ensure that the GPS positioning has convergence time (Bonnefond et al., 2003). The GPS-TB and the GPS buoy was placed together with the tide gauge to ensure the precision of the two equipment (the green point near ZHIW GPS reference station). The GPS buoy was moored at the southernmost point to determine the worst accuracy of the GPS-TB (the green point at the southern most of the area in Fig. 1). Also, Three GPS reference stations and tide gauges have been set up at Wailingding Island (WLDD), Zhiwan Island (ZHIW) and Dangan Island (DANG), respectively.
2.1
GPS reference stations
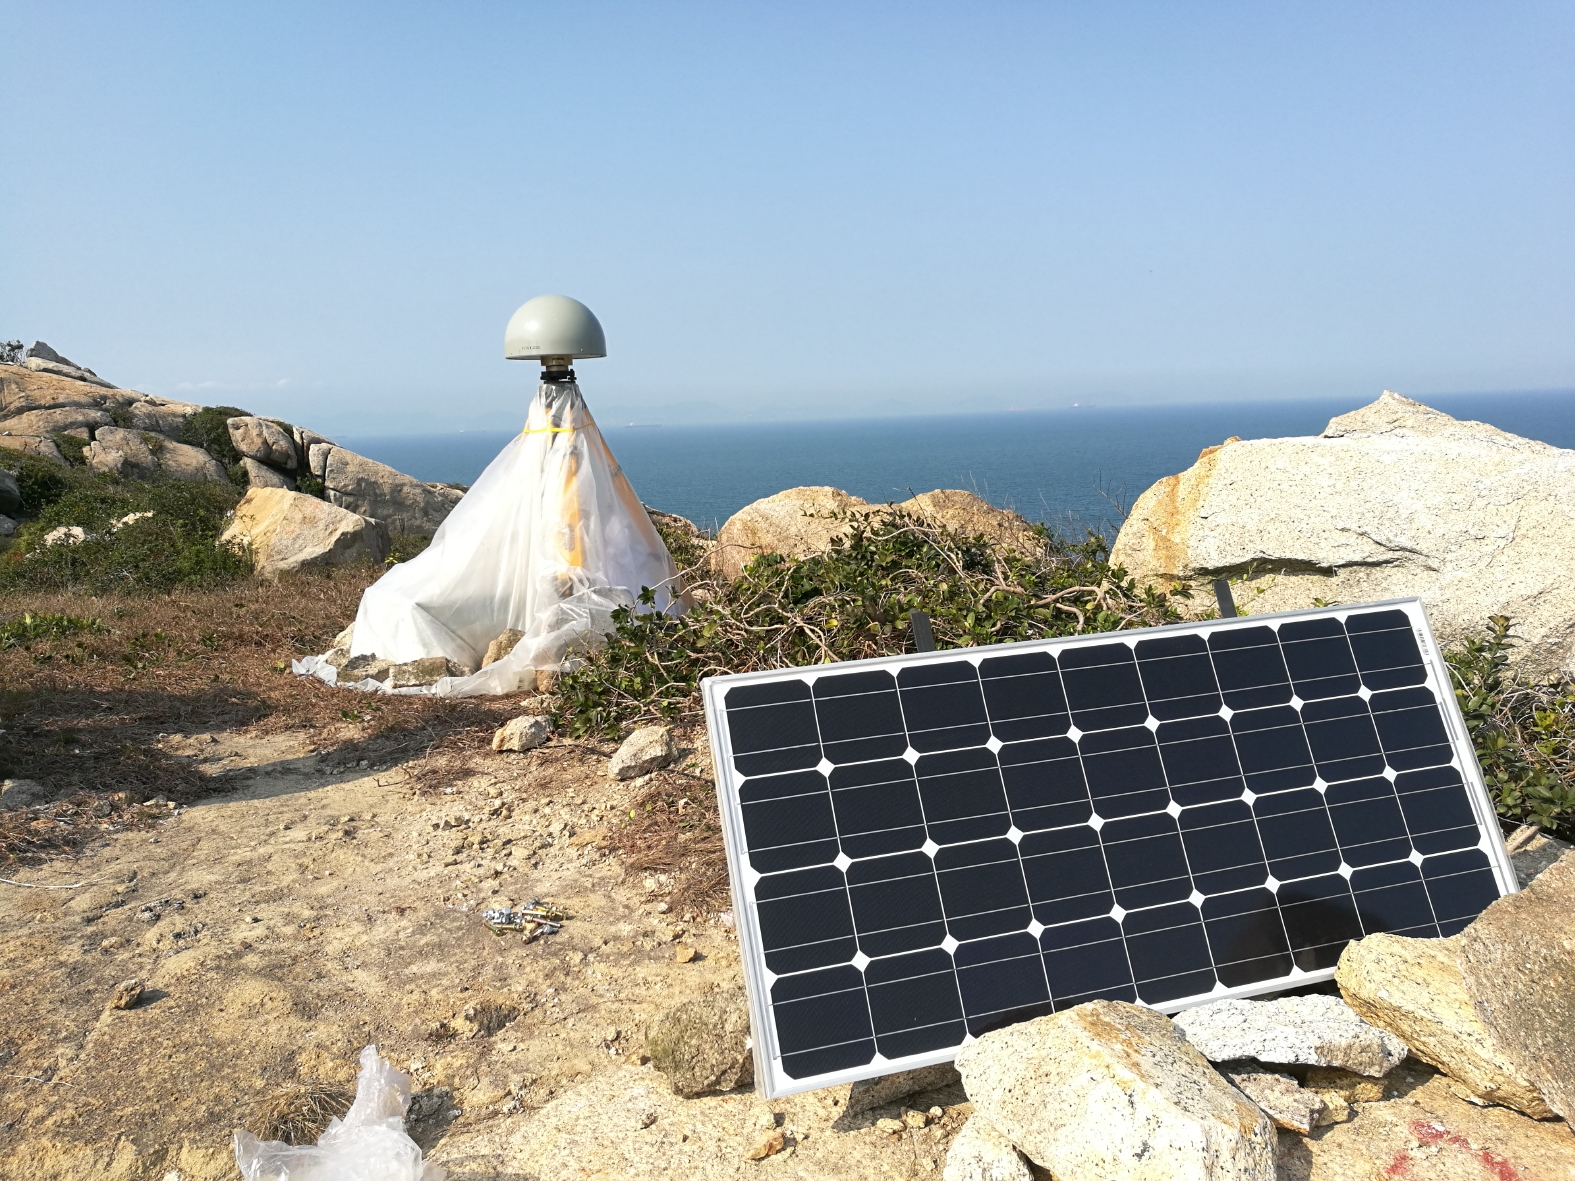
The location of the GPS reference stations was shown in Fig.1. The ZHIW station was equipped with a Trimble Net R9 receiver and a Trimble 59900 chocking antenna, while both the DANG and WLDD stations have one South Net S9 receiver and one STHCR3-G3 antenna. The data reception frequency was set to 1 Hz, which was the same with the GPS buoy and GPS-TB, in order to support kinematic GPS processing. The antenna was installed on the top of the pedestal braced with a tripod. The receiver and a lithium iron phosphate battery for power supply were placed in a waterproof box under the tripod. Moreover, one solar cell was installed to recharge the battery (Fig. 2). The level bubble was checked every few days to make sure that the tripod had not been moved. In addition, WLDD and DANG data will be used in the kinematic solution of the GPS buoy to ensure the SSH accuracy in Cal/Val campaigns respectively which was not mentioned in this paper.
Figure
2.
GPS reference station installed in Zhiwan Island, and a solar cell for power supply.
The data from the GPS reference stations were processed in combination with the nearby International GNSS Service (IGS) stations. The IGS provides Global Navigation Satellite Systems (GNSS) orbits, tracking data, and other high-quality GNSS data and products on line in near real time, which consists of a network of over 400 GNSS stations distributed around the world and provides the highest quality of GNSS data, products and services (Villiger and Dach, 2018). A total of 31 IGS stations were processed together with the reference stations using GAMIT/GLOBK software (version 10.60) in our research (Herring et al., 2018). The tropospheric parameters were estimated every two hours from a priori values computed using the Saastamoinen model (Saastamoinen, 1972) and the VMF1 mapping function (Boehm et al., 2007). The resulting delays were saved and used as an input for the tropospheric correction value in the kinematic processing stage. Horizontal and vertical amplitudes and phases for 31 tidal components are read directly or interpolated from a global grid of the FES2004 ocean model (Lyard et al., 2006). The GPS data was processed using the final precise orbits (IGSF), which have the highest accuracy in Satellite orbits and Station Clocks (see http://www.igs.org/products#GPS). The elevation cut-off angle is set to 10°. The original coordinate of the IGS stations is achieved from the International Terrestrial Reference System , which is a world spatial reference system co-rotating with the Earth in its diurnal motion in space. The “Baseline” experiment is used to fix the orbit, in order to ignore a prior contain of the satellite. The GAMIT solution run twice to ensure the millimeter or 10-9 level of the baseline.
Following the GAMIT solution, GLOBK software was used to combine the loosely constrained parameter estimates from each daily solution with similar estimates from the global IGS daily solutions. GLOBK combines each daily solution to compute the best estimates of station position and associated uncertainty over the entire experiment duration. The final position estimates are defined in ITRF2008 with geodetic coordinates expressed on the GRS80 ellipsoid. Table 1 shows the standard bias of the coordinate of the daily solutions. The standard bias of the height elements were less than 1 cm, which can satisfy the Cal/Val of altimeters (Zhai et al., 2016; Chen et al., 2019). The coordinate of the reference stations was used to give a datum and original location for the GPS buoy and GPS-TB.
Table
1.
Standard bias of the coordinate (ZHIW reference station lasted for 13 d, while WLDD and DANG lasted 32 d)
The SSH was measured using a GPS-TB (Fig. 3) in this campaign. The GPS-TB is assembled by three plastic buckets for the hull to keep its balance. A stainless rack is designed to connect these plastic buckets. Three stainless steel roles are welded at the front of the rack. This fluid design can be more convenient for towing. If the GPS buoy is towed, the speed of the ship will be limited and also the GPS buoy will easily lead to disintegration. The front end of the GPS-TB was extended and towed about 30 m behind the Runjiang 1 ship, in order to minimize the multipath effect caused by the ship, which was made of iron and steel. The GPS data was collected using a geodetic dual frequency GPS receiver in the laboratory of the rear of the ship, with a sampling frequency of 1 Hz (Table. 2). Two STHCR3-G3 Choke Ring antennas were used on top of the tow-body. The phase center stability of the antenna is within 2 mm according to the phase center variation tables (http://www.ngs.noaa.gov/ANTCAL/). Two SOUTH Net-S9 receivers were placed in the laboratory of Runjiang ship, with two communication cables linked with the antennas fixed on top of the GPS-TB. In this campaign, only one GPS data was used in the solution as there was no significant difference between the two receivers through our processing.
Figure
3.
The GPS towing-body used in this campaign.
The dedicated GPS buoy has been used to measure instantaneous sea level at a user-defined frequency over a specific duration in the calibration of the HY-2 and Jason-2 altimeters (Chen et al., 2014; Zhai et al., 2016; Chen et al., 2019) (Fig. 4). In this campaign, the GPS buoy has been moored near the Zhiwan Island twice to link the GPS-TB position to water surface and to evaluate the accuracy of the GPS-TB. Another two tests have been executed by mooring the ship near the wharf of the Zhiwan Island and at the south of the research area (two green points in Fig. 1), which was about 0.2 and 26 km from the ZHIW reference station respectively. The GPS buoy and GPS-TB were tethered together at the rear of the ship to evaluate the accuracy of the GPS-TB.
The instantaneous SSH of the GPS buoy and the GPS-TB was derived from the kinematic analysis of the GPS data. GPS reference stations were assumed to be fixed at their ITRF2008 positions at the corresponding date and only the ZHIW station was used as reference stations. Baseline length varies largely according to the measuring lines: from a few hundreds of meters up to 26 km. The TRACK module was used to do the kinematic solution (Herring, 2012). The distance between the kinematic GPS and the reference station plays an important role in the influence of the precision of the height (Zhai et al., 2016). For short baselines (<2–3 km) near the Zhiwan Island, ionospheric delay can be treated as ~zero and L1 and L2 ambiguities resolved separately. Positioning can use L1 and L2 separately (less random noise). For longer baselines (>3 km), it uses the Melbourne-Wubena Wide Lane (MW-WL) to resolve L1–L2 and then a combination of techniques to determine L1 and L2 cycles separately to obtain the three-dimensional coordinates and unit weight mean square error of stations by single epoch in a given coordinate system.
2.3
Tide gauge
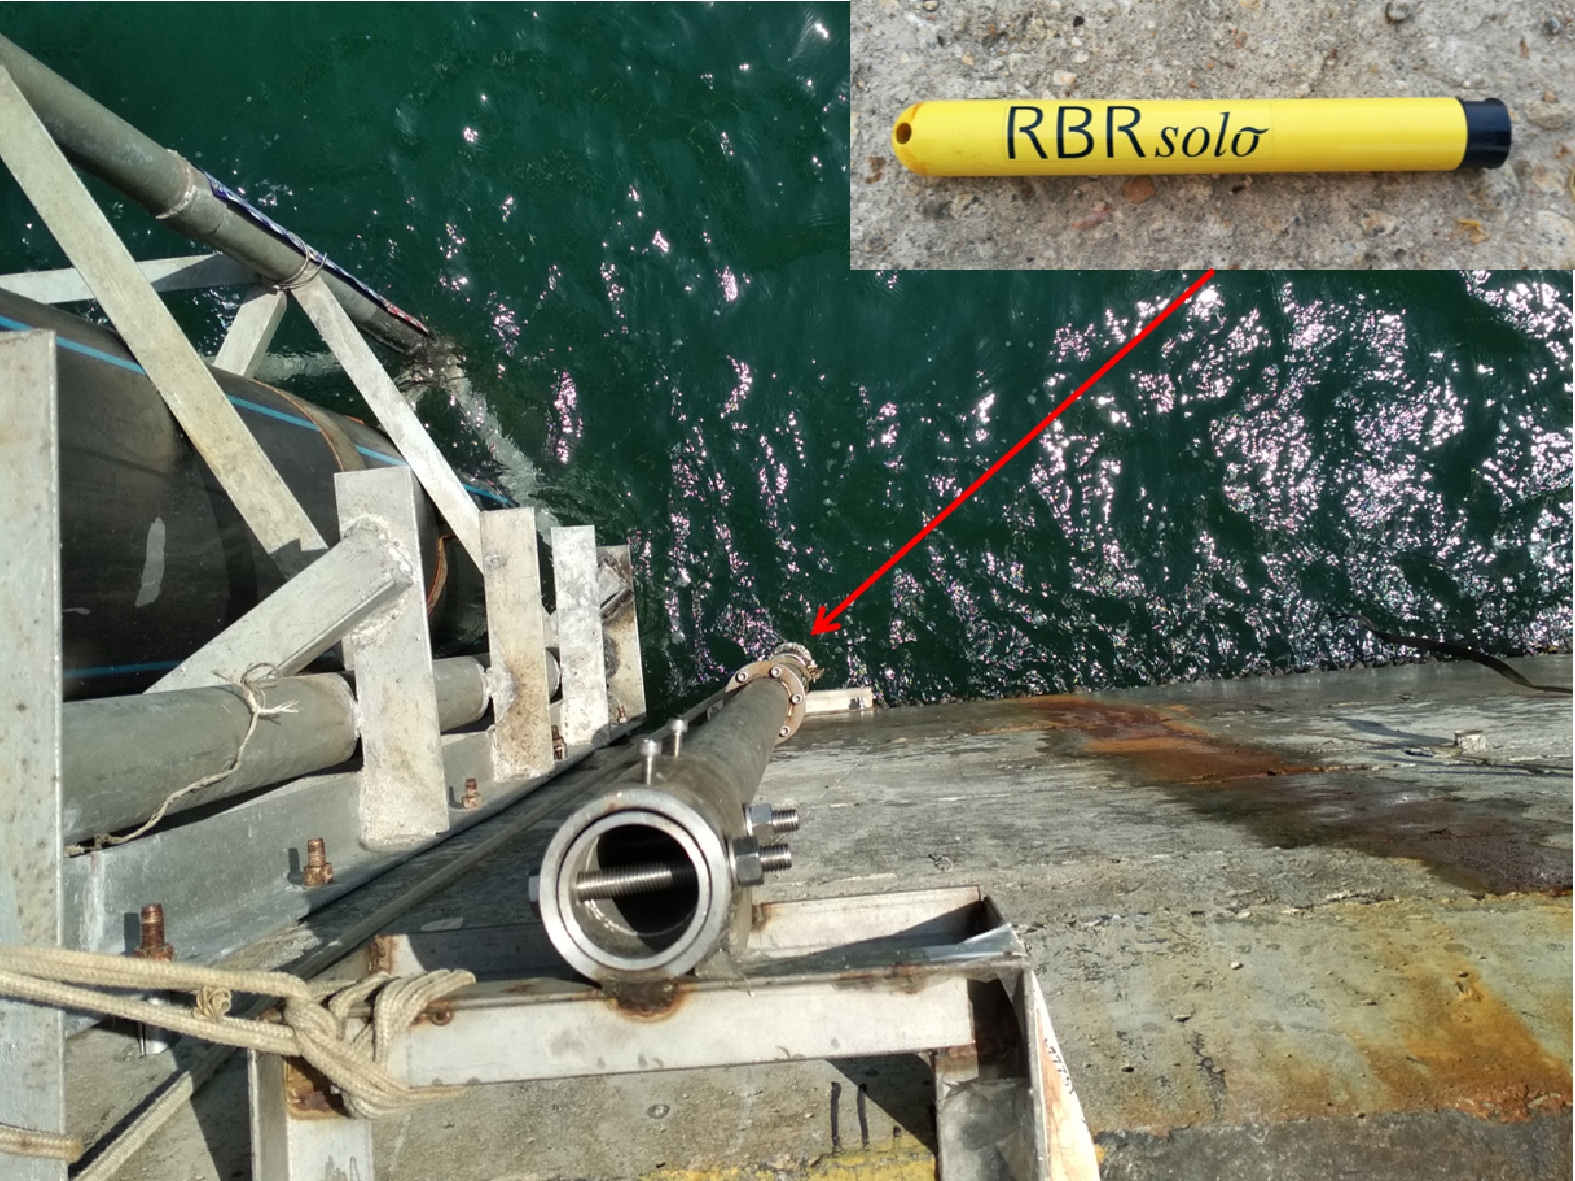
There is no long-term tide station on the Zhiwan Island, so we set up a temporary tide gauge in this campaign. An RBR pressure tide gauge, which can operate down to 20 m depth, was installed in the shore of the Zhiwan Island with sampling period of 1 sec (Fig. 5). The precision of the tide gauge is 5 Pa, and thus has been widely used in the monitoring of sea level. The tide gauge is installed by a stainless pipe to measure the sea level for more than 15 d. The sensor measured the pressure of both the atmosphere and the water above. The atmosphere pressure is achieved by an XZC-6 meteorological mounted onboard with a sampling period of 60 sec for pressure correction of tide gauge. A SZC15-2 CTD was set to measure the temperature and the salinity of the sea. The pressure of the tide gauge is corrected by using the air pressure of the meteorological instrument in Eq. (1) (Tang et al., 2007):
Figure
5.
RBR tide gauge. The tide gauge is fixed by stainless steel tube to ensure the vertical of tide gauge.
where g is gravitational acceleration, calculated according to the latitude (m/s2), and θ is latitude of the location of the tide gauge.
The sea level data was filtered using a moving average method by the interval of 1 min. The mean tide used in the correction of SSH was determined by a mean value of the 15 d sea level measurements, thus we could only achieve a relative sea surface of this area.
3.
Sea surface determination
3.1
Precision of the GPS-TB
Two tests have been conducted to evaluate the accuracy of the GPS-TB in this campaign. By mooring the GPS-TB, GPS buoy and tide gauge at the same place and the same time (see the two circular points in Fig. 1), a comparison can be conducted between the three equipment. The precision of GPS-TB can be confirmed by the GPS buoy, which has a high precision in measuring the sea level (Chen et al., 2014; Zhai et al., 2016).
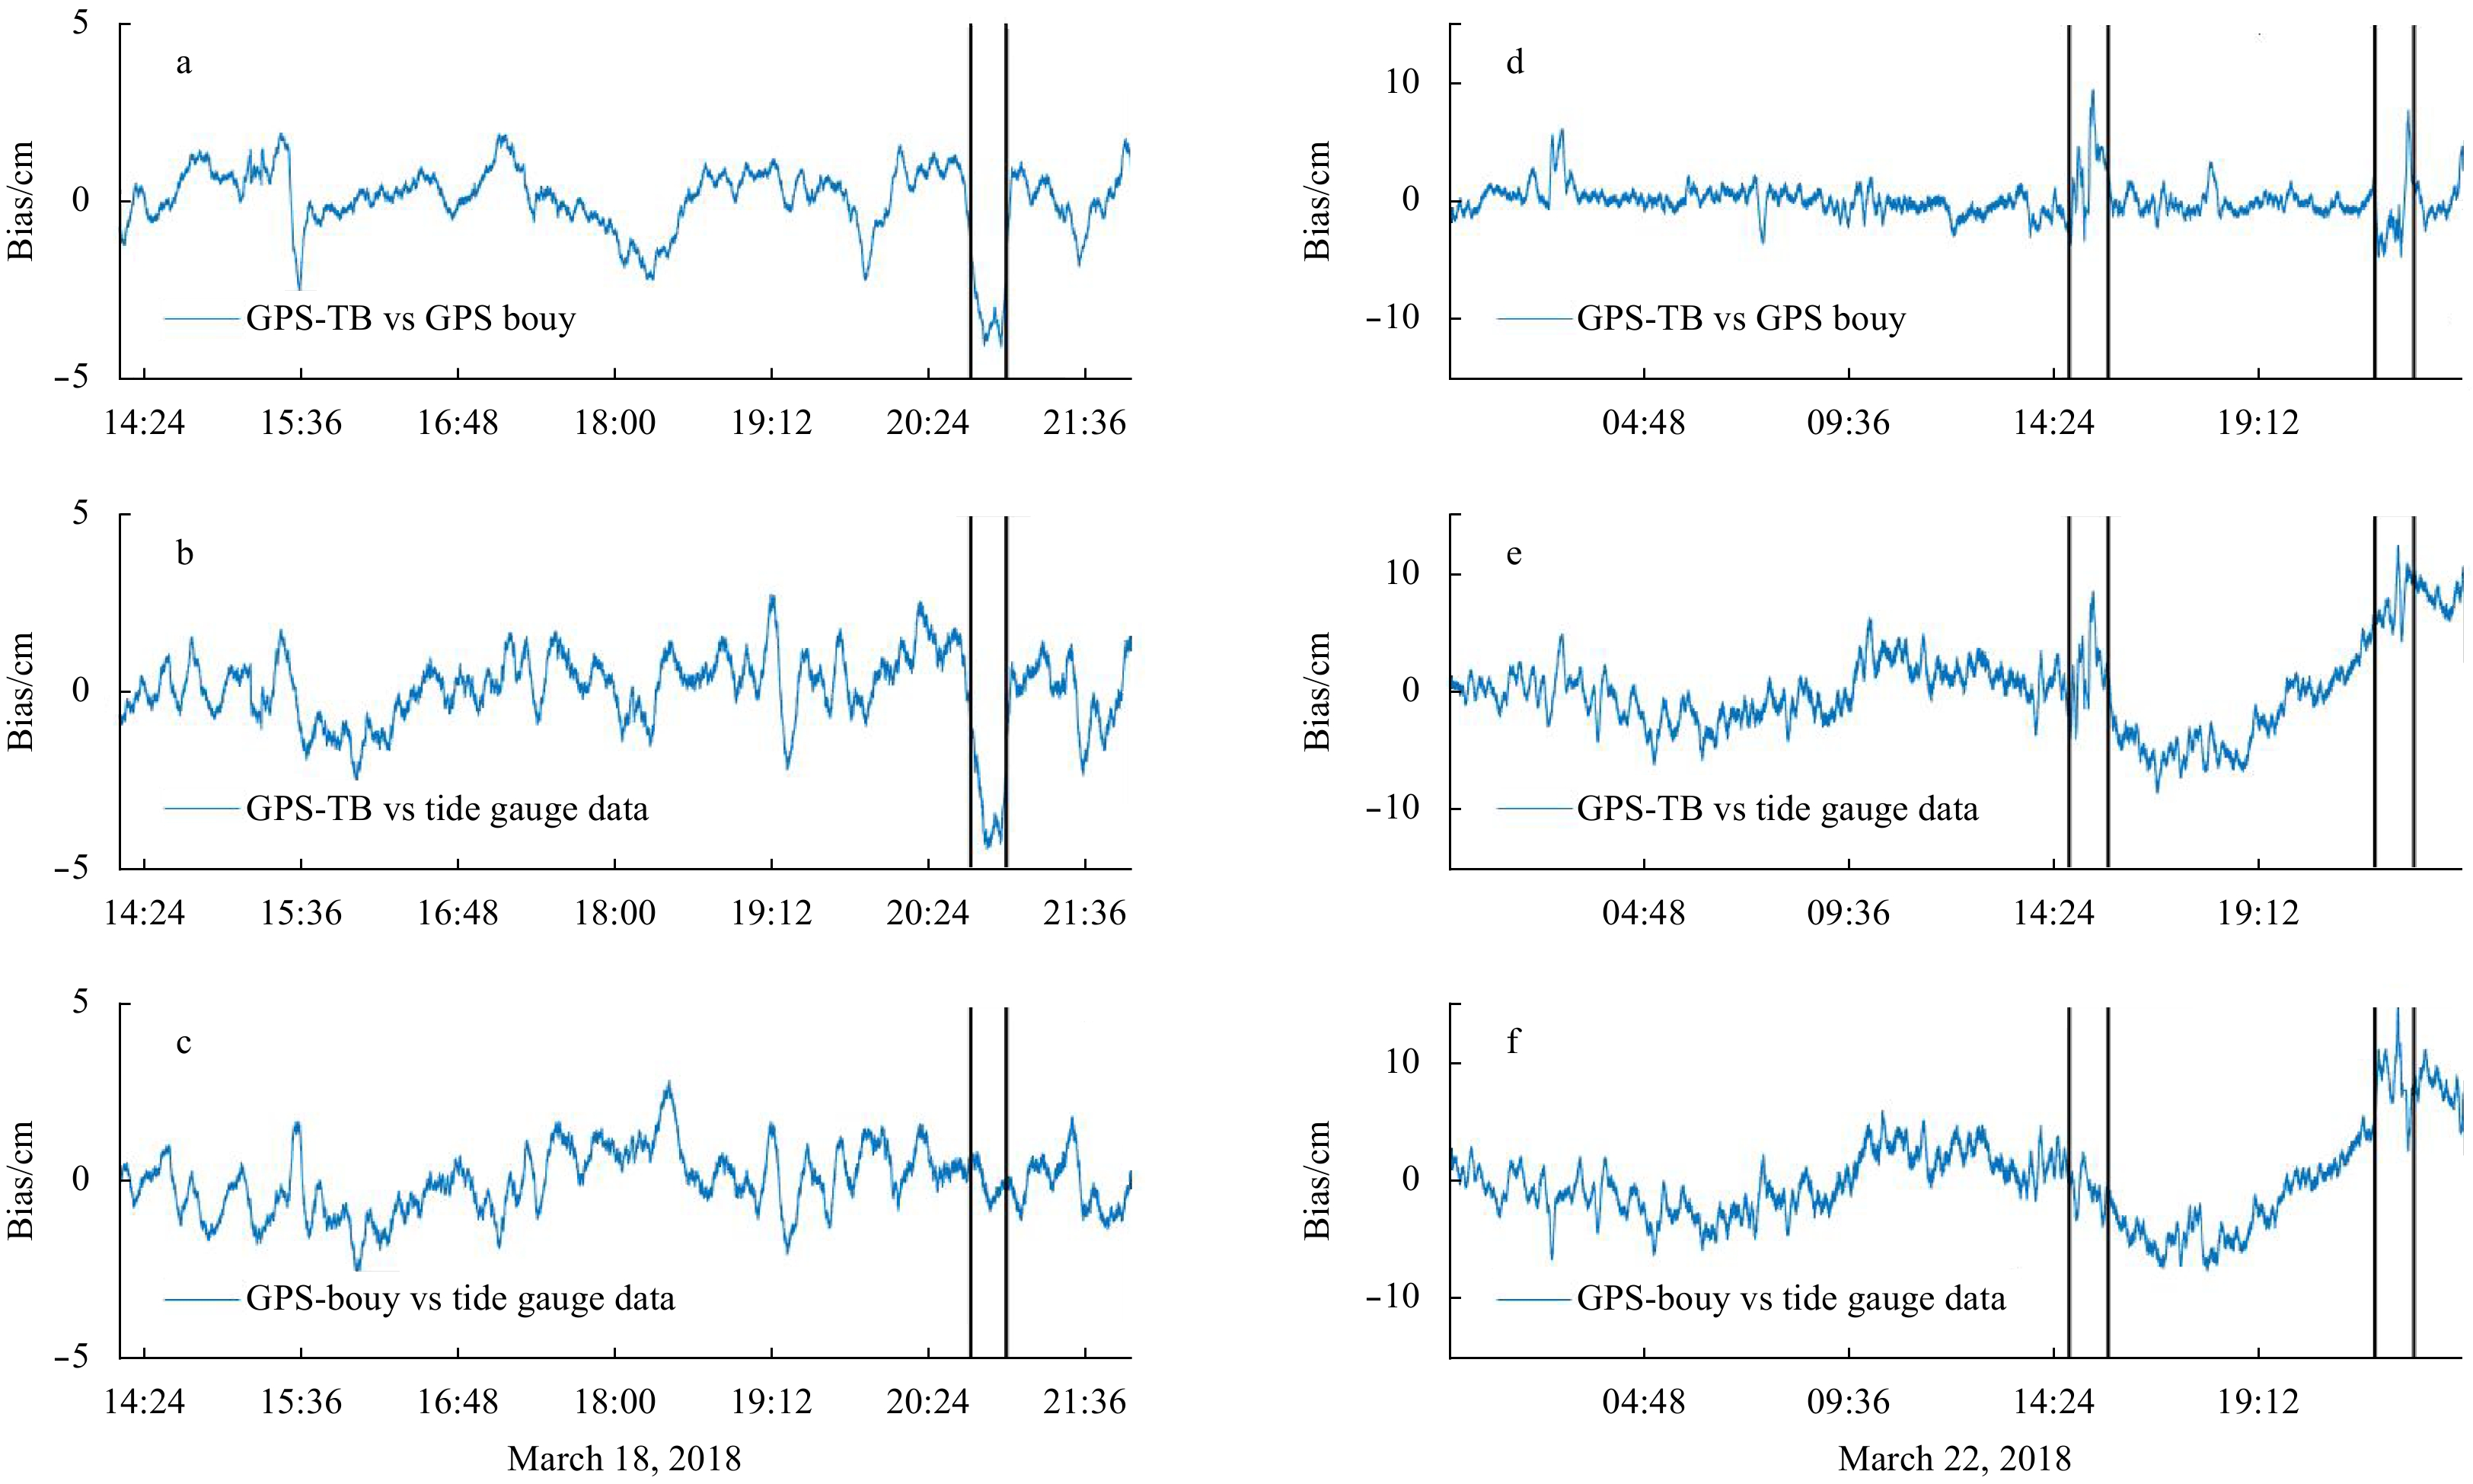
The first comparison at Zhiwan Island lasted approximately 7.5 h. The distance between the three equipment was less than 400 m. The 1 Hz raw data measured by the GPS buoy and GPS-TB were smoothed with a time lag of 5 min to filter out surface waves, swell, and high-frequency noise (Liu et al., 2014; Xu et al., 2016). The height of GPS-TB from 20:41 to 21:02 is not very good in Fig. 6a. The RMS of each TRACK solution during this period of time was relatively high. This may be caused by the deficiency of the GPS signals and the TRACK solution will take a long time to recalculate the accurate coordinate of the GPS-TB. These data will be deleted in the comparison. The updated SSH presented a standard deviation of 1.10 cm compared with the tide gauge, which is equivalent with the GPS buoy.
Figure
6.
Comparison of tide gauge, GPS buoy and GPS-TB. a–c. The comparison at the port of the Zhiwan Island: GPS-TB minus GPS-buoy (a), GPS-TB minus tide gauge (b), GPS-buoy minus tide gauge (c); e–g. The comparison about 26 km south of the island: GPS-TB minus GPS-buoy (d), GPS-TB minus tide gauge (e), GPS buoy minus tide gauge (f).
The baseline length between the GPS reference station and the GPS buoy/GPS-TB plays an important role in the kinematic solutions (Zhai et al., 2016). The precision of the SSH will be lower as the baseline length lengthened. The second comparison point at the southernmost of the research area which is about 26 km from ZHIW reference station and lasts approximately 20 h. This baseline was almost the longest in this campaign, and would achieve the worst accuracy of SSH. There may exist a sea level difference (tidal difference) between the comparison point and the tide gauge. The differential tidal signal was analyzed from the results of global and regional tide models over this site (FES2004, NAO.99). The tidal difference from two tide models ranges from –3.23–3.67 cm (NAO.99) and –3.0–2.87 cm (FES 2004) between the two circular points of Fig. 1, with a standard deviation of 1.77 cm and 1.98 cm. The tidal difference was corrected by a mean level of the NAO.99 and FES 2004 tide model, which was the same in the determination of the sea surface. This will represent the largest error of the SSH achieved from the GPS-TB minus tide data.
The standard deviation is 3.71 cm (GPS buoy vs tide gauge) and 3.59 cm (GPS-TB vs tide gauge, Table 3). Affected by the ship and/or wave, the GPS-TB and GPS buoy data was not very consistency with the tide gauge data from 14:34–15:20 and 22:14–22:50 (data between the black lines in Fig. 6b), and sometimes it even led to a lack of GPS data. These data will be deleted in the processing of SSH. The accuracy of all the other SSH solution was higher than 3.59 cm.
Table
3.
The statistics of SSH difference between tide gauge, GPS buoy and the GPS-TB (unit: cm)
From the above section, the GPS-TB can be used to measure the SSH with a high precision. The SSH, together with bathymetry and seabed geomorphology was then measured by the Runjiang 1 ship. The north measuring line was about 1 km from the Zhiwan Island, to ensure the coverage of the SSH from the tide gauge to the altimeter measuring point (AMP). The southernmost of the area was about 26 km from the Zhiwan Island, which would cover 2–3 AMPs of HY-2. The speed was controlled within 3 m/s during the measurement process. The tide gauge installed in the Zhiwan Island was used for sea level/tide correction, and the GPS reference station was used to set the datum of the kinematic GPS solutions (GPS-TB and GPS buoy).
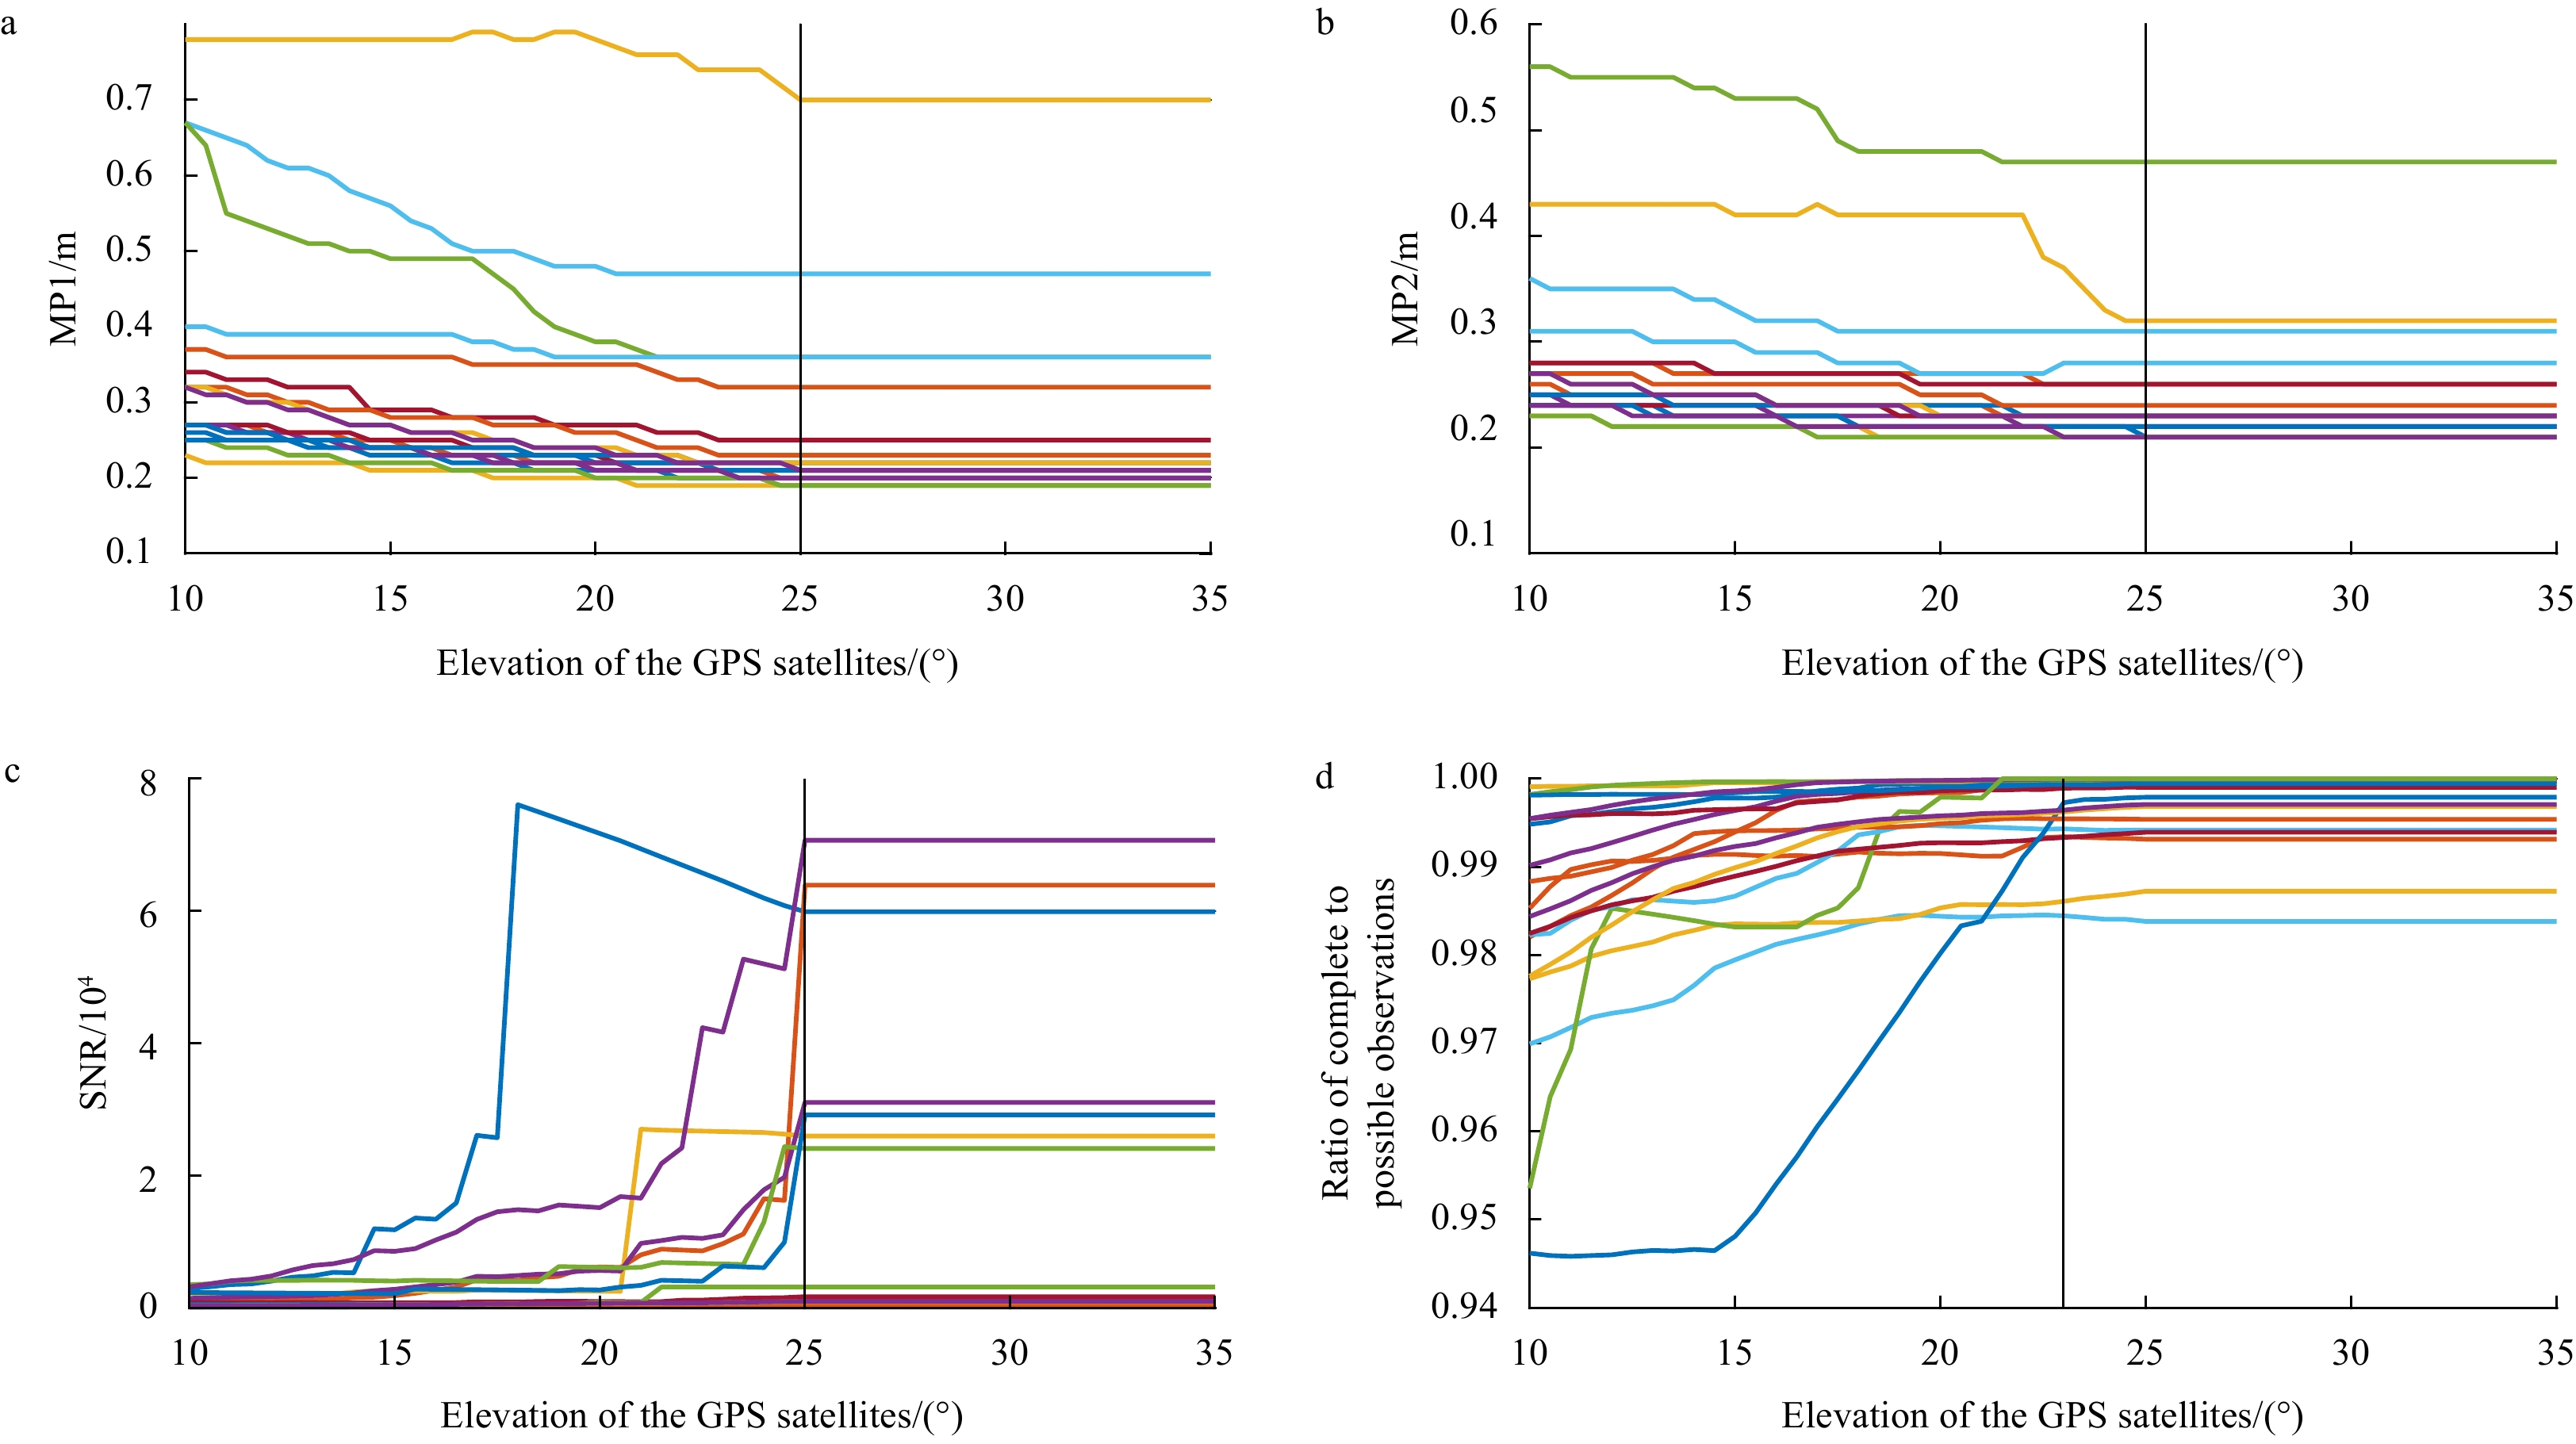
The quality of the GPS data was controlled by TEQC software developed by UNAVCO (Estey and Wier, 2014). The signal-to-noise ratio (SNR) and the multipath (MP1/2) of the GPS satellites were extracted from cut-off angle of 10°–35° with interval of 0.5° (Fig. 7), in order to acquire high quality GPS solutions. The significant wave height (SWH) was about 1.18 m with a period of 6.30 sec according to ECMWF during the campaign. When the GPS-TB was towed at the wave trough, a portion of the signals reflected by the ocean wave reaches the antenna, interfering with the direct signals, and affecting the GPS observables recorded by the receiver. This is known as multipath and it is one of the major error sources in high-accuracy positioning (Löfgren et al., 2014). All the measuring lines was listed in Fig. 7 except for three lines, because the quality results of the three lines showed that the MP1/2 was higher than 1 m and the SNR was lower than 100 which represented a poor data quality. These lines will not be used in the sea surface interpolation. The SNR and MP1/2 had a large fluctuation when the elevation was lower than 25° (Figs 7a–c), while the ratio of complete to possible observations varied when the elevation was lower than 23° (Fig. 7d). All the elements of the quality control tended to be stable with a>25° elevation.
Figure
7.
Quality control of the GPS-TB data. The y-axis was the MP1 (a), MP2 (b), SNR (c) and the ratio of complete to possible observations (d) of all the measuring lines.
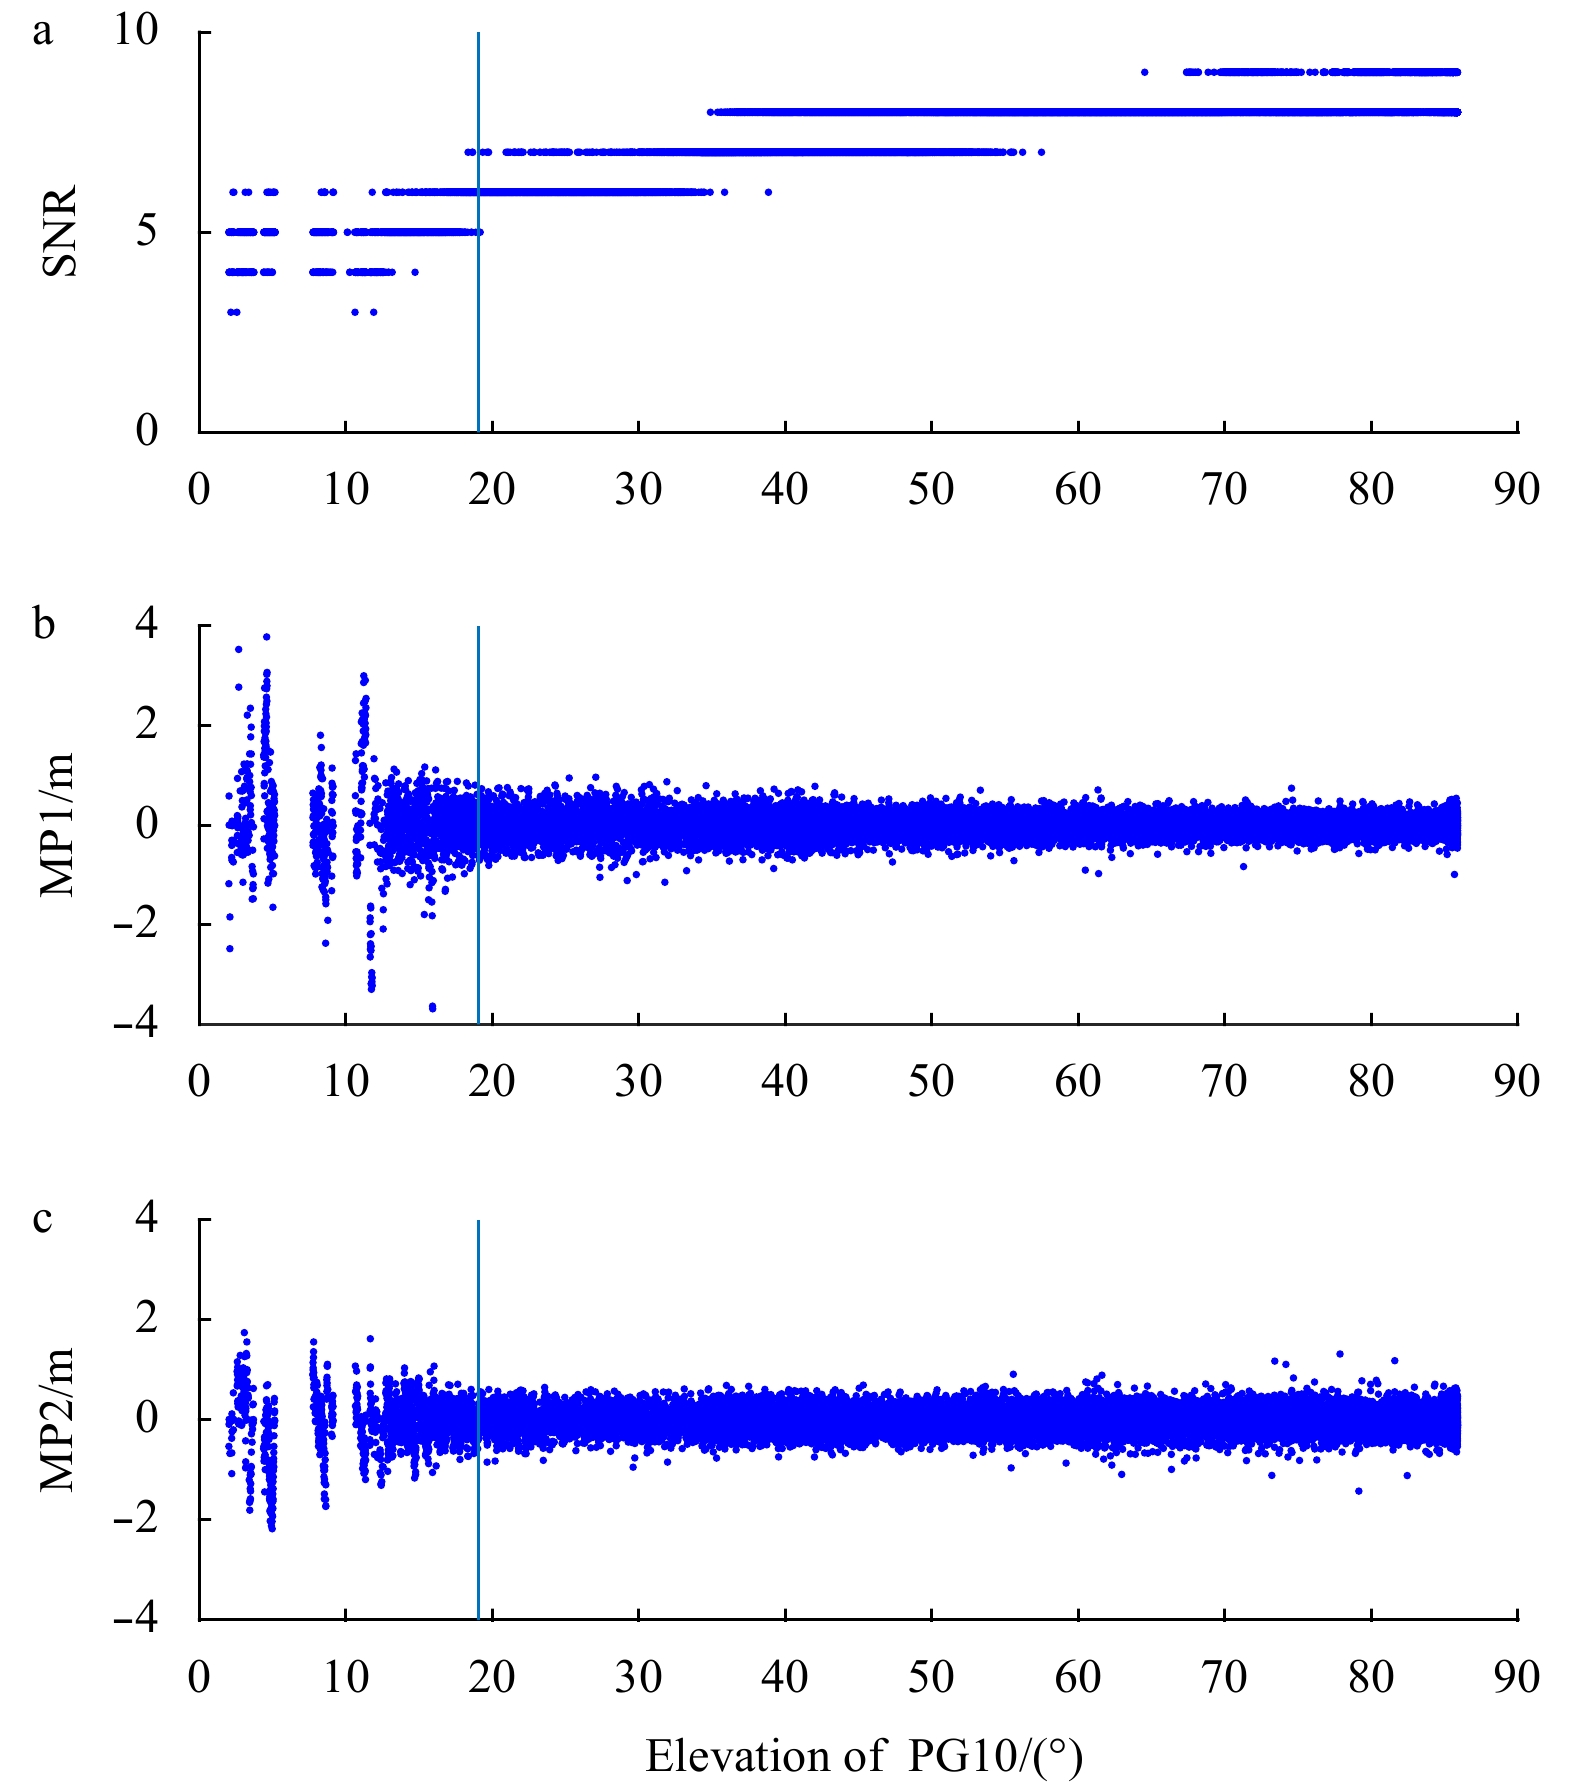
Figure 8 shows the quality of PG10 satellite of the northern most line in the campaign. The GPS signal was intermittent when the elevation of the satellite was lower than 15˚. The MP1/2 convergence when the elevation was higher than 19˚. Moreover, we compared the bias of the SSH with the SWH to determine the influence of the SWH to the SSH (Fig. 8b). The SWH was determined by the formula SWH = 4σwave (Stewart, 2008; Xu et al., 2016). The standard deviation of the waves, σwave, was determined using both the GPS buoy and the GPS-TB in every 30 min. The relationship of the SWH and the bias of SSH is only 5.4%, which means that the SWH do not have significant affects to the SSH in a relatively fixed position. Though the Choke Ring antennas can avoid the cycle slip. Sometimes the surface waves can break over the antenna dome structure and cause a loss of the GPS signal (Watson et al., 2003; Chen et al., 2014). This can serve as an indicator of cycle slip, which means a sudden jump that occurs when a carrier tracking loop misses a whole number of wavelengths in carrier phase measurements. During the rover movement carrier cycle slip has occurred, the coordinates become erroneous. The TRACK solution of the position of the next epoch based on the position information of the previous epoch. If the sudden jump occurred in a relatively fixed position, the kinematic solution could vanish quickly, and the TRACK solution will take a long time to recalculate the accurate coordinate of the GPS-TB. In the motion state, it was very difficult to obtain a re-convergence result when the sudden jump occurred.
Figure
8.
GPS data quality of one of the measuring lines. The y-axis was the SNR (a), MP1 (b) and MP2 (c) of PG10.
According to the above analysis, the cut-off angle of the kinematic was set to 25° in TRACK solutions. The GPS data of every measuring line was calculated separately. The SSH was corrected by the tide gauge data installed in the Zhiwan island to determine the sea surface of the research area. The GPS-derived SSH time series are relative to the antenna phase center, whereas the tide gauge sea level observations are relative to the tide gauge benchmark. As the tide gauge was placed temporary and lasted only fifteen days. It was impossible to achieve the mean tide. The main issue was not to determine the absolute sea surface height, but the slope between the offshore altimetric measurements and coastal tide gauge locations (Bonnefond et al., 2003). Therefore, the sea surface was a relative value to a mean tide level of the fifteen days measurements.
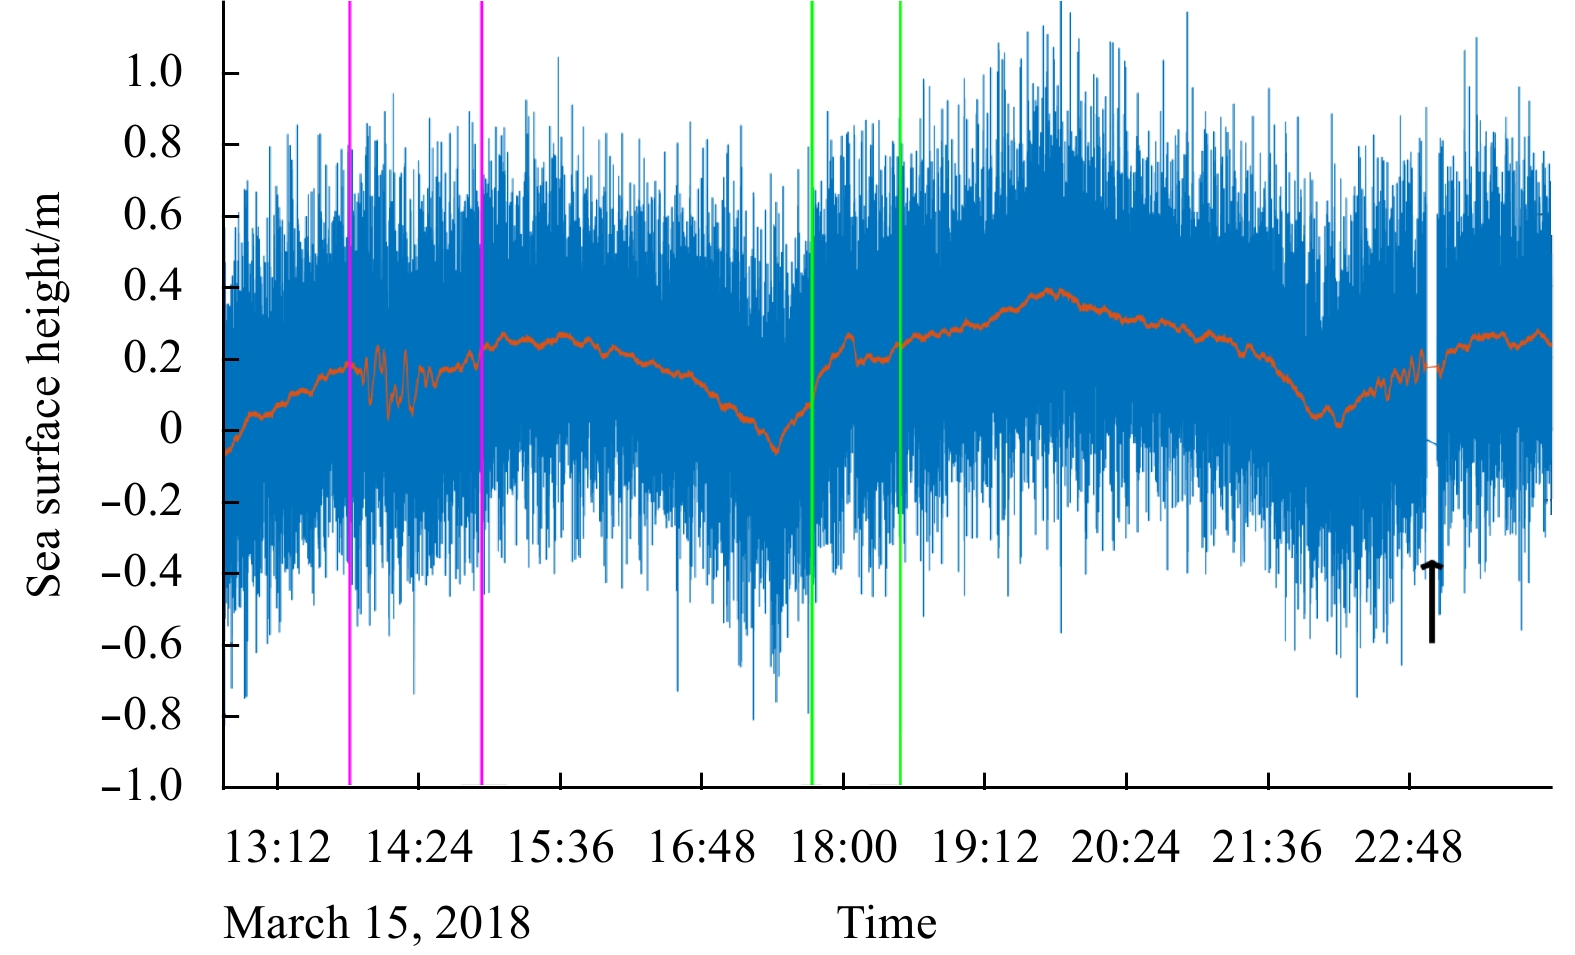
Figure 9 shows the sea surface measured in March 15, 2018. A moving average filter with period of 5 min was used to filter the sea surface data (the red lines in Fig. 9), in order to eliminate the influence of surface waves, high frequency noise and other sea conditions. While there is still some sudden change in the GPS solutions from 13:48–17:43 and 13:48–14:55 and a GPS signal loss from 22:56–23:01. Taking an enormous result of about 4 and 1 h, the TRACK solutions take a relatively longer time to obtain the re-coverage solution compared with the relatively fixed solutions in Section 3.1. The RMS of the TRACK solution during these periods of time was higher than 2 cm. The SWH of this time was about 0.81–0.99 m, with a wind speed of less than 4 m/s, which represents a relatively lower sea conditions in the campaign but the traveling direction is opposite to the wave direction. The deficiency of the GPS signals may be caused by the breaking wave and tension on the GPS-TB. Such solution will be deleted in the interpolation of the sea surface.
Figure
9.
Sea surface measured by GPS-TB. The sea surface data between purplish red and green lines have a sudden change which was consistent with the situation appearing in Fig. 6. The data pointed by the black arrow represented a deficiency of GPS signals.
The determined sea surface was interpolated by the method of ordinary kriging in ArcGIS 10.2 (Fig. 10). The sea surface slope gradually rises from northwest to southeast. This slope is about 1.62 cm/km along the orbit of HY-2. In the Cal/Val campaigns, the comparison point was usually more than 15 km offshore. This may cause a sea surface difference of about 24.30 cm. Therefore, this research will improve the Cal/Val bias of the altimeters.
Table 4 summarized the error sources of the GPS-TB and GPS buoy height estimates as well as the final precision. In this campaign, the vertical uncertainty of the GPS reference station was estimated to be 4.5 mm, which was a standard bias of the daily solutions (Table 1). The <2 mm error of GPS antenna phase center was achieved by the phase center variation tables mentioned in Section 2.1. We evaluate the kinematic error of 1 cm+1 ppm (part per million). The error increased with the increase of distance between the GPS reference station and the GPS-TB/GPS buoy. The largest distance was 26 km, which may lead to the largest error of 3.6 cm. The tidal correction was influenced by the distance between the tide gauge and the location of the GPS-TB. The tidal error of the largest distance was 1.98 cm as mentioned in Section 3.1. All these errors were considered to be independent. And the total error estimated in this campaign was 4.14 cm according to Wu and Zhang (2010).
Table
4.
Error budget of the process of GPS kinematic solution (unit: cm)
Error source
GPS-TB and GPS buoy
GPS reference stations
0.45
GPS antenna phase center
<0.2
Kinematic solution error
3.6
Tide corrections
1.98
Totalerror1)
4.14
Note: 1) Total error calculated from the above independent errors according to Wu and Zhang (2010).
A check line was devised in this campaign and lasted about 5 h (Fig. 1). Every measuring interpolated point was compared with its nearest checking points (Fig. 11). The total bias was –1.4 cm with a standard bias of 1.6 cm. The distance between the GPS-TB and the reference station plays an important role in the precision of kinematic solutions. We used a distance interval of 0.5 km to calculate the average bias of each interval (blue circles connected by wires in Fig. 11). The bias was less than 1 cm when the distance was shorter than 3 km. These data were received on the northwest of Zhiwan Island. The sea state was calm in this area, with a SWH of about 0.62 m (ECMWF). While the bias varied from 1.5–4.0 cm when the SWH was 1.05 m on the south of Zhiwan Island corresponding to the distance of larger than 4 km. The check line navigated at least twice in the distance of 16–27 km. The variance was large when sailing against the waves with a bias of –2.44 cm and standard bias of 1.85 cm (light blue dots in Fig. 11). The wave and tension on the tether did not allow the GPS-TB to rise over the wave, rather the buoy breaks through the wash on the crest of the wave-front. This caused complete loss of GPS tracking. However, the change was small when the ship/GPS-TB was driving along the waves, and the bias was –1.49 cm with a standard bias of only 0.72 cm (green dots in Fig. 11). It was impossible to quantify the affection of the waves in this campaign and would be our future work. To summarize, the kinematic GPS solution was affected by the wave. Watson et al. (2011) had designed a GPS buoy with the antenna reference point 0.810 m above the mean water level, which we could refer to improve the GPS-TB.
Figure
11.
The error of interpolated sea surface checked by the checking line. The y-axis represented the distance between the GPS-TB and the reference station. The x-axis represented the bias of the measuring SSH minus the check line. The blue line represented the data averaged by distance interval of 0.5 km. The green and cyan points represented the bias of check line vs the interpolated sea surface when sailing against and along the waves.
The sea surface measured by the GPS-TB was compared with CNES_CLS11 MSS. CNES_CLS11 MSS was computed from 16 years of seven satellite altimeter data (T/P, ERS-1 GM, ERS-2, Jason-1, T/P interleaved mission, GFO, and Envisat). The regarding differences between CNES CLS11 MSS and DTU10 MSS was below a value close to 2 cm globally (Schaeffer et al., 2012). The error in the research area was only (1.22±0.23) cm extracted from the error estimation of CNES_CLS11 MSS. The footprint of T/P, Jason-1/2/3, Envisat altimeters was not far from the research area (less than 20 km, see Fig.1), which caused a high accuracy of the MSS models. This model was also used in IGDR products of HY-2 altimeter.
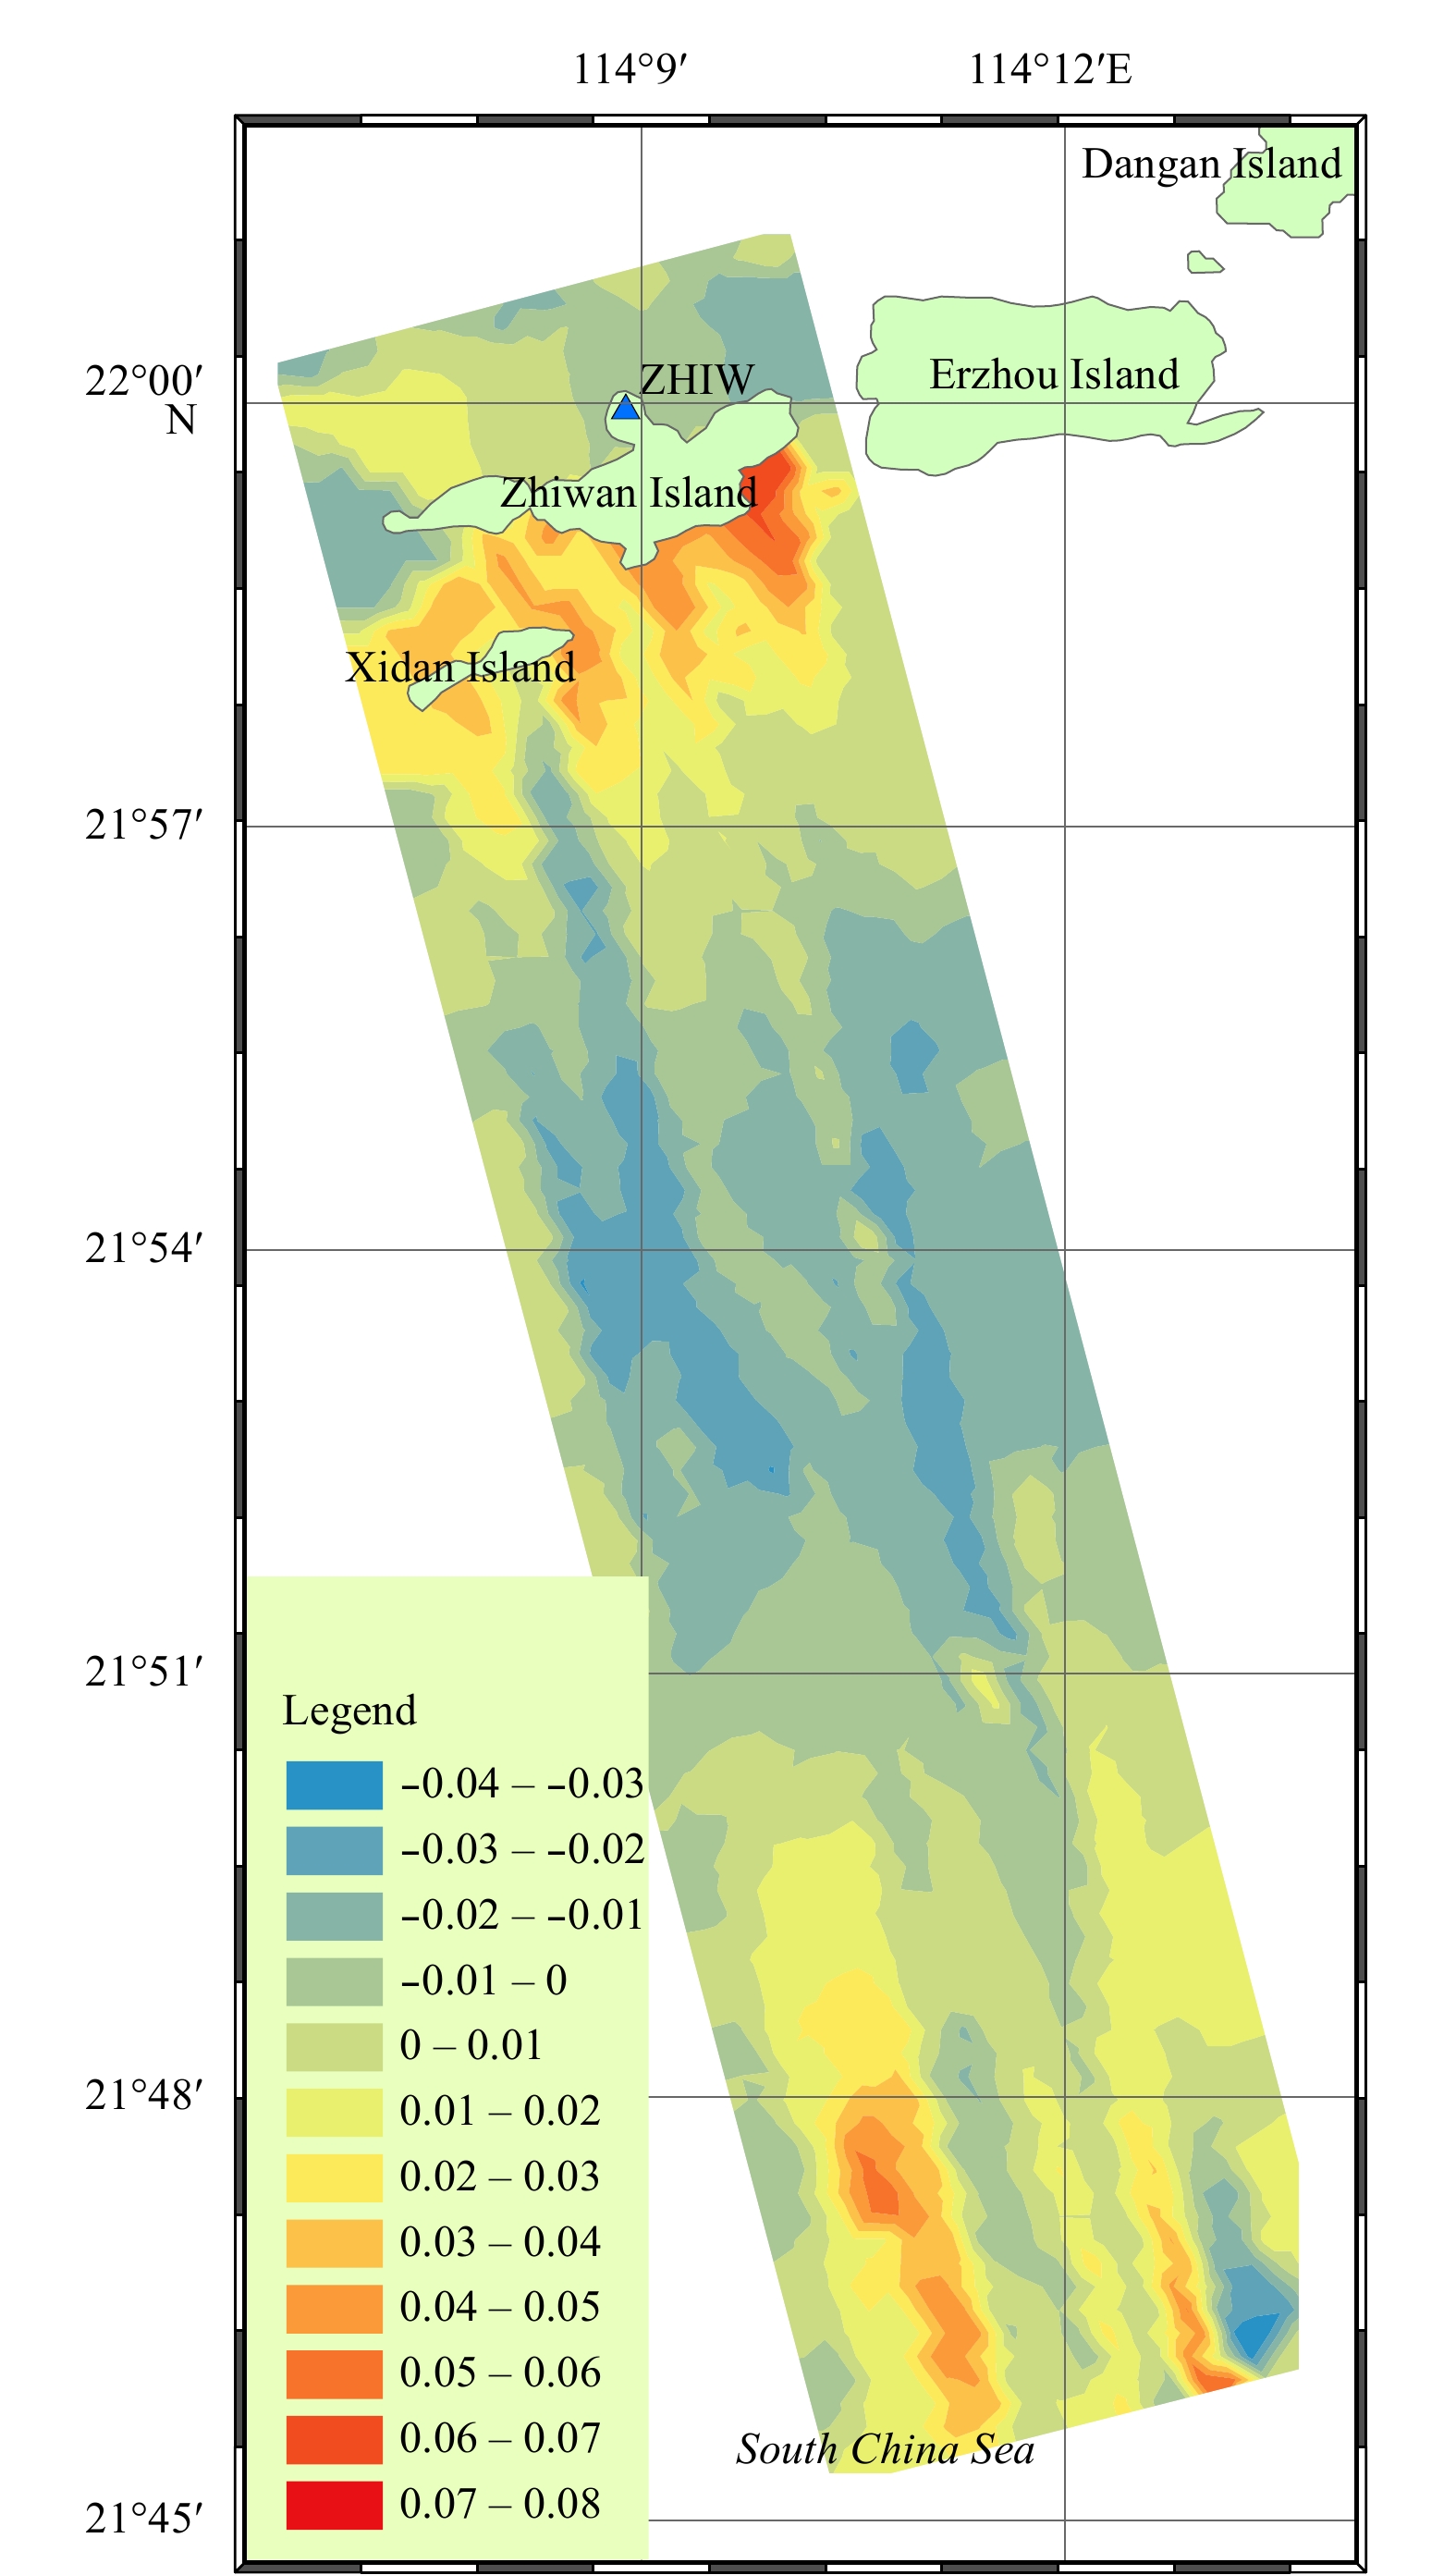
A relative value has been determined by a comparison of the measured sea surface and the CNES_CLS11 MSS (Fig. 12). The relative value was mainly –5–5 cm. The standard bias of the relative value was 1.64 cm compared with the global MSS. Distribution of the relative value deviation is not uniform. This value is very small in the north of Zhiwan Island, as the distance from the reference station to the GPS-TB was very short and the precision was relatively high. The solution in Section 3.1 was also included in the determination of the sea surface. But the relative value increased on the south of Zhiwan Island (about 1 km). This may be caused by the insufficient data for the interpolation, because the ship must keep a distance of at least 300 m away from the Island to ensure the security. The relative value was between ±3 cm when the distance was 3.5–26.0 km south of Zhiwan Island. This value varied a lot at the southernmost end of the research area. This mainly caused by the large distance from the reference station.
Figure
12.
The comparison between the measured sea surface and the CLS11 MSS.
It should be noted that the measured sea surface in our research was determined from the GPS-TB in about 13 days, and did not consider the annual and seasonal changes. Moreover, time variation of these values may be significant due to El Niño or Kuroshio (Pei et al., 2015; Zhang et al., 2015). It was impossible to achieve the local mean sea surface using this technology. The MSS was also influenced by other factors such as the atmosphere pressure, mean dynamic topography, sea surface wind et al. The campaign in this paper need to be done several times, and the accuracy of the local MSS may improve a lot when the HY-2 altimeter data participated in the processing.
5.
Conclusion and discussion
The main purpose of this campaign was to measure the sea surface of Zhiwan Island, and to make a geodetic relationship between the in-situ SSH measurements and the footprint of HY-2 altimeters. The bias observed between the GPS-TB, GPS buoy and tide gauge measurements showed good agreements with each other in relatively fixed positions. This demonstrated that the GPS-TB had a high accuracy in the SSH measurements. About fifteen days of measurements have permitted us to cover a surface of more than 100 km2 with a precision of about 4.14 cm near Zhiwan Island with the support of the GPS reference station and a tide gauge. The slope of the sea surface is about 1.62 cm/km along the HY-2 orbit. The best cut-off angle should be set at 25° in case of the multipath effect and the influence of the wave. Using the check line, we estimated a mean internal agreement on the SSH measurements of –1.5–4.0 cm (with a total standard deviation of 0.2–2.4 cm).
This sea surface will be used in the Cal/Val of altimeters. There are mainly two methods in the determination of the SSH which will be compared with the altimeters, using tide gauge and GPS buoys. A tide gauge usually placed on the land/island. There exists a geoid difference between the tide gauge and the altimeter footprints. So the MSS which combined of the geoid and mean dynamic topography (MDT) is a must in the determination of the SSH at the footprints of the altimeters. When using a GPS buoy, the tethered equipment cannot be right at the altimeter measurement points. A distance of 1 km will cause a sea surface difference of about 1.62 cm as mentioned above, which is a big error for the Cal/Val of altimeters. We can overcome this defect by using the sea surface measured in this campaign. The sea surface determined by this campaign is not sufficient, as it has seasonal and annual changes. The accuracy of altimeter Cal/Val is not sufficient when using a fifteen-days’ of tide measurements. Other factors must be taken into consideration, for instance, currents, wind setup, atmospheric pressure et al. The MSS of this area will be determined by the combination of long-term altimeter data, tide gauge data, GPS buoy/GPS-TB measuring data.
Acknowledgments
We thank the many institutions and academic organizations including Department of Earth Atmospheric and Planetary Sciences in MIT for providing the GAMIT/GLOBK software, the Scripps Orbit and Permanent Array Center for providing the GPS data and the National Astronomical Observatory for providingNAO.99b tidal prediction system. We thank Shengmu Zhou, DebinQin and Xiaolong Chen from Guangdong Sea Star Ocean Sci. andTech. co.,LTD. We also thank the help of all the crews of Runjiang1 ship affiliation to Zhoushan Runhe Marine Science and Technology Development Service Co., Ltd.
Boehm J R, Heinkelmann and Schuh H. 2007. Short note: A global model of pressure and temperature for geodetic applications. Journal of Geodesy, 81: 679–683. doi: 10.1007/s00190-007-0135-3
[2]
Bonnefond P, Exertier P, Laurain O, et al. 2003. Absolute calibration of Jason-1 and TOPEX/Poseidon altimeters in Corsica. Marine Geodesy, 26(3-4): 261–284. doi: 10.1080/714044521
[3]
Bonnefond P, Exertier P, Laurain O, et al. 2013. GPS-based sea level measurements to help the characterization of land contamination in coastal area. Advances in Space Research, 51(8): 1383–1399. doi: 10.1016/j.asr.2012.07.007
[4]
Bouin M N, Ballu V, Calmant S, et al. 2009. A kinematic GPS methodology for sea surface mapping, Vanuatu. Journal of Geodesy, 83(12): 1203–1217. doi: 10.1007/s00190-009-0338-x
[5]
Chen Chuntao, Zhai Wanlin, Yan Longhao, et al. 2014. Assessment of the GPS buoy accuracy for altimeter sea surface height calibration. In: Proceedings of the 2014 IEEE Geoscience and Remote Sensing Symposium. Quebec City, QC, Canada: IEEE, 3101-3104
[6]
Chen Chuntao, Zhu Jianhua, Zhai Wanlin, et al. 2019. Absolute calibration of HY-2A and Jason-2 altimeters for sea surface height using GPS buoy in Qinglan, China. Journal of Oceanology and Limnology, 37(5): 1533–1541. doi: 10.1007/s00343-019-8216-8
Foster J H, Carter G S, Merrifield M A. 2009. Ship-based measurements of sea surface topography. Geophysical Research Letters, 36(11): L11605. doi: 10.1029/2009GL038324
Herring T A, King R W, Floyd M A, et al. 2018. GPS Analysis at MIT Release 10.7. Cambridge: Massachusetts Institute of Technology http://geoweb.mit.edu/gg/Intro_GG.pdf
[11]
Jiang Xingwei, Lin Mingsen, Liu Jianqiang, et al. 2012. The HY-2 satellite and its preliminary assessment. International Journal of Digital Earth, 5(3): 266–281. doi: 10.1080/17538947.2012.658685
[12]
Jiang Xingwei, Lin Mingsen, Song Qingjun. 2016. On the construction of China’s ocean satellite radar altimetry calibration site. Ocean Development and Management (in Chinese), 33(5): 8–15
[13]
Liibusk A, Jürgenson H. 2009. Detecting the Baltic Sea level surface with GPS-measurements and comparing it with the local geoid model. In: Sideris M G, ed. Observing our Changing Earth. Berlin, Heidelberg: Springer, 125–134
[14]
Liu Yalong, Tang Junwu, Zhu Jianhua, et al. 2014. An improved method of absolute calibration to satellite altimeter: A case study in the Yellow Sea, China. Acta Oceanologica Sinica, 33(5): 103–112. doi: 10.1007/s13131-014-0476-8
[15]
Löfgren J S, Haas R, Scherneck H G. 2014. Sea level time series and ocean tide analysis from multipath signals at five GPS sites in different parts of the world. Journal of Geodynamics, 80: 66–80. doi: 10.1016/j.jog.2014.02.012
[16]
Lyard F, Lefevre F, Letellier T, et al. 2006. Modelling the global ocean tides: modern insights from FES2004. Ocean Dynamics, 56(5–6): 394–415. doi: 10.1007/s10236-006-0086-x
[17]
Maqueda M A M, Penna N T, Williams S D P, et al. 2016. Water surface height determination with a GPS wave glider: a demonstration in Loch Ness, Scotland. Journal of Atmospheric and Oceanic Technology, 33(6): 1159–1168. doi: 10.1175/JTECH-D-15-0162.1
[18]
Ménard Y, Jeansou E, Vincent P. 1994. Calibration of the TOPEX/POSEIDON altimeters at Lampedusa: additional results at harvest. Journal of Geophysical Research, 99(C12): 24487–24504. doi: 10.1029/94JC01300
[19]
Pei Yuhua, Zhang Ronghua, Zhang Xiangming, et al. 2015. Variability of sea surface height in the South China Sea and its relationship to Pacific oscillations. Acta Oceanologica Sinica, 34(12): 80–92. doi: 10.1007/s13131-015-0773-x
[20]
Penna N, Maqueda M A M, Martin I, et al. 2018. Sea surface height measurement using a GNSS wave glider. Geophysical Research Letters, 45(11): 5609–5616. doi: 10.1029/2018GL077950
[21]
Saastamoinen J. 1972. Contributions to the theory of atmospheric refraction. Bulletin Géodésique (1946–1975), 105(1): 279–298. doi: 10.1007/BF02521844
[22]
Schaeffer P, Faugére Y, Legeais J F, et al. 2012. The CNES_CLS11 global mean sea surface computed from 16 years of satellite altimeter data. Marine Geodesy, 35(S1): 3–19
[23]
Stewart R H. 2008. Introduction to Physical Oceanography. Texas: Texas A&M University
[24]
Tang Yuxiang, Sun Hongliang, Hu Xiaomin, et al. 2007. GB/T 12763.2-2007 Specifications for oceanographic survey-Part 2: Marine hydrographic observation (in Chinese). Beijing: China Standard Press
[25]
Villiger A, Dach R. 2018. IGS international technical report 2017. Bern: Astronomical Institute, University of Bern
[26]
Watson C, Coleman R, White N, et al. 2003. Absolute Calibration of T/P and Jason-1 Using GPS Buoys in Bass Strait, Australia. Marine Geodesy, 26(3–4): 285–304. doi: 10.1080/714044522
[27]
Watson C, Coleman R, Handsworth R. 2008. Coastal tide gauge calibration: a case study at Macquarie Island using GPS buoy techniques. Journal of Coastal Research, 24(4): 1071–1079
[28]
Watson C, White N, Church J, et al. 2011. Absolute calibration in bass strait, Australia: TOPEX, Jason-1 and OSTM/Jason-2. Marine Geodesy, 34(3–4): 242–260. doi: 10.1080/01490419.2011.584834
[29]
Wu Shilin, Zhang Qi. 2010. Error Analysis and Data Processing (in Chinese). Beijing: Tsinghua University Press, 113–116
[30]
Xu Xiyu, Xu Ke, Shen Hua, et al. 2016. Sea surface height and significant wave height calibration methodology by a GNSS buoy campaign for HY-2A altimeter. IEEE Journal of Selected Topics in Applied Earth Observations and Remote Sensing, 9(11): 5252–5261. doi: 10.1109/JSTARS.2016.2584626
[31]
Yang Lei, Zhou Xinghua, Mertikas S P, et al. 2017. First calibration results of Jason-2 and SARAL/AltiKa satellite altimeters from the Qianli Yan permanent Cal/Val facilities, China. Advances in Space Research, 59(12): 2831–2842. doi: 10.1016/j.asr.2017.02.044
[32]
Zhai Wanlin, Chen Chuntao, Zhu Jianhua, et al. 2016. Research of calibration of satellite altimeter technology based on GPS Bouy. Remote Sensing Technology and Application (in Chinese), 31(5): 925–929
[33]
Zhang Xiaoshuang, Wang Xidong, Cao Yingzhi, et al. 2015. Climate modulation on sea surface height in China seas. Chinese Journal of Oceanology and Limnology, 33(5): 1245–1255. doi: 10.1007/s00343-015-4120-z
Wanlin Zhai, Jianhua Zhu, Hailong Peng, et al. Altimeter Calibrations in the Preliminary Four Years’ Operation of Wanshan Calibration Site. Remote Sensing, 2024, 16(6): 1087. doi:10.3390/rs16061087
2.
Sotiris Lycourghiotis, Foteini Kariotou. Τhe “GPS/GNSS on Boat” Technique for the Determination of the Sea Surface Topography and Geoid: A Critical Review. Coasts, 2022, 2(4): 323. doi:10.3390/coasts2040016
3.
Wanlin Zhai, Jianhua Zhu, Xiaohui Fan, et al. Preliminary calibration results for Jason-3 and Sentinel-3 altimeters in the Wanshan Islands. Journal of Oceanology and Limnology, 2021, 39(2): 458. doi:10.1007/s00343-020-9251-1
4.
Chuntao Chen, Jianhua Zhu, Chaofei Ma, et al. Preliminary calibration results of the HY-2B altimeter’s SSH at China’s Wanshan calibration site. Acta Oceanologica Sinica, 2021, 40(5): 129. doi:10.1007/s13131-021-1745-y
5.
Zhai Wanlin, Zhu Jianhua, Sang Wengang, et al. Calibration of Sentinel-3A Altimeter in Dan'Gan Island, China. IGARSS 2022 - 2022 IEEE International Geoscience and Remote Sensing Symposium, doi:10.1109/IGARSS46834.2022.9883805
6.
Zhai Wanlin, Zhu Jianhua. Validation of JASON-3 Altimeter Using Tide Gauges Around North America. IGARSS 2020 - 2020 IEEE International Geoscience and Remote Sensing Symposium, doi:10.1109/IGARSS39084.2020.9323865
Figure 1. Research area. The GPS buoy is moored at the two circular points to evaluate the precision of the GPS-TB and the gradient of the sea surface. Three GPS reference stations (triangular points) have been placed at Wailingding Island (WLDD), Zhiwan Island (ZHIW) and Dangan Island (DANG), with a tide gauge at the port of the Zhiwan Island. The moorea blue, green, heliotrope and dark amethyst lines represent the altimeterfootprint of ERS, ENVISAT, Sentinel-3A, T/P and Jason-1/2/3, respectively.
Figure 2. GPS reference station installed in Zhiwan Island, and a solar cell for power supply.
Figure 3. The GPS towing-body used in this campaign.
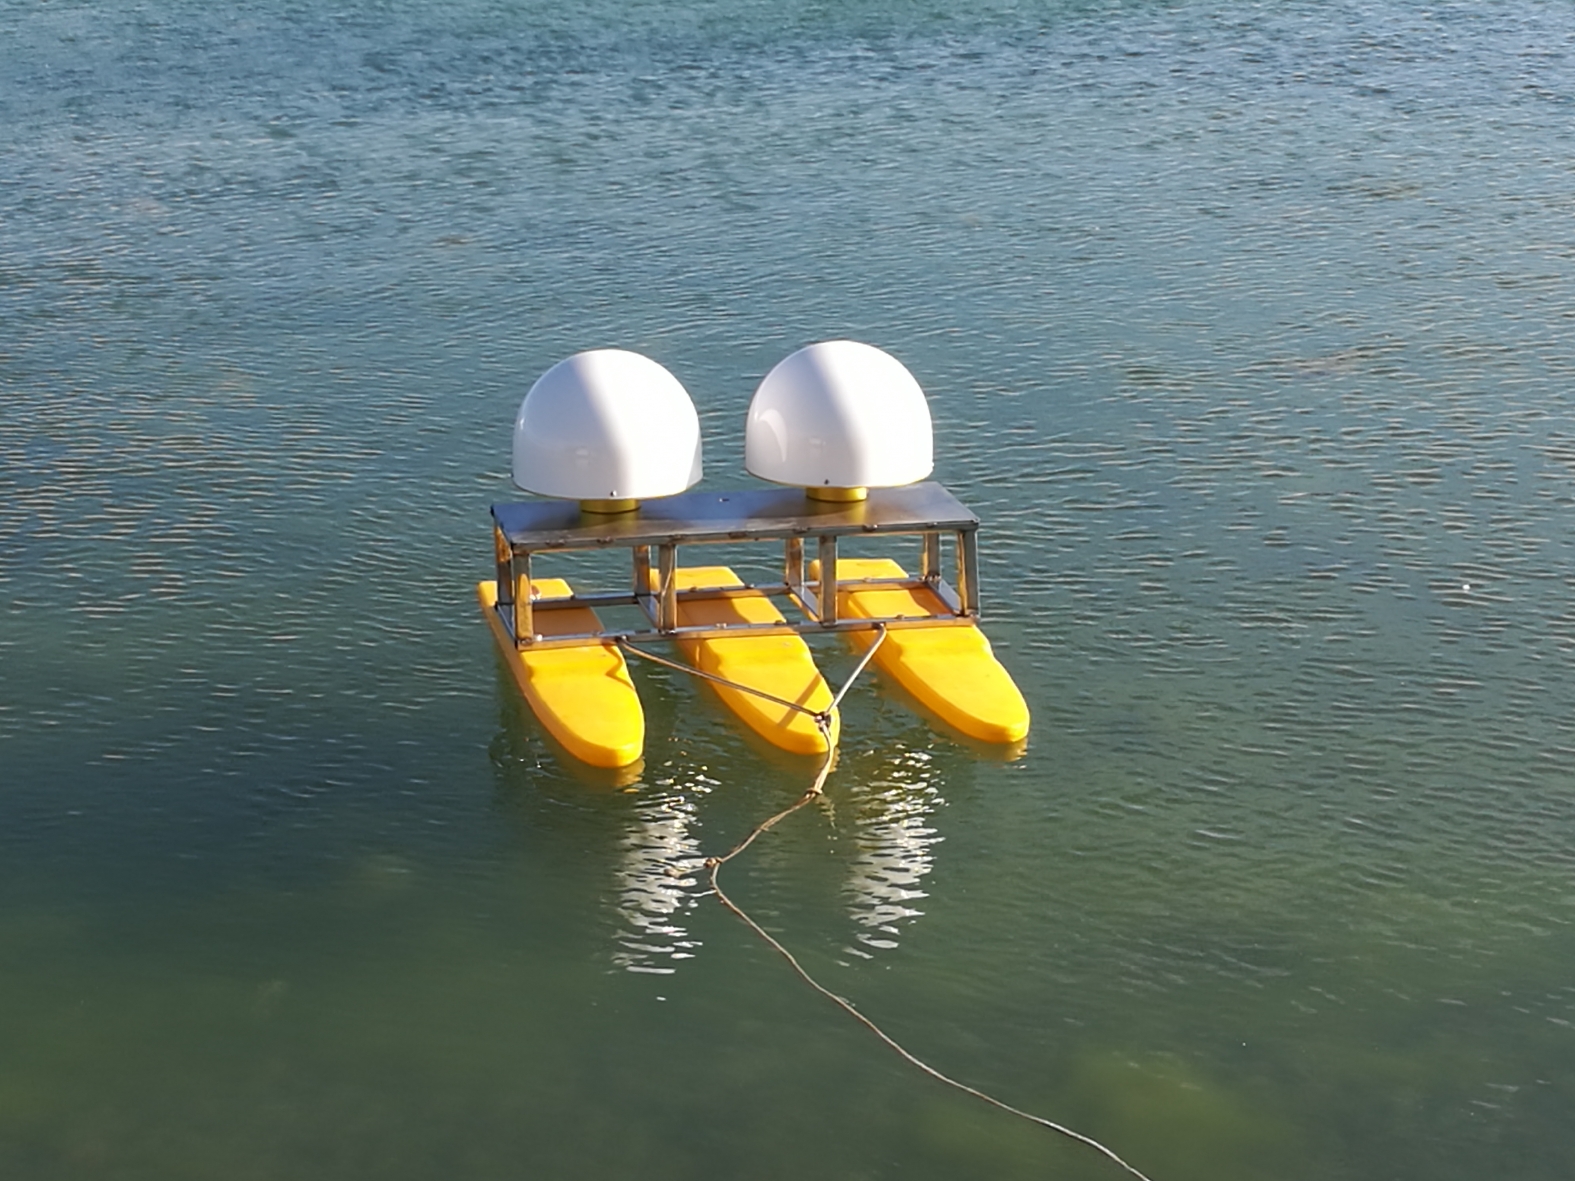
Figure 4. The GPS buoy dedicated by NOTC.
Figure 5. RBR tide gauge. The tide gauge is fixed by stainless steel tube to ensure the vertical of tide gauge.
Figure 6. Comparison of tide gauge, GPS buoy and GPS-TB. a–c. The comparison at the port of the Zhiwan Island: GPS-TB minus GPS-buoy (a), GPS-TB minus tide gauge (b), GPS-buoy minus tide gauge (c); e–g. The comparison about 26 km south of the island: GPS-TB minus GPS-buoy (d), GPS-TB minus tide gauge (e), GPS buoy minus tide gauge (f).
Figure 7. Quality control of the GPS-TB data. The y-axis was the MP1 (a), MP2 (b), SNR (c) and the ratio of complete to possible observations (d) of all the measuring lines.
Figure 8. GPS data quality of one of the measuring lines. The y-axis was the SNR (a), MP1 (b) and MP2 (c) of PG10.
Figure 9. Sea surface measured by GPS-TB. The sea surface data between purplish red and green lines have a sudden change which was consistent with the situation appearing in Fig. 6. The data pointed by the black arrow represented a deficiency of GPS signals.
Figure 10. Map of SSH (m) measured by the GPS-TB.
Figure 11. The error of interpolated sea surface checked by the checking line. The y-axis represented the distance between the GPS-TB and the reference station. The x-axis represented the bias of the measuring SSH minus the check line. The blue line represented the data averaged by distance interval of 0.5 km. The green and cyan points represented the bias of check line vs the interpolated sea surface when sailing against and along the waves.
Figure 12. The comparison between the measured sea surface and the CLS11 MSS.


 DownLoad:

 DownLoad: