Jing Wu, Yuexia Zhou, Xiaofei Liu, Yuan Cao, Chengjin Hu, Yingjian Chen. Extension and application of a database for the rapid identification of Vibrio using MALDI-TOF MS[J]. Acta Oceanologica Sinica, 2020, 39(10): 140-146. doi: 10.1007/s13131-020-1635-8
Citation:
Jing Wu, Yuexia Zhou, Xiaofei Liu, Yuan Cao, Chengjin Hu, Yingjian Chen. Extension and application of a database for the rapid identification of Vibrio using MALDI-TOF MS[J]. Acta Oceanologica Sinica, 2020, 39(10): 140-146. doi: 10.1007/s13131-020-1635-8
Jing Wu, Yuexia Zhou, Xiaofei Liu, Yuan Cao, Chengjin Hu, Yingjian Chen. Extension and application of a database for the rapid identification of Vibrio using MALDI-TOF MS[J]. Acta Oceanologica Sinica, 2020, 39(10): 140-146. doi: 10.1007/s13131-020-1635-8
Citation:
Jing Wu, Yuexia Zhou, Xiaofei Liu, Yuan Cao, Chengjin Hu, Yingjian Chen. Extension and application of a database for the rapid identification of Vibrio using MALDI-TOF MS[J]. Acta Oceanologica Sinica, 2020, 39(10): 140-146. doi: 10.1007/s13131-020-1635-8
Rapid and accurate identification of Vibrio species has been problematic because phenotypic characteristics are variable within species and biochemical identification requires two or more days to complete. Matrix-assisted laser desorption ionization–time of flight mass spectrometry (MALDI-TOF MS) has become a powerful tool for rapidly distinguishing between related bacterial species. However, its accuracy depends on the number of strains in a database. In the current study, we extend and apply the Vibrio database based on MALDI-TOF MS. A total of 74 strains of Vibrio representing 28 species were identified and included in new database. A phylogenetic tree based on rpoB sequence and dendrograms were constructed. We analyzed 30 clinical Vibrio of three species to evaluate the new database and carried out PCA dendrogram analyses for differences of strains. We created a new database that offered fast and accurate Vibrio identification. MSP and PCA dendrogram analyses provided technical support to track sources and incidences of Vibrio infection. In addition, the discovery of characteristic and differential peaks is useful for the future identification of Vibrio. This represents a powerful tool for the rapid and accurate classification and identification of Vibrio and closely related species.
Vibrio, one of the most common Gram-negative bacteria in the marine environment, is widely distributed on body surfaces, in the intestinal tracts of marine organisms and in seawater (Kaneko and Colwell, 1974). More than 20 Vibrio species infect fish or humans, causing serious diseases (Tiruvayipati and Bhassu, 2016; Cheng et al., 2015). For instance, V. vulnificus, V. parahaemolyticus, V. fluvialis and V. alginolyticus reportedly cause severe gastroenteritis, severe skin-soft tissue infections, septicemia, and other serious infections, particularly in immunocompromised hosts (Cheng et al., 2015). At present, methods to identify Vibrio are primarily based on microscopy and biochemical tests, which are time and labor-intensive as well as subjective, making it difficult to rapidly diagnose these pathogenic bacteria. Therefore, it is imperative to identify a rapid and reliable identification method for Vibrio.
Matrix-assisted laser desorption ionization–time of flight mass spectrometry (MALDI-TOF MS), a promising technique for the rapid identification of microorganisms that has been developed in the past 20 years (Singhal et al., 2015), is rapid, accurate and reproducible. According to previous studies (Sogawa et al., 2012), MS is able to identify species, quantities, and strain separation in a given database. However, its accuracy depends on the number of strains in a database. The current BiotyperTM database (Version 3.3.1.0) (claimed by Brucker manufacturer) contains only 78 Vibrio belonging to 52 species, even some species contain only one strain, making it difficult to accurately identify Vibrio. Augmentation of the original MALDI BiotyperTM database (Version 3.3.1.0) via the incorporation of mass spectra obtained in-house from environmental and clinical isolates may increase the identification rate at the species level.
In the present study, we augmented the BiotyperTM database and evaluated the ability of a supplementary database to facilitate the taxonomic identification of Vibrio. We constructed phylogenetic trees based on MALDI-TOF MS and rpoB sequences and compared the resolution power of these two methods. The comparison of peptide protein fingerprints revealed characteristic peaks at both the genus and species levels. Additionally, for closely related species, we analyzed differences in protein peaks between environmental strains and clinical isolates.
2.
Materials and methods
2.1
Strains and cultivation
Strains were obtained from the Marine Culture Collection of China (MCCC) (Shao, 2010) and were isolated from seawater, plankton and marine animals and plants. The strains were mainly collected from some countries in the Pacific Rim, such as the USA, Japan, Australia and some areas of China (detailed information of strains see Supplementary Information). All strains were grown on 2216E medium (made in the BD company in the USA) or TCBS (Thiosulfate citrate bile salts sucrose agar) medium (configured by our own laboratory) overnight at 28°C.
2.2
RpoB sequence analysis for species identification
The strains were first verified by sequencing. We designed primers based on a conserved sequence of the VibriorpoB gene. The primers sequence and amplification conditions are not disclosed due to a patent application. PCR products were sequenced at the Invitrogen Trading (Shanghai) Co. Sequences were compared using the BLAST program from the National Center for Biotechnology Information (NCBI) (http://www.ncbi.nlm.nih.gov/BLAST).
2.3
MALDI-TOF MS
Strains were grown on appropriate culture medium at 28°C overnight. A series of standard operating methods for MALDI-TOF MS analysis were performed as previously described (Hazen et al., 2009). In brief, we first prepared samples via the formic acid method. Then, using FlexControl 3.4, we automatically acquired mass spectra in linear positive mode. Next, we excluded low-quality spectra using FlexAnalysis 3.4 software. Finally, the spectra for each strain were summarized and processed using BiotyperTM software 3.1 to generate main spectra (MSP), each containing the 30–70 most prominent peaks derived from single spectra. We edited the name, location and the node for each MSP.
2.4
Vibrio database evaluation
Vibrio parahaemolyticus (10 strains), V. alginolyticus (10 strains), and V. harveyi (10 strains) from Weihai Municipal Hospital were used to evaluate the newly created marine microorganism database and the Bruker Biotyper database. The results of this assessment were expressed as one of the following log scores (Calderaro et al., 2014): highly probable species identification (>2.3), probable species identification (2.0–2.3), reliable genus identification (1.7–2.0) and unreliable identification (<1.7). In addition, in order to better evaluate the accuracy of mass spectrometry database identification, we also performed biochemical identification and rpoB sequencing.
2.5
Data analysis
The sequences of rpoB fragments (800 bp) were used to construct simultaneously a neighbor-joining (NJ) phylogenetic tree and a maximum likelihood (ML) phylogenetic tree with MEGA6.0 software. MSP dendrograms were constructed based on our own expanded database, and principal component analysis (PCA) dendrograms was performed using MALDI Biotyper 3.1 database. Mass data files were processed with baseline correction, Gaussian smoothing and peak finding using FlexAnalysis 3.4. The processed spectra results were overlaid, outliers were deleted from the data set, and we selected characteristic peaks from each overlapping set of spectra for analysis.
3.
Results
3.1
Vibrio database augmentation and development
PCR amplification products of 83 strains were sequenced in our study. Among them, rpoB sequence results from 74 strains were available and included in the new database. As shown in Table 1, the numbers of certain strains, such as V. alginolyticus,V. chagasii, V. damsela, V. parahaemolyticus and V. harveyi, in the newly created database were more numerous than in the Biotyper database, which demonstrated the obvious advantages of the new database and its extension of the MALDI Biotyper database.
Table
1.
Numbers of strains filed in the MALDI Biotyper database and the newly created marine Vibrio database
Species
Newly created database
MALDI Biotyper database
Species
Newly created database
MALDI Biotyper database
Vibrio anguillaeum
1
7
Vibrio mimicus
1
1
Vibrio aerogenes
0
1
Vibrio mytili
0
1
Vibrio aestuarianus
1
1
Vibrio marisflavi
1
0
Vibrio agarivorans
0
1
Vibrio natriegens
1
1
Vibrio albensis
0
1
Vibrio navarrensis
0
1
Vibrio alginolyticus
8
4
Vibrio neptunius
0
1
Vibrio brasiliensis
0
1
Vibrio nereis
1
1
Vibrio campbellii
2
1
Vibrio nigripulchritudo
0
1
Vibrio chagasii
5
1
Vibrio ordalii
0
1
Vibrio carchariae
1
0
Vibrio orientalis
1
1
Vibrio cincinnatiensis
0
1
Vibrio pacinii
0
1
Vibrio coralliilyticus
0
1
Vibrio parahaemolyticus
12
8
Vibrio cyclitrophicus
0
1
Vibrio pectenicida
0
2
Vibrio diazotrophicus
1
2
Vibrio penaeicida
0
1
Vibrio damsela
6
5
Vibrio pomeroyi
0
1
Vibrio ezurae
0
1
Vibrio ponticus
0
1
Vibrio fischeri
1
3
Vibrio pelagia
1
0
Vibrio fluvialis
1
3
Vibrio proteolyticus
1
1
Vibrio fortis
1
1
Vibrio rotiferianus
1
1
Vibrio furnissii
1
2
Vibrio ruber
0
1
Vibrio gazogenes
1
1
Vibrio rumoiensis
0
1
Vibrio gigantis
0
1
Vibrio scophthalmi
0
2
Vibrio harveyi
25
4
Vibrio shilonii
0
1
Vibrio hispanicus
0
1
Vibrio splendidus
0
1
Vibrio ichthyoenteri
1
2
Vibrio superstes
0
1
Vibrio kanaloae
0
1
Vibrio tasmaniensis
0
1
Vibrio lentus
0
1
Vibrio tubiashii
1
0
Vibrio mediterranei
1
1
Vibrio vulnificus
1
5
Vibrio metschnikovii
0
2
Vibrio xuii
1
1
Note: Strains found in the newly created database are in bold.
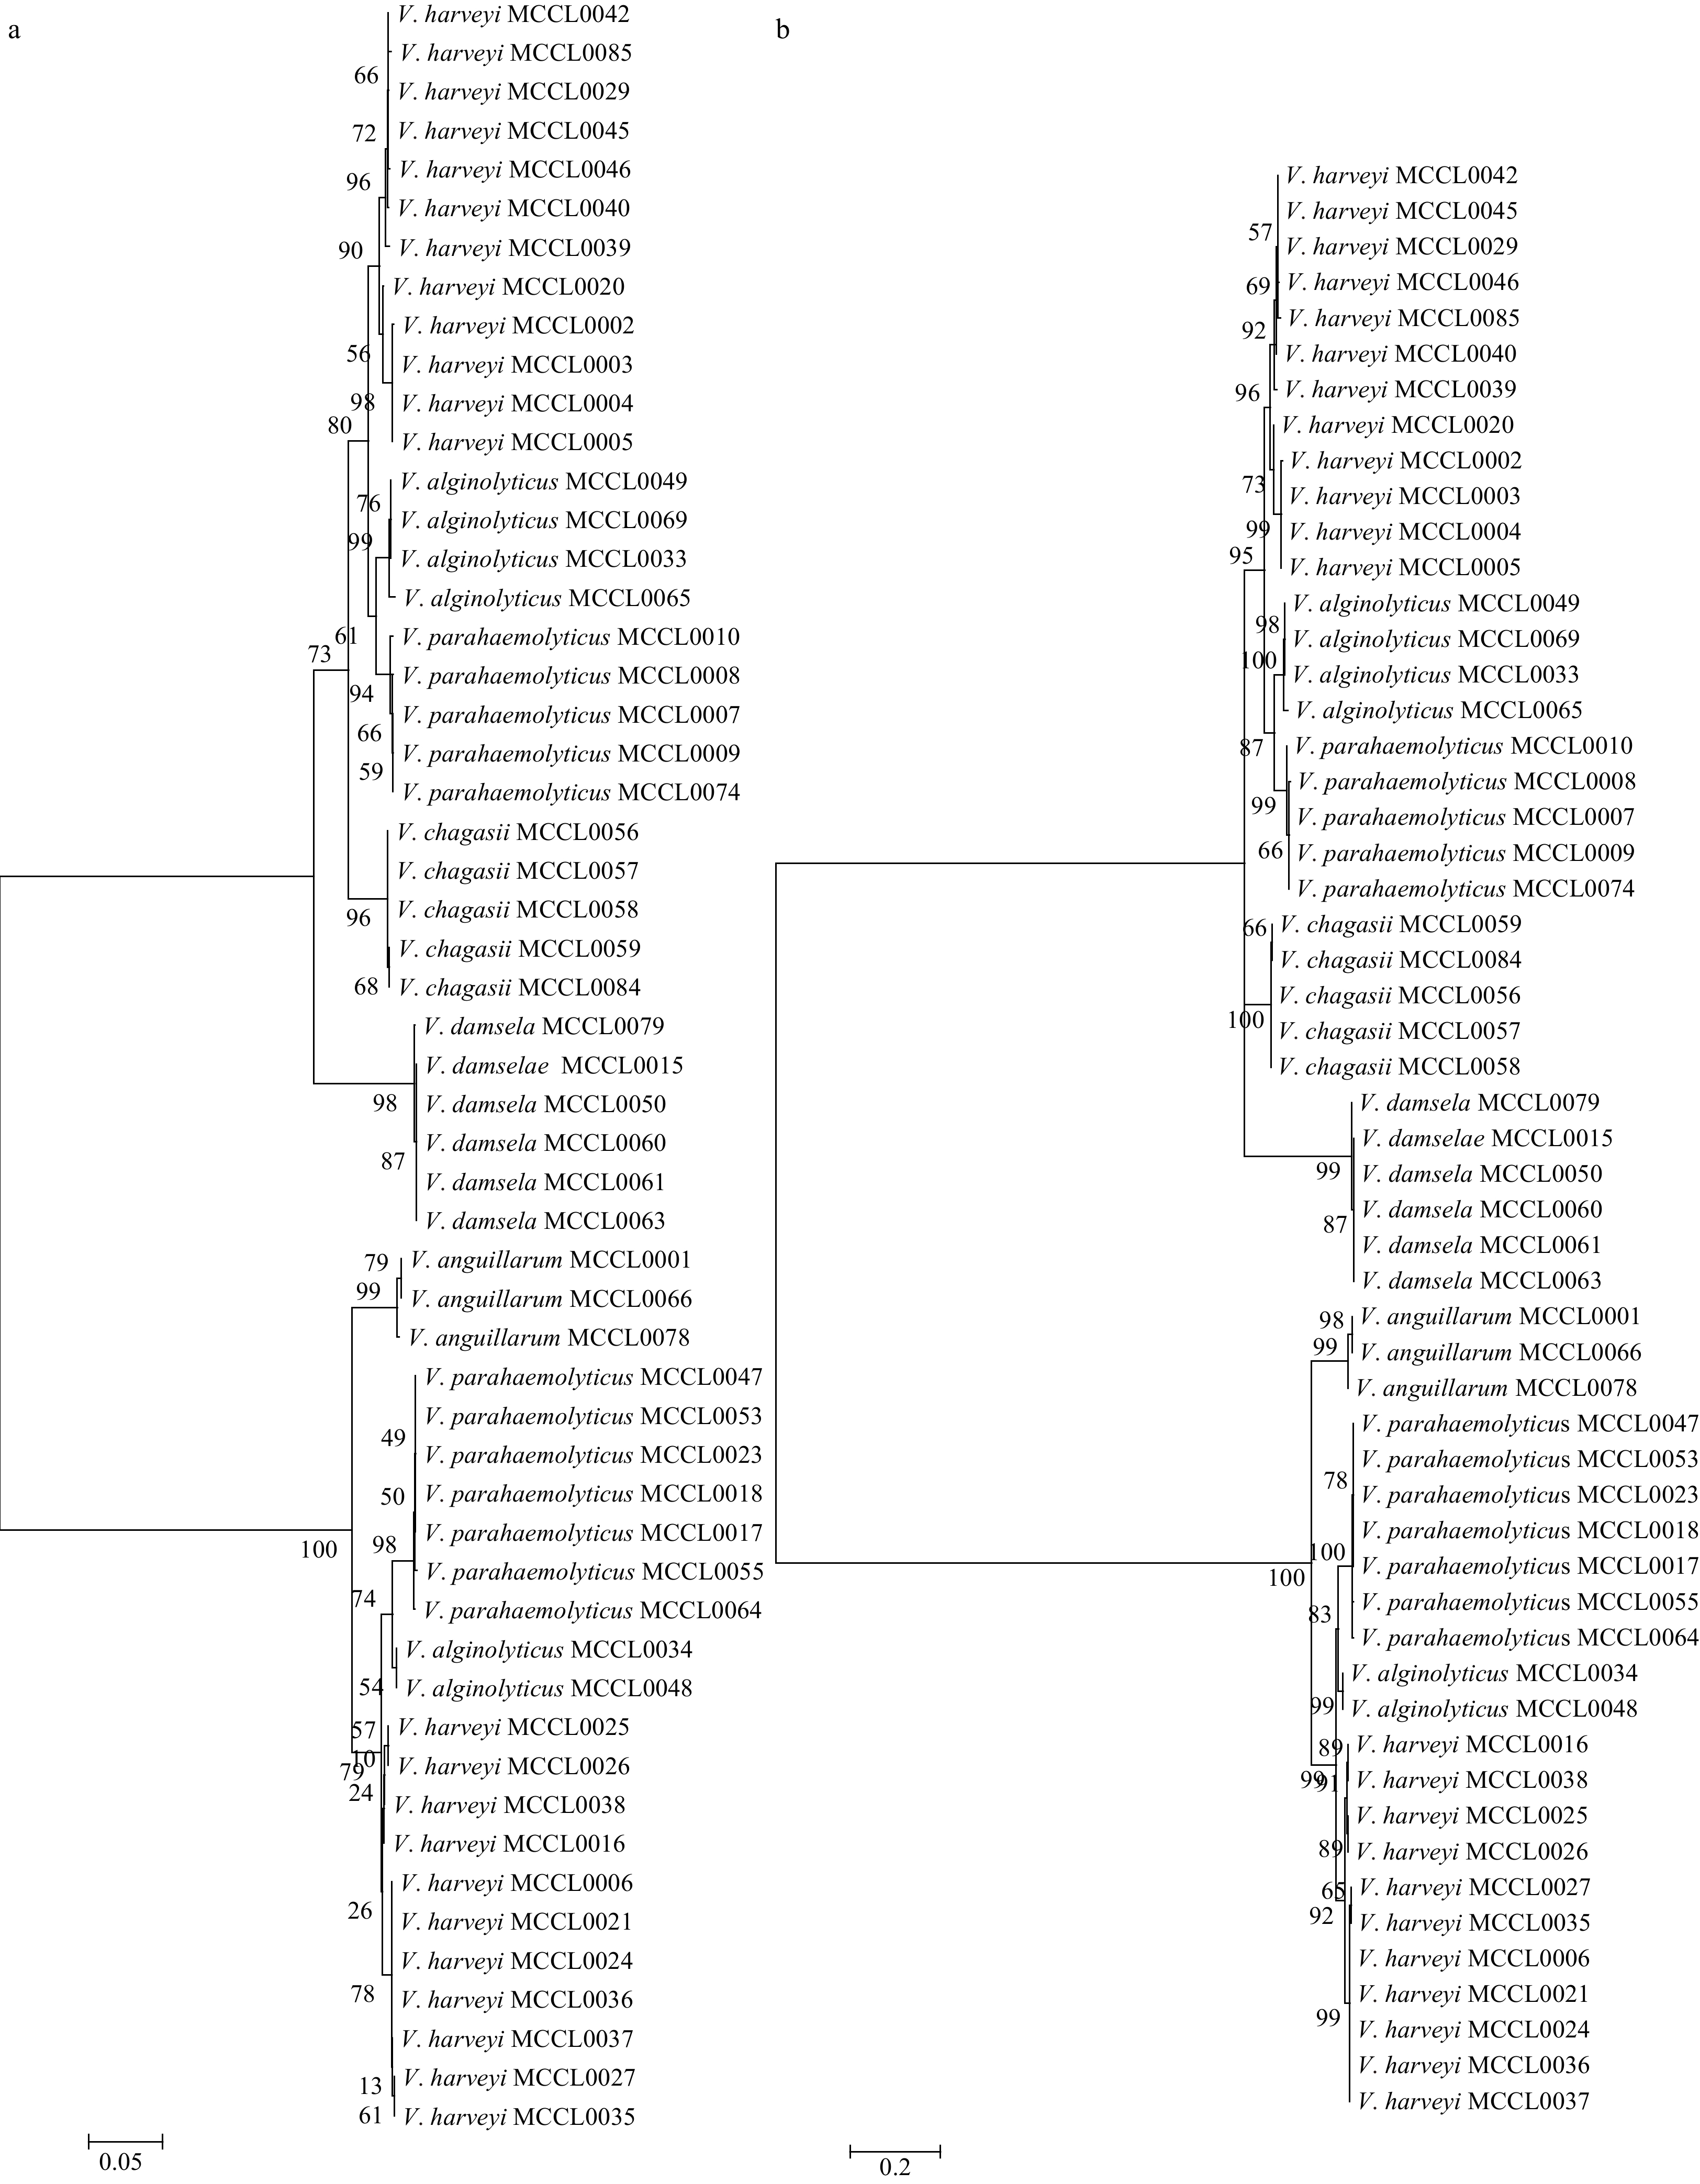
The rpoB phylogenetic tree is shown in Fig. 1. Among 74 Vibrio, 60% were classified as V. parahaemolyticus, V. harveyi and V. alginolyticus. For V. furnissii, V. diazotrophicus, V. mimicus and so on, they are not meaningful to analyze considering their quantity and clinical significance. Therefore, these strains were not included in the evolutionary tree. Figures 1a and b reveal clear species assignments for V. anguillarum, V. damsel and V. chagasii, while such assignments were not made for other isolates. For example, the 12 strains of V. parahaemolyticus included here were not separated from the other strains but were divided into two groups, as were 6 strains of V. alginolyticus and 23 strains of V. harveyi. Additionally, three species originated at a branch and crossed connection. As shown in Figs 1a and b, the phylogenetic trees constructed by the two methods are very similar. Therefore, it is very reliable for the rpoB phylogenetic tree we constructed.
Figure
1.
The neighbor-joining (NJ) phylogenetic tree for Vibrio based on rpoB sequences (a) and the maximum likelihood (ML) phylogenetic tree for Vibrio based on rpoB sequences (b). a. The robustness of the branching is indicated by bootstrap values calculated for 1000 subsets. Bar: 0.05% sequence divergence. b. The robustness of the branching is indicated by bootstrap values calculated for 1 000 subsets. Bar: 0.2% sequence divergence. The tree was constructed using MEGA6.0 based on 55 sequences (approximately 870 bp in length), including 16 type strain sequences. The 55 sequences comprise V. alginolyticus (6), V. harveyi (23), V. parahaemolyticus (12), V. damsel (6), V. chagasii (5), and V. anguillarum (3).
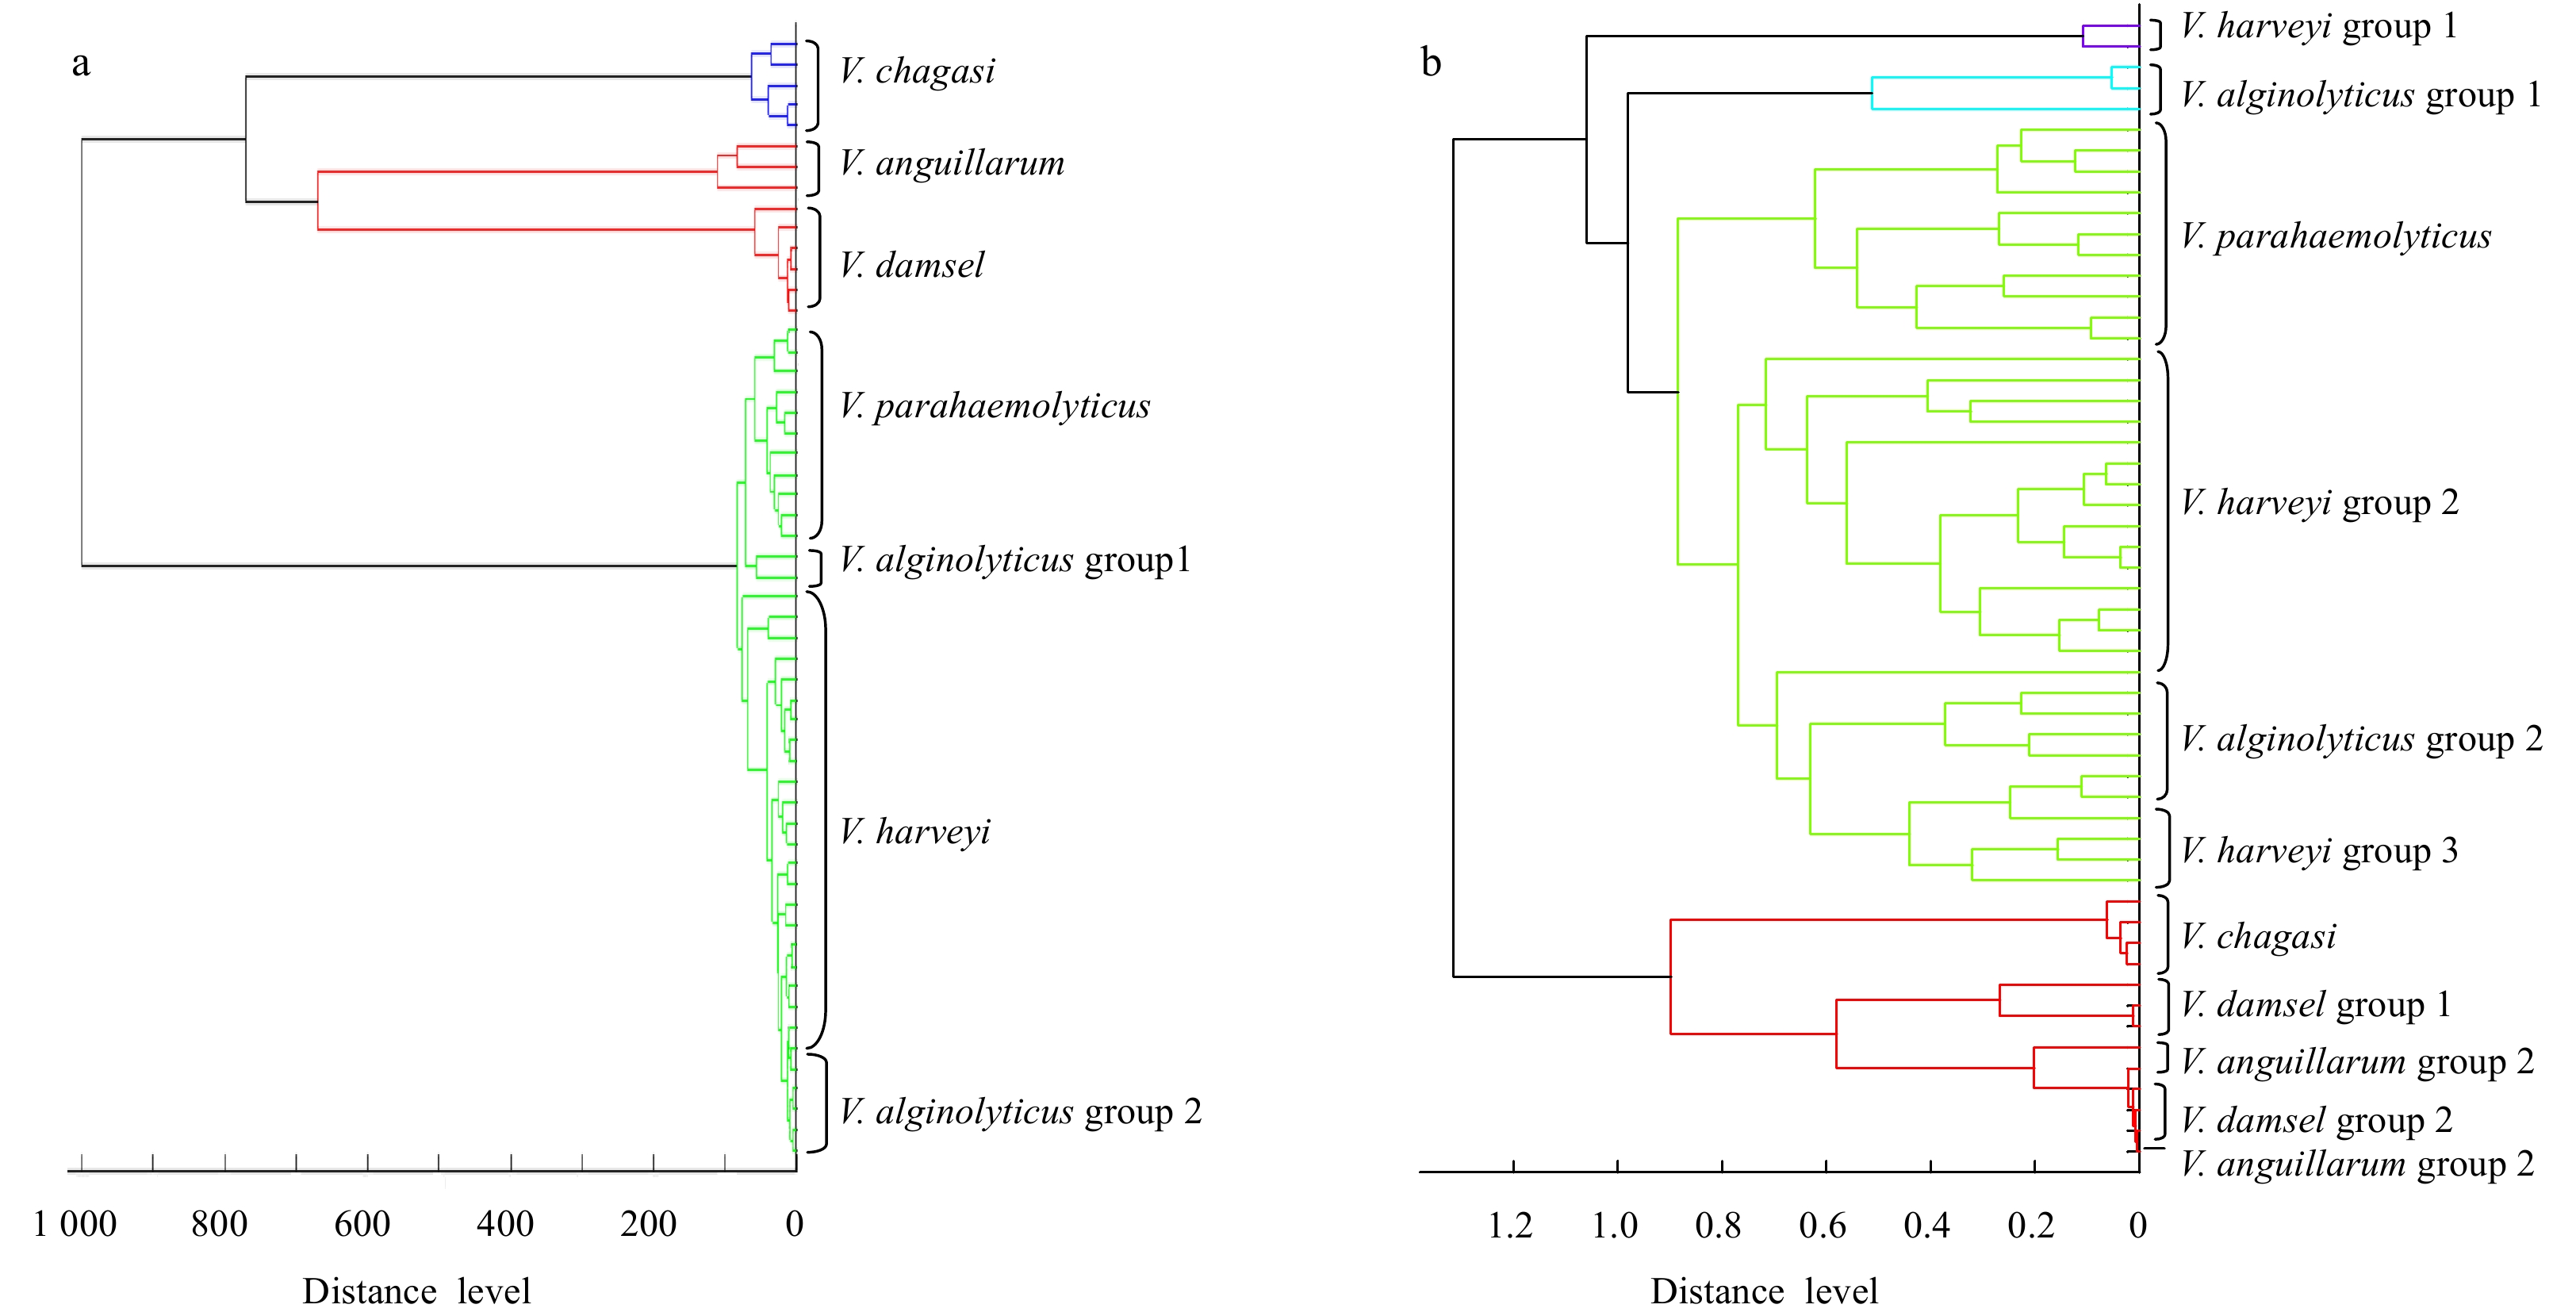
Consistent with the rpoB phylogenetic tree, we selected the same strains for clustering based on MALDI-TOF MS. We constructed the main spectrum projection (MSP) dendrograms based on the expanded Database. To show the difference, we also constructed the principal component analysis (PCA) dendrograms based on MALDI Biotyper 3.1 Database. As shown in Fig. 2a, the tree divided into two branches at a distance level of 800, with one branch containing V. damsel, V. chagasii, and V. anguillarum and another branch containing V. alginolyticu, V. harveyi, and V. parahaemolyticus. At a distance level of 700, V. damsel and V. chagasii formed two separate branches. Independent branches were formed for V. alginolyticu, V. harveyi and V. parahaemolyticus at a distance of 100. Thus, the phylogenetic relationships among V. alginolyticu, V. harveyi, and V. parahaemolyticus are closer than those among V. damsel, V. chagasii, and V. anguillarum, which is consistent with previous reports (9, 10). Three strains of V. chagasii originated from Greece and belonged to a single branch. For V. damsela, one group originated from healthy Chinese shrimp, Japan larva viscera, and Australian Bacon curing brine. Another group containing 1 strain originated from damsel fish obtained in the USA. Six strains of V. alginolyticus were divided into 2 groups, of which 4 strains were isolated from healthy shrimp intestines on shrimp farms in Jimo and Changyi, China, and the remaining 2 grouped strains were isolated from spoiled horse mackerel causing food poisoning in Japan. Strains with close geographical locations were included in one group. We will confirm the geographical distribution by increasing the number of strains in future studies.
Figure
2.
The main spectrum projection (MSP) dendrograms based on the expanded database (a) and the principal component analysis (PCA) dendrograms based on MALDI Biotyper 3.1 database (b). We analyzed 55 strains, including V. alginolyticus (6), V. harveyi (23), V. parahaemolyticus (12), V. damsela (6), V. chagasii (5), and V. anguillarum (3). Detailed information of strains is shown in Supplementary Information.
As shown in Fig. 2b, the tree is also divided into two branches, one containing V. alginolyticu, V. harveyi and V. parahaemolyticus, the other containing V. damsel, V. chagasii, and V. anguillarum. However, obviously, except for V. parahaemolyticus, other bacteria are cross-distributed and not well separated.
3.4
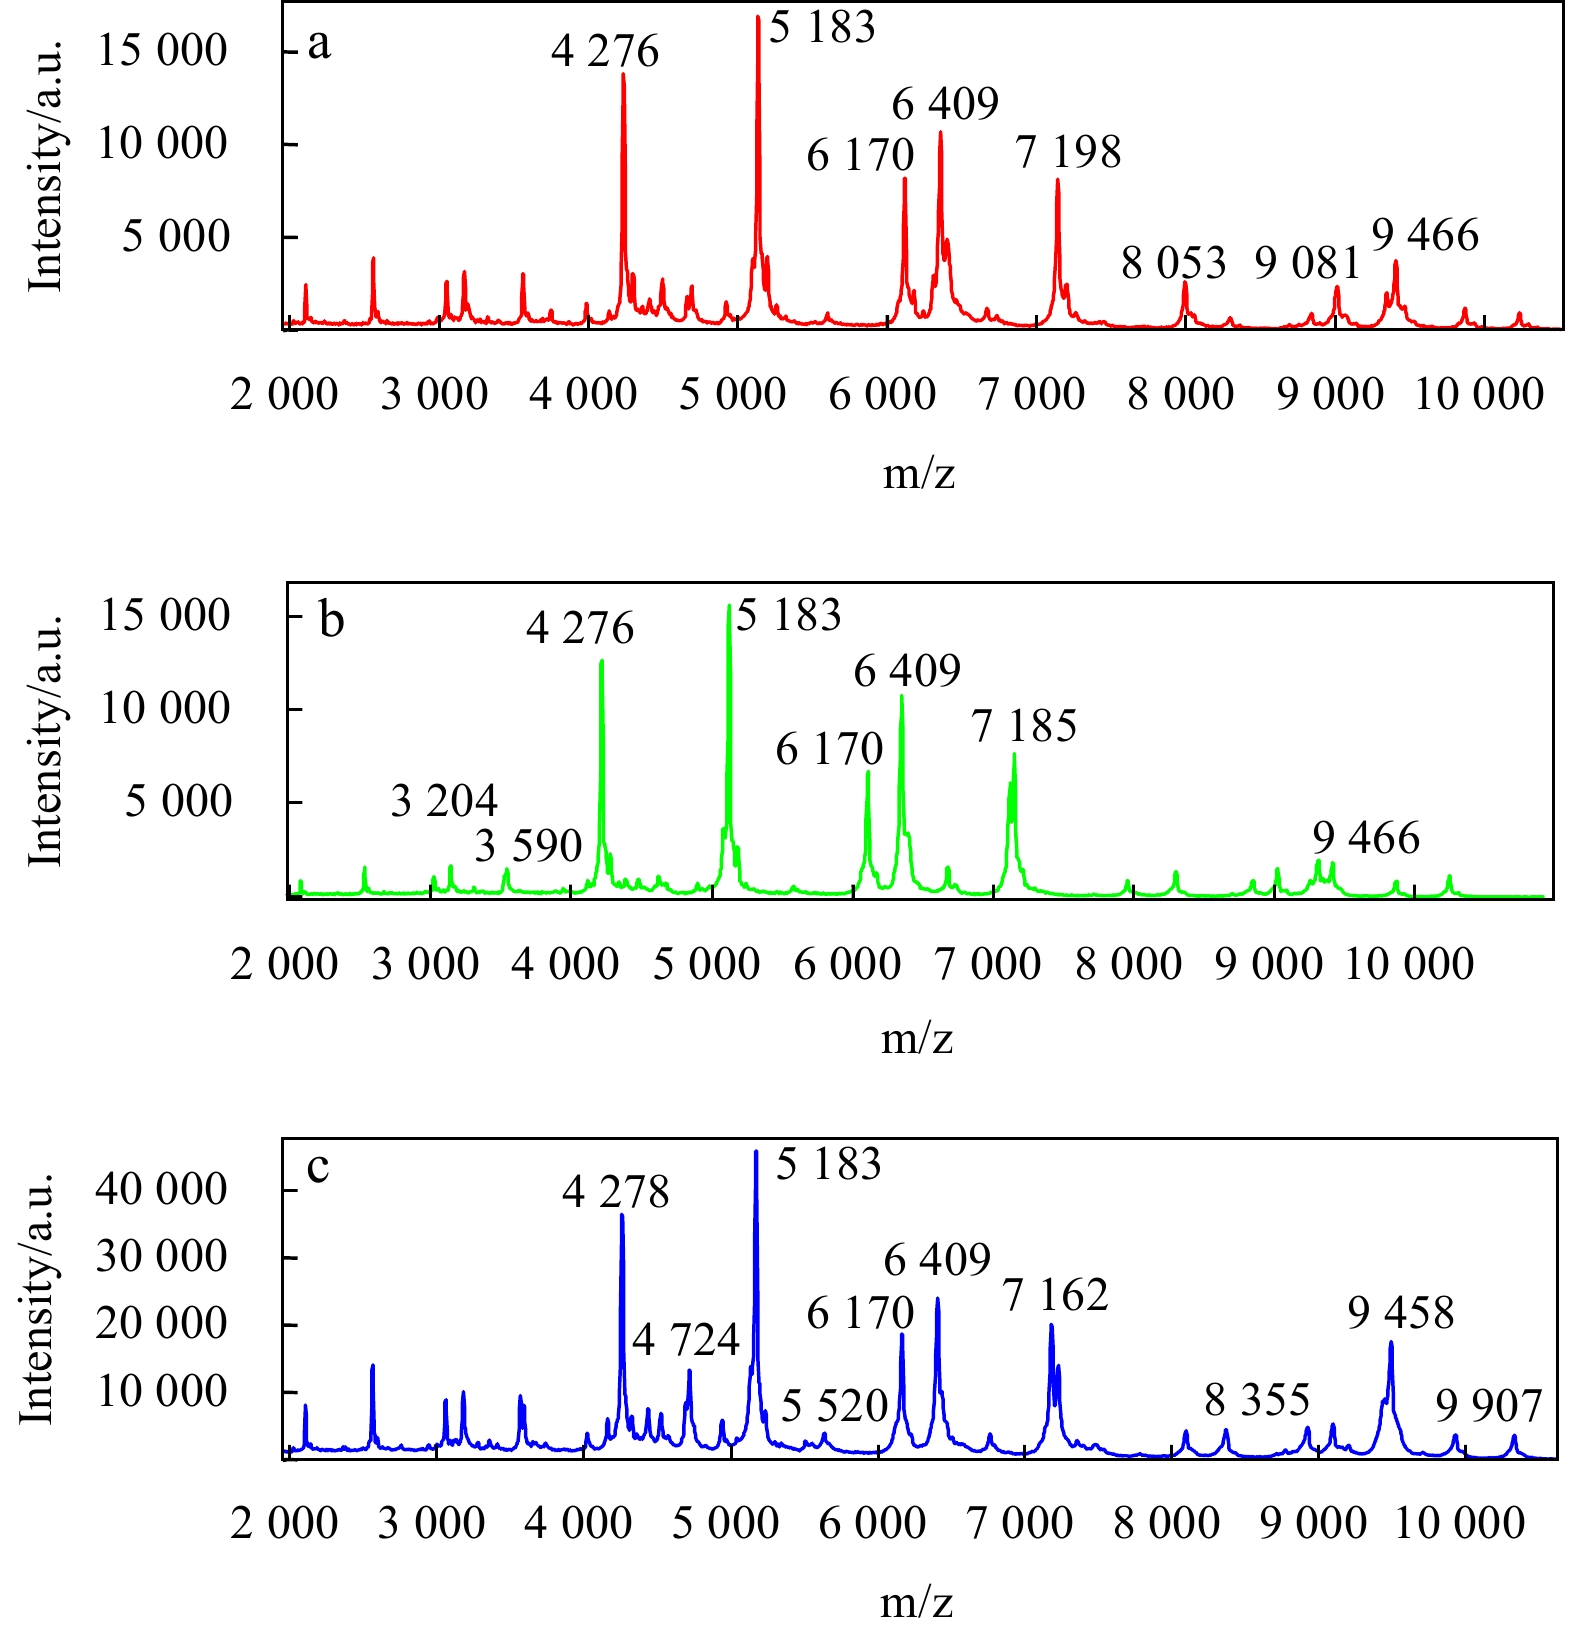
Characteristic peaks at the genus and species levels
Bacterial species are identifiable based on their unique protein profile determined with MALDI-TOF MS (Kaleta et al., 2011; Fagerquist et al., 2010; Seng et al., 2009). After obtaining MS data for the isolates in our database followed by analysis using FlexAnalysis 3.4 software, we observed high similarities at the protein level (Fig. 3). We then speculated that some protein peaks are representative at both the genus and species levels. In our study, there were a total of 70 peaks representing between 2 000 and 20 000 Da collected for every strain. As shown in Fig. 3, according to FlexAnalysis software, three species showed that they contain major peaks with similar m/z values and relative intensities. The composition of the species affects the number of peaks. Further statistical analysis indicated the presence of the 4 276 m/z peak in all species of Vibrio in our study. The 5 183, 6 170, and 6 409 m/z peaks were mainly present in V. alginolyticus, V. harveyi, and V. parahaemolyticus and were not often present in V. damsel, V. chagasii, and V. anguillarum. Similar spectral peaks were generated for V. alginolyticus, V. harveyi, and V. parahaemolyticus, thus confirming the high homology of the three species. We next speculated that these peaks may also reflect Vibrio characteristics to a certain extent at the genus level, while some peaks may even reflect different Vibrio at the species level. The protein mass fingerprints of 33 V. harveyi strains, 22 V. parahaemolyticus strains and 16 V. alginolyticus were compared, and their MSPs were analyzed for each species.
Figure
3.
Spectra of three Vibrio species generated by the Bruker Biotyper MALDI-TOF MS system. a. Vibrio parahaemolyticus, b. V. harveyi, and c. V. alginolyticus. The absolute intensities and masses (m/z) of the ions are shown (axes). For easy viewing, this figure reflects only the mass spectra ranging from 2 000 to 10 000 m/z, which comprises the majority of peaks.
These 30 strains were first confirmed by rpoB sequencing. Next only 10 (33.33%) strains have been correctly identified using VITEK 2 Compact. However, the results (Table 2) indicate MALDI-TOF MS correctly identified 28 (93.33%) of 30 strains in the extended database at the species level, a rate that was significantly higher than that of the MALDI Biotyper 3.1 database alone (76.67%) (P<0.05). Moreover, a strain identification score >2 accounted for 80% of isolates, and therefore the MALDI Biotyper 3.1 database enriched with our own database better identified Vibrio at the species level.
Table
2.
Best-match identification results for 30 blind-coded clinical isolates using the MALDI Biotyper 3.1 database alone versus enrichment with our own expanded database
3.6
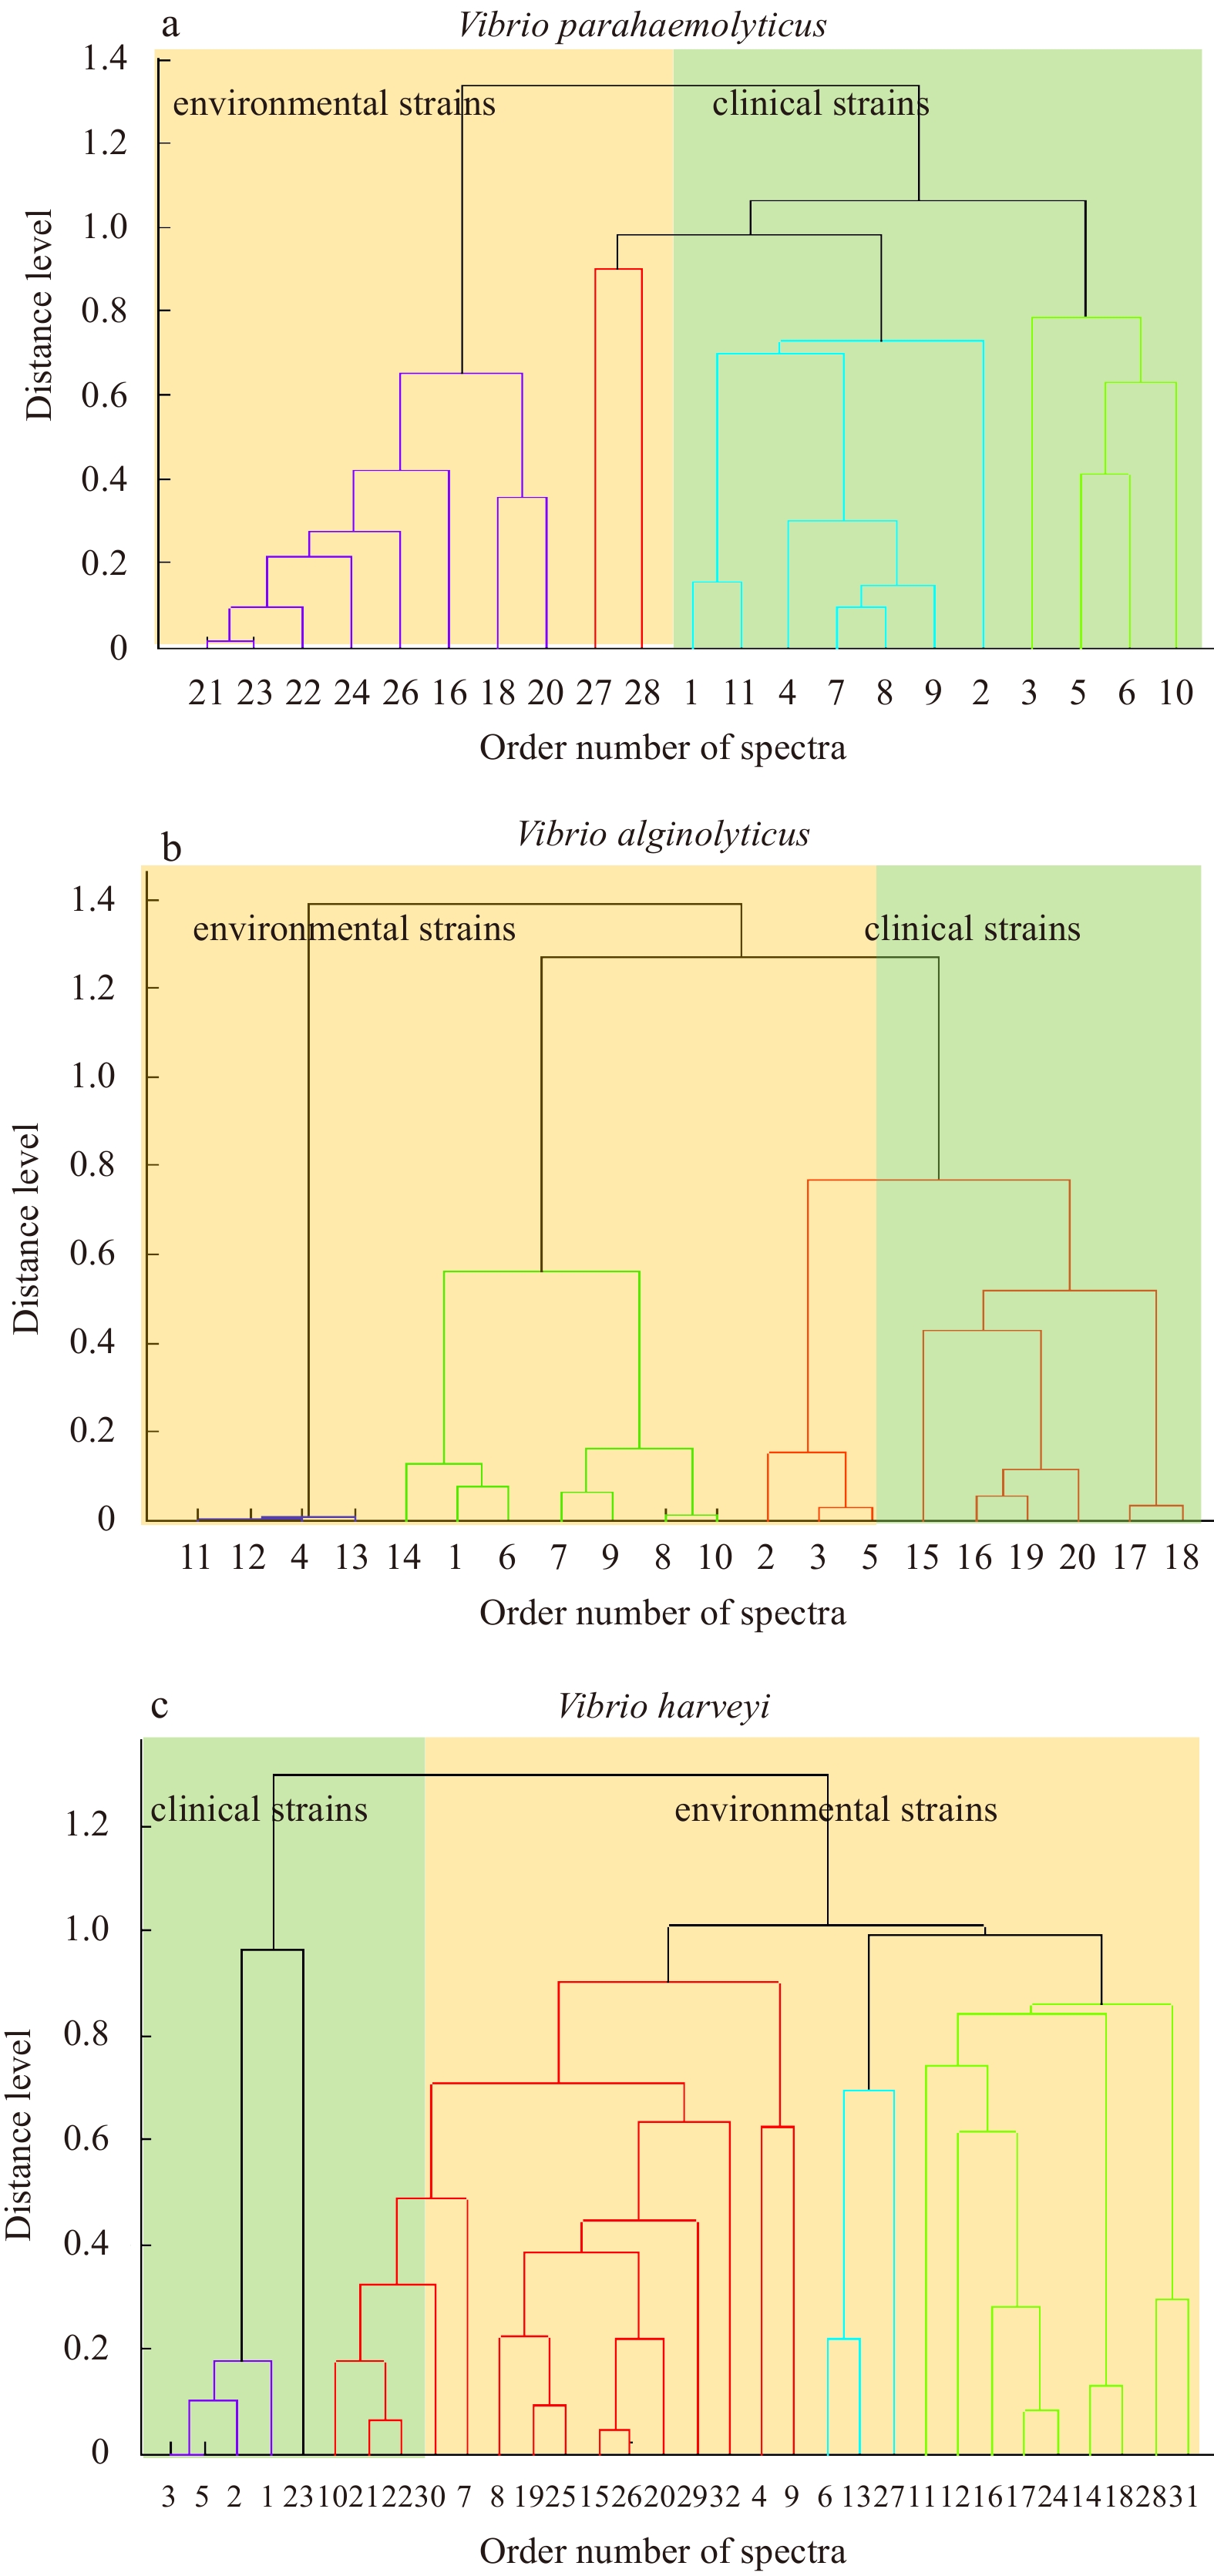
Peptide mass fingerprinting analysis of clinical strains versus environmental strains for V. harveyi, V. parahaemolyticus and V. alginolyticus.
We assumed strains from different sources may have distinctive spectra even if they belong to the same species. We continued to investigate differences in the spectra of environmental strains in the newly created database versus the spectra of clinical strains isolated at Weihai Municipal Hospital.
For V. parahaemolyticus, we first carried out cluster analysis using MALDI Biotyper 3.1 and selected different protein peaks for environmental and clinical strains of V. parahaemolyticus. These V. parahaemolyticus strains (Fig. 4a) were divided into two clusters consisting of 8 clinical strains (Cluster 1) and 11 newly created database strains plus 2 clinical strains (Cluster 2). The PCA dendrogram was generally able to distinguish between clinical strains and environmental strains. By analyzing protein fingerprints, we identified the presence of 4 338.75 m/z peaks in all clinical strains of V. parahaemolyticus but in only 33.3% (3 of 9) of V. parahaemolyticus environmental strains. Vibrio harveyi strains (Fig. 4c) were divided into two clusters of 5 clinical strains (Cluster 1) and 22 newly created database strains plus 3 clinical strains (Cluster 2). We identified 5 149 m/z peaks in 42.85% of V. harveyi clinical strains and in 92.59% (25 of 27) of environmental strains.
Figure
4.
PCA dendrogram generated with Bruker Biotyper MALDI-TOF MS system mass spectra for clinical strains and environmental strains of V. parahaemolyticus (a), V. alginolyticus (b), and V. harveyi (c). The distance level and the order number of spectra are shown (axes). The order number of spectra is the default number of the spectrum when performing PCA dendrogram. Green areas represent clinical strains, and orange areas represent environmental strains.
Some studies (Tarr et al., 2007; Ki et al., 2009) have proved the utility of the rpoB gene for the identification and classification of Vibrio due to its high specificity. Our study also confirms that 16S rRNA sequencing can only correctly identify 33% of strains. Therefore, rpoB sequencing followed by mass spectrometric detection was performed as the gold standard for Vibrio identification in this study. Using the obtained peptide mass fingerprints, we created and evaluated a new database that enhanced the MALDI Biotyper database and offered fast and accurate Vibrio identification. MSP and PCA dendrogram analyses provided technical support to track sources and incidences of Vibrio infection. In addition, the discovery of characteristic and differential peaks is useful for the future identification of Vibrio using MALDI-TOF MS.
The identification accuracy rate for MALDI-TOF appears to be closely related to the species and number of strains in a database (Cheng et al., 2015; Huang et al., 2016; Calderaro et al., 2013). The identification of unknown bacteria involves searching a library that contains a sufficient number of known strains to ensure reliability. The strains in our newly created database complement the Biotyper database. However, we will continue to expand the number and species of Vibrio in future research.
Phylogenetic analyses based on the rpoB gene sequence permit the reliable organization of different species (Tarr et al., 2007; Ki et al., 2009). Interestingly, in our study, the same species were divided into several coexisting groups, although this phenomenon was observed only with the closely related species V. alginolyticus, V. harveyi and V. parahaemolyticus. For these species, the average nucleotide distances calculated for the rpoB gene were 4.2% (V. alginolyticu and V. harveyi), 3.2% (V. alginolyticus and V. parahaemolyticus) and 5.3% (V. harveyi and V. parahaemolyticus) (Tarr et al., 2007). Strains reported in the literature are generally derived from the same sea or patients in the same area. However, the strains in our study came from many sources, including the USA, Japan, Australia, China, Asia, North America, and Oceania, resulting in a more dispersed species distribution. Thus, for closely related species, a different originating location and temporal and spatial separation result in relatively large differences in rpoB sequences, nearly surpassing interspecific differences.
In general, phylogenetic trees based on gene sequences showed a significantly better fit than trees produced by clustering MALDI-TOF mass spectra. However, for closely related species, relationships were not clearly defined by rpoB sequence analysis in our study. Closely related species had clearly similar, but not identical, MALDI-TOF mass spectra. The peptide mass spectra of various pathogens indicate geographical specificity (Price et al., 2007). Different marine habitats and geographical regions affect the distribution of different species and subspecies. The toxicity and pathogenicity of diverse pathogens vary with geographical location. Thus, MALDI-TOF MS may be an ideal tool not only to classify certain strains but also to track the source and spread of various pathogens. We will continue to study differences in the spectra of pathogenic strains.
More closely related strains generally exhibit more similar spectra. As reported by Hazen TH et al. (2009), the peak at 6 409 m/z that was detected in the spectra of 75% of Vibrio may be a useful biomarker for the identification of Gammaproteobacteria. In our study, the peaks at 4 276, 5 183 and 6 170 m/z may also be useful biomarkers for Gammaproteobacteria, while the peaks at 7 198, 8 053, 9 081, and 9 466 m/z may be biomarkers for Vibrio parahaemolyticus. Other detected peaks may have similar significance. These selected peaks potentially represent a ribosomal protein or housekeeping proteins with taxonomic meaning, and further studies to investigate their significance are required. In summary, MALDI-TOF MS provides valuable information that assists in discriminating between closely related species. Shifts in protein peaks between closely related species, such as the 9 466 m/z peak in the protein mass fingerprints of V. harveyi and V. parahaemolyticus or the 9 458 m/z peak in the protein mass fingerprints of V. alginolyticus, may be attributable to amino acid substitutions (Emami et al., 2012).
The differential peaks between clinical and environmental strains, may be related to strain virulence, may reflect strain adaptation to a particular geographic location. Thus, further analysis and the development of biomarker peaks are required to better distinguish three different species comprising clinical and environmental strains. We confirmed differences between clinical strains and environmental strains, suggesting MALDI-TOF MS may be a valuable tool to discriminate between clinical and environmental strains. However, further analysis of a larger number of isolates is required to validate differential protein peaks. The mass spectra of different strains may be influenced by several factors, such as culture temperature (Xuan et al., 2015), culture medium and incubation time. Therefore, we maintained the same culture conditions for clinical strains and environmental strains in our study.
In conclusion, the enriched database can better identify Vibrio at the species level. Once the patent auditing is successful, we will make the database public. The cluster analysis based on MALDI-TOF MS makes epidemiological investigation convenience. The characteristic peaks at the genus level and the species level provide basis for the identification of new strains. In the next years, we will continue to expand the database. For the differential peaks between clinical strains and environmental strains, we will acquire mass spectra in reflector mode to find the corresponding protein in the protein library. The proteins may work in manufacturing vaccine and the antibody therapy of vibrio infection.
Acknowledgements
We thank the Marine Culture Collection of China for providing the strains.
Calderaro A, Gorrini C, Piccolo G, et al. 2014. Identification of Borrelia species after creation of an in-house MALDI-TOF MS database. PLoS One, 9(2): e88895. doi: 10.1371/journal.pone.0088895
[2]
Calderaro A, Piccolo G, Montecchini S, et al. 2013. MALDI-TOF MS analysis of human and animal Brachyspira species and benefits of database extension. Journal of Proteomics, 78: 273–280. doi: 10.1016/j.jprot.2012.09.027
[3]
Cheng W C, Jan I S, Chen J M, et al. 2015. Evaluation of the Bruker Biotyper matrix-assisted laser desorption ionization-time of flight mass spectrometry system for identification of blood isolates of Vibrio species. Journal of Clinical Microbiology, 53(5): 1741–1744. doi: 10.1128/JCM.00105-15
[4]
Emami K, Askari V, Ullrich M, et al. 2012. Characterization of bacteria in ballast water using MALDI-TOF mass spectrometry. PLoS One, 7(6): e38515. doi: 10.1371/journal.pone.0038515
[5]
Fagerquist C K, Garbus B R, Miller W G, et al. 2010. Rapid identification of protein biomarkers of Escherichia coli O157:H7 by matrix-assisted laser desorption ionization-time-of-flight-time-of-flight mass spectrometry and top-down proteomics. Analytical Chemistry, 82(7): 2717–2725. doi: 10.1021/ac902455d
[6]
Hazen T H, Martinez R J, Chen Y F, et al. 2009. Rapid identification of Vibrio parahaemolyticus by whole-cell matrix-assisted laser desorption ionization-time of flight mass spectrometry. Applied and Environmental Microbiology, 75(21): 6745–6756. doi: 10.1128/AEM.01171-09
[7]
Huang C H, Huang L, Chang M T, et al. 2016. Establishment and application of an analytical in-house database (IHDB) for rapid discrimination of Bacillus subtilis group (BSG) using whole-cell MALDI-TOF MS technology. Molecular and Cellular Probes, 30(5): 312–319. doi: 10.1016/j.mcp.2016.08.002
[8]
Kaneko T, Colwell R R. 1974. Distribution of Vibrio parahaemolyticus and related organisms in the Atlantic Ocean off South Carolina and Georgia. Applied and Environmental Microbiology, 28(6): 1009–1017. doi: 10.1128/AEM.28.6.1009-1017.1974
[9]
Kaleta E J, Clark A E, Cherkaoui A, et al. 2011. Comparative analysis of PCR-electrospray ionization/mass spectrometry (MS) and MALDI-TOF/MS for the identification of bacteria and yeast from positive blood culture bottles. Clinical Chemistry, 57(7): 1057–1067. doi: 10.1373/clinchem.2011.161968
[10]
Ki J S, Zhang R, Zhang W, et al. 2009. Analysis of RNA polymerase beta subunit (rpoB) gene sequences for the discriminative power of marine Vibrio species. Microbial Ecology, 58(4): 679–691. doi: 10.1007/s00248-009-9519-7
[11]
Price N P J, Rooney A P, Swezey J L, et al. 2007. Mass spectrometric analysis of lipopeptides from Bacillus strains isolated from diverse geographical locations. FEMS Microbiology Letters, 271(1): 83–89. doi: 10.1111/j.1574-6968.2007.00702.x
[12]
Shao Zongze. 2010. Catalogue of China Marine Microbial Collections (in Chinese). Beijing: Chemical Industry Press
[13]
Seng P, Drancourt M, Gouriet F, et al. 2009. Ongoing revolution in bacteriology: routine identification of bacteria by matrix-assisted laser desorption ionization time-of-flight mass spectrometry. Clinical Infectious Diseases, 49(4): 543–551. doi: 10.1086/600885
[14]
Singhal N, Kumar M, Kanaujia P K, et al. 2015. MALDI-TOF mass spectrometry: an emerging technology for microbial identification and diagnosis. Frontiers in Microbiology, 6: 791
[15]
Sogawa K, Watanabe M, Sato K, et al. 2012. Rapid identification of microorganisms by mass spectrometry: improved performance by incorporation of in-house spectral data into a commercial database. Analytical and Bioanalytical Chemistry, 403(7): 1811–1822. doi: 10.1007/s00216-011-5656-1
[16]
Tarr C L, Patel J S, Puhr N D, et al. 2007. Identification of Vibrio isolates by a multiplex PCR assay and rpoB sequence determination. Journal of Clinical Microbiology, 45(1): 134–140. doi: 10.1128/JCM.01544-06
[17]
Tiruvayipati S, Bhassu S. 2016. Host, pathogen and the environment: the case of Macrobrachium rosenbergii, Vibrio parahaemolyticus and magnesium. Gut Pathogens, 8(1): 15. doi: 10.1186/s13099-016-0097-1
[18]
Xuan Guanhua, Jia Juntao, Chen Ying, et al. 2015. Strain-level visualized analysis of cold-stressed Vibrioparahaemolyticus based on MALDI-TOF mass fingerprinting. Microbial Pathogenesis, 88: 16–21. doi: 10.1016/j.micpath.2015.08.002
İfakat Tülay Çağatay. Use of proteomic-based MALDI-TOF mass spectra for identification of bacterial pathogens in aquaculture: a review. Aquaculture International, 2024. doi:10.1007/s10499-024-01544-x
2.
Lidita Khandeparker, Laxman Gardade, Arga Chandrashekar Anil. Influence of environmental settings in geographically distinct ports on the protein profiles of cultivable bacteria using MALDI–TOF mass spectrometry. Marine Ecology, 2024, 45(1) doi:10.1111/maec.12777
3.
Małgorzata Szultka-Młyńska, Daria Janiszewska, Paweł Pomastowski, et al. Identification of Bacteria Associated with Post-Operative Wounds of Patients with the Use of Matrix-Assisted Laser Desorption/Ionization Time-of-Flight Mass Spectrometry Approach. Molecules, 2021, 26(16): 5007. doi:10.3390/molecules26165007
Jing Wu, Yuexia Zhou, Xiaofei Liu, Yuan Cao, Chengjin Hu, Yingjian Chen. Extension and application of a database for the rapid identification of Vibrio using MALDI-TOF MS[J]. Acta Oceanologica Sinica, 2020, 39(10): 140-146. doi: 10.1007/s13131-020-1635-8
Jing Wu, Yuexia Zhou, Xiaofei Liu, Yuan Cao, Chengjin Hu, Yingjian Chen. Extension and application of a database for the rapid identification of Vibrio using MALDI-TOF MS[J]. Acta Oceanologica Sinica, 2020, 39(10): 140-146. doi: 10.1007/s13131-020-1635-8
Table
2.
Best-match identification results for 30 blind-coded clinical isolates using the MALDI Biotyper 3.1 database alone versus enrichment with our own expanded database
Figure 1. The neighbor-joining (NJ) phylogenetic tree for Vibrio based on rpoB sequences (a) and the maximum likelihood (ML) phylogenetic tree for Vibrio based on rpoB sequences (b). a. The robustness of the branching is indicated by bootstrap values calculated for 1000 subsets. Bar: 0.05% sequence divergence. b. The robustness of the branching is indicated by bootstrap values calculated for 1 000 subsets. Bar: 0.2% sequence divergence. The tree was constructed using MEGA6.0 based on 55 sequences (approximately 870 bp in length), including 16 type strain sequences. The 55 sequences comprise V. alginolyticus (6), V. harveyi (23), V. parahaemolyticus (12), V. damsel (6), V. chagasii (5), and V. anguillarum (3).
Figure 2. The main spectrum projection (MSP) dendrograms based on the expanded database (a) and the principal component analysis (PCA) dendrograms based on MALDI Biotyper 3.1 database (b). We analyzed 55 strains, including V. alginolyticus (6), V. harveyi (23), V. parahaemolyticus (12), V. damsela (6), V. chagasii (5), and V. anguillarum (3). Detailed information of strains is shown in Supplementary Information.
Figure 3. Spectra of three Vibrio species generated by the Bruker Biotyper MALDI-TOF MS system. a. Vibrio parahaemolyticus, b. V. harveyi, and c. V. alginolyticus. The absolute intensities and masses (m/z) of the ions are shown (axes). For easy viewing, this figure reflects only the mass spectra ranging from 2 000 to 10 000 m/z, which comprises the majority of peaks.
Figure 4. PCA dendrogram generated with Bruker Biotyper MALDI-TOF MS system mass spectra for clinical strains and environmental strains of V. parahaemolyticus (a), V. alginolyticus (b), and V. harveyi (c). The distance level and the order number of spectra are shown (axes). The order number of spectra is the default number of the spectrum when performing PCA dendrogram. Green areas represent clinical strains, and orange areas represent environmental strains.


 DownLoad:

 DownLoad:


 DownLoad: