Chunyan Ren, Min Chen, Laodong Guo, Jian Zeng, Renming Jia, Xiao Liu, Minfang Zheng, Yusheng Qiu. Nitrogen isotopic fractionation of particulate organic matter production and remineralization in the Prydz Bay and its adjacent areas[J]. Acta Oceanologica Sinica, 2020, 39(12): 42-53. doi: 10.1007/s13131-020-1698-6
Citation:
Chunyan Ren, Min Chen, Laodong Guo, Jian Zeng, Renming Jia, Xiao Liu, Minfang Zheng, Yusheng Qiu. Nitrogen isotopic fractionation of particulate organic matter production and remineralization in the Prydz Bay and its adjacent areas[J]. Acta Oceanologica Sinica, 2020, 39(12): 42-53. doi: 10.1007/s13131-020-1698-6
Chunyan Ren, Min Chen, Laodong Guo, Jian Zeng, Renming Jia, Xiao Liu, Minfang Zheng, Yusheng Qiu. Nitrogen isotopic fractionation of particulate organic matter production and remineralization in the Prydz Bay and its adjacent areas[J]. Acta Oceanologica Sinica, 2020, 39(12): 42-53. doi: 10.1007/s13131-020-1698-6
Citation:
Chunyan Ren, Min Chen, Laodong Guo, Jian Zeng, Renming Jia, Xiao Liu, Minfang Zheng, Yusheng Qiu. Nitrogen isotopic fractionation of particulate organic matter production and remineralization in the Prydz Bay and its adjacent areas[J]. Acta Oceanologica Sinica, 2020, 39(12): 42-53. doi: 10.1007/s13131-020-1698-6
College of Ocean and Earth Sciences, Xiamen University, Xiamen 361005, China
2.
School of Freshwater Sciences, University of Wisconsin-Milwaukee, Milwaukee, WI 53204, USA
Funds:
The National Natural Science Foundation of China under contract No. 41721005; the COMRA Program of China under contract No. DY135-E2-2-03; the Polar Environment Comprehensive Investigation & Assessment Program of China under contract Nos CHINARE2017-01-04-03 and CHINARE2017-04-01-06.
During the 29th Chinese National Antarctic Research Expedition, spatial variations in nitrogen isotopic composition of particulate nitrogen (δ15NPN) and their controlling factors were examined in detail with regard to nitrate drawdown by phytoplankton and particulate nitrogen (PN) remineralization in the Prydz Bay and its adjacent areas. To better constrain the nitrogen transformations, the physical and chemical parameters, including temperature, salinity, nutrients, PN and δ15NPN in seawater column were measured from surface to bottom. In addition, the nitrogen isotopic fractionation factor of nitrate assimilation by phytoplankton in the mixed layer, and the nitrogen isotopic fractionation factor of PN remineralization below the mixed layer were estimated using Rayleigh model and Steady State model, respectively. Our results showed that suspended particles had its lowest δ15NPN in the surface layer, which was due to the preferential assimilation of 14N in nitrate by phytoplankton. The δ15NPN in the mixed layer of the Prydz Bay and its adjacent areas decreased from the inner shelf to the outer basin, ascribing to the effect of isotope fractionation during phytoplankton assimilation. In mixed layer, the spatial distribution of δ15NPN associated with particulate organic matter (POM) production can be well interpreted according to Rayleigh model and Steady State model. The nitrogen isotope fractionation factor during phytoplankton assimilating nitrate was estimated as 10.0‰ by Steady State model, which was more reasonable than that calculated by Rayleigh model. These results validate the previous reports of fractionation factor during nitrate assimilation by phytoplankton. Increasing δ15NPN with depth below the euphotic zone correlated with the decreasing PN contents, and it was attributed to preferential remineralization of 14N in PN by bacteria. In subsurface and deep layer, the δ15NPN distributions also conformed to Rayleigh model and Steady State model during PN remineralization, with a fractionation factor of about 3.6‰ and 3.2‰, respectively. It is the first time to estimate the fractionation factor during POM production and remineralization in the Prydz Bay and its adjacent areas. Such fractionation may provide a useful tool for the follow-up study of the nitrogen dynamics in the Southern Ocean.
In typical open oceans, nitrate uptake by phytoplankton and organic matter remineralization are two key processes that influence spatial variations of δ15NPN. In surface layer, the POM is usually 15N-depleted because of the preferential utilise of 14N in nitrate during biological assimilation (Altabet, 2006; Sigman and Casciotti, 2001). This isotopic fractionation varies with substrate contents as well as algal species, physiology and growth rate (Montoya and McCarthy, 1995; Pennock et al., 1996; Wada and Hattori, 1978; Wada, 1980; Waser et al., 1998a, b). Whereas below the euphotic zone, the preferential remineralization of 14N in POM leads to a progressive increase in residual δ15NPN and shape the vertical profiles of δ15NPN in deep water (Altabet, 1988, 1996).
The isotopic fractionation factor (ε) is an important parameter in quantitatively understanding N transformations among different biological processes. For N fixation in surface ocean, the POM produced by diazotrophs is relatively 15N-depleted with δ15NPN as low as –2‰ to 0.5‰, because diazotrophs assimilate dissolved dinitrogen gas (N2) with the value of δ15N around 0.6‰ (Carpenter et al., 1997; Minagawa and Wada, 1986). As for nitrate assimilation by phytoplankton, the ε value is typically within a range of 1‰–10‰, with most estimates close to 5‰–8‰ (Montoya and McCarthy, 1995; Needoba et al., 2003, 2004; Pennock et al., 1996; Wada and Hattori, 1978; Waser et al., 1998a, b). Culture studies suggest an ε value up to 20‰ for ammonium assimilation while less than 1‰ for assimilation of nitrite and urea, both of which are nearly exhausted in surface mixed layer of open ocean (Pennock et al., 1996; Wada and Hattori, 1978; Waser et al., 1998a, b). In general, complete remineralization includes several stages participated by different microbial metabolisms. Organic N is usually degraded prior to ammonium by aerobic respiration and then oxidized to nitrate via the intermedia nitrite by nitrification. Isotopic fractionation occurs at all steps involved in remineralization with a net isotope effect of ≤5‰ estimated by Sigman and Casciotti (2001).
δ15NPN data in the Southern Ocean are really scarce especially for the deep water. Rau et al. (1991) reported that the δ15NPN in the surface Weddel Sea ranges from 5.4‰ to 6.1‰. The δ15NPN was about 2.3‰ in the mixed layer and about 6‰ in the waters below 300 m in the Southern Ocean (DiFiore et al., 2009). Lourey et al. (2003) showed that δ15NPN was relatively constant at 1‰ in the surface water of Subantarctic Zone while ranging between –4‰ and 0‰ in the Polar Frontal Zone in summer. Due to the advantages of N isotopes in providing constraints on biological utilization of nutrients, both the δ15N signals of nitrate and particulate organic N in the water column have been widely used to diagnose supply and uptake of N in the Southern Ocean during the past decades (Altabet and Francois, 1994b, 2001; DiFiore et al., 2006, 2009; Francois et al., 1992; Francois et al., 1997; Sigman et al., 1999a, b, 2000). The negative linear relationship between nitrate concentration and δ15NPN indicates a strong link between nitrate utilization and N isotopes in the Southern Ocean. (Altabet et al., 1991; Altabet, 1996; Altabet and McCarthy, 1985, 1986). Fractionation factor during nitrate assimilation by phytoplankton was estimated in the Southern Ocean by using the Rayleigh model (Altabet and Francois, 1994a, 2001; DiFiore et al., 2006, 2009; Sigman et al., 2000). For instance, according to profiles of nitrate and δ15NPN in the upper 100 m of Antarctic Polar Frontal Zone in summer, Altabet and Francois (2001) estimated the fractionation factor to be 6‰–8‰ by the Rayleigh model and 7‰–10‰ by the Steady State model.
In the present study, variations of δ15NPN and their controlling factors in the Prydz Bay and its adjacent areas were examined during the Chinese National Antarctic Research Expedition. Based on the Rayleigh model and the Steady State model, the isotopic fractionation factors with regard to both POM production and remineralization were estimated. Our results suggest that δ15NPN is a good tracer in evaluating POM transportation from the surface to the deep sea.
2.
Materials and methods
2.1
Study area
The Prydz Bay and its adjacent areas are key sea areas for scientific exploration in the Southern Ocean, which is a triangular-shaped embayment with an area of 80 000 km2 in the Indian sector (Stagg, 1985; Zhang et al., 2014). It is located at the end of graben occupied by the world’s largest Lambert Glacier, and forms the vast Amery Ice Shelf. The southwestern bay is connected to the Amery Ice Shelf, and bounded by the West Ice Shelf (around 80°E) to the east and the Cape Darnley (around 70°E) to the west.
The water masses in the Prydz Bay and its adjacent areas in summer are composed of Antarctic surface water (AASW), shelf water (SW) or ice shelf water (ISW), circumpolar deep water (CDW) and Antarctic bottom water (AABW) (Gao et al., 2003; Pu and Dong, 2003; Yu et al., 1998; Wong et al., 1998). The characteristics of these water masses were listed in Table 1. The AASW is divided into Antarcitc summer surface water (AASSW) with high temperature and low salinity, and the winter water (WW) with low temperature and high salinity. The depth of AASSW is usually less than 50 m with the temperature and the thickness increase with the increasing latitude in the bay, although with seasonal and annual variations (Chen et al., 1995). A temperature minimum below AASSW exists at depths of 50–100 m, which is called the winter water resulting from winter convection. The SW in the Prydz Bay is divided into high salinity shelf water (HSSW) and low salinity shelf water (LSSW). The SW expands northward at a depth of 50 m, and its intensity decreases gradually (Shi and Zhao, 2002; Pu et al., 2000). A water mass with the temperature lower than –1.9°C occurs near the bottom of the continental shelf, which is called ice shelf water (ISW) or supercooling water. The CDW is the largest water mass in the Southern Ocean, characterized by high temperature, high salinity and low dissolved oxygen (Le et al., 1996), rising from a depth of more than 1000 m to the subsurface and even to the surface. The AABW is the densest water mass in global oceans with low temperature and high salinity, which is closely related to global deep circulations and heat transfers. The Weddell Sea and the Ross Sea are recognized the regions for AABW formation. The AABW is formed by mixing of the high-density shelf water and the CDW (Foster et al., 1987; Jacobs et al., 1970; Orsi et al., 1999; Orsi and Wiederwohl, 2009).
Table
1.
The characteristics of water masses in the Prydz Bay and its adjacent areas in summer
Water masses
Temperature/°C
Salinity
Antarctic surface water (AASW)
Antarctic summer surface water (AASSW) winter water (WW)
–0.5 to 2 <–1.5
32.5–34.5 34.2–34.5
Shelf water (SW)
High salinity shelf water (HSSW) Low salinity shelf water (LSSW)
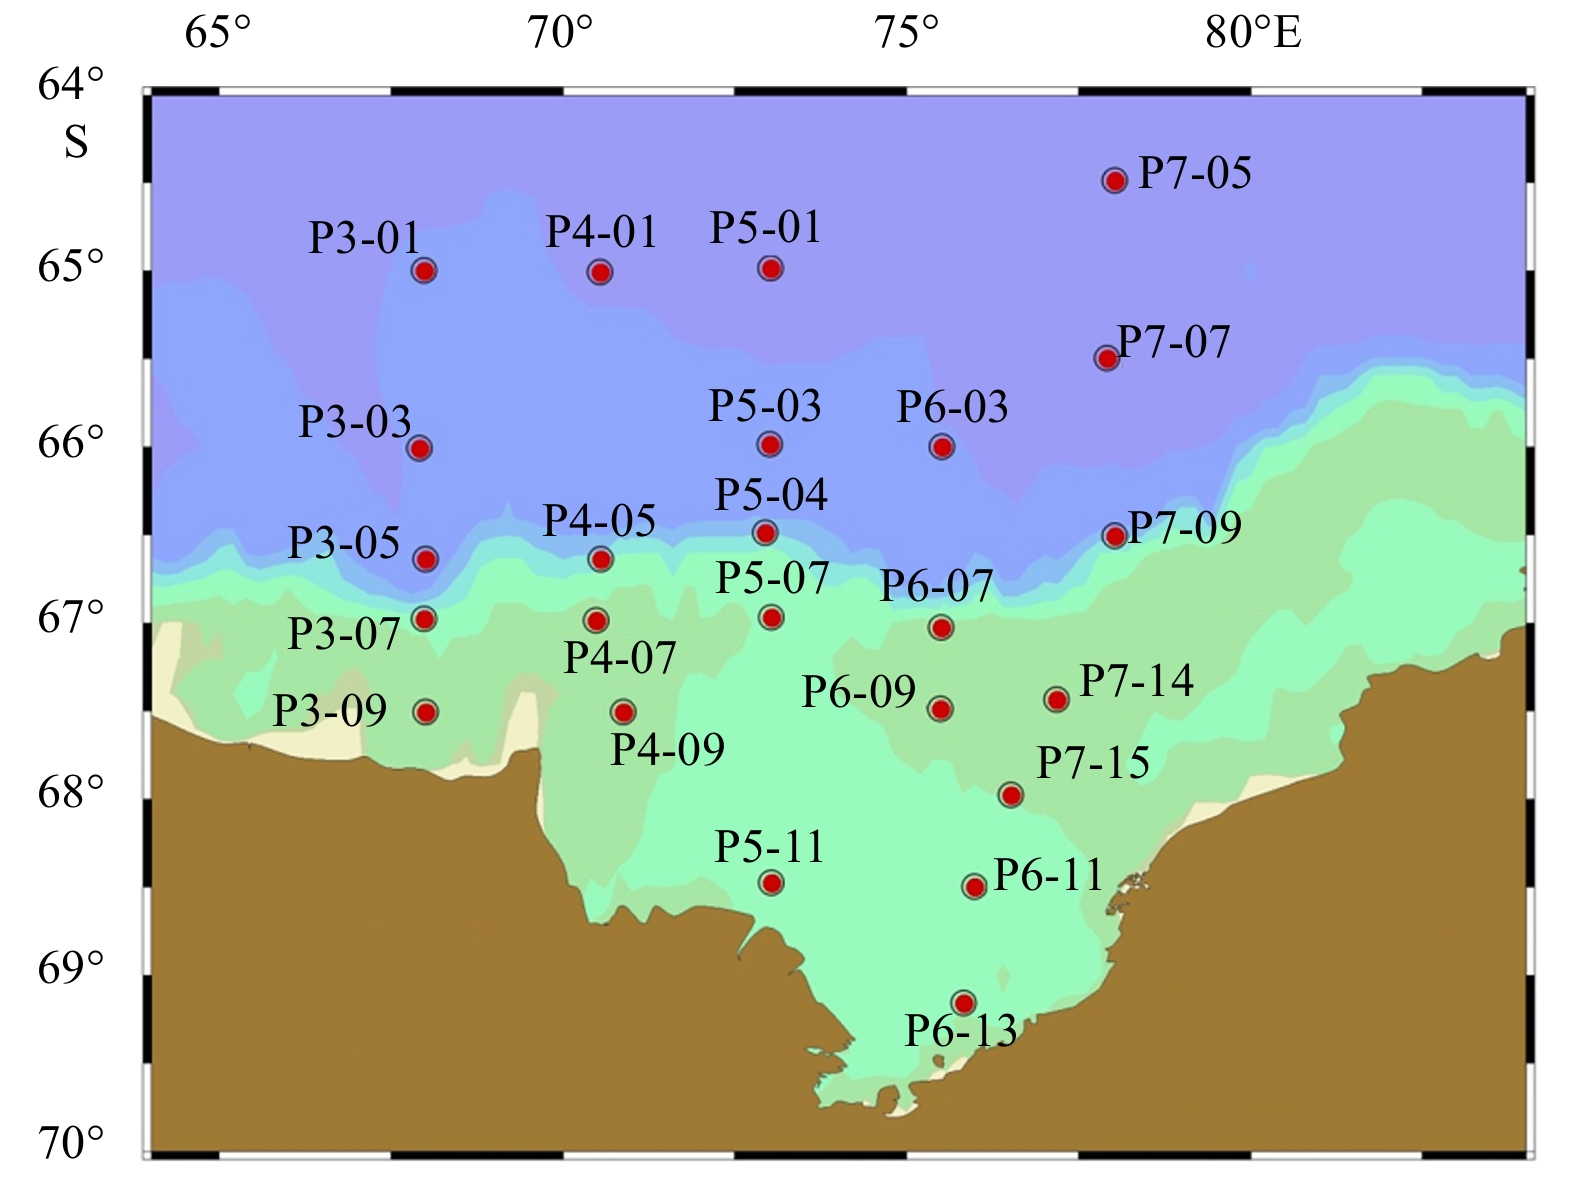
Seawater and suspended POM samples were collected throughout the entire water column onboard the icebreaker R/V Xuelong from January to March 2013 during the 29th Chinese National Antarctic Research Expedition. A total of 24 stations were sampled in the Prydz Bay and its adjacent areas, with 9 stations located over the shelf, 8 stations over the slope and 7 stations in the basin (Fig. 1). Seawater samples were collected using a CTD rosette system. A total of 10 L of seawater was filtered through a precombusted Whatman GF/F membrane (400°C, 4 h). The filter was dried at 60°C for 15 min onboard and placed in a petri dish and stored frozen until analysis.
Figure
1.
Sampling locations in the Prydz Bay and its adjacent areas during summer 2013.
When back to the land laboratory, the filter sample was dried at 60°C for 24 h prior, and wrapped into a tin capsule. The stable N isotopic composition (δ15NPN, in terms of per mil) and PN content were measured using a Deltaplus XP mass spectrometer interfaced with a Carlo Erba NC2500 elemental analyzer (Thermo Finnigan). PN content was calculated according to a working curve with C6H6N2O as a standard. The δ15NPN value was defined as follow:
where Rsample means the ratio of 15N/14N of samples measured by mass spectrometer; Rstandard means the ratio of 15N/14N of standard N2.
In the isotopic measurement, atmospheric N2 was adopted as a standard. The detection limit of PN content is 0.1 μmol/L. The analytical precision for PN and δ15NPN were 0.2% and 0.2‰, respectively.
2.4
Temperature, salinity, nutrient measurement
Temperature, salinity and nutrient data were provided by the Second Institute of Oceanography, Ministry of Natural Resourses. Temperature and salinity were recorded using a Seabird 911 plus CTD system. The analytical precision of conductivity and temperature was ±0.0002 S/m and ±0.001°C. Seawater samples for dissolved nutrients (including nitrate, nitrite and ammonium) analysis were filtrated through a 0.45 μm cellulose acetate membrane. Nitrate, nitrite and ammonium were measured with cadmium reduction, pink azo dye and sodium hypobromite oxidation, respectively. The detection limit for nitrate, nitrite and ammonia were 0.05 μmol/L, 0.02 μmol/L and 0.020 μmol/L, respectively (GB 17378.4—2007).
3.
Results
3.1
In the basin
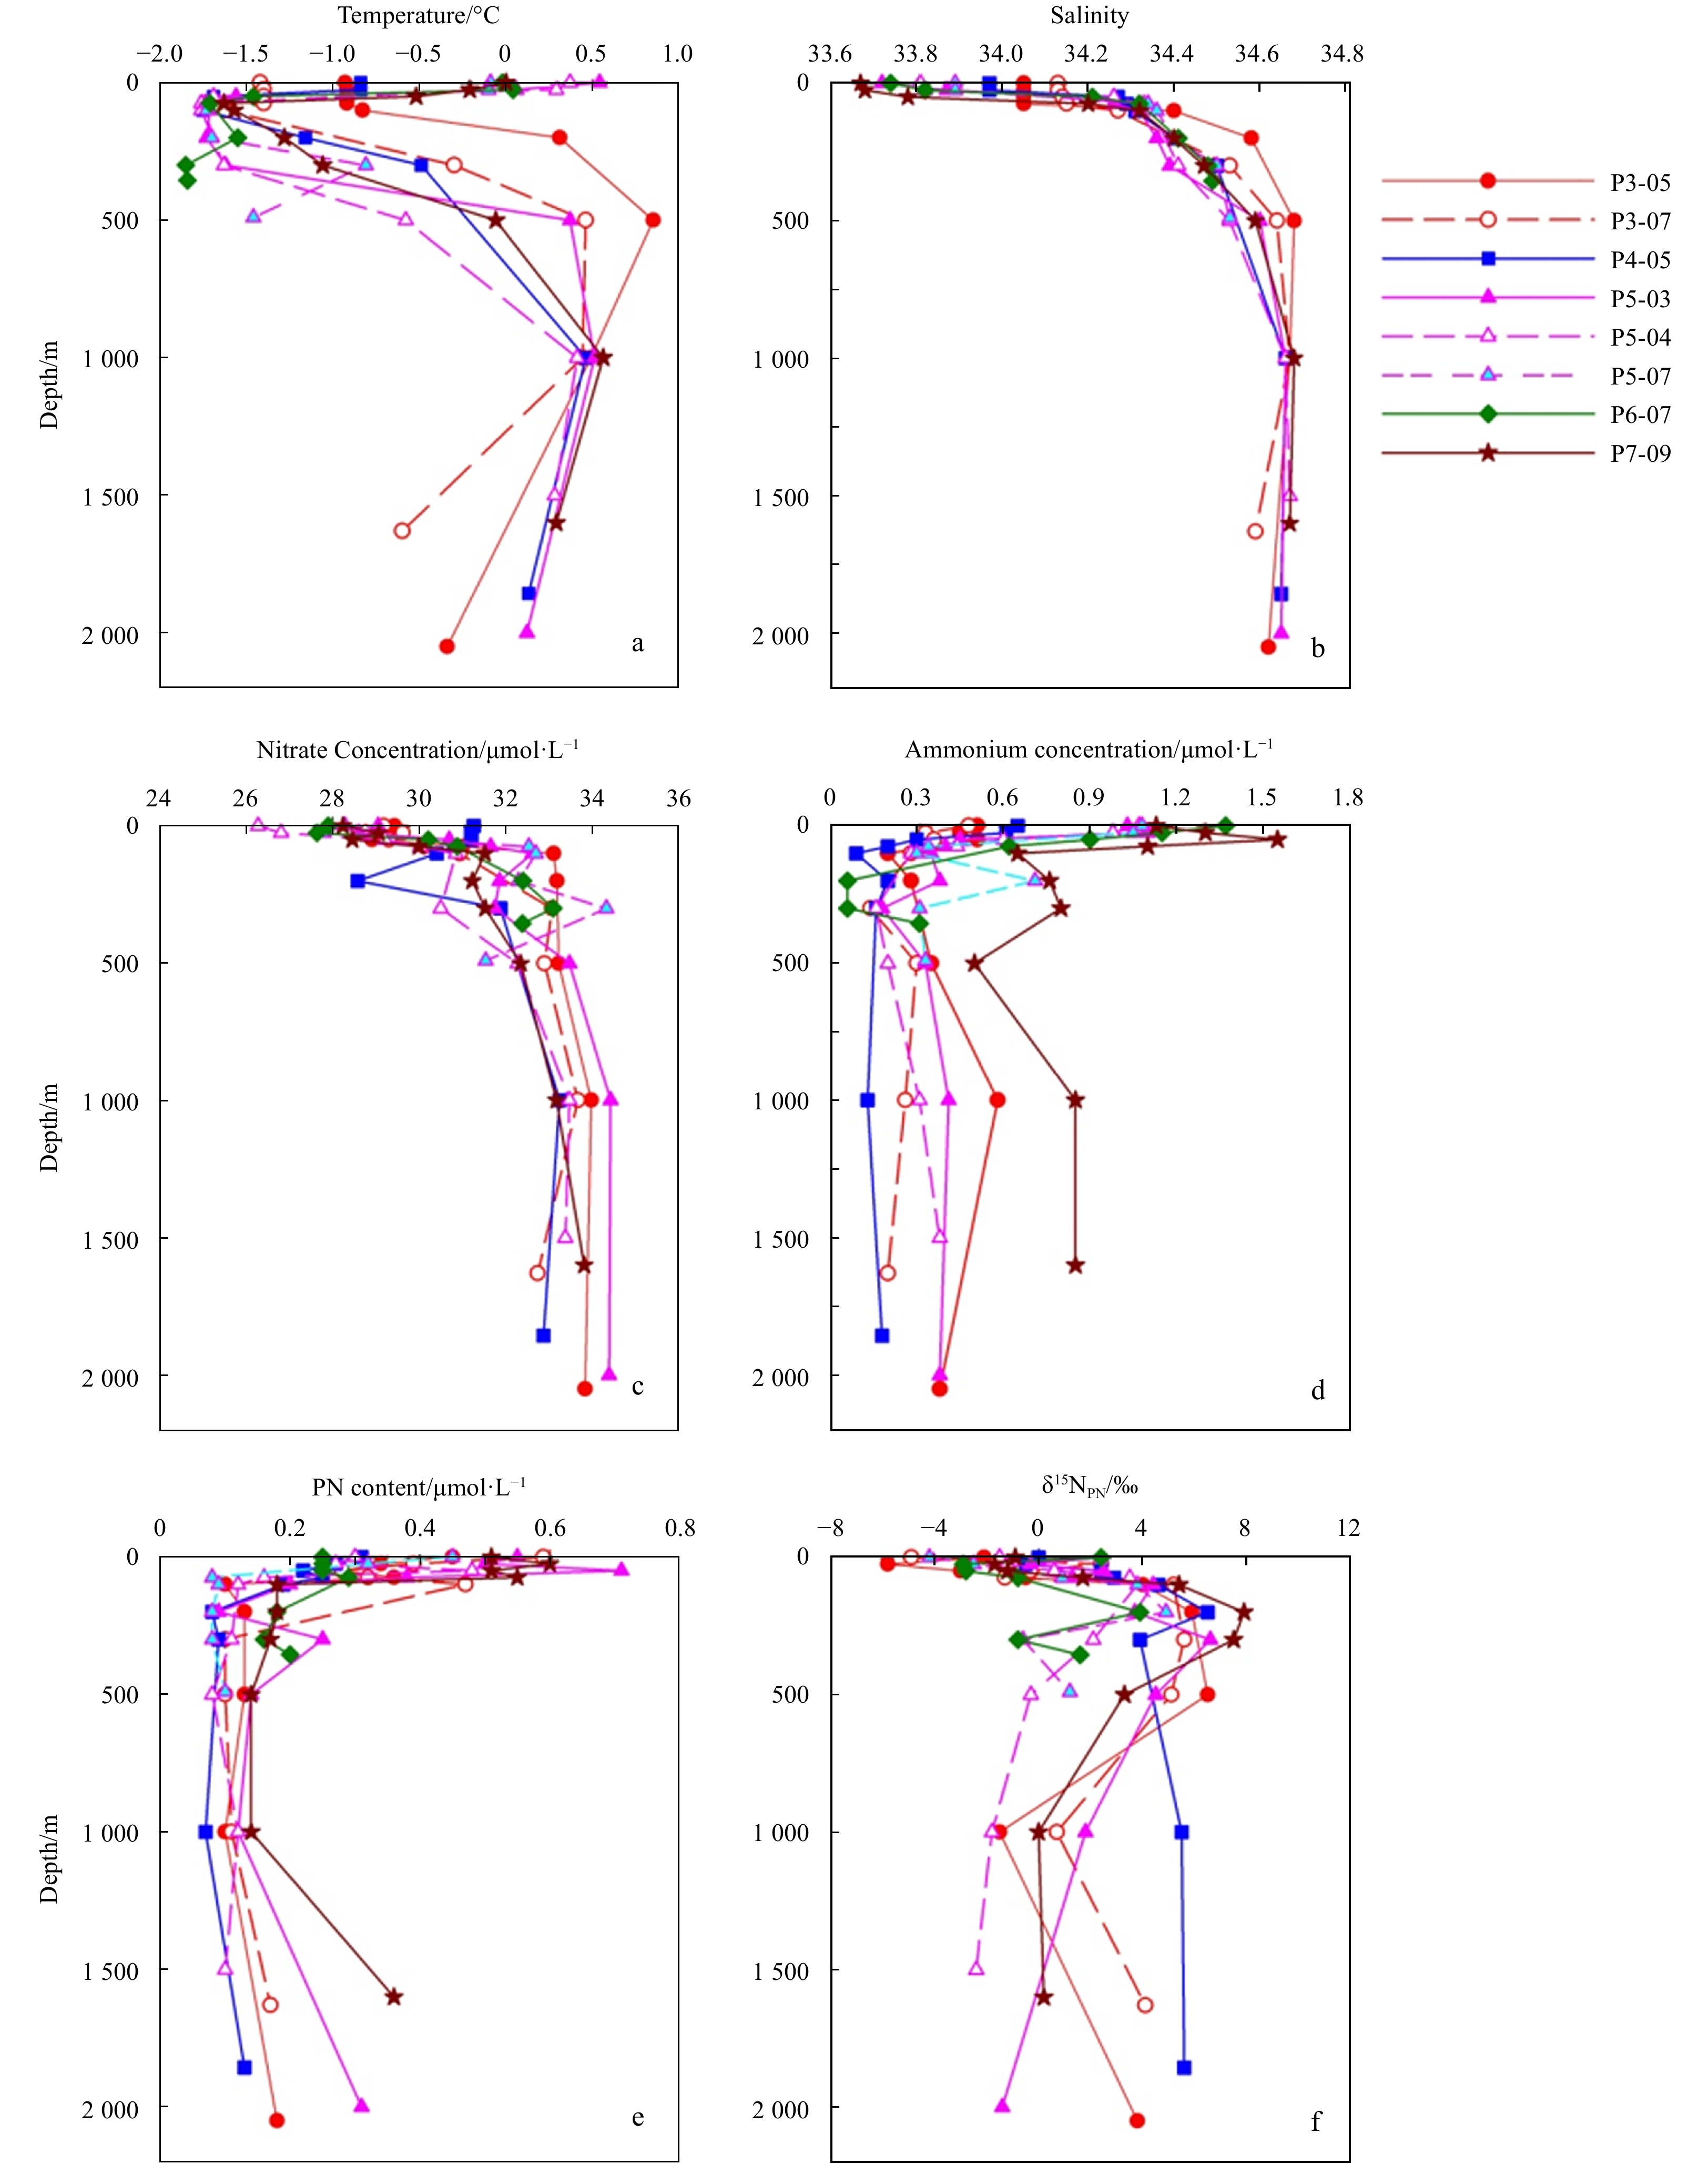
Profiles of temperature, salinity, nitrate, ammonium, PN and δ15NPN in the basin were shown in Fig. 2. Temperature varied from –1.74°C to 1.58°C with an average of –0.08°C. Salinity varied from 33.68 to 34.71 with an average of 34.36. Generally, the temperature dropped to the lowest at 75 m or 100 m, and then increased to the highest at 500 m. Below 500 m, a distinct dicothermal layer occurrs with temperature decreasing with the depth (Fig. 2a). At all stations, the lowest salinity occurrs in the surface water and increases to a maximum at about 500 m, and then remained relatively constant below (Fig. 2b). The concentrations of nitrate varied from 27.54 μmol/L to 35.37 μmol/L with an average of 31.77 μmol/L (Fig. 2c). The concentrations of ammonium varied from 0.09 μmol/L to 2.79 μmol/L with an average of 0.63 μmol/L (Fig. 2d). The contents of PN varied in a range of 0.05–0.78 μmol/L with an average of 0.24 μmol/L (Fig. 2e). The PN content sharply decreased with the increasing depth in the euphotic zone, just being opposite to that of nitrate (Fig. 2c), which is attributed to phytoplankton photosynthesis in the euphotic zone. δ15NPN varied from –5.2‰ to 9.5‰ with an average of 1.6‰. The profiles of δ15NPN showed a minimum at surface and increased to ~5‰ at 100 m or 200 m, and then slightly increased with the depth (Fig. 2f).
Figure
2.
Vertical profiles of temperature, salinity, nitrate, ammonium, PN, δ15NPN in the basin region.
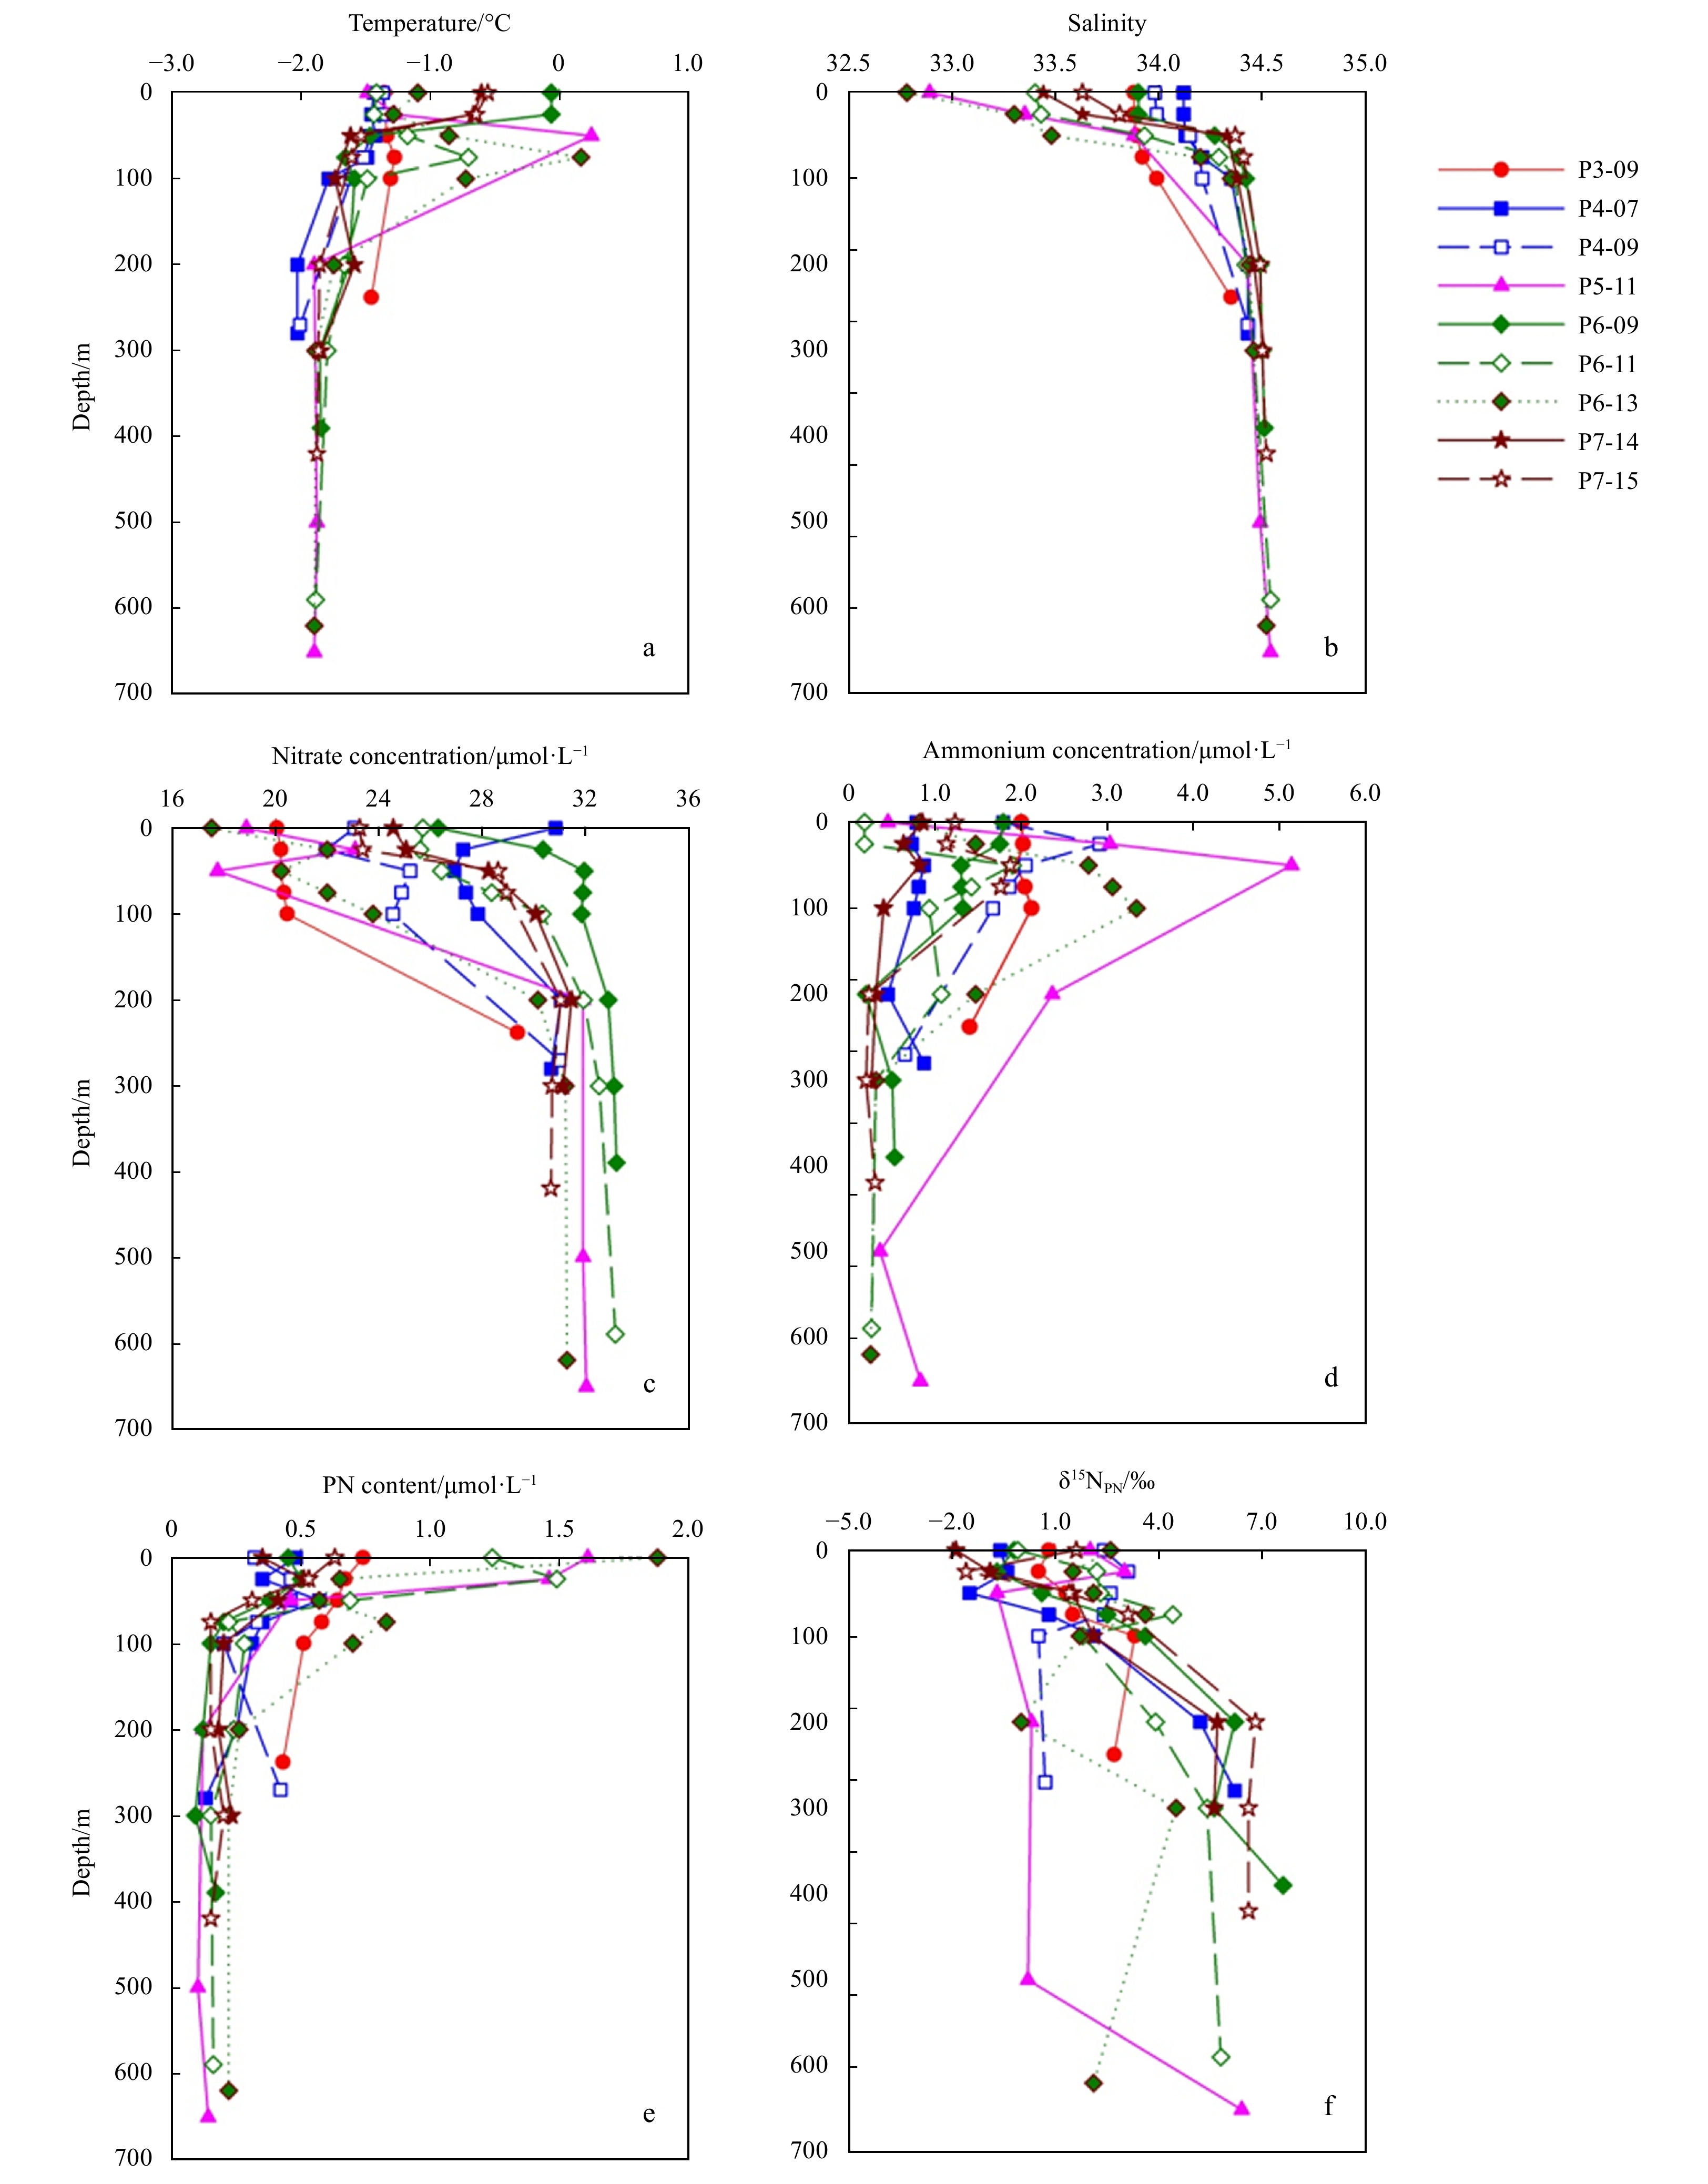
Profiles of temperature, salinity, nitrate, ammonium, PN and δ15NPN in the slope were shown in Fig. 3. Temperature varied from –1.85°C to 0.85°C with an average of –0.75°C. A dicothermal layer marked by a temperature minimum occurrs at 75 m. Salinity varied from 33.67 to 34.68 with an average of 34.30. The vertical patterns of temperature and salinity were similar to those in the basin. At most stations, the profiles of PN content showed a maximum at the surface, and decreased with depth (Fig. 3e). A slightly increase of PN content was observed in the bottom layers, which was different from those in the basin. The δ15NPN increased just below the surface and reached a maximum at roughly depth where the PN minimum occurred, while the δ15NPN decreased instead with the further increasing depth (Fig. 3f).
Figure
3.
Vertical profiles of temperature, salinity, nitrate, ammonium, PN, δ15NPN in the slope region.
Profiles of temperature, salinity, nitrate, ammonium, PN and δ15NPN in the shelf were shown in Fig. 4. Temperature varied from –2.03°C to 0.24°C with an average of –1.39°C. The averaged temperature in the mixed layer and the subsurface was (–1.09±0.47)°C and (–1.54±0.51)°C, respectively. Salinity varied from 32.89 to 34.54 with an average of 34.18, and the average in the mixed layer and the subsurface was (33.67±0.39)°C and (34.33±0.22)°C, respectively (Table 2). The hydrological characteristics in the shelf was characterized with a lower temperature and salinity than those in the slope and basin, most probably due to the melts of sea ice and winter residual waters. Nitrate concentration decreased sharply from the subsurface ((28.89±4.06) μmol/L) to the mixed layer ((23.81±3.57) μmol/L). This upward decrease was most likely driven by phytoplanktonic assimilation of nitrate in the mixed layer. The vertical distribution of PN content was mirrored to those of nitrate (Figs 4c, e). The shallower mixed layer tends to have a greater drawdown of nitrate. Water-depth-related increase in δ15NPN has been found in the whole shelf region. Temperature, nitrate and DIN concentrations in the shelf were lower than those in the slope and the basin. Ammonium and PN contentswere higher in the whole water column of the shelf compared to the slope and the basin. Overall, salinity, nitrate, DIN and δ15NPN tended to increase from the mixed layer to the subsurface, while temperature, ammonium and PN concentrations tended to decrease from the mixed layer to the subsurface layer (Table 2).
Figure
4.
Vertical profiles of temperature, salinity, nitrate, ammonium, PN, δ15NPN in the shelf region.
Table
2.
Temperature, salinity, nitrate, nitrite, ammonium, DIN, PN and δ15N in the mixed layer, subsurface layer and deeper layer in the basin, the slope and the shelf (the variables are expressed as the mean value±standard deviation)
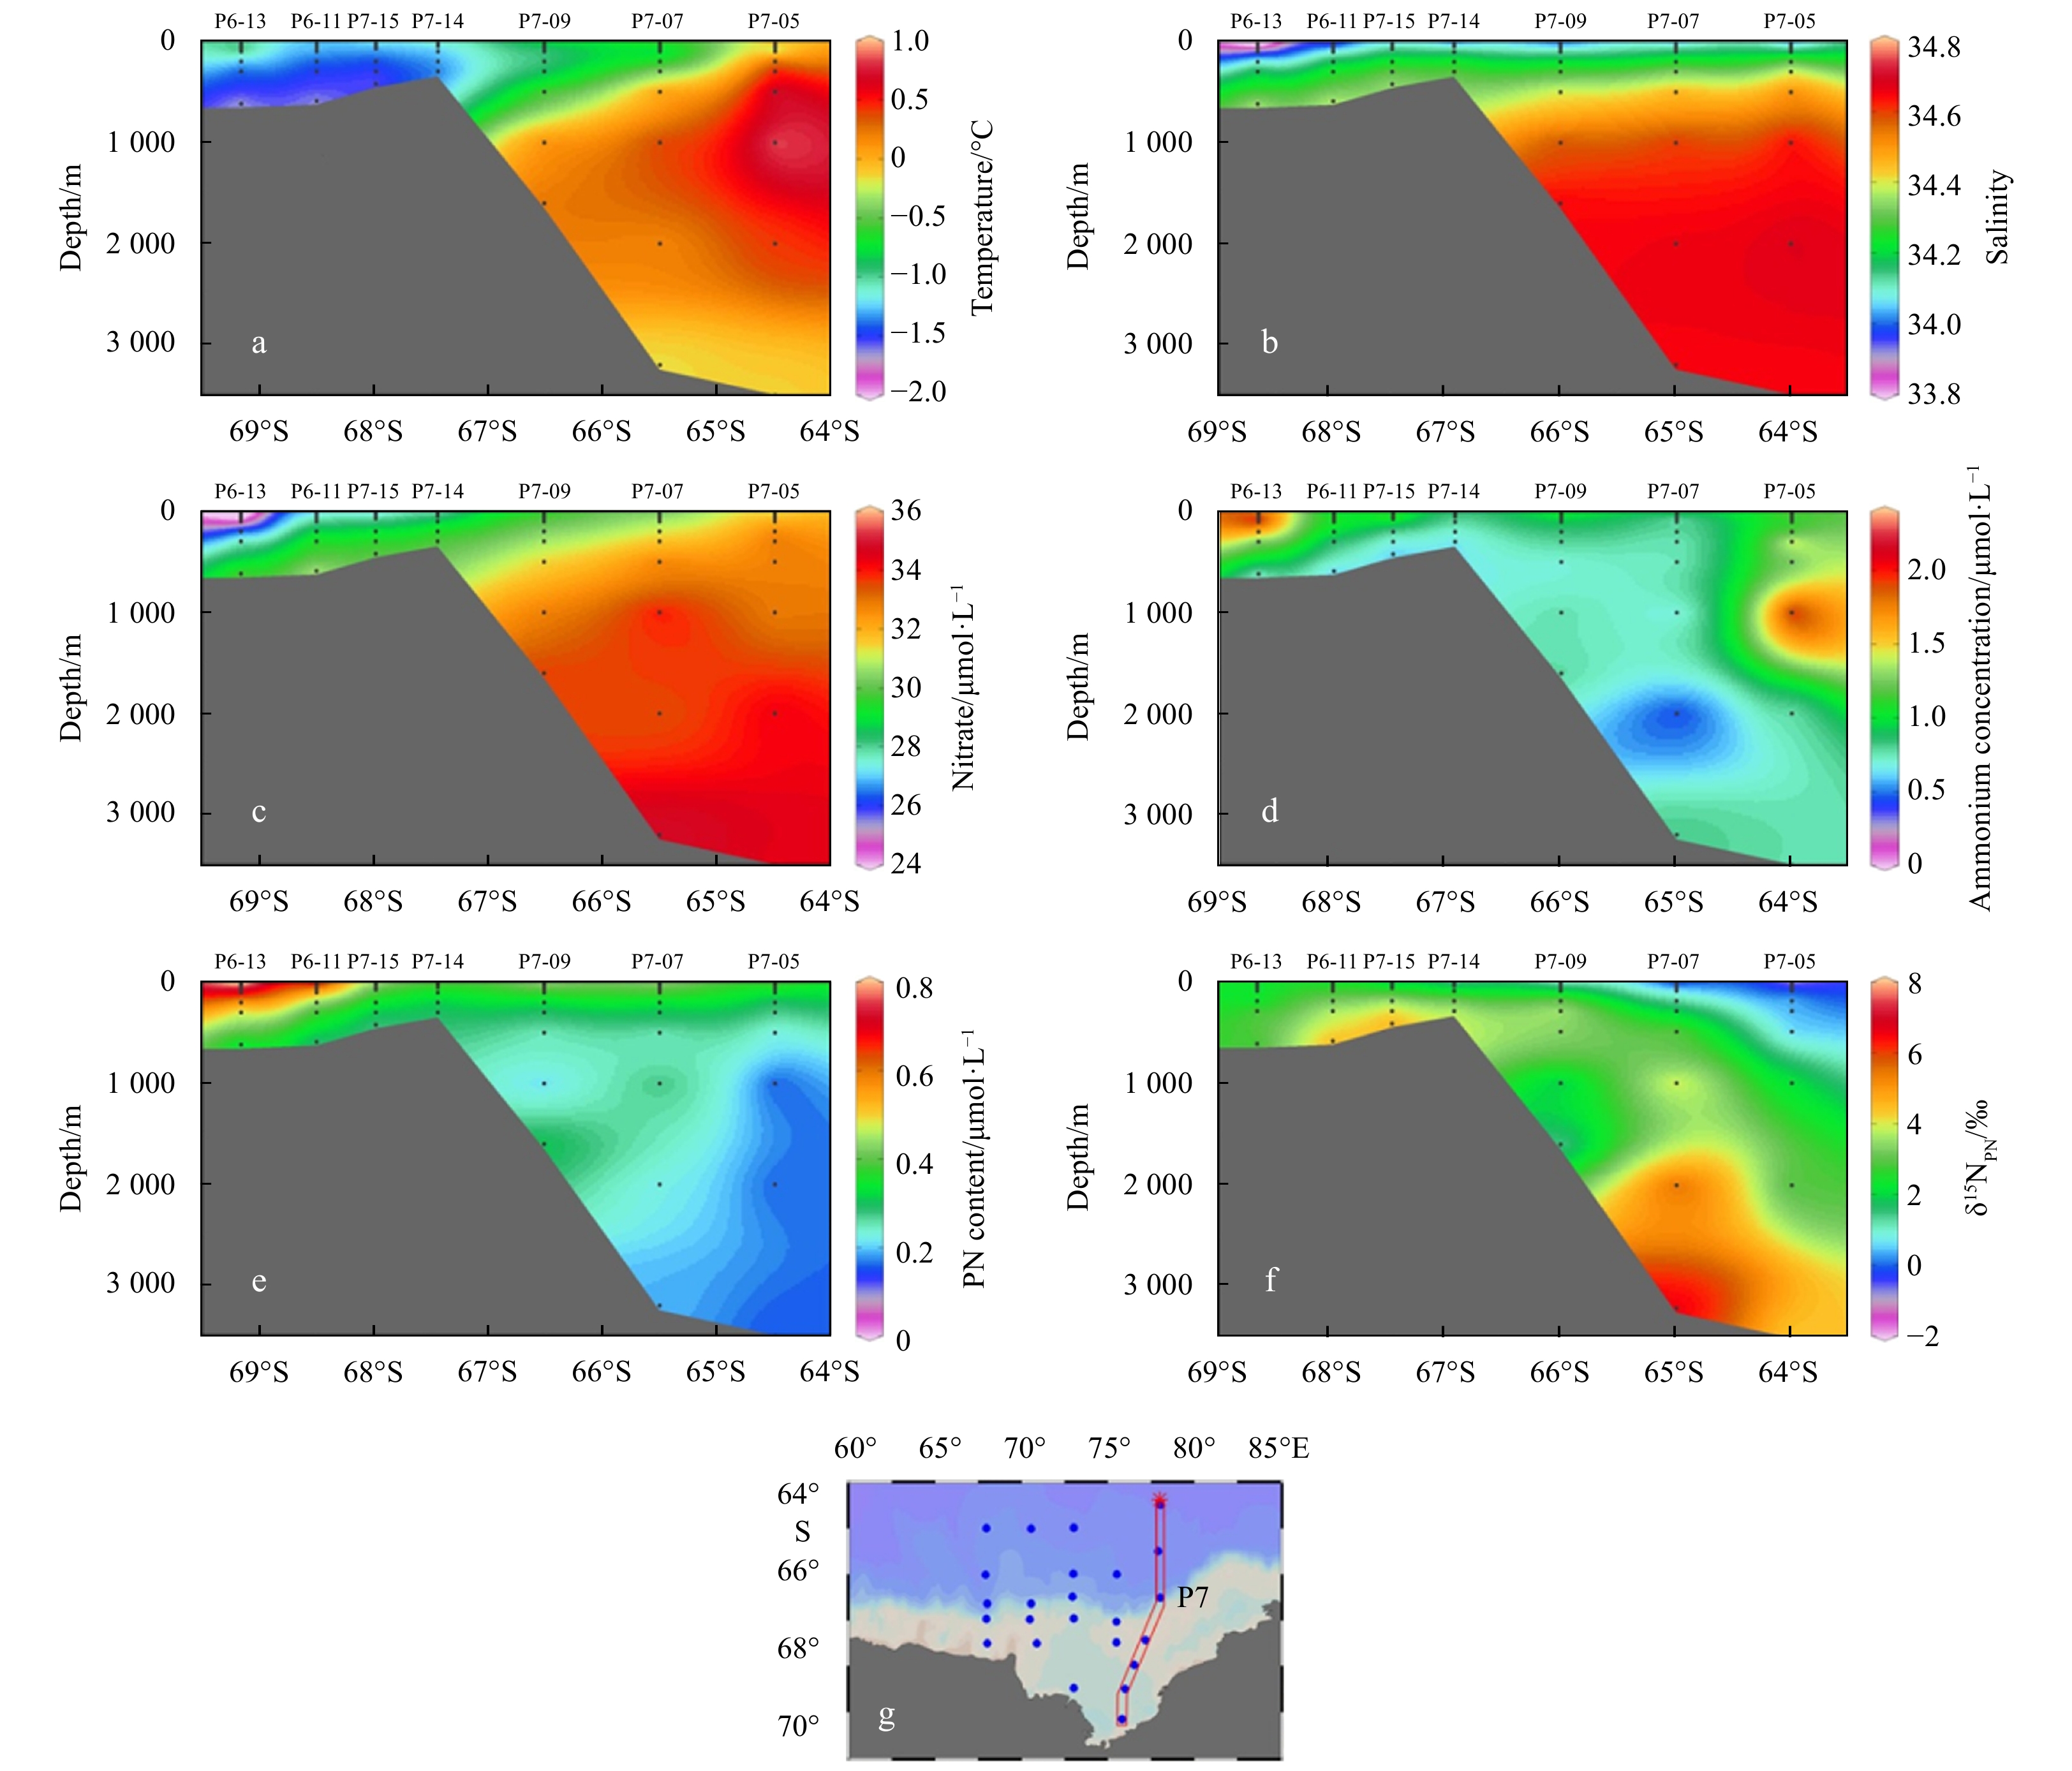
The spatial and vertical distributions of temperature, salinity, nitrate, ammonium, PN and δ15NPN at Sections P3 and P7 were shown in Fig. 5 and Fig. 6, respectively. Surface temperature and salinity showed a general increase from the shelf to the basin, indicating a significant influence of sea ice melting in the Amery Ice Shelf. Distributions of temperature and salinity depicted the impact of various water masses across our study areas, showing an evident transition from the CDW with high temperature and salinity in the basin to the WW and SW with low temperature in the shelf. Furthermore, the low temperature (< –1.5°C) was generally found in the shelf, likely resulted from the residual waters in winter.
Figure
5.
Distributions of temperature (a), salinity (b), nitrate (c), ammonium (d), PN (e), δ15NPN (f) at Section P3 (68°E) (g) in the Prydz Bay and its adjacent areas.
Figure
6.
Distributions of temperature (a), salinity (b), nitrate (c), ammonium (d), PN (e), δ15NPN (f) at Section P7 (78°E) (g) in the Prydz Bay and its adjacent areas.
Nitrate concentrations in surface waters increased from the shelf to the basin. In general, low concentrations of nitrate, high concentration of ammonium and content of PN were found in the shelf, indicating the influence of enhanced biological productivity in the shelf. PN contents decreased, while nitrate concentrations increased with the increasing depth, indicating a major role of biological processes in controlling POM distribution. PN contents in the upper water column were elevated by the biogenic POM production from photosynthesis, while the decrease of PN in the deep water was due to the POM degradation during particle settling. The increase of δ15NPN with depth suggests that bacteria preferentially degrade the 14N in PN, leading to relative 15N enrichment in the residual PN at depth.
4.
Discussion
4.1
δ15NPN in the Prydz Bay and its adjacent areas
Surface δ15NPN in the Prydz Bay and its adjacent areas varied from –4.9‰ to 2.6‰ with an average of –0.9‰, similar to those reported in the Weddel Sea (–5.4‰ to 6.1‰) (Rau et al., 1991) and the Polar Frontal Zone (–4‰ to 0‰) (Lourey et al., 2003), but lower than previous studies in the Southern Ocean (–2‰ to 7.1‰) (Biggs et al., 1989; Liu et al., 2005; Wada et al., 1987) and other low latitudinal areas (–3‰ to 9‰) (Altabet et al., 1991; Mino et al., 2002). There are two possible explanations contributing to the surface low δ15NPN in the Prydz Bay, that is N2 fixation and nitrate assimilation. However, N2 fixation is expected to produce fixed N with δ15N signal as low as about –1‰ to 0‰, which are not fully explain the low value we observed here. The low δ15NPN in the study regions was more likely due to nitrate assimilation by phytoplankton. Phytoplankton preferential discrimination against 15N relative to 14N during nitrate assimilation, resulting in 15N enrichment in the residual nitrate and 15N depletion in organic matter.
The surface pattern of increase of δ15NPN from the outer toward the inner shelf is shaped by biological process. The inner bay is a favorable environment for phytoplankton growth under the influence of sea ice melting (Rigual-Hernández et al., 2015; Waldron et al., 1995; Zhang et al., 2014), and primary production in the inner shelf is significantly higher than that in the outer shelf (Liu et al., 2001, 2002, 2004; Qiu et al., 2004). The high primary production resulted in efficient utilization of nitrate, and thus higher δ15NPN values in the inner shelf. The average δ15NPN values were lowest in the mixed layer followed by the subsurface layer, and the highest in the deeper layer (Table 2). In the mixed layer, the mean δ15NPN values in the basin, the slope and the shelf were –2.73‰±1.87‰, –1.37‰±2.23‰ and 0.66‰±1.61‰, respectively. In the subsurface layer, the mean δ15NPN values in the basin, the slope and the shelf were 1.65‰±2.52‰, 2.99‰±2.69‰ and 3.27‰±2.27‰, respectively. In the deep water, the mean δ15NPN values in the basin, the slope were 5.24‰±1.86‰ and 1.22‰±2.89‰, respectively. The δ15NPN value in the subsurface was typically about 6‰, which is higher than that of suspended particles in the surface. The highest PN content in the shelf, slope and basin were observed in the mixed layers with shelf > slope ≈ basin. As for the δ15NPN, the highest values in both the shelf and slope occurred in the subsurface layer, while in the deep layer in the basin. The δ15NPN in deep water was typically 5‰–10‰, which is consistent with those studies in the Southern Ocean (DiFiore et al., 2009; Liu et al., 2005; Rau et al., 1991). On average, the particulate matter in deep water was enriched in 15N by about 2.5‰, 4.3‰ and 8‰ in the shelf, slope and basin, respectively, relative to those in surface layer. The δ15N of deep particles is consistent with the notion that deep particles are breakdown products of settling particles exported from the surface, and bacteria preferentially remineralize low δ15N particulate N. That means that the higher δ15NPN in deep water is a result of isotopic discrimination during degradation and consumption by bacteria (Sigman and Casciotti, 2001).
4.2
Estimates of fractionation factor during nitrate assimilation by phytoplankton
The δ15NPN in mixed layer is regulated by isotopic fractionation during nitrate assimilation, which leads to 15N enrichment in the substrate and depletion in the product, because of preferentially consuming 14N relative to 15N when nitrate uptake by phytoplankton (Altabet, 2006; Sigman and Casciotti, 2001). The Rayleigh modle and Steady State model are frequently used to describe mathematically the change of isotopic compositions between the product and the reactant, with the consumption degree of the reactant N pool as a central parameter (Sigman and Casciotti, 2001). The Rayleigh model is suitable for an irreversible reaction occurring within a closed system, in which the substrate supply can be neglected and the isotopic fractionation factor is constant (Sigman and Casciotti, 2001). The equations are expressed as follow for the reactant:
where f is the fraction of the reactant remaining, δ15Ninitial is the δ15N of the initial reactant N pool, and ε is the kinetic isotope effect during the transformation.
The Steady State model refers to a system in which reactant N is continuously supplied and partially consumed, and consumption proceeds with a constant isotope effect ε (Sigman and Casciotti, 2001). The equations are expressed as follow:
During the assimilation of nitrate by phytoplankton, nitrate is a reactant and PN is an accumulating end product. After choosing the salinity-normalized nitrate from deep water below 1000 m to represent the initial nitrate, the $f_{{\rm{NO}}_3^-} $ is calculated according to following equation:
where ${\rm {NO}}_3^- $ represents nitrate, [$ {\rm {NO}}_3^-$] is the concenteation of nitrate.
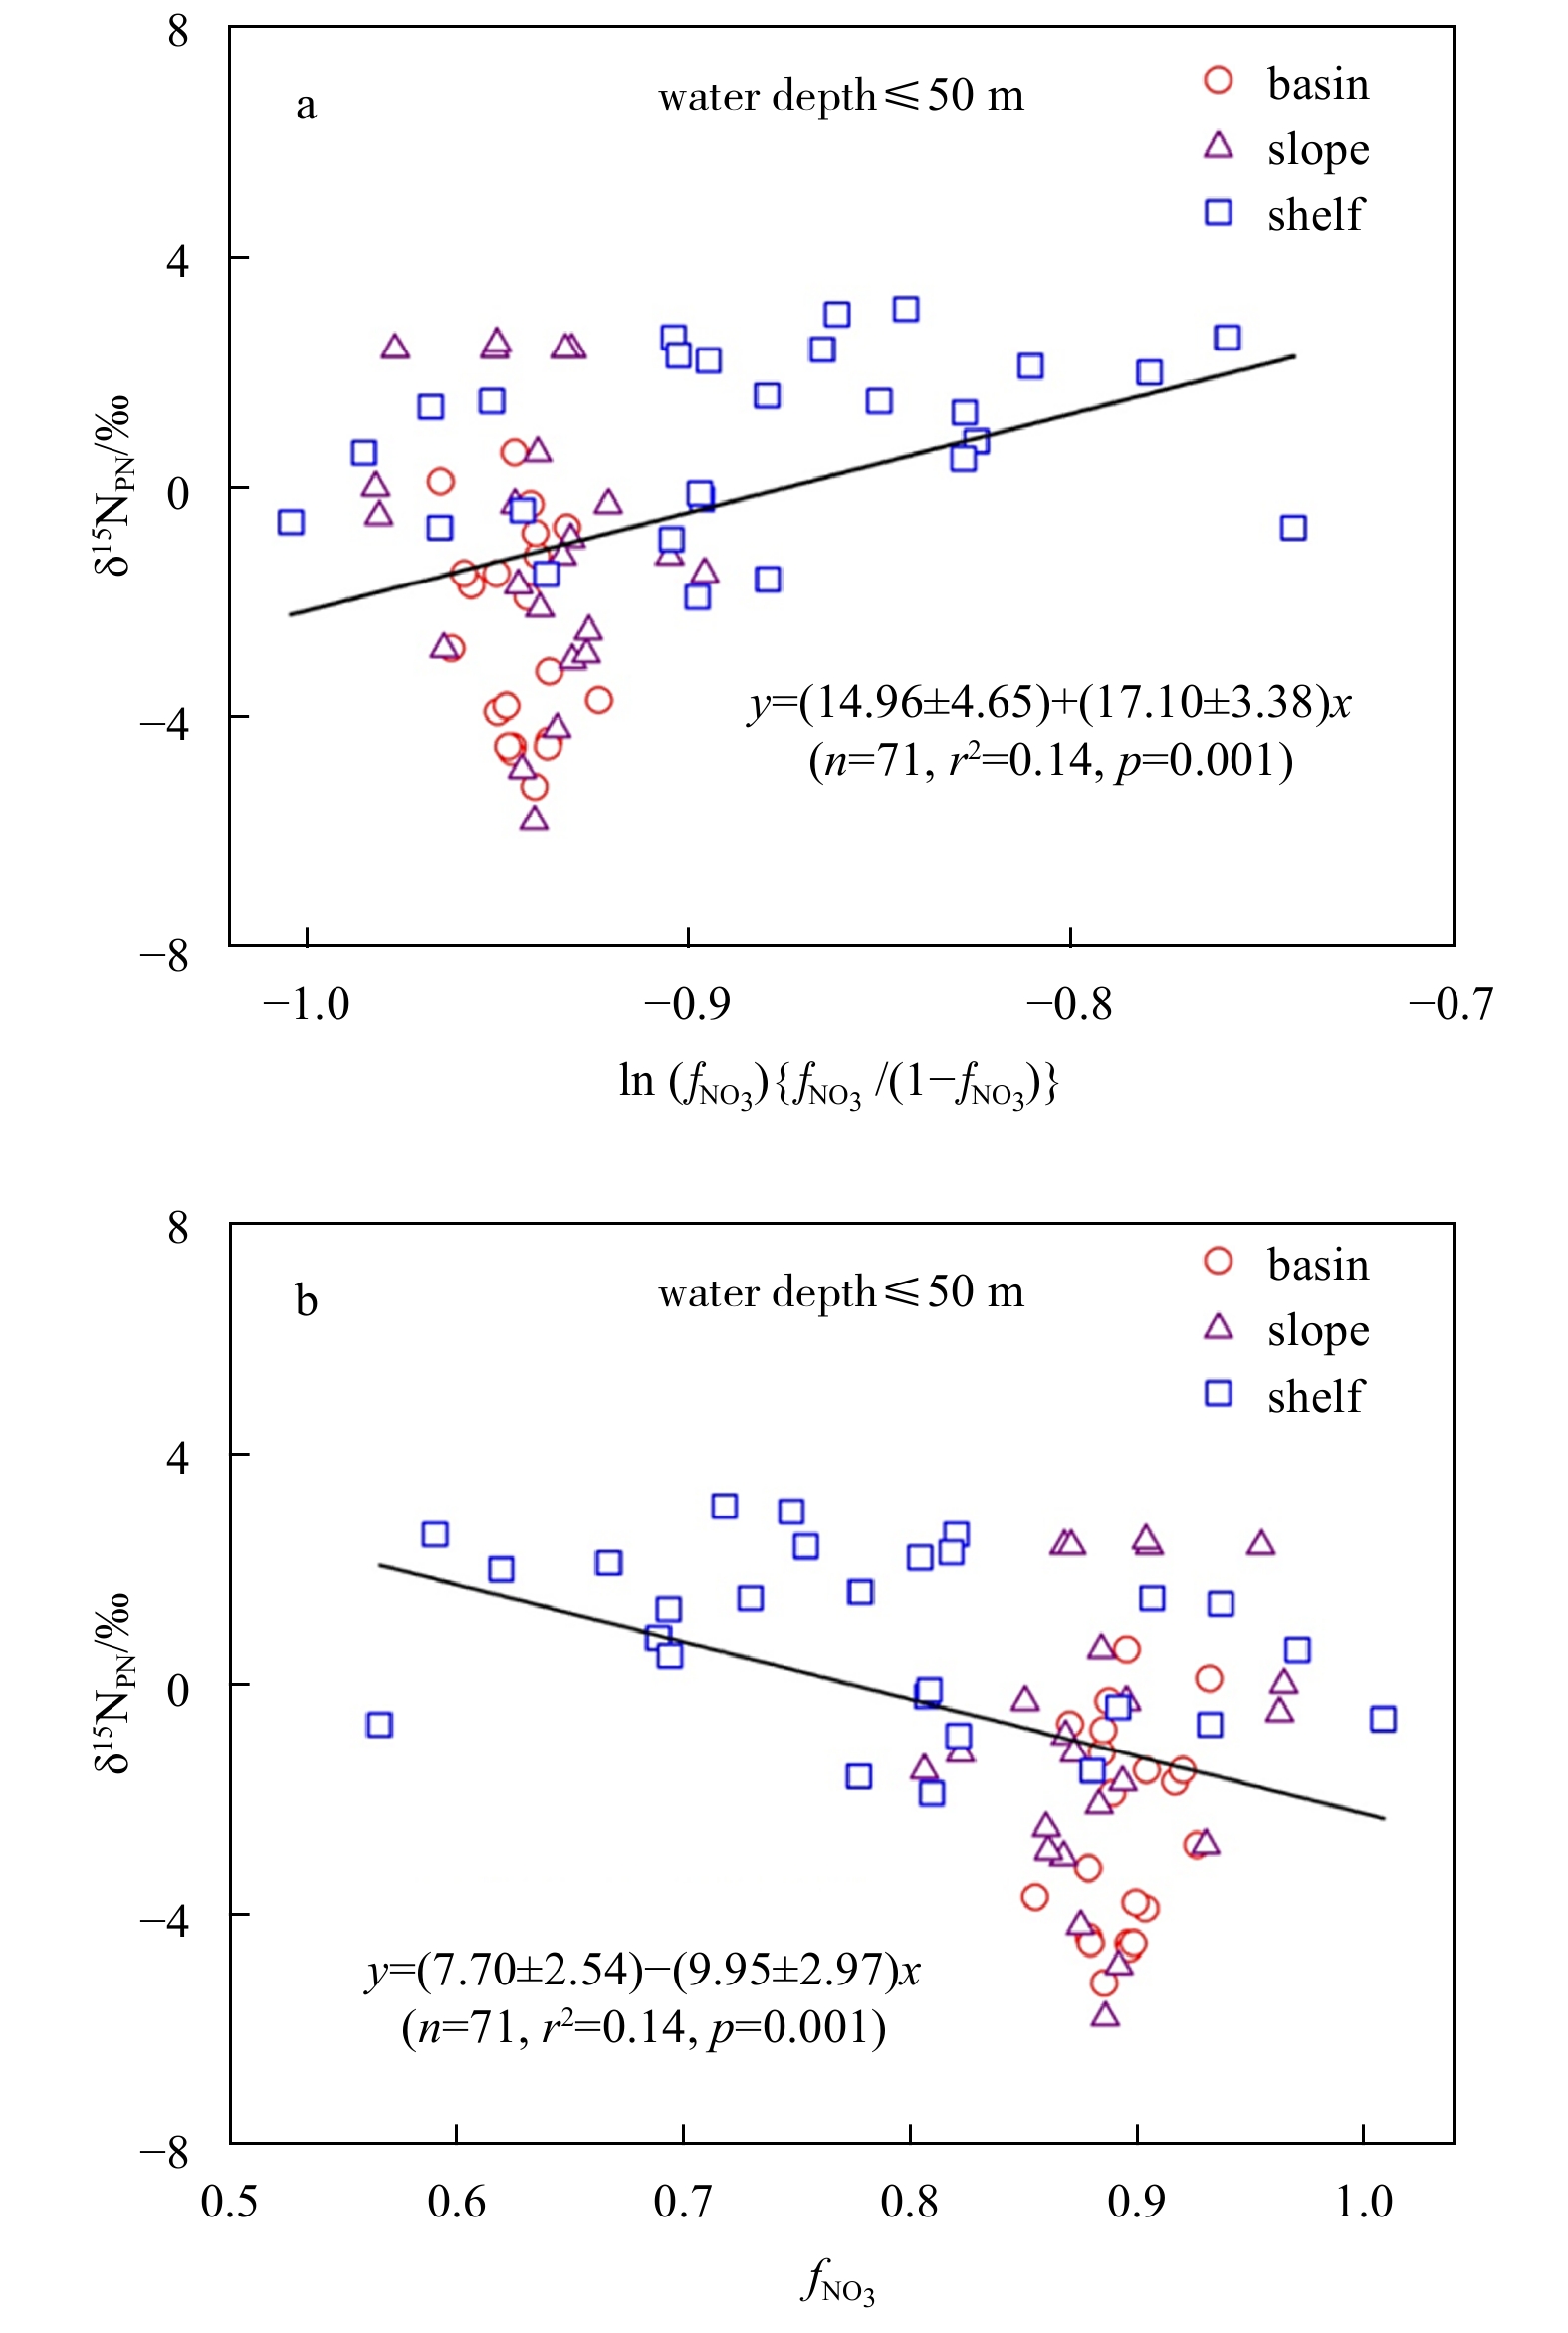
Due to the lack of δ15NO3 data, the fractionation factor ε during nitrate assimilation in the upper 50 m waters was estimated by Eqs (2) and (4) given by both models. In each case, the relationship between δ15NPN and nitrate drawdown may be degraded by complex hydrological and energetic nature in study areas. Our results showed that a linear relationship existed between δ15NPN and ln ($f_{{\rm {NO}}_3^- }$) {$f_{{\rm {NO}}_3^- }$/(1−$f_{{\rm {NO}}_3^-}$)} (p=0.001), and between δ15NPN and $f_{{\rm {NO}}_3^-}$ (p=0.001) (Fig. 7). The calculated ε values ranged between 14‰ and 20‰ by assuming a closed system (Rayleigh model) and between 7‰ and 13‰ by assuming an open system (Steady State model). The relationship between nitrate utilization and δ15N of nitrate has been used to estimate the fractionation factor ε during nitrate assimilation by phytoplankton in the Southern Ocean. For example, the ε values are 8‰, 6‰ and 8‰–9‰ in the Weddell Sea (Biggs et al., 1988), the Polar Antarctic Zone (DiFiore et al., 2009) and the Subantarctic Zone (DiFiore et al., 2006), respectively. Field estimates of ε consistently fall between ~4‰ and 10‰ according to the relationship between nitrate-δ15N and nitrate concentration described by Rayleigh model (Altabet and Francois, 1994a, 2001; DiFiore et al., 2006, 2009; Sigman et al., 2000). Our estimates of ε based on the Steady State model are consistent with above reports, but the estimates based on the Rayleigh model is significantly higher. This implies that the Steady State model is more suitable for describing the relationship between δ15NPN and nitrate drawdown in the Prydz Bay and its adjacent areas. Actually, the PN produced by phytoplankton exports continuously, mostly like an open system. Some studies suggested that the degree of efflux and isotope effect of nitrate assimilation may also vary with algal growth conditions (Granger et al., 2004, 2010; Wada and Hattori, 1978; Waser et al., 1998a). For example, the isotopic fractionation factor under light-limited condition is higher than that under iron-limited or temperature-limited condition for Thalassiosira weissflogii (Granger et al., 2004).
Figure
7.
Nitrogen isotope fractionation during nitrate assimilation in the upper 50 m. a. Rayleigh model and b. Steady State model.
4.3
Estimates for fractionation factor ε during POM remineralization
The profiles of δ15NPN showed an increase with the increasing depth (Table 2; Figs 2f, 3f and 4f) due to isotopic fractionation during POM remineralization in the Prydz Bay and its adjacent areas. The recycle of organic N back to nitrate is comprised of two steps, i.e., the degradation of organic N to ammonium and then the oxidation of ammonium to nitrate, with the latter step called nitrification. This recycling pathway is quite efficient that ammonium does not accumulate in significant quantity in the mixed layer of oceanic systems (Sigman and Casciotti, 2001). Isotopic fractionation of N occurs in both steps. Field studies suggested that bacteria preferentially degrade low δ15NPN, leaving the residual organic matter enriched in 15N (Altabet, 1988; Altabet and McCarthy, 1985, 1986; Saino and Hattori, 1980, 1987; Sigman and Casciotti, 2001). However, in natural marine environments, it is difficult to quantify isotopic fractionation during degradation due to the diverse reactions involved in organic N degradation as well as the heterogeneous composition in organic matter.
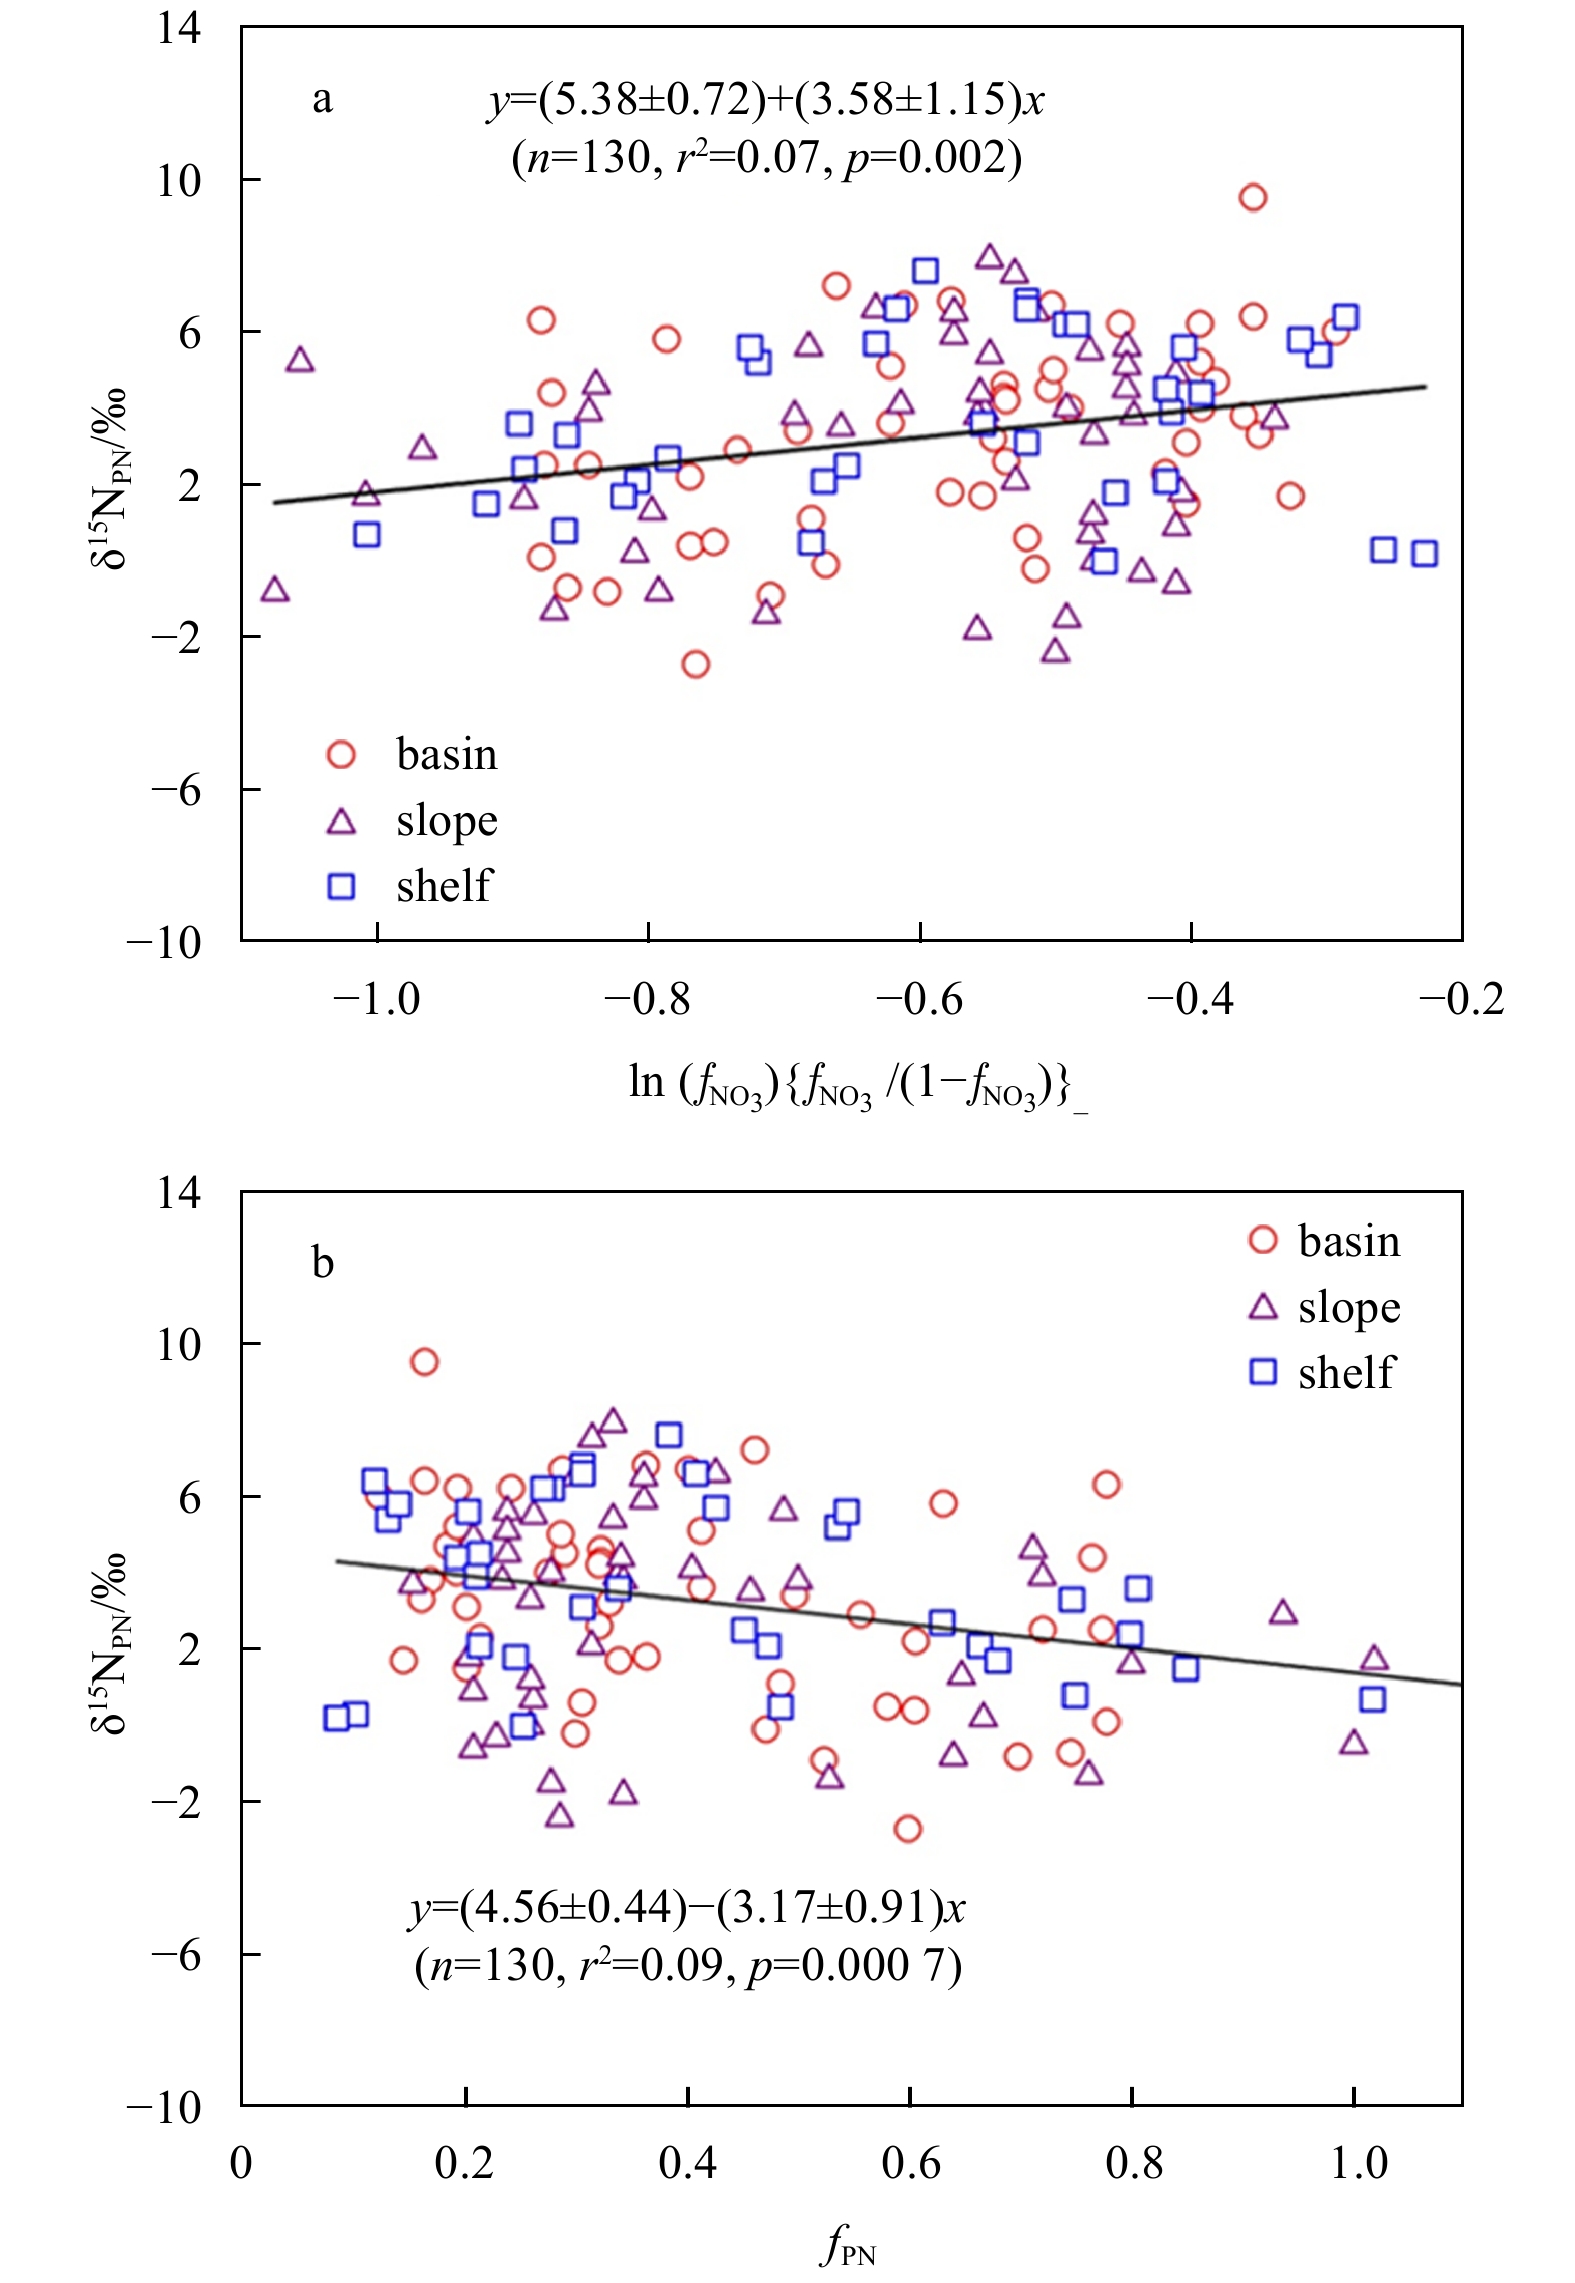
In calculation of the fractionation factor during POM remineralization, PN is not only a reactant, but also an accumulating end product. Here, the average PN content ([PN]) in the upper50 m waters at each station ([PN])≤50 m) is adopted as the initial ([PN])initial, and the fraction of degraded PN (fPN) is calculatedas below:
Eqs (2) and (4) given by the Rayleigh and the Steady State model is used to estimate fractionation factor ε. Our results showed that a linear relationship between δ15NPN and ln (fPN) {fPN/(1−fPN)} (p=0.002) and between δ15NPN and fPN (p=0.0007) occurs (Fig. 8). The ε values ranged between 2.4‰ and 4.6‰ by assuming a closed system (Rayleigh model) and from 2.3‰ to 4.1‰ by assuming an open system (Steady State model). Similar results are obtained by both models. A few laboratory studies have quantified the isotope effects of individual processes in organic matter degration, such as thermal peptide bond cleavage, bacterial amino acid uptake and transamination, and zooplankton ammonium release. A net isotope effect was estimated to be 5 after regarding degradation as a whole process (Sigman and Casciotti, 2001). Considering the similar ε values obtained by both models in the Prydz Bay and its adjacent areas, it is possible that both models are suitable for estimating the fractionation factor during POM remineralization when using δ15NPN as a parameter.
Figure
8.
Nitrogen isotope fractionation during PN remineralization below 50 m. a. Rayleigh model and b. Steady State model.
Applying the two models to estimate the isotope effect, physical and biochemical constraints on systems can ultimately result in very complicated isotopic calculation. The circulation in the Southern Ocean seems to necessitate a more complex model to interpret N isotope data. However, a simple model remains a useful starting point to describe the distribution of N isotopic compositions. Any deviation between the model and data needs to be explored in a hierarchy of more advanced model to resolve additional constraints.
5.
Conclusion
Both assimilation of nitrate and remineralization of PN show an important role in shaping distribution of δ15NPN in the nitrate-repleted Prydz Bay and its adjacent areas. The spatial pattern of δ15NPN in study areas provides a clue to the sources of N supporting biological production, and the major pathways of N transformation. The isotopic fractionation factor during the assimilation of nitrate in the mixed layer is estimated to be 7‰–13‰ by the Steady State model with δ15NPN as a key parameter. The isotopic fractionation factors during POM remineralization in subsurface and deep water are estimated to be 3.6‰ and 3.2‰ by the Rayleigh model and the Steady State model, respectively. To our knowledge, this is the first time to quantify the isotopic fractionation of N during production and remineralization of POM in the Prydz Bay and its adjacent areas.
Acknowledgements
We thank the Second Institute of Oceanography, Ministry of Natural Reaources for generously providing temperature, salinity and nutrient data in this cruise.
Altabet M A. 1988. Variations in nitrogen isotopic composition between sinking and suspended particles: implications for nitrogen cycling and particle transformation in the open ocean. Deep Sea Research Part I: Oceanographic Research Papers, 35(4): 535–554. doi: 10.1016/0198-0149(88)90130-6
[2]
Altabet M A. 1996. Nitrogen and carbon isotopic tracers of the source and transformation of particles in the deep sea. In: Ittekkot V, Schufer P, Honjo S, et al., eds. Particle Flux in the Ocean. New York: John Wiley, 155–184
[3]
Altabet M A. 2006. Isotopic tracers of the marine nitrogen cycle: present and past. In: Volkman J K, ed. Marine Organic Matter: Biomarkers, Isotopes and DNA. Berlin: Springer, 251–293
[4]
Altabet M A, Deuser W G, Honjo S, et al. 1991. Seasonal and depth-related changes in the source of sinking particles in the North Atlantic. Nature, 354(6349): 136–139. doi: 10.1038/354136a0
[5]
Altabet M A, Francois R. 1994a. Sedimentary nitrogen isotopic ratio as a recorder for surface ocean nitrate utilization. Global Biogeochemical Cycles, 8(1): 103–116. doi: 10.1029/93GB03396
[6]
Altabet M A, Francois R. 1994b. The use of nitrogen isotopic ratio for reconstruction of past changes in surface ocean nutrient utilization. In: Zahn R, Pedersen T F, Kaminski M A, et al., eds. Carbon Cycling in the Glacial Ocean: Constraints on the Ocean’s Role in Global Change. Berlin: Springer, 281–306
[7]
Altabet M A, Francois R. 2001. Nitrogen isotope biogeochemistry of the Antarctic Polar Frontal Zone at 170°W. Deep Sea Research Part II: Topical Studies in Oceanography, 48(19–20): 4247–4273
[8]
Altabet M A, McCarthy J J. 1985. Temporal and spatial variations in the natural abundance of 15N in PON from a warm-core ring. Deep Sea Research Part I: Oceanographic Research Papers, 32(7): 755–772. doi: 10.1016/0198-0149(85)90113-X
[9]
Altabet M A, McCarthy J J. 1986. Vertical patterns in 15N natural abundance in the PON from surface waters from a warm-core ring. Journal of Marine Research, 44(1): 185–201. doi: 10.1357/002224086788460148
[10]
Biggs D C, Berkowitz S P, Altabet M A, et al. 1988. A cooperative study of upper-ocean particulate fluxes in the Weddell Sea. Proceeding of the Ocean Drilling Program, 113: 77–85
[11]
Biggs D C, Berkowitz S P, Altabet M A, et al. 1989. Cooperative study of upper ocean particulate fluxes. Proceeding of the Ocean Drilling Program, 119: 109–120
[12]
Carpenter E J, Harvey H R, Fry B, et al. 1997. Biogeochemical tracers of the marine cyanobacterium Trichodesmium. Deep Sea Research Part I: Oceanographic Research Papers, 44(1): 27–38. doi: 10.1016/S0967-0637(96)00091-X
[13]
Chen Mingjian, Shi Maochong, Gao Guoping. 1995. Hydrologic characteristics of the water outside the continental shelf near Prydz Bay. Journal of Ocean University of Qingdao (in Chinese), 25(S1): 235–249
[14]
DiFiore P J, Sigman D M, Dunbar R B. 2009. Upper ocean nitrogen fluxes in the polar Antarctic Zone: Constraints from the nitrogen and oxygen isotopes of nitrate. Geochemistry, Geophysics, Geosystems, 10(11): Q11016
[15]
DiFiore P J, Sigman D M, Trull T W, et al. 2006. Nitrogen isotope constraints on subantarctic biogeochemisry. Journal of Geophysical Research, 111: C08016
[16]
Farrell J W, Pedersen T F, Calvert S E, et al. 1995. Glacial-interglacial changes in nutrient utilization in the equatorial Pacific Ocean. Nature, 377(6549): 514–517. doi: 10.1038/377514a0
[17]
Foster T D, Foldvik A, Middleton J H. 1987. Mixing and bottom water formation in the shelf break region of the southern Weddell Sea. Deep Sea Research Part I: Oceanographic Research Papers, 34(11): 1771–1794. doi: 10.1016/0198-0149(87)90053-7
[18]
Francois R, Altabet M A, Burckle L H. 1992. Glacial to interglacial changes in surface nitrate utilization in the Indian sector of the Southern Ocean as recorded by sediment δ15N. Paleoceanography, 7(5): 589–606. doi: 10.1029/92PA01573
[19]
Francois R, Altabet M A, Yu E F, et al. 1997. Contribution of Southern Ocean surface-water stratification to low atmospheric CO2 concentrations during the last glacial period. Nature, 389(6654): 929–935. doi: 10.1038/40073
[20]
Ganeshram R S, Pedersen T F, Calvert S E, et al. 1995. Large changes in oceanic nutrient inventories from glacial to interglacial periods. Nature, 376(6543): 755–758. doi: 10.1038/376755a0
[21]
Gao Guoping, Dong Zhaoqian, Shi Maochong. 2003. Variation of hydrographic features along 73°E section near Prydz Bay. Journal of Ocean University of Qingdao (in Chinese), 33(4): 493–502
[22]
Granger J, Sigman D M, Needoba J A, et al. 2004. Coupled nitrogen and oxygen isotope fractionation of nitrate during assimilation by cultures of marine phytoplankton. Limnology and Oceanography, 49(5): 1763–1773. doi: 10.4319/lo.2004.49.5.1763
[23]
Granger J, Sigman D M, Rohde M M, et al. 2010. N and O isotope effects during nitrate assimilation by unicellular prokaryotic and eukaryotic plankton cultures. Geochimica et Cosmochimica Acta, 74(3): 1030–1040. doi: 10.1016/j.gca.2009.10.044
[24]
Jacobs S S, Amos A F, Bruchhausen P M. 1970. Ross sea oceanography and Antarctic bottom water formation. Deep Sea Research and Oceanographic Abstracts, 17(6): 935–962. doi: 10.1016/0011-7471(70)90046-X
[25]
Karl D, Letelier R, Tupas L, et al. 1997. The role of nitrogen fixation in biogeochemical cycling in the subtropical North Pacific Ocean. Nature, 388(6642): 533–538. doi: 10.1038/41474
[26]
Le Kentang, Shi Jiuxin, Yu Kangling. 1996. An analysis on water masses and thermohaline structures in the region of Prydz Bay, Antarctica. Oceanologia et Limnologia Sinica (in Chinese), 27(3): 229–236
[27]
Liu Zilin, Cai Yuming, Chen Zhongyuan, et al. 2002. The distribution feature of chlorophyll a and primary productivity in Prydz Bay and its North Sea area during the austral Summer of 1998/1999. Chinese Journal of Polar Research (in Chinese), 14(1): 12–21
[28]
Liu Zilin, Cai Yuming, Ning Xiuren, et al. 2001. Primary productivity and standing stock of phytoplankton in the Prydz Bay and the adjacent northern sea area during the austral Summer of 1999/2000. Chinese Journal of Polar Research (in Chinese), 13(1): 1–12
[29]
Liu Guangshan, Huang Yipu, Chen Min, et al. 2005. Natural abundance of 15N in suspended particulate organic matter from Prydz Bay, Antarctic. Journal of Oceanography in Taiwan Strait (in Chinese), 24(3): 265–273
[30]
Liu Chenggang, Ning Xiuren, Sun Jun, et al. 2004. Size structure of standing stock and productivity and new production of phytoplankton in the Prydz Bay and the adjacent Indian sector of the Southern Ocean during the austral summer of 2001/2002. Haiyang Xuebao (in Chinese), 26(6): 107–117
[31]
Lourey M J, Trull T W, Sigman D M. 2003. Sensitivity of δ15N of nitrate, surface suspended and deep sinking particulate nitrogen to seasonal nitrate depletion in the Southern Ocean. Global Biogeochemical Cycles, 17(3): 1081
[32]
Minagawa M, Wada E. 1986. Nitrogen isotope ratios of red tide organisms in the East China Sea: A characterization of biological nitrogen fixation. Marine Chemistry, 19(3): 245–259. doi: 10.1016/0304-4203(86)90026-5
[33]
Mino Y, Saino T, Suzuki K, et al. 2002. Isotopic composition of suspended particulate nitrogen (δ15Nsus) in surface waters of the Atlantic Ocean from 50°N to 50°S. Global Biogeochemical Cycles, 16(4): 7–1
[34]
Montoya J P, Horrigan S G, McCarthy J J. 1991. Rapid, storm-induced changes in the natural abundance of 15N in a planktonic ecosystem, Chesapeake Bay, USA. Geochimica et Cosmochimica Acta, 55(12): 3627–3638. doi: 10.1016/0016-7037(91)90060-I
[35]
Montoya J P, McCarthy J J. 1995. Isotopic fractionation during nitrate uptake by phytoplankton grown in continuous culture. Journal of Plankton Research, 17(3): 439–464. doi: 10.1093/plankt/17.3.439
[36]
Nakatsuka T, Watanabe K, Handa N, et al. 1995. Glacial to interglacial surface nutrient variation of Bering deep basins recorded by δ13C and δ15N in sedimentary organic matter. Paleoceanography, 10(6): 1047–1061. doi: 10.1029/95PA02644
[37]
Needoba J A, Sigman D M, Harrison P J. 2004. The mechanism of isotope fractionation during algal nitrate assimilation as illuminated by the 15N/14N of intracellular nitrogen. Journal of Phycology, 40(3): 517–522. doi: 10.1111/j.1529-8817.2004.03172.x
[38]
Needoba J A, Waser N A, Harrison P J, et al. 2003. Nitrogen isotope fractionation in 12 species of marine phytoplankton during growth on nitrate. Marine Ecology Progress Series, 255(1): 81–91
[39]
Orsi A H, Johnson G C, Bullister J L. 1999. Circulation, mixing, and production of Antarctic Bottom Water. Progress in Oceanography, 43(1): 55–109. doi: 10.1016/S0079-6611(99)00004-X
[40]
Orsi A H, Wiederwohl C L. 2009. A recount of Ross Sea waters. Deep Sea Research Part II: Topical Studies in Oceanography, 56(13–14): 778–795
[41]
Pennock J R, Velinsky D J, Ludlam J M, et al. 1996. Isotopic fractionation of ammonium and nitrate during uptake by Skeletonema costatum: implications of δ15N dynamics under bloom conditions. Limnology and Oceanography, 41(3): 451–459. doi: 10.4319/lo.1996.41.3.0451
[42]
Pu Shujian, Dong Zhaoqian. 2003. Progress in physical oceanographic studies of Prydz Bay and its adjacent oceanic area. Chinese Journal of Polar Research (in Chinese), 15(1): 53–64
[43]
Pu Shujian, Dong Zhaoqian, Hu Xiaomin, et al. 2000. Water masses and their northward extension in the upper ocean of Prydz Bay, Antarctica. Chinese Journal of Polar Research (in Chinese), 12(3): 157–168
[44]
Qiu Yusheng, Huang Yipu, Liu Guangshan, et al. 2004. Spatial and temporal variations of primary productivity in Prydz Bay and its adjacent sea area, Antarctica. Journal of Xiamen University:Natural Science (in Chinese), 43(5): 676–681
[45]
Rau G H, Sullivan C W, Gordon L I. 1991. δ13C and δ15N variations in Weddell Sea particulate organic matter. Marine Chemistry, 35(1–4): 355–369
[46]
Rigual-Hernández A S, Trull T W, Bray S G, et al. 2015. Seasonal dynamics in diatom and particulate export fluxes to the deep sea in the Australian sector of the Southern Antarctic Zone. Journal of Marine Systems, 142: 62–74. doi: 10.1016/j.jmarsys.2014.10.002
[47]
Saino T, Hattori A. 1980. 15N natural abundance in oceanic suspended particulate matter. Nature, 283(5749): 752–754. doi: 10.1038/283752a0
[48]
Saino T, Hattori A. 1987. Geographical variation of the water column distribution of suspended particulate organic nitrogen and its 15N natural abundance in the Pacific and its marginal seas. Deep Sea Research Part I: Oceanographic Research Papers, 34(5–6): 807–827
[49]
Shi Jiuxin, Zhao Jinping. 2002. Advances in Chinese studies on water masses, circulation and sea ice in the Southern Ocean (1995–2002). Advances in Marine Science (in Chinese), 20(4): 116–126
[50]
Sigman D M, Altabet M A, Francois R, et al. 1999a. The isotopic composition of diatom-bound nitrogen in Southern Ocean sediments. Paleoceanography, 14(2): 118–134. doi: 10.1029/1998PA900018
[51]
Sigman D M, Altabet M A, McCorkle D C, et al. 1999b. The δ15N of nitrate in the Southern Ocean: consumption of nitrate in surface waters. Global Biogeochemical Cycles, 13(4): 1149–1166. doi: 10.1029/1999GB900038
[52]
Sigman D M, Altabet M A, McCorkle D C, et al. 2000. The δ15N of nitrate in the Southern Ocean: Nitrogen cycling and circulation in the ocean interior. Journal of Geophysical Research, 105(C8): 19599–19614. doi: 10.1029/2000JC000265
[53]
Sigman D M, Casciotti K L. 2001. Nitrogen isotopes in the ocean. In: Steele J H, Thorpe S A, Turekian K K, eds. Encyclopedia of Ocean Sciences. London: Academic Press, 1884–1894
[54]
Stagg H M J. 1985. The structure and origin of Prydz Bay and MacRobertson shelf, East Antarctica. Tectonophysics, 114(1–4): 315–340
[55]
Wada E. 1980. Nitrogen isotope fractionation and its significance in biogeochemical processes occurring in marine environments. In: Goldberg F D, Horibe Y, Saruhashi K, eds. Isotope Marine Chemistry. Tokyo: Uchita-Rokkakuho, 375–398
[56]
Wada E, Hattori A. 1978. Nitrogen isotope effects in the assimilation of inorganic nitrogenous compounds by marine diatoms. Geomicrobiology Journal, 1(1): 85–101. doi: 10.1080/01490457809377725
[57]
Wada E, Terazaki M, Kabaya Y, et al. 1987. 15N and 13C abundances in the Antarctic Ocean with emphasis on the biogeochemical structure of the food web. Deep Sea Research Part I: Oceanographic Research Papers, 34(5–6): 829–841
[58]
Waldron H N, Attwood C G, Probyn T A, et al. 1995. Nitrogen dynamics in the Bellingshausen Sea during the austral spring of 1992. Deep Sea Research Part II: Topical Studies in Oceanography, 42(4–5): 1253–1276
[59]
Waser N A D, Harrison P J, Nielsen B, et al. 1998a. Nitrogen isotope fractionation during the uptake and assimilation of nitrate, nitrite, ammonium, and urea by a marine diatom. Limnology and Oceanography, 43(2): 215–224. doi: 10.4319/lo.1998.43.2.0215
[60]
Waser N A, Yin K D, Yu Z M, et al. 1998b. Nitrogen isotope fractionation during nitrate, ammonium and urea uptake by marine diatoms and coccolithophores under various conditions of N availability. Marine Ecology Progress Series, 169(1): 29–41
[61]
Wong A P S, Bindoff N L, Forbes A. 1998. Ocean-Ice shelf interaction and possible bottom water formation in Prydz Bay, Antarctica. In: Ocean, Ice, and Atmosphere: Interactions at the Antarctic Continental Margin. Washington DC: American Geophysical Union, 75: 173–187
[62]
Yu Honghua, Su Jilan, Miao Yutian. 1998. Characteristics of hydrographic structure and source of bottom water in the Prydz Bay and vicinity sea area. Haiyang Xuebao (in Chinese), 20(1): 11–20
[63]
Zhang Run, Zheng Minfang, Chen Min, et al. 2014. An isotopic perspective on the correlation of surface ocean carbon dynamics and sea ice melting in Prydz Bay (Antarctica) during austral summer. Deep Sea Research Part I: Oceanographic Research Papers, 83: 24–33. doi: 10.1016/j.dsr.2013.08.006
Hasitha Siriwardana, R.S.M. Samarasekara, Damsara Anthony, et al. Measurements and analysis of nitrogen and phosphorus in oceans: Practice, frontiers, and insights. Heliyon, 2024, 10(7): e28182. doi:10.1016/j.heliyon.2024.e28182
2.
Dingyong Huang, Jianjia Wang, Peng Tian, et al. The distribution and controlling factors of meiofaunal community in Prydz Bay, Antarctica. Deep Sea Research Part II: Topical Studies in Oceanography, 2022, 202: 105107. doi:10.1016/j.dsr2.2022.105107
Chunyan Ren, Min Chen, Laodong Guo, Jian Zeng, Renming Jia, Xiao Liu, Minfang Zheng, Yusheng Qiu. Nitrogen isotopic fractionation of particulate organic matter production and remineralization in the Prydz Bay and its adjacent areas[J]. Acta Oceanologica Sinica, 2020, 39(12): 42-53. doi: 10.1007/s13131-020-1698-6
Chunyan Ren, Min Chen, Laodong Guo, Jian Zeng, Renming Jia, Xiao Liu, Minfang Zheng, Yusheng Qiu. Nitrogen isotopic fractionation of particulate organic matter production and remineralization in the Prydz Bay and its adjacent areas[J]. Acta Oceanologica Sinica, 2020, 39(12): 42-53. doi: 10.1007/s13131-020-1698-6
Table
2.
Temperature, salinity, nitrate, nitrite, ammonium, DIN, PN and δ15N in the mixed layer, subsurface layer and deeper layer in the basin, the slope and the shelf (the variables are expressed as the mean value±standard deviation)
Figure 1. Sampling locations in the Prydz Bay and its adjacent areas during summer 2013.
Figure 2. Vertical profiles of temperature, salinity, nitrate, ammonium, PN, δ15NPN in the basin region.
Figure 3. Vertical profiles of temperature, salinity, nitrate, ammonium, PN, δ15NPN in the slope region.
Figure 4. Vertical profiles of temperature, salinity, nitrate, ammonium, PN, δ15NPN in the shelf region.
Figure 5. Distributions of temperature (a), salinity (b), nitrate (c), ammonium (d), PN (e), δ15NPN (f) at Section P3 (68°E) (g) in the Prydz Bay and its adjacent areas.
Figure 6. Distributions of temperature (a), salinity (b), nitrate (c), ammonium (d), PN (e), δ15NPN (f) at Section P7 (78°E) (g) in the Prydz Bay and its adjacent areas.
Figure 7. Nitrogen isotope fractionation during nitrate assimilation in the upper 50 m. a. Rayleigh model and b. Steady State model.
Figure 8. Nitrogen isotope fractionation during PN remineralization below 50 m. a. Rayleigh model and b. Steady State model.


 DownLoad:

 DownLoad:


 DownLoad: