Zhentao Chong, Min Zhang, Jiahong Wen, Luyang Wang, Jie Mi, Jeremy Bricker, Stanley Nmor, Zhijun Dai. Coastal protection using building with nature concept: A case study from Chongming Dongtan Shoal, China[J]. Acta Oceanologica Sinica, 2021, 40(10): 152-166. doi: 10.1007/s13131-021-1761-y
Citation:
Zhentao Chong, Min Zhang, Jiahong Wen, Luyang Wang, Jie Mi, Jeremy Bricker, Stanley Nmor, Zhijun Dai. Coastal protection using building with nature concept: A case study from Chongming Dongtan Shoal, China[J]. Acta Oceanologica Sinica, 2021, 40(10): 152-166. doi: 10.1007/s13131-021-1761-y
Zhentao Chong, Min Zhang, Jiahong Wen, Luyang Wang, Jie Mi, Jeremy Bricker, Stanley Nmor, Zhijun Dai. Coastal protection using building with nature concept: A case study from Chongming Dongtan Shoal, China[J]. Acta Oceanologica Sinica, 2021, 40(10): 152-166. doi: 10.1007/s13131-021-1761-y
Citation:
Zhentao Chong, Min Zhang, Jiahong Wen, Luyang Wang, Jie Mi, Jeremy Bricker, Stanley Nmor, Zhijun Dai. Coastal protection using building with nature concept: A case study from Chongming Dongtan Shoal, China[J]. Acta Oceanologica Sinica, 2021, 40(10): 152-166. doi: 10.1007/s13131-021-1761-y
School of Environmental and Geographical Sciences, Shanghai Normal University, Shanghai 200234, China
2.
State Key Laboratory of Estuarine and Coastal Research (East China Normal University), Shanghai 200241, China
3.
Department of Hydraulic Engineering, Delft University of Technology, 2628 CN Delft, The Netherlands
4.
Department of Civil & Environmental Engineering, University of Michigan, Ann Arbor, MI 48109, USA
5.
Department of Estuarine and Delta Systems, Royal Netherlands Institute for Sea Research, 4400 AC Yerseke, The Netherlands
Funds:
The National Natural Science Foundation of China under contract Nos 51761135024, 42171282 and 41701001; the Key Projects of Intergovernmental Science and Technology Innovation Cooperation of the Ministry of Science and Technology in China under contract No. 2018YFE0109900; the International Science & Technology Cooperation Foundation Projects of Shanghai Science and Technology Commission under contract No. 19230712400; the China Postdoctoral Science Foundation under contract No. 2018M630414.
With climate change and rising sea levels, the coastal zone’s flood risk is deteriorating. Previous researches have shown a gradually degrading capacity of traditional hard engineering structures (e.g., seawall, dikes) on flood mitigation due to problems such as land subsidence and insufficient maintenance. To remedy the defects, the “building with nature concept” for coastal protection with saltmarshes was examined by combining field measurements and numerical simulations. The advantages of saltmarsh over traditional seawall on flood protection was demonstrated from the perspective of both flood area mitigation and economic gain, based on scenario simulations. Results show that tidal wetlands are essential in mitigating significant wave heights (Hs) and current velocities even during storm conditions. The storm wave and current velocity reduction ratio ($R{R}_{{\rm{w}}}$ and $R{R}_{{\rm{c}}}$) by saltmarshes on Chongming Dongtan Shoal (CMDS) during Typhoon 9711 is approximately 11% and 51%, respectively. The wave and current mitigation by Scirpus mariqueter are more efficient than Spartina alterniflora and Phragmites australis during measurements in 2010, which were approximately 0.3 m and 0.2 m/s, 0.125 m and 0.155 m/s, 0.086 m and 0.128 m/s per kilometer width, respectively. The summer saltmarsh area 54.2 km2 on CMDS protects approximately 32 km2 land area behind the seawall from being flooded, equivalent to the seawall heightening of approximately 0.42 m on equivalent flood mitigation. The performance of cost-and-benefit analysis shows a relatively higher (by 3%–7%) net present value (NPV) and a higher (by 1.5 times) benefit-cost ratio (BC) of nature-based solution (i.e., saltmarsh restoration) compared with traditional hard engineering solution (i.e., seawall construction). Thus, building seawall with nature, such as a hybrid flood protection measure, should be implemented in the future coastal redesign and maintenance.
With rising sea levels and intensifying extreme storms, the risk of coastal flood disaster is increasing (Temmerman et al., 2013). Improving coastal flood management capacity is an urgent task to build resilient cities (Wang et al., 2018). The sustainability of traditional coastal protection measures (e.g., seawalls, dikes, breakwaters) has been questioned widely due to the high maintenance cost and the increasing future risk uncertainties caused by climate changes (Temmerman et al., 2013). Alternatively, the coastal wetlands, which help mitigate waves, are increasingly recognized as a promising measure for coastal flood risk reduction by improving the city’s resilience to extreme events (Liu et al., 2013; Wamsley et al., 2010; Zhang et al., 2012). Such a new concept of building with nature solution for coastal flood protection has increasingly become the research hotspot recently (Sutton-Grier et al., 2015).
Many studies show that vegetated foreshore is a natural barrier for coastline, buffering the waves and surges even during storm conditions (Loder et al., 2009). Zhang et al. (2012) demonstrated the importance of mangroves in South Florida to help mitigating hurricane storm surges from the Gulf of Mexico. Loder et al. (2009) discovered the effect of wetlands on storm surge mitigation, which depends closely on the increase of saltmarsh continuity and roughness. Hu et al. (2015) studied the response of storm surge to vegetation metrics at the Breton Sound Estuary in southeast Louisiana and found the importance of stem height and density on storm surge attenuation. The vegetation species and tidal morphology were also proved to be influential on wave mitigation (Hu et al., 2015; Stark et al., 2016). Recently, Vuik et al. (2016) and Leonardi et al. (2018) concluded that the hybrid measure combining tidal flat and seawall is a promising sustainable measure for storm flood prevention, not only effective for storm flood reduction but also providing great ecological service values. However, Vuik et al. (2018) assessed the failure probability of tidal wetlands and pointed out that the uncertainty of vegetated foreshore on flood mitigation is a key limitation to the widespread application of ecology-based measure.
Wetland protecting the coastline mainly depends on their functions during extreme storm surge conditions. Marsh platform and vegetation canopy are the critical factors mitigating tidal waves (Wamsley et al., 2010). Wave attenuating by marsh platform (i.e., the morphology) depends on platform elevation, tidal flat width, and the soil anti-erosion capability (Gittman et al., 2014; Vuik et al., 2016); while wave mitigating by vegetation canopy relies on the vegetation biosignature (Dalrymple et al., 1984; Cao et al., 2015). In terms of tidal morphology function, saltmarsh shows strong anti-erosion ability as long as it is in the seeding germination or seeding expansion stage (Leonardi et al., 2016; Vuik et al., 2019). In terms of vegetation canopy function, the stems and leaves are proven to effectively slow down the current, weaken the turbulence, and enhance sedimentation (Christiansen et al., 2000). Dense and tall vegetation is more effective in wave dissipating, either in submerged (Vuik et al., 2016) or unsubmerged (Anderson and Smith, 2014) conditions.
Numerical simulation and field measurements are effective methods examining storm wave mitigation by saltmarshes (Temmerman et al., 2012; Wamsley et al., 2010). The performance of large-scale wetland modeling depends on the proper setting of the bottom friction and bulk drag coefficient, e.g., following land-use coverages, vegetation species, density, and height (Loder et al., 2009; Narayan et al., 2017; Rahdarian and Niksokhan, 2017; Wamsley et al., 2010; Zhang et al., 2012). Wamsley et al. (2010) set the Manning friction by classifying the marshes following salinity differences, e.g., saline, brackish, intermediate, and fresh marshes. On the other hand, Loder et al. (2009) presented the Manning frictions following a traditional open channel hydraulic experiment (Chow, 1959) and divided the vegetation into four types, i.e., high grass, scattered brush, dense brush, and dense woods, ranging from 0.035 to 0.15. Narayan et al. (2017) set Manning frictions of herbaceous and woody to 0.04 and 0.1 according to the Manning coefficient selection guide provided by the U.S. geological survey (Arcement and Schneider, 1989).
Besides, cost and benefit are considered as two crucial factors in planning and decision making for sustainable coastal protection measures. Liu et al. (2019b) found that an average loss of CNY 9 million is reduced per storm event by building each km of traditional seawalls; whereas, an average loss of CNY 82 million can be reduced per storm event by restoring each km2 of coastal wetland, after evaluating 127 storm flooding events from 1989 to 2016 in China. Although significant efforts in cost-benefit estimation have been made, e.g., Vuik et al. (2019) proposed a new method of cost-benefit estimation by combining multiple factors, such as wave dissipation, sedimentation, dike failure probability, construction and maintenance cost, and the value of the protected areas. Many important factors, such as intertidal elevation, width and vegetation friction, have not been fully understood. To perform a comprehensive assessment of nature-based solutions, different saltmarshes, geomorphologies, and storm strengths on flood mitigation were considered in a validated numerical model. Then, the long-term cost and benefit analysis of both hard and soft flood-control measures were evaluated.
The research aim of this study is to (1) investigate how coastal wetlands reduce tidal wave and flood risks based on a coupled hydrodynamic model; (2) study the relative importance between seawall heightening and wetland restoration using cost-benefit analysis, and evaluate their equivalent conversion relationships on flood protection. Specifically, first the study area and tidal marshes were briefly introduced in Section 2. Modeling setups and scenario simulations are described in Section 3. Then, modeling results, the effect of saltmarsh and seawall on storm flood mitigation, and their cost and benefit analysis are presented in Section 4. The pros and cons of building seawall with nature solution compared with traditional seawall is discussed in Section 5. Finally, the summary and conclusions concerning building seawall with hybrid solutions are presented in Section 6.
2.
Study area
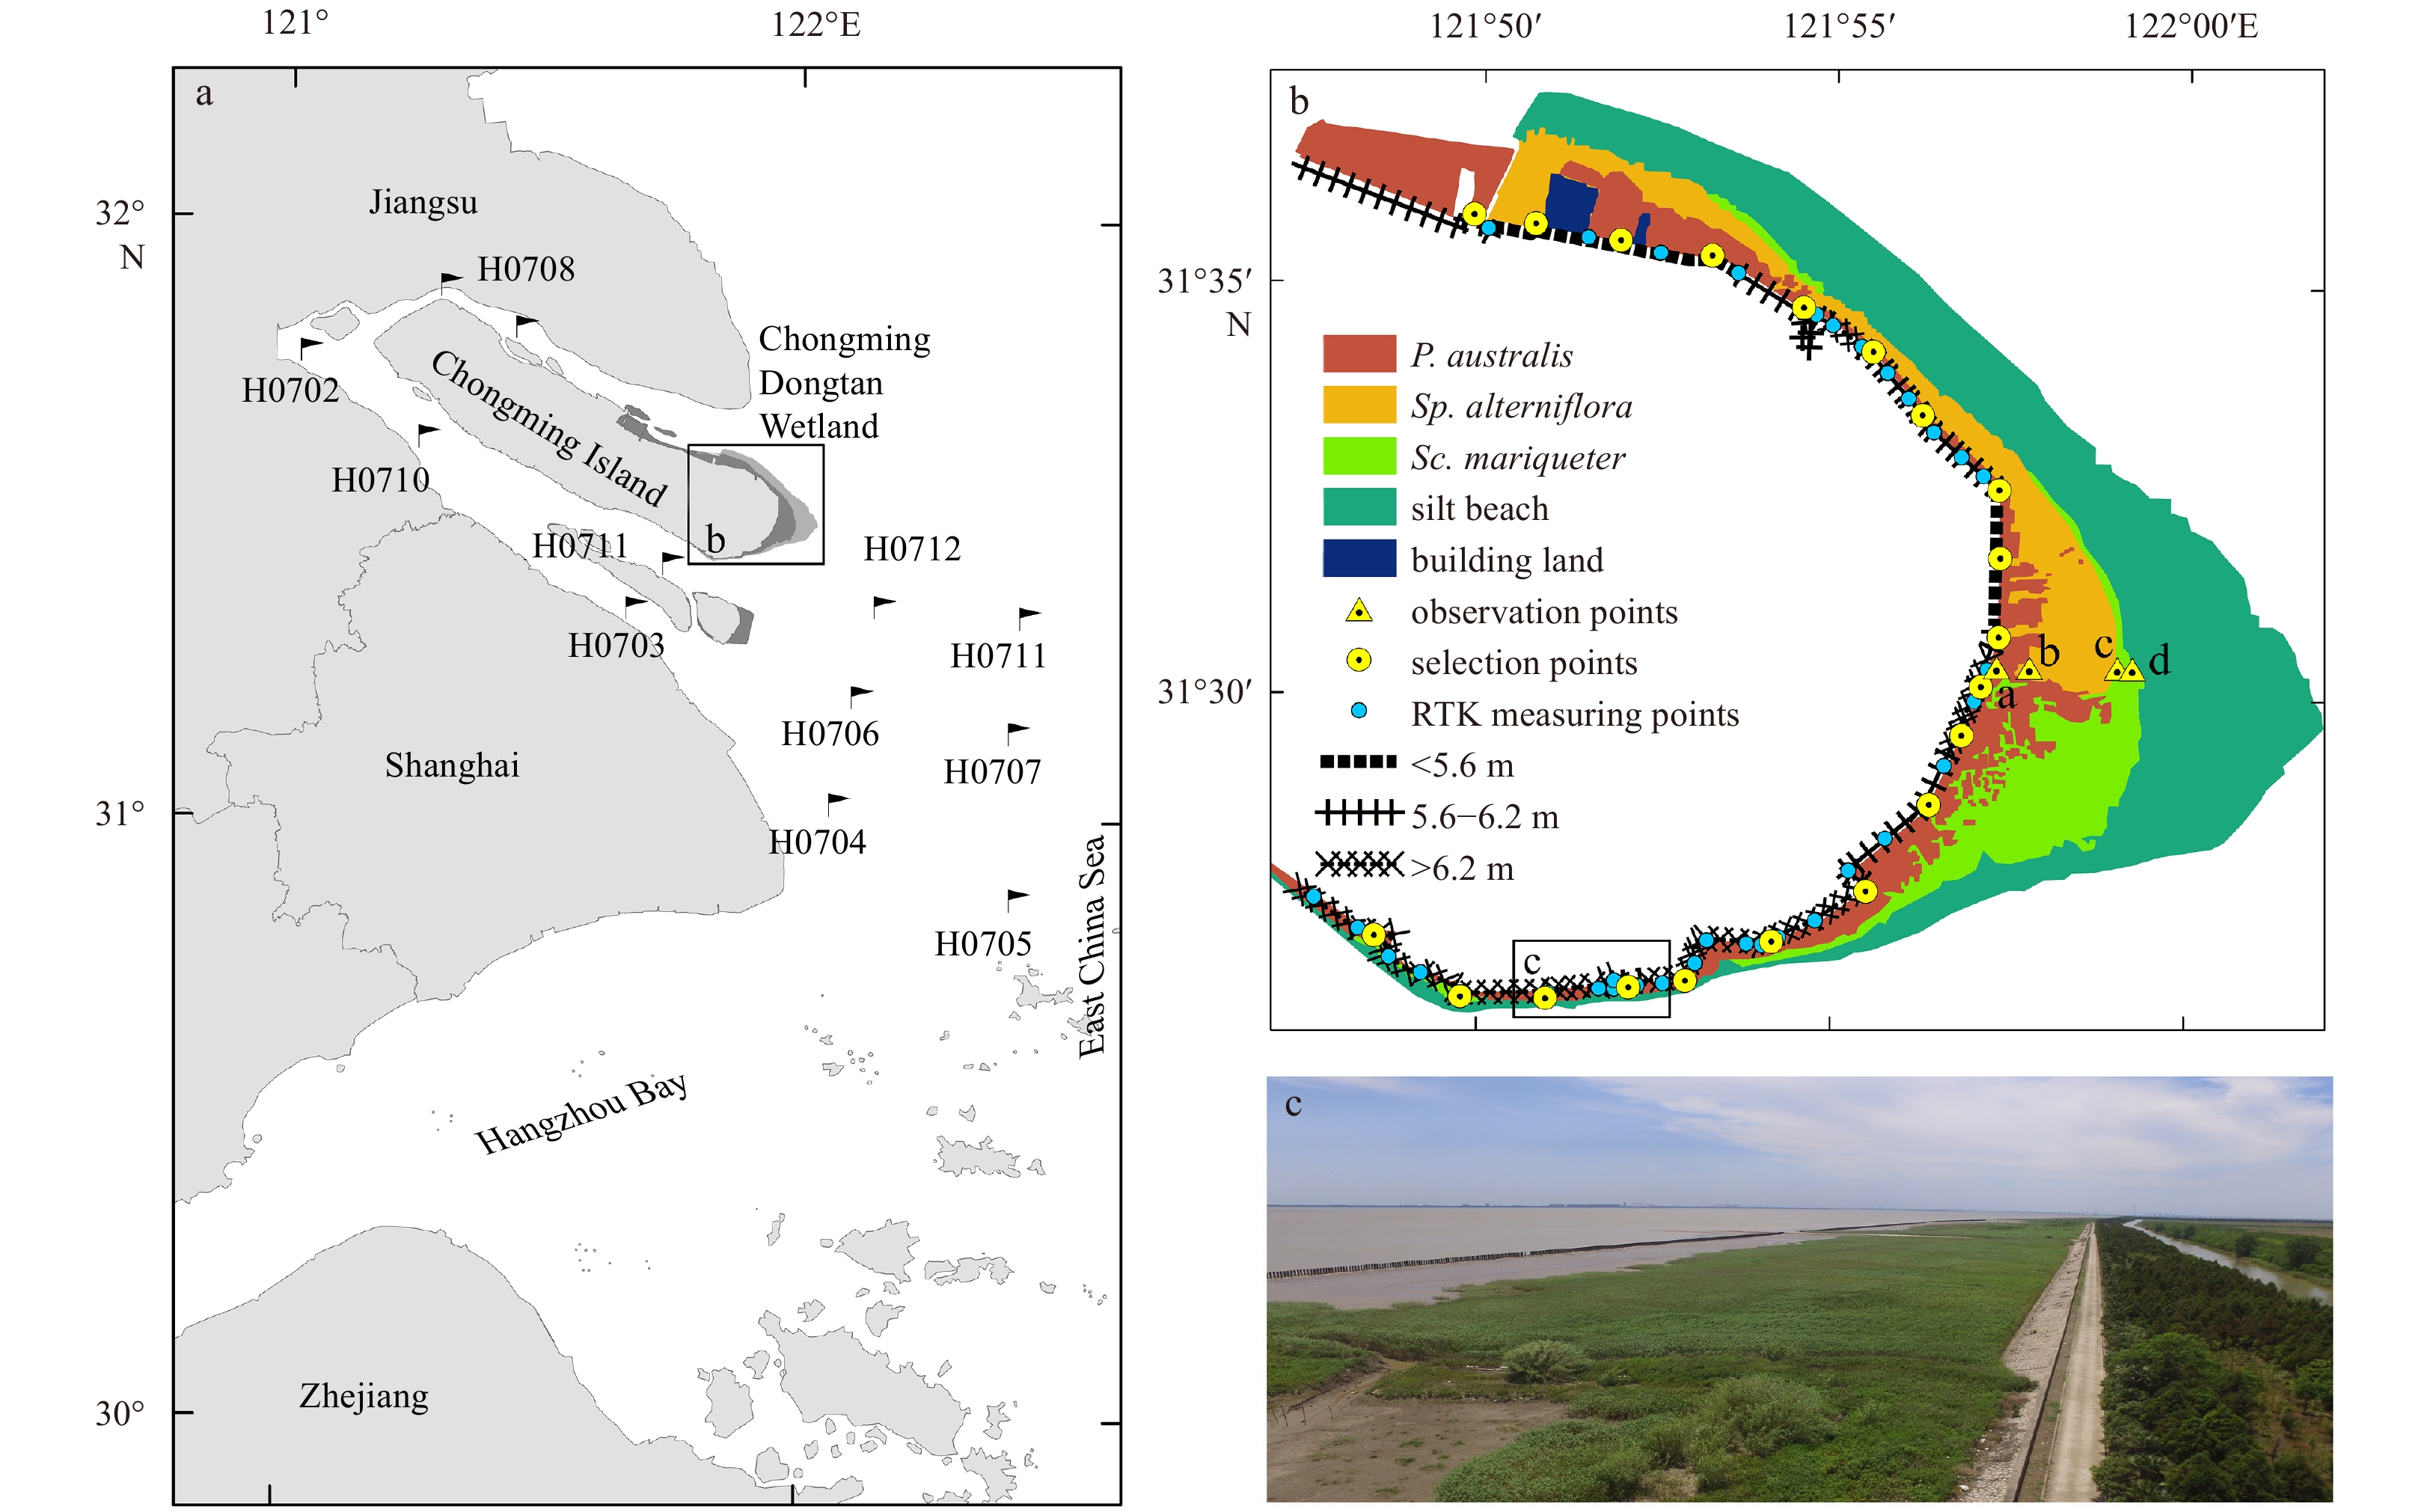
The coastal wetlands in China consist of eight types, including shallow waters, subtidal zone, saltmarshes, silt-muddy beaches, rocky coast, boulder and shingle foreshore, mangrove, and coral reef, are observed from north to south coast (Liu et al., 2019a, b). The study area, the Chongming Dongtan wetland, covers an area of 335.8 km2 (31°26′–31°37′N, 121°46′–122°02′E), is located on the eastern Chongming Island (the China’s largest estuarine alluvial island) in the Changjiang River Estuary (Fig. 1). The sediment on Chongming Dontan Shoal (CMDS) mainly consists of silt and mud (Zhou et al., 2016). The frontier of the wetland expands fast eastward at a rate of approximately 200 m/a, with an area increasing rate of roughly 2.80 km2/a (Yao et al., 2017).
Figure
1.
Sketch map showing the study area. a. The location of Chongming Dongtan Shoal and the observation location of survey vessels in Changjiang River Estuary. b. The seawall, vegetation pattern, and the location of field measurement on Chongming Dongtan Shoal. c. An aerial view of the seawall and coastal marshes at location 31°26′32′′N, 121°52′20′′E.
Three typical saltmarsh communities are observed from the dike to the bare tidal flat (Fig. 1b). Phragmites australis and Spartina alterniflora communities mainly occupy the high tidal flat; Sp. alterniflora and scripus are abundant on the middle tide flat; Scirpus mariqueter, a pioneer species occupies the low tidal flat. The lower part of low tide flat is mostly muddy and diatoms dominated (Yan et al., 2014). The scripus mainly consists of Sc. mariqueter, Carex scabrifolia, and Scirpus triqueter, forming single or mixed dominant communities following salinity and elevation change. Since Sp. alterniflora was artificially introduced to CMDS in 1995, it competes with local species scripus and P. australis, forming the three-dominant plant communities on CMDS. Spartina alterniflora invasion is found to exert negative impacts on invertebrate communities, waders and fish habitats (Chen et al., 2004). However, Sp. alterniflora is thick and tall vegetation, thus benefits sediment attraction and coastal protection. Table 1 generally summarizes the metrics of the three typical wetland vegetations on CMDS.
Table
1.
Vegetation metrics on Chongming Dongtan Shoal
The research method mainly comprises four steps, including (1) determination of roughness Manning coefficient for different saltmarsh species on CMDS based on vegetation metrics derived from field measurements; (2) quantifying the effect of saltmarsh on wave attenuation under storm surge conditions with validated numerical model and field measurements; (3) estimating the equivalent flood protection relationship between the saltmarsh restoration and seawall heightening on CMDS; (4) finally, assessing the costs and benefits of the two measures (i.e., saltmarsh restoration vs. seawall construction) by estimating the net present value (NPV) and cost-benefit ratio (BC).
3.1
Data sources
The atmosphere model uses the 10 m height wind force, obtained from the European Centre for Medium Range Weather Forecasts (ERA5, 2020), which are corrected by the analytical wind field generated from the Holland typhoon model (Holland, 1980). The bathymetry of ocean model is constructed from three sources, i.e., the topographic data of General Bathymetric Chart of the Oceans (GEBCO) to set the continental shelf area (resolution 30"×30"), and the measured navigation charts 2008 and 2007 (scale 1:50 000) to set the Changjiang River Channel and the bar area, respectively. The bathymetry of the coastal model is constructed with a measured topographic map (scale 1:10 000), provided by Shanghai Measuring and Drawing Institute, to set the land area above water. The saltmarshes on CMDS are derived from the interpretation of satellite images obtained in August 2010. The seawall height is set to the elevation before Typhoon Winnie in 1997, provided by Shanghai Dike Management Office. The land use/coverage data is provided by Shanghai Measuring and Drawing Institute. All the terrain and seawall elevations are corrected to the 1985 National Elevation Benchmarks.
Other data are from the field measurements. The metrics of vegetation P. australis, Sp. alterniflora, and Sc. mariqueter for typical summer conditions on CMDS were detected by RIEGL 3D laser scanner, with the vertical and horizontal accuracy 1 mm and 2 mm, respectively. Wave gauges (Ocean Sensor Systems, Inc.) and Acoustic Doppler Current Profilers (ADCPs, SonTek-500) were deployed at four locations at the edges between marsh species P. australis, Sp. alterniflora and Sc. mariqueter (i.e., platform stations a, b, c, d), to investigate the spatial differences in wave and current mitigation (Fig. 1b). The pressure sensors on the gauges were mounted approximately 10 cm from the bottom and recorded with a frequency of 5 Hz, on September 5, 2010 over a period of 7 min, every 15 min, continuously.
3.2
Model setup
A model nesting and coupling technique is used to transfer driving forces from the upper-level model (the atmosphere model) to the middle-level models (the ocean model) and finally to the lower-level model (the coastal model) (Wang et al., 2019). The coupling of the atmosphere model and ocean model is through a process of wind-wave interactions (Donelan et al., 1993; Zhang et al., 2018). On the one hand, the typhoon wave generation is by the force of wind shear stress; on the other hand, the waves will also change the sea-surface roughness, thus affecting the wind shear stress as feedback. The wind shear stress ($ {\tau }_{{\rm{w}}x} $ and $ {\tau }_{wy} $) in x and y directions are calculated by the formula:
where $ {C}_{\mathrm{w}} $ is wind force drag coefficient, $ {\rho }_{{\rm{a}}} $ is atmosphere density, $ {W}_{x} $ and $ {W}_{y} $ are wind velocities in x and y directions. Donelan et al. (1993) experimentally proved that both wind force and wave condition determine sea surface roughness, with $ {C}_{\mathrm{w}} $ is formulated as:
where g is gravity acceleration, $ \overrightarrow{W} $ is the wind velocity, $ {\omega }_{\mathrm{p}} $ is the peak spectral frequency, $ {k}_{\mathrm{p}} $ is the wave number of the peak frequency.
For hydrodynamics modeling, TELEMAC solves shallow water equations based on irregular triangular mesh, which is suitable for fitting the irregular coastlines (Hashemi et al., 2015). While MIKE 21 calculates urban flood propagation based on a square computational grid, which is suitable for fitting the urban regular landscapes (Ahn et al., 2019; Wang et al., 2019). In order to generate coastal flooding with storm surge and wave overtopping, a lateral couple technique is applied between TELEMAC and MIKE21 (Wang et al., 2019). For storm surge and wave modeling, tide-wave interactions are activated in the ocean model, i.e., tidal current provided by TELEMAC and wave propagation provided by TOMAWAC are bi-directionally coupled through the force of wave radiation stress (Hashemi et al., 2015; Zhang et al., 2018). First, TELEMAC solves the tidal flow equations, and the results (i.e., flow velocity and water level) are fed into TOMAWAC to derive the wave radiation stress, which will, in return, react on the tidal current calculation in TELEMAC, affecting the flow velocities and water levels directly. Thus, current-wave modeling is directly combined in the ocean model. Second, the coupling of the ocean model and coastal model is based on a laterally connecting between ocean and land using an overtopping formula similar to the weir-flow equation (Ahn et al., 2019; Wang et al., 2019). Third, the unsteady flows for urban flood simulation are solved with continuity and momentum equations in both x and y directions in MIKE. Detailed calculation about the radiation stress and two-dimensional urban flood propagation, readers are referred to Longuet-Higgins and Stewart (1964) and Wang et al. (2019).
Other important modeling setups are the boundary conditions. They are configured on the mesh of the ocean model, which is constructed with irregular triangles covering the entire East China Sea and part of the Yellow Sea (Fig. 2b). The advantage of using the triangular mesh is to follow the changing coastline flexibly, with varying resolutions from 200 m nearshore to over 20 000 m offshore. The uniform bottom friction coefficient (Nikuradse=0.001 m) and the calculation time step of 90 s is applied in the iterative calculation. The coastal model is constructed with a rectangular grid covering the entire CMDS (Fig. 2c). The resolution is set to 100 m, and the calculation time step is set to 15 s. For details about modeling setups, readers can refer to other publications, such as Zhang et al. (2018) and Wang et al. (2019).
Figure
2.
The modeling area. a. The path of 9711 Typhoon Winnie. b. The irregular triangular mesh coverage in the ocean model. c. The land elevation of Chongming Dongtan Shoal used in the coastal model.
The model performance is calibrated and validated with the data obtained from boat measurements in the Changjiang River Estuary. Twelve observation locations (Fig. 1a) were placed from the outside to the inside of the estuary. The observations were implemented, covering a complete spring-neap tidal cycle. First, six survey boats were placed at H0702-H0704, H0706, H0712, and H0714 to perform a 26 h synchronous hydrological observation during the neap tide on July 22–24, 2007. Then the six boats were replaced simultaneously to H0705, H0707, H0708, H0710, H0711, and H0713 for another 26 h synchronized observations during the spring tide on July 29–31, 2007. The measuring instruments are ADCPs and Direct Reading Current Meter (SLC9-2), with the measuring interval of 1 h. Finally, the derived flow velocity and flow direction at different depths (0 h, 0.2 h, 0.4 h, 0.6 h, 0.8 h, and 20 cm above the seabed) were averaged for comparison with the numerical modeling results.
The free surfaces and velocities extracted from the modeling results are compared with the measurements at the same location during the same period (Figs 3 and 4). The observation of spring tide is used for calibration, and the neap tide is used for validation. In order to quantify the error between simulation and measurement, sensitivity analysis is presented by calculating the correlation coefficients (R2). Results show no noticeable phase difference, and the R-squared value (R2) is above 0.8, indicating the excellent numerical modeling performance. After calibration, the Nikuradse bottom friction coefficient is set to 0.001 m, and the horizontal diffusion coefficient is set to 0.1 kg/(m·s).
Figure
3.
The comparison of free surface elevation and current velocity between modeling results and field observation during neap tide.
Following Hasselmann and Collins (1968) and Vuik et al. (2019), wave attenuation by vegetation bulk drag force is not included in the coastal model based on the vegetation module, but using an adapted Manning roughness coefficient according to the land-use coverages and plant species (Suzuki et al., 2019). The simplified Manning friction method is not reproducing the physics of wave attenuation by saltmarsh (including both bulk drag force and bottom friction), but it is proved to be useful after proper calibration (Vuik et al., 2019; Willemsen et al., 2020). Based on field scanning of saltmarsh by RIEGL3D detection (Figs 5a and b), the average plant height, rod diameter, density, and canopy size for marsh species P. australis, Sp. alterniflora, and Sc. mariqueter representative for summer conditions on CMDS are shown in Table 1. They are estimated using algorithms developed by Wu et al. (2018) and Kuželka et al. (2020). Assuming leaves are evenly distributed on the plants, the empirical relationship to determine Manning n value (roughness coefficients) dependent on water depth, plant height, and vegetation density N is derived as follows:
Figure
5.
Spatial distribution of saltmarsh species and Manning roughness coefficient on Chongming Dongtan Shoal. Examples of coastal marsh detection by RIEGL for high and middle marshes (a), low marsh and bare tidal flat (b). Mapping the spatial distribution of land-use coverage (c), and Manning friction value (d). Black points in c are the RIEGL observation locations as demonstrated in a and b.
where H is water depth, $ {H}_{{\rm{p}}} $ is plant height, and N is vegetation density. The range of metrics for saltmarshes P. australis, Sp. alterniflora, and Sc. mariqueter on CMDS is shown in Table 1.
When the relative depth h (i.e., the ratio of water depth H to plant height $ {H}_{{\rm{p}}} $) is greater than 2, the Manning friction caused by the plant is constant (Carollo et al., 2005; Järvelä, 2002; Wilson and Horritt, 2002). Since the modeled maximum hydraulic water depth is generally deeper than 4 m, the adopted Manning n values for the typical saltmarshes P. australis, Sp. alterniflora, Sc. mariqueter, and the bare tidal flat on CMDS is set to 13, 20, 28, and 40, respectively (Fig. 5d), which are calculated by Eq. (4) with the input of plant metrics in Table 1 and land-use coverages in Fig. 5c. The setup of bottom friction for saltmarsh modeling is consistent with the research by Hu et al. (2015) and Willemsen et al. (2020). Frictions behind the seawall are set following the Manning coefficient correction table presented in Hossain et al. (2009).
3.5
Scenario simulations
Three scenarios are designed for disentangling the relative importance of marshes and seawalls on coastal flooding protection (Fig. 6). The proposed scenario simulations are (1) setting the tidal flat friction according to land-use coverages and saltmarsh species representative for summer conditions (Fig. 6a); (2) assuming the removal of foreshore vegetation and the Manning coefficient is set uniformly as bare tidal flat, i.e., n=40 (Fig. 6b); (3) assuming the removal of foreshore vegetation and further raising the seawall height by 0.1–1.0 m on CMDS (Fig. 6c). The scenario including vegetation is assumed to be representative for summer conditions with maximum biomass, while the scenario excluding vegetation is assumed to be representative for winter conditions, with minimum vegetation biomass. Thus, the effect of tidal marshes on wave attenuation can be derived by comparing the modeling results (1) and (2); the effect of seawall on flood mitigation can be derived by comparing the modeling results (2) and (3); and, the relative importance of wetland restoration and seawall heightening on equivalent flood protection, in terms of flood area mitigation behind seawall, can be derived by the joint comparing of the three scenarios. For the future scenarios, representative concentration pathway 4.5 emission scenario is employed for a conservative sea level rise projection in 2100 (Jevrejeva et al., 2014). The future flood mapping for different occurrence probabilities, i.e., 0.000 2, 0.001, 0.002, and 0.005, are produced by rising sea levels in the model with predicted return water levels, which are derived from the time-dependent generalized extreme value estimations (Chini and Stansby, 2012).
Figure
6.
Scenarios for soft and hard engineering solutions. a. Assuming the real seawall height with maximum foreshore biomass representing summer vegetation coverage condition. b. Assuming the real seawall height with foreshore vegetation removal representing winter condition. c. Assuming seawall heightening 0.1–1.0 m with foreshore vegetation removal representing winter condition.
In order to quantify the effect of tidal marsh on storm flood mitigation, the concepts of wave height (or current velocity) reduction (Rx) and wave height (or current velocity) reduction rate (RRx) are introduced:
where $ S $ is wave height or current velocity, the subscripts $ \mathrm{v} $ and $ \mathrm{v}\mathrm{d} $ represent with and without vegetation, the subscripts x is c or w, representing current velocity or wave height, respectively.
3.6
Cost-benefit estimation
NPV and BC are used to evaluate the cost and benefit of hard and soft flood mitigation measures, i.e., seawall measure vs. ecological measure. The benefit, represented by NPV, is the present value converted from the future reduced losses subtracting the costs, indicating the net benefit by implementation the flood protection measures. The cost, including the initial investment and the later annual maintenance, is calculated following the Port Hydraulic Construction Quota (MOT, 1994) and the Standard of Quota Budget for Maintenance on Water Resources Project (Ministry of Water Resources and Ministry of Finance of the People’s Republic of China, 2004). The measure is recognized as profitable if NPV>0 during the examination period. The formula is:
where $ {B}_{t} $ is the benefit and $ {C}_{t} $ is the cost after t years investment, including the initial investment and annual maintenance costs, T is the life span of the measure, d is the discount rate. Since the discount rate has been the focus of debating in the climate-change economics study, three different values were used, i.e., China’s current official discount rate 8% as the upper limit, the long-term benefit encouragement discount rate 4% as the lower limit, and a median rate 6% is factored.
The property losses for different land-use coverages behind the seawall are calculated with GIS spatial analysis of the flood area, flood depth, and the exposed land-use coverages by imposing a set of depth-damage functions (Du et al., 2020):
where $ {{y}}_{1} $ is building area, $ {{y}}_{2} $ is agricultural area, $ {{y}}_{3} $ is road, $ {{y}}_{4} $ is other area, and d is flood water depth.
Then, the expected annual loss for a specific land-use type in the future is derived by the integral of losses along the probability-loss curve (or the risk curve) (Du et al., 2020):
where AAL is expected annual average loss, i indicates different land-use coverages, x is the expected loss (or risk value) derived from GIS analysis, $ \,f\left(x\right) $ is their occurrence probabilities.
Finally, the BC is examined. The effectiveness of different measures is determined by evaluating the BC and NPV values. If BC>1 and NPV>0, then the measure is considered as economically attractive within the study period T. The formula is:
Saltmarsh functions as the physical barrier to wave, current, and storm surge. The effect of wetland on nearshore tide and wave propagation during storms is evaluated on CMDS. Significant wave heights (Hs) and current velocities are examined at 20 observation points at the toe of the seawall (Fig. 1). A substantial reduction in current velocity ($ {RR}_{{\rm{c}}} $) by 51% (42%–70%, the numbers in brackets are the 5%–95% bounds; same hereafter) and a moderate storm wave attenuation ($ {RR}_{{\rm{w}}} $) by 11% (5%–21%) are observed due to vegetation sheltering, especially for the northern CMDS, where the foreshore saltmarsh is high and wide (Fig. 7). Notably, $ {RR}_{{\rm{c}}} $ and $ {RR}_{{\rm{w}}} $ of the reach 25–35 km on CMDS (Fig. 7) is mostly zero or negative, indicating a locally little change of current velocity and even amplification of storm waves where the foreshore saltmarsh is narrow. This may be due to the increased water depth because of the extra floodwater redirected from nearby places of high-vegetation coverages. A more direct comparison of modeling results in two dimensions show a noticeable decrease of nearshore flow velocity (Figs 8c and d) and Hs (Figs 8e and f) with vegetation protection. However, storm surge only decrease from 6.31 m (6.20–6.60 m) to 6.02 m (5.80–6.40 m) after the vegetation restorations (Figs 8a and b). Consequently, the storm surge mitigation by tidal marsh is negligible, only by 3%–6%, while the flow velocity and Hs reduction are more critical during storm conditions.
Figure
7.
Compare the change of significant wave heights (Hs) and current velocity for conditions with vegetation (dash line) and with vegetation removal (solid line) at the toe of the seawall.
Figure
8.
Simulated hydraulic parameters representing max water level (a, b), max current velocity (c, d), and significant wave heights (Hs) (e, f) for the scenarios with and without vegetations.
Since saltmarshes protect the coastline mainly by reducing the current velocities and Hs, wave and current propagations across different wetland species on CMDS are examined with the data derived from field measurements (Table 2). Four observation points, a, b, c, and d, are located 0.10 km, 0.80 km, 2.80 km, and 2.90 km away from the seawall. The space between points a and b is mainly occupied by P. australis, where the Hs and current velocity is reduced by 0.06 m and 0.09 m/s over the distance 0.7 km; the space between points b and c is mainly occupied by Sp. alterniflora, where the Hs and current velocity is reduced by 0.25 m and 0.31 m/s over the distance 2 km; the space between points c and d is mainly occupied by Sc. mariqueter, where the Hs and current velocity is reduced by 0.03 m and 0.02 m/s over the distance 0.1 km, respectively. Thus, the Hs (or velocity) reduction by Sc. mariqueter is more efficient than Sp. alterniflora and P. australis on CMDS, which is estimated to be 0.3 m (0.2 m/s), 0.125 m (0.155 m/s) and 0.086 m (0.128 m/s) over every km, respectively.
Table
2.
Field measurements of significant wave heights (Hs) and current velocity at observation locations a, b, c, and d (Fig. 1b) during storm surge maximum
Both tidal marsh and seawall are effective measures in coastal flood mitigation. With the rise of the seawall from 0 m to 1 m, the total flood area behind the seawall (water depth>0.2 m) decreases substantially by a half (from 125 km2 to 60 km2) under saltmarsh removal condition (Fig. 9). Detailed statistics show a relatively constant percentage contribution (about 25%) of 0.2–0.5 m flood depth, while the severe inundation (depth>1 m) is converted to medium inundation (0.5–1 m) by about 10% after 0.6 m seawall rise (Fig. 9). Besides, the flood areas with and without vegetation protection for no seawall rise condition were also calculated. Results show an inundation area reduction by approximately one third (from 121.6 km2 of the diamond to 89.6 km2 of the dot in Fig. 9). The flooding area difference indicates the function of tidal marshes on flood mitigation, which protects the land area of approximately 32 km2 behind the seawall from being flooded. In order to produce the equivalent flood protection as the function of saltmarsh, the seawall is supposed to rise at least 0.42 m, when the calculated total inundation area is reduced from 121.6 km2 to 90.1 km2. In which, the contributions of flood area for inundation depth 0.2–0.5 m, 0.5–1m and >1 m are 24.5 km2, 27.0 km2 and 38.1 km2, respectively. Such contributions of component are also comparable to summer saltmarsh conditions (Fig. 9). Therefore, it is estimated that the function of saltmarsh on CMDS is similar to the seawall heightening of approximately 0.42 m on the equivalent flood protection. The maximum flood mapping with and without vegetation scenarios and for the conditions with seawall heightening 0.42 m and 1 m are shown in Fig. 10.
Figure
9.
Compare the effect of saltmarsh restoration and seawall heightening on flood reduction. Dot and diamond indicates the inundation area for summer foreshore vegetation coverage and for saltmarsh removal under no seawall rise condition, respectively. The lines show the change of inundation area behind seawall with seawall heightening 0–1 m for the situation without saltmarsh protection.
Figure
10.
Scenario simulations of urban flooding behind seawall. The flooding area under the conditions of CMDS with summer saltmarsh coverage (a), CMDS with saltmarsh removal (b), 0.42 m seawall heightening with saltmarsh removal (c), and 1 m seawall increasing with saltmarsh removal (d).
In order to test the sensitivity of saltmarsh and seawall on flood mitigation under different typhoon impacts, the relative importance of vegetation and seawall on flood mitigation was assessed by explicitly changing the imposed typhoon intensities. The current study is based on 9711 Typhoon Winnie, which is equivalent to typhoon intensity of Category 10−11 when approaching CMDS. The sensitivity analysis is performed by changing the wind speed ±5%, ±10%, and ±15%, representing the influence of typhoon Category 8−9 and Category 12−13, respectively. The comparison shows a more efficient seawall measure than saltmarsh measure on flood mitigation under more enormous typhoon impacts. However, a more efficient saltmarsh measure than seawall measure under smaller typhoon impact is observed (Table 3). The less effective of saltmarshes on flood mitigation under larger storms may be due to the saltmarsh failure and stem breakage destroyed by high wave-current energy, which is represented by less effective Manning coefficient in the model induced by insensible saltmarsh friction under larger storm surges and deeper hydraulic depth (Eq. (4)). Nevertheless, a substantial reduction of flood area is still observed when comparing the saltmarsh removal and saltmarsh present conditions. Therefore, saltmarsh solution is still valuable under more enormous typhoon conditions. Moreover, under smaller typhoon impacts (typhoon Category 8−9), the summer saltmarsh area of 54.2 km2 on CMDS is similar to the seawall heightening of approximately 0.42 m on the equivalent flood protection.
Table
3.
Sensitivity analysis of flood area (depth>0 m) under different intensities of typhoon impact
Flood area/km2
−15%
−10%
−5%
Typhoon Winnie
+5%
+10%
+15%
NSRSV
60.88
71.81
81.53
100.05
117.51
139.07
155.16
NSRWVR
85.51
93.54
110.20
123.75
147.40
172.93
194.79
0.42SRWVR
63.20
73.65
82.39
96.08
111.29
127.32
139.17
Note: NSRSV: no seawall rise with summer vegetation; NSRWVR: no seawall rise with vegetation removal; 0.42SRWVR: 0.42 m seawall rise with vegetation removal.
The construction cost of 1 m seawall heightening is approximately CNY 5.23 million per kilometer length, and the annual maintenance cost is around CNY 25 000–122 000 per kilometer length (Table 4). By multiplying the total seawall length 45.3 km on CMDS, the construction fee for the 0.42 m seawall heightening is approximately CNY 99.51 million. The entire maintenance fee during the 50 years lifetime expectation is CNY 58.40–277.36 million. Therefore, $ {C}_{t} $ (t=50) of seawall heightening is estimated to be CNY 157.91–376.87 million. In contrast, the cost of ecology-based measure is lower. Theoretically, saltmarsh is self-maintenance, thus the ecology-based measure is cost-free. For a conservative estimation, if the fee of artificial vegetation restoration is considered, the cost is approximately CNY 6 000–30 000 per hectare per year (Ministry of Housing and Urban Rural Development and National Development and Reform Commission, 2018). By multiplying the wetland area, 54.2 km2, the total wetland construction fee is approximately CNY 32.52–162.60 million on CMDS.
Table
4.
The cost of seawall heightening and wetland restoration according to the National Statistics Bureau of the People’s Republic of China (all units are converted to 2018 price based on the GDP deflator)
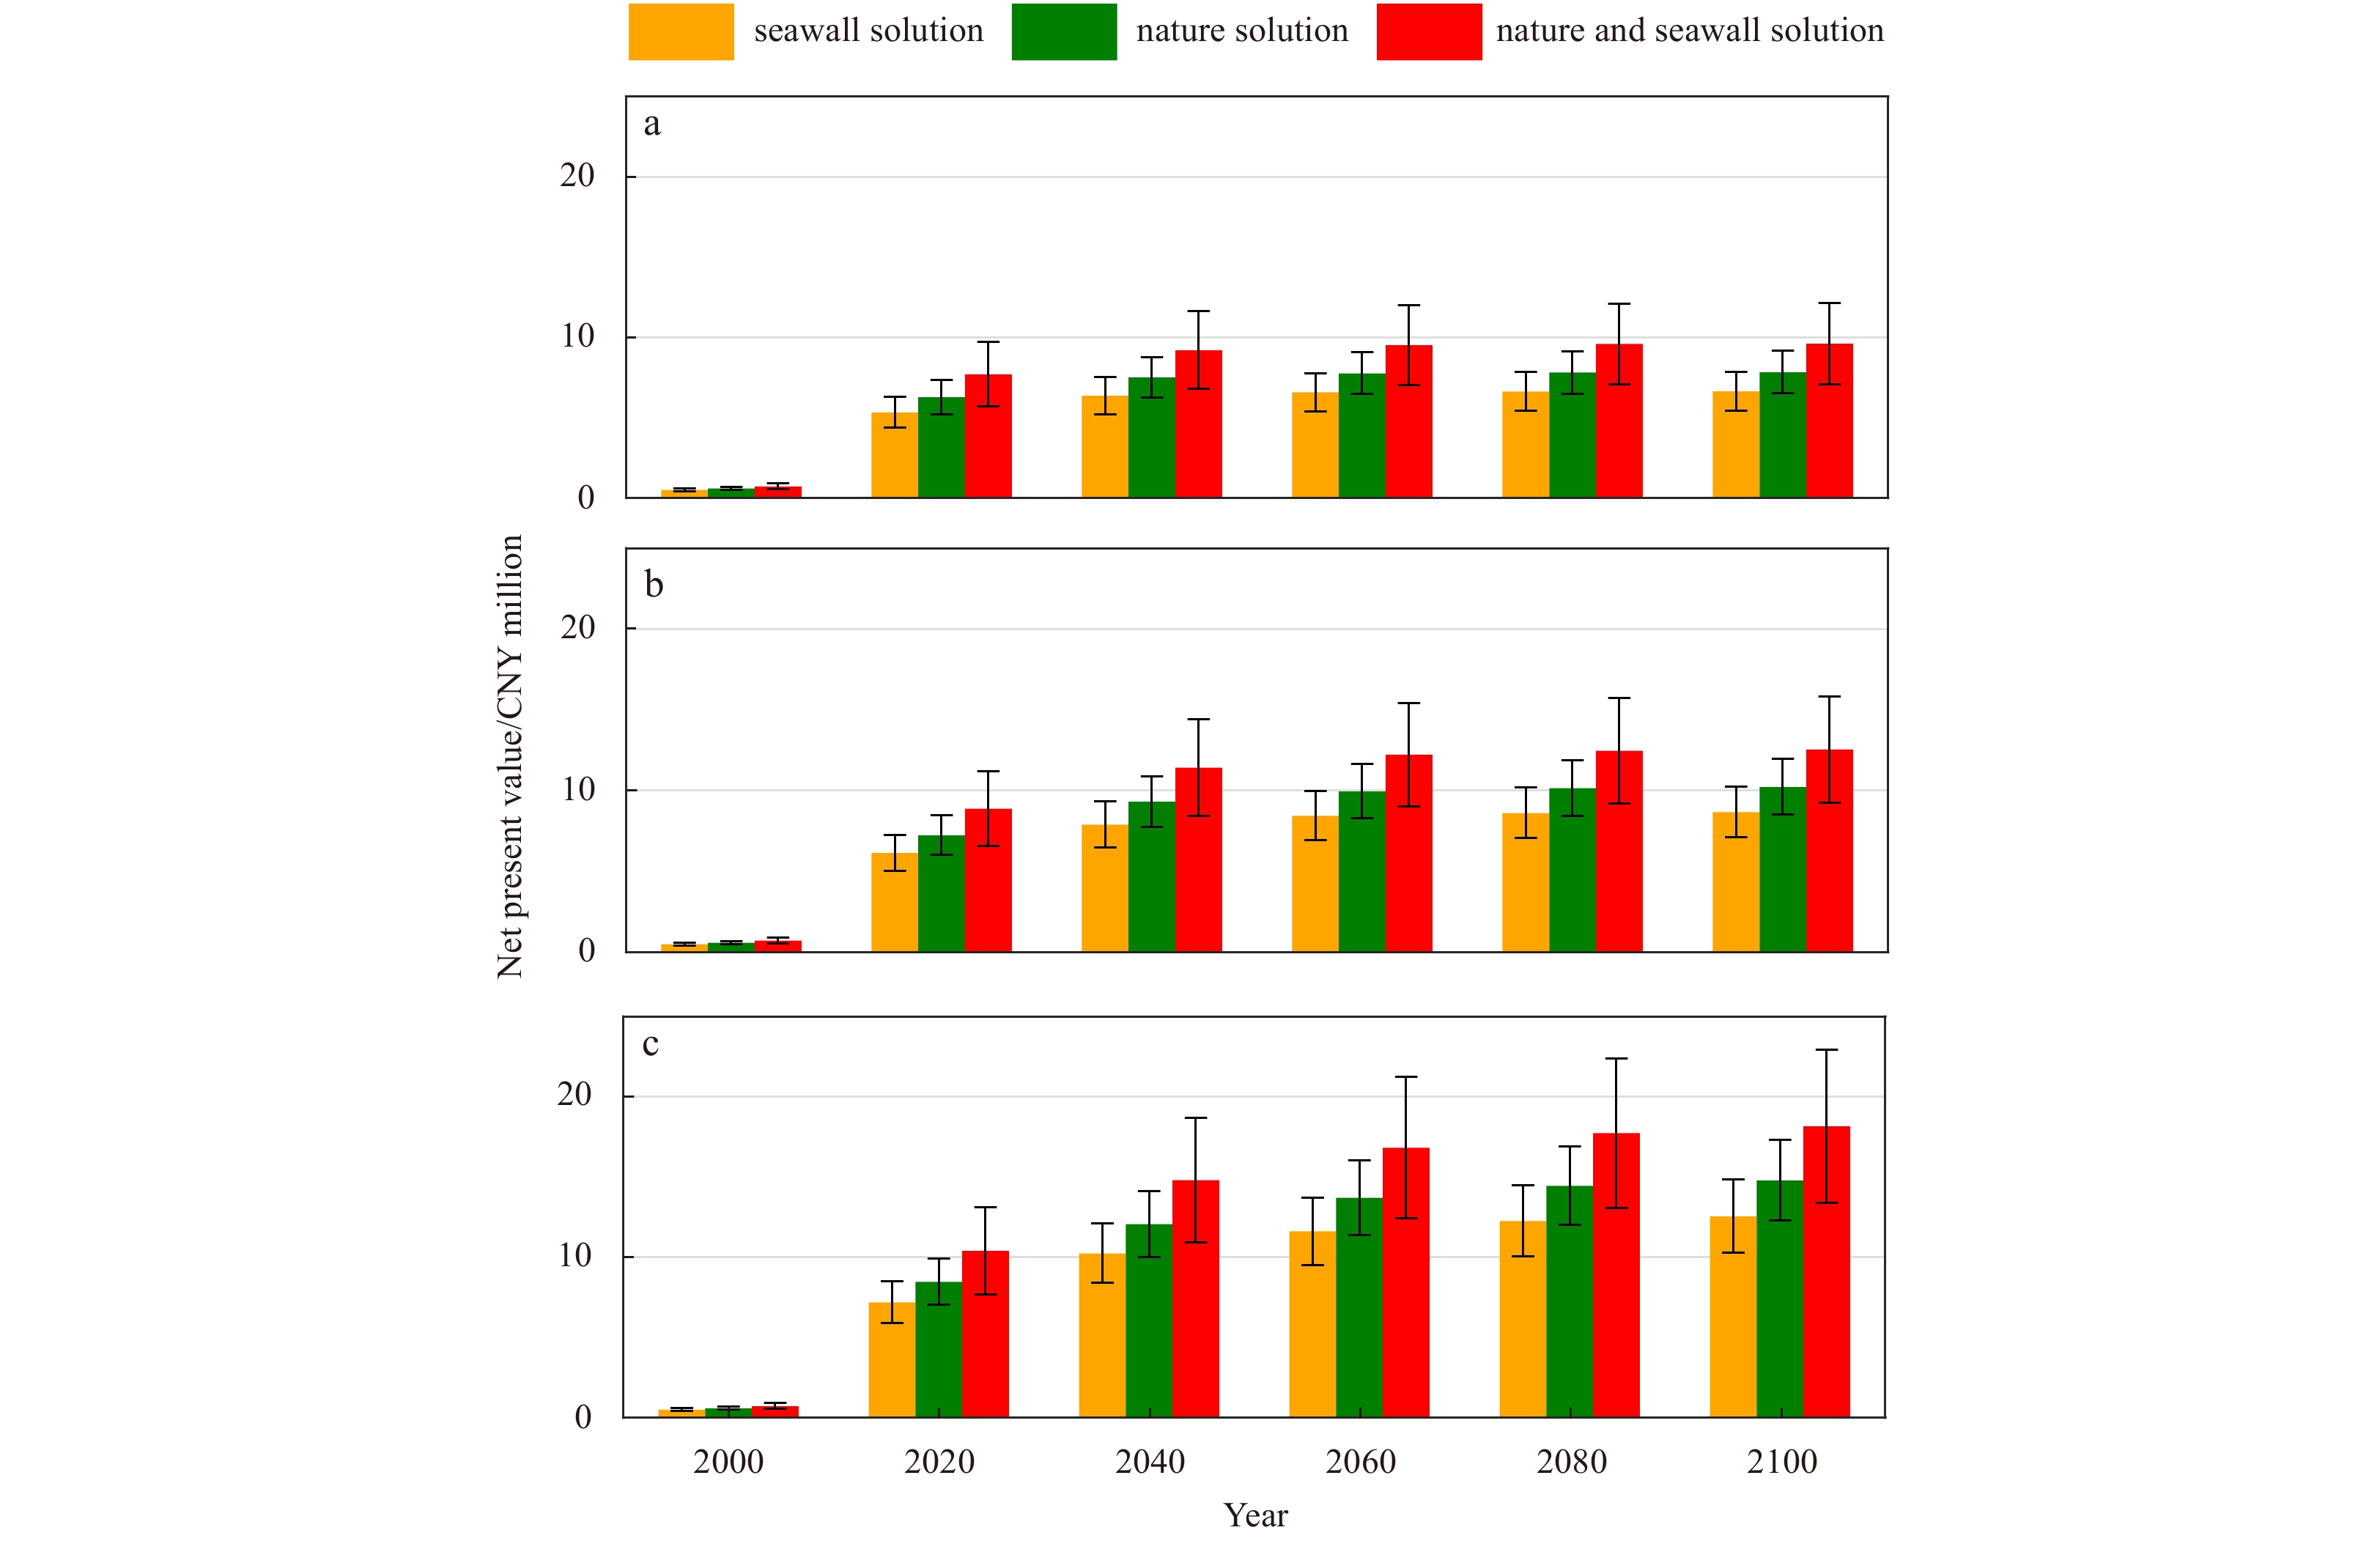
The estimated annual average disaster loss (AAL) for Scenario (1) real seawall height with summer saltmarsh coverage is CNY 11.71 million, Scenario (2) real seawall height with saltmarsh removal is CNY 14.89 million, and Scenario (3) 0.42 m seawall heightening with saltmarsh removal is CNY 10.39 million, respectively. Thus, the calculated NPV (Eq. (8)) by implementing nature-based measure, seawall measure, and hybrid measure is shown in Fig. 11. Notably, the NPV of nature-based measure is higher than that of seawall measure, while the hybrid measure shows the highest NPV under all future discount rate conditions. All the NPVs of the three measures gradually increase over time. They remain approximately constant after the year 2060, indicating the gradual vanishing of their differences between benefit and cost after 2060. Besides, the BC of nature-based measure is higher than seawall measure and hybrid measure, which are estimated to be 8.9 (3.0–14.8), 3.6 (2.2–5.0), and 3.8 (2.0–5.6), respectively. Consequently, the nature-based measure is more profitable, which is considered as a promising supplement to conventional engineering measure for seawall reinforcement.
Figure
11.
Net present value (median estimates with 5%–95% bounds) for seawall measure, nature-based measure, and the hybrid measure during year 2000–2100 considering the discount rate 8% (a), 6% (b), and 4% (c).
Many observations and experiments have proved the high efficiency of tidal marshes on wave and current attenuation (Hu et al., 2015; Liu et al., 2013; Loder et al., 2009; Narayan et al., 2017; Rahdarian and Niksokhan, 2017; Vuik et al., 2016; Wamsley et al., 2010; Zhang et al., 2012). Here, the wave and current attenuations by tidal marshes even during storm conditions were proved based on numerical modeling, which is an essential supplement to field measurements when data are hard to obtain (Glass et al., 2018; Leonardi et al., 2018). Results show that the 54.2 km2 tidal marshes on CMDS mitigate storm wave and current by about 11% (5%–21%) and about 51% (42%–70%), respectively. This protected the land area of approximately 32 km2 behind the seawall from being flooded. Storm wave reduction by tidal marsh is considered to be closely related to the above-ground vegetation metrics (Hu et al., 2015). It is found that the wave reduction rates by Sc. mariqueter is more efficient than Sp. alterniflora and P. australis on CMDS, which are approximately 0.3 m, 0.125 m and 0.086 m per kilometer length, respectively. This is in good agreement with the published value of wave reduction by wetland, i.e., between 0.09–0.19 m/km (Krauss et al., 2009; Rahdarian and Niksokhan, 2017). The slight overestimation of the results may be due to the large-scale and high-density vegetations in the northeast CMDS (Ren et al., 2014).
Hard structures, such as dykes and seawalls, have proved to help coastal cities improving resilience against storm-induced coastal flooding (Fagherazzi, 2014; Leonardi et al., 2018; Sutton-Grier et al., 2015). It is found that the wetland area on CMDS is equivalent to 0.42 m seawall heightening in terms of storm flood mitigation. The equivalent conversion relationship between wetland restoration and seawall heightening is evaluated through a cost-benefit analysis. The heightening of seawall and long-term maintenance requires an investment of CNY 157.91–376.87 million. However, the tidal marsh’s maintenance cost is almost zero, even if considering the artificial wetland restoration, the cost is only CNY 32.52–162.60 million. The BC of the nature-based measure is calculated to be 8.9 (3.0–14.8), which is much higher than the seawall measure 3.6 (2.2–5.0). Therefore, the ecology-based solution is more cost-effective. This result is consistent with Liu et al. (2019a, b), who assessed the value of China’s coastal wetlands on flood protection. Besides, Vuik et al. (2019) suggested that wetlands are even more cost-effective than traditional seawalls on flood protection in economically underdeveloped regions.
Although tidal marshes are proven to be efficient on coastal flood protection by reducing storm waves and flow velocities (Figs 7 and 8), they will not reduce the total floodwater volume brought by the tide. Large-scale and high-density tidal marshes may attenuate the tidal flows and redirect the floodwater to other places of low-vegetation coverages, resulting in a slight increase of Hs locally at the southern reach of CMDS (Fig. 7). Therefore, tidal marshes protect the coastline mainly by reducing the current velocities and Hs at high-vegetation coverages. In contrast, this will increase storm surges and Hs potentially in nearby areas with low vegetation density or bare tidal flat (Rahdarian and Niksokhan, 2017; Wamsley et al., 2010), thus deteriorating flooding consequently. Moreover, the possibility of stem breakage may also increase with the increase of wave height, especially under the impact of consecutive storms, that the stem breakage from the preceding storms may deteriorate the probability of flooding afterward (Liffen et al., 2013). The large-scale flume experiment showed a stem breakage up to 80% of the Elymus (Rupprecht et al., 2017) and a stem density reduction up to 50% of the Sp. alterniflora may occur after a Category-1 hurricane impact (Gittman et al., 2014).
The uncertainty of saltmarshes on storm flood mitigation is the most important limitation for wide-scale application (Vuik et al., 2018), especially when applying to the coastal areas with high economic values. However, the positive biogeomorphic feedbacks of saltmarsh will continuously build up the tidal flat elevation, which provides an essential compensation for direct wave attenuation through a process of depth-induced wave breaking (Vuik et al., 2018), even during winter when the above-ground part of vegetation is removed (Leonardi et al., 2018). Therefore, solely considering the vegetation canopy may significantly underestimate wetlands’ long-term effects on coastal protection. Moreover, vegetated foreshores are relatively inexpensive to build and maintain than seawalls and dikes. Thereby, the nature-based solution for flood protection is more attractive, especially in areas of low economic values. Reconciling the already existing concrete seawalls and designing hybrid coastal measures that combine vegetated foreshore and traditional seawall are strongly recommended for improved security. Moreover, tidal wetlands are self-maintenance and more sustainable than conventional seawalls. The nature-based solution can adapt to climate changes, such as sea-level rise (Duarte et al., 2013), and provide additional ecosystem services, such as water purification, improving fishery production, and recreational activities (Broekx et al., 2011; Turner et al., 2007).
6.
Conclusions
In this research, a concept of building with nature solution for coastal protection is examined on CMDS using a coupled TELEMAC-TOMAWAC ocean model and MIKE21 coastal model. The ocean model is calibrated and validated with tidal measurements. The coastal model is configured with wetlands based on vegetation metrics measurement of three marsh species. Scenario simulations and field measurements are performed to test the flood mitigation by tidal marshes. Then the flood mitigation efficiency of tidal marsh and seawall is compared. Based on this, the cost and benefit for the soft and hard engineering measures are evaluated under future Typhoon Winne evolution. The results prove the high cost-effectiveness of tidal marshes, in which Sc. mariqueter is better than Sp. alterniflora and P. australis on wave and current attenuation on CMDS even during storm conditions. In terms of cost-benefit estimation, the heightening of seawall requires a considerable amount of investment. However, the cost of tidal marsh restoration is much lower, and the maintenance fee is almost zero, which results in a relatively higher NPV and BC ratio for the nature-based measure than the seawall measure. Therefore, the concept of building seawall with nature or designing seawall with hybrid measure that combines tidal marsh and traditional seawall is considered as a promising supplement to conventional engineering seawall reinforcement.
Acknowledgements
The model and data reported in this paper can be obtained by contacting the corresponding author Min Zhang (zhangmin@shnu.edu.cn).
Ahn J, Na Yeji, Park S W. 2019. Development of two-dimensional inundation modelling process using MIKE21 model. KSCE Journal of Civil Engineering, 23(9): 3968–3977. doi: 10.1007/s12205-019-1586-9
[2]
Anderson M E, Smith J M. 2014. Wave attenuation by flexible, idealized salt marsh vegetation. Coastal Engineering, 83: 82–92. doi: 10.1016/j.coastaleng.2013.10.004
[3]
Arcement G J, Schneider V R. 1989. Guide for selecting Manning’s roughness coefficients for natural channels and flood plains. Denver, CO, USA: United States Geological Survey
[4]
Broekx S, Smets S, Liekens I, et al. 2011. Designing a long-term flood risk management plan for the Scheldt estuary using a risk-based approach. Natural Hazards, 57(2): 245–266. doi: 10.1007/s11069-010-9610-x
[5]
Cao Haijin, Feng Weibing, Hu Zhan, et al. 2015. Numerical modeling of vegetation-induced dissipation using an extended mild-slope equation. Ocean Engineering, 110: 258–269. doi: 10.1016/j.oceaneng.2015.09.057
[6]
Carollo F G, Ferro V, Termini D. 2005. Flow resistance law in channels with flexible submerged vegetation. Journal of Hydraulic Engineering, 131(7): 554–564. doi: 10.1061/(ASCE)0733-9429(2005)131:7(554)
[7]
Chen Zhongyi, Li Bo, Zhong Yang, et al. 2004. Local competitive effects of introduced Spartina alterniflora on Scirpus mariqueter at Dongtan of Chongming Island, the Yangtze River estuary and their potential ecological consequences. Hydrobiologia, 528(1): 99–106
[8]
Chini N, Stansby P K. 2012. Extreme values of coastal wave overtopping accounting for climate change and sea level rise. Coastal Engineering, 65: 27–37. doi: 10.1016/j.coastaleng.2012.02.009
[9]
Chow V T. 1959. Open-Channel Hydraulics. New York, NY, USA: McGraw-Hill, 680
[10]
Christiansen T, Wiberg P L, Milligan T G. 2000. Flow and sediment transport on a tidal salt marsh surface. Estuarine, Coastal and Shelf Science, 50(3): 315–331. doi: 10.1006/ecss.2000.0548
[11]
Dalrymple R A, Kirby J T, Hwang P A. 1984. Wave diffraction due to areas of energy dissipation. Journal of Waterway, Port, Coastal, and Ocean Engineering, 110(1): 67–79. doi: 10.1061/(ASCE)0733-950X(1984)110:1(67)
[12]
Donelan M A, Dobson F W, Smith S D, et al. 1993. On the dependence of sea surface roughness on wave development. Journal of Physical Oceanography, 23(9): 2143–2149. doi: 10.1175/1520-0485(1993)023<2143:OTDOSS>2.0.CO;2
[13]
Du Shiqiang, Scussolini P, Ward P J, et al. 2020. Hard or soft flood adaptation? Advantages of a hybrid strategy for Shanghai. Global Environmental Change, 61: 102037. doi: 10.1016/j.gloenvcha.2020.102037
[14]
Duarte C M, Losada I J, Hendriks I E, et al. 2013. The role of coastal plant communities for climate change mitigation and adaptation. Nature Climate Change, 3(11): 961–968. doi: 10.1038/nclimate1970
Fagherazzi S. 2014. Coastal processes: storm-proofing with marshes. Nature Geoscience, 7(10): 701–702. doi: 10.1038/ngeo2262
[17]
Gittman R K, Popowich A M, Bruno J F, et al. 2014. Marshes with and without sills protect estuarine shorelines from erosion better than bulkheads during a Category 1 hurricane. Ocean & Coastal Management, 102: 94–102
[18]
Glass E M, Garzon J L, Lawler S, et al. 2018. Potential of marshes to attenuate storm surge water level in the Chesapeake Bay. Limnology and Oceanography, 63(2): 951–967. doi: 10.1002/lno.10682
[19]
Hashemi M R, Neill S P, Robins P E, et al. 2015. Effect of waves on the tidal energy resource at a planned tidal stream array. Renewable Energy, 75: 626–639. doi: 10.1016/j.renene.2014.10.029
[20]
Hasselmann K, Collins J I. 1968. Spectral dissipation of finite depth gravity waves due to turbulent bottom friction. Journal of Marine Research, 26: 1–12
Hossain A K M A, Jia Yafei, Chao Xiabo. 2009. Estimation of Manning’s roughness coefficient distribution for hydrodynamic model using remotely sensed land cover features. In: 2009 17th International Conference on Geoinformatics. Fairfax, VA, USA: IEEE, 1–4
[23]
Hu Kelin, Chen Qin, Wang Hongqing. 2015. A numerical study of vegetation impact on reducing storm surge by wetlands in a semi-enclosed estuary. Coastal Engineering, 95: 66–76. doi: 10.1016/j.coastaleng.2014.09.008
[24]
Järvelä J. 2002. Flow resistance of flexible and stiff vegetation: a flume study with natural plants. Journal of Hydrology, 269(1−2): 44–54. doi: 10.1016/S0022-1694(02)00193-2
[25]
Jevrejeva S, Grinsted A, Moore J C. 2014. Upper limit for sea level projections by 2100. Environmental Research Letters, 9(10): 104008. doi: 10.1088/1748-9326/9/10/104008
[26]
Krauss K W, Doyle T W, Doyle T J, et al. 2009. Water level observations in mangrove swamps during two hurricanes in Florida. Wetlands, 29(1): 142. doi: 10.1672/07-232.1
[27]
Kuželka K, Slavík M, Surový P. 2020. Very High Density Point Clouds from UAV Laser Scanning for Automatic Tree Stem Detection and Direct Diameter Measurement. Remote Sensing, 12(8): 1236. doi: 10.3390/rs12081236
[28]
Leonardi N, Carnacina I, Donatelli, C, et al. 2018. Dynamic interactions between coastal storms and salt marshes: a review. Geomorphology, 301: 92–107. doi: 10.1016/j.geomorph.2017.11.001
[29]
Leonardi N, Ganju N K, Fagherazzi S. 2016. A linear relationship between wave power and erosion determines salt-marsh resilience to violent storms and hurricanes. Proceedings of the National Academy of Sciences of the United States of America, 113(1): 64–68. doi: 10.1073/pnas.1510095112
[30]
Liffen T, Gurnell M A, O’Hare M T, et al. 2013. Associations between the morphology and biomechanical properties of Sparganium erectum: implications for survival and ecosystem engineering. Aquatic Botany, 105: 18–24. doi: 10.1016/j.aquabot.2012.11.001
[31]
Liu Xin, Wang Yebao, Costanza R, et al. 2019a. Is China’s coastal engineered defences valuable for storm protection?. Science of the Total Environment, 657: 103–107. doi: 10.1016/j.scitotenv.2018.11.409
[32]
Liu Xin, Wang Yebao, Costanza R, et al. 2019b. The value of China’s coastal wetlands and seawalls for storm protection. Ecosystem Services, 36: 100905. doi: 10.1016/j.ecoser.2019.100905
[33]
Liu Huiqing, Zhang Keqi, Li Yuepeng, et al. 2013. Numerical study of the sensitivity of mangroves in reducing storm surge and flooding to hurricane characteristics in southern Florida. Continental Shelf Research, 64: 51–65. doi: 10.1016/j.csr.2013.05.015
[34]
Loder N M, Irish J L, Cialone M A, et al. 2009. Sensitivity of hurricane surge to morphological parameters of coastal wetlands. Estuarine, Coastal and Shelf Science, 84(4): 625–636. doi: 10.1016/j.ecss.2009.07.036
[35]
Longuet-Higgins M S, Stewart R W. 1964. Radiation stresses in water waves; a physical discussion, with applications. Deep-Sea Research and Oceanographic Abstracts, 11(4): 529–562. doi: 10.1016/0011-7471(64)90001-4
[36]
Ministry of Water Resources, Ministry of Finance of the People’s Republic of China. 2004. Standard of budget quota for maintenance on water resources project. Beijing: The Ministry of Water Resources of People’s Republic of China (in Chinese). http://gjkj.mwr.gov.cn/slkj1/gzdt_1/200408/t20040810_598457.html[2004-08-10]
[37]
Ministry of Housing and Urban Rural Development, National Development and Reform Commission. 2018. Construction standard of wetland protection project. Beijing: The National Forestry and Grassland Administration of People’s Republic of China (in Chinese). http://www.forestry.gov.cn/main/217/20180816/171258480891411.html[2018-08-16]
[38]
MOT. 1994. Quota for maritime works in seaport. Beijing: The Ministry of Transport of the People’s Republic of China (in Chinese). Issued by the Ministry of Transport[1994]: 329.
[39]
Narayan S, Beck M W, Wilson P, et al. 2017. The value of coastal wetlands for flood damage reduction in the northeastern USA. Scientific Reports, 7(1): 9463. doi: 10.1038/s41598-017-09269-z
[40]
Rahdarian A, Niksokhan M H. 2017. Numerical modeling of storm surge attenuation by mangroves in protected area of mangroves of Qheshm Island. Ocean Engineering, 145: 304–315. doi: 10.1016/j.oceaneng.2017.09.026
[41]
Ren Linjing, Li Xiuzhen, Yang Shilun, et al. 2014. The impact of salt marsh change on sediment accumulation and wave attenuation at the East Chongming Island. Acta Ecologica Sinica (in Chinese), 34(12): 3350–3358
[42]
Rupprecht F, Möller I, Paul M, et al. 2017. Vegetation-wave interactions in salt marshes under storm surge conditions. Ecological Engineering, 100: 301–315. doi: 10.1016/j.ecoleng.2016.12.030
[43]
Stark J, Plancke Y, Ides S, et al. 2016. Coastal flood protection by a combined nature-based and engineering approach: Modeling the effects of marsh geometry and surrounding dikes. Estuarine, Coastal and Shelf Science, 175: 34–45. doi: 10.1016/j.ecss.2016.03.027
[44]
Sutton-Grier A E, Wowk K, Bamford H. 2015. Future of our coasts: the potential for natural and hybrid infrastructure to enhance the resilience of our coastal communities, economies and ecosystems. Environmental Science & Policy, 51: 137–148
[45]
Suzuki T, Hu Z, Kumada K, et al. 2019. Non-hydrostatic modeling of drag, inertia and porous effects in wave propagation over dense vegetation fields. Coastal Engineering, 149: 49–64. doi: 10.1016/j.coastaleng.2019.03.011
[46]
Temmerman S, De Vries M B, Bouma T J. 2012. Coastal marsh die-off and reduced attenuation of coastal floods: a model analysis. Global and Planetary Change, 92−93: 267–274. doi: 10.1016/j.gloplacha.2012.06.001
[47]
Temmerman S, Meire P, Bouma T J, et al. 2013. Ecosystem-based coastal defence in the face of global change. Nature, 504(7478): 79–83. doi: 10.1038/nature12859
[48]
Turner R K, Burgess D, Hadley D, et al. 2007. A cost-benefit appraisal of coastal managed realignment policy. Global Environmental Change, 17(3−4): 397–407. doi: 10.1016/j.gloenvcha.2007.05.006
[49]
Vuik V, Borsje B W, Willemsen P W J M, et al. 2019. Salt marshes for flood risk reduction: Quantifying long-term effectiveness and life-cycle costs. Ocean & Coastal Management, 171: 96–110
[50]
Vuik V, Jonkman S N, Borsje B W, et al. 2016. Nature-based flood protection: The efficiency of vegetated foreshores for reducing wave loads on coastal dikes. Coastal Engineering, 116: 42–56. doi: 10.1016/j.coastaleng.2016.06.001
[51]
Vuik V, Van Vuren S, Borsje B W, et al. 2018. Assessing safety of nature-based flood defenses: dealing with extremes and uncertainties. Coastal Engineering, 139: 47–64. doi: 10.1016/j.coastaleng.2018.05.002
[52]
Wamsley T V, Cialone M A, Smith J M, et al. 2010. The potential of wetlands in reducing storm surge. Ocean Engineering, 37(1): 59–68. doi: 10.1016/j.oceaneng.2009.07.018
[53]
Wang Jun, Yi Si, Li Mengya, et al. 2018. Effects of sea level rise, land subsidence, bathymetric change and typhoon tracks on storm flooding in the coastal areas of Shanghai. Science of the Total Environment, 621: 228–234. doi: 10.1016/j.scitotenv.2017.11.224
[54]
Wang Luyang, Zhang Min, Wen Jiahong, et al. 2019. Simulation of extreme compound coastal flooding in shanghai. Advances in Water Science (in Chinese), 30(4): 546–555
[55]
Willemsen P W J M, Borsje B W, Vuik V, et al. 2020. Field-based decadal wave attenuating capacity of combined tidal flats and salt marshes. Coastal Engineering, 156: 103628. doi: 10.1016/j.coastaleng.2019.103628
[56]
Wilson C A M E, Horritt M S. 2002. Measuring the flow resistance of submerged grass. Hydrological Processes, 16(13): 2589–2598. doi: 10.1002/hyp.1049
[57]
Wu Dan, Phinn S, Johansen K, et al. 2018. Estimating changes in leaf area, leaf area density, and vertical leaf area profile for mango, avocado, and macadamia tree crowns using terrestrial laser scanning. Remote Sensing, 10(11): 1750. doi: 10.3390/rs10111750
[58]
Yan Ge, Ge Zhenming, Zhang Liquan. 2014. Distribution of soil carbon storage in different saltmarsh plant communities in Chongming Dongtan wetland. Chinese Journal of Applied Ecology (in Chinese), 25(1): 85–91
[59]
Yao Zhenxing, Chen Qingqiang, Yang Qinchuan. 2017. Preliminary study on the progradation rate of the eastern part of chongming island in recent six decades. Resources and Environment in the Yangtze Basin (in Chinese), 26(5): 698–705
[60]
Zhang Keqi, Liu Huiqing, Li Yuepeng, et al. 2012. The role of mangroves in attenuating storm surges. Estuarine, Coastal and Shelf Science, 102−103: 11–23. doi: 10.1016/j.ecss.2012.02.021
[61]
Zhang Min, Townend I, Cai Huayang, et al. 2018. The influence of seasonal climate on the morphology of the mouth-bar in the Yangtze Estuary, China. Continental Shelf Research, 153: 30–49. doi: 10.1016/j.csr.2017.12.004
[62]
Zhou Yunxuan, Tian Bo, Huang Ying, et al. 2016. Degradation of Coastal Wetland Ecosystem in China: Drivers, Impacts, and Strategies. Bulletin of the Chinese Academy of Sciences (in Chinese), 31(10): 1157–1166
Aubrée Louarn, Catherine Meur-Ferec, Nathalie Hervé-Fournereau. The concept of 'nature-based solutions' applied to urban coastal risks: A bibliometric and content analysis review. Ocean & Coastal Management, 2025, 261: 107530. doi:10.1016/j.ocecoaman.2024.107530
2.
Peng Qin, Yong Jiang, Chunmei Cheng. How Do Structural Safety, Ecological Functions and Social Development Influence Construction of Ecological Seawalls for Coastal Protection and Sustainability?. Water Resources Management, 2024, 38(5): 1807. doi:10.1007/s11269-024-03768-1
3.
Langying Long, Junhong Bai, Tian Xie, et al. Living estuarine shorelines as nature-based green engineering for coastal stabilization: A scientometric analysis. Ecological Engineering, 2024, 208: 107361. doi:10.1016/j.ecoleng.2024.107361
4.
Zhili Xu, Bin Dong, Zezhu Wei, et al. Study on habitat suitability change and habitat network of rare wintering cranes in important international wetlands. Ecological Indicators, 2023, 154: 110692. doi:10.1016/j.ecolind.2023.110692
5.
Wei Zhang, Jian Zeng, Zhen-Ming Ge, et al. Dike risk evaluation incorporating the contribution of coastal wetlands: A case study on Chongming Island, China. Ocean & Coastal Management, 2023, 245: 106874. doi:10.1016/j.ocecoaman.2023.106874
6.
Min Zhang, Christian Schwarz, Wenpeng Lin, et al. A new perspective on the impacts of Spartina alterniflora invasion on Chinese wetlands in the context of climate change: A case study of the Jiuduansha Shoals, Yangtze Estuary. Science of The Total Environment, 2023, 868: 161477. doi:10.1016/j.scitotenv.2023.161477
7.
Chenchen Cao, Fangli Su, Fei Song, et al. Distribution and disturbance dynamics of habitats suitable for Suaeda salsa. Ecological Indicators, 2022, 140: 108984. doi:10.1016/j.ecolind.2022.108984
Zhentao Chong, Min Zhang, Jiahong Wen, Luyang Wang, Jie Mi, Jeremy Bricker, Stanley Nmor, Zhijun Dai. Coastal protection using building with nature concept: A case study from Chongming Dongtan Shoal, China[J]. Acta Oceanologica Sinica, 2021, 40(10): 152-166. doi: 10.1007/s13131-021-1761-y
Zhentao Chong, Min Zhang, Jiahong Wen, Luyang Wang, Jie Mi, Jeremy Bricker, Stanley Nmor, Zhijun Dai. Coastal protection using building with nature concept: A case study from Chongming Dongtan Shoal, China[J]. Acta Oceanologica Sinica, 2021, 40(10): 152-166. doi: 10.1007/s13131-021-1761-y
Table
2.
Field measurements of significant wave heights (Hs) and current velocity at observation locations a, b, c, and d (Fig. 1b) during storm surge maximum
Table
3.
Sensitivity analysis of flood area (depth>0 m) under different intensities of typhoon impact
Flood area/km2
−15%
−10%
−5%
Typhoon Winnie
+5%
+10%
+15%
NSRSV
60.88
71.81
81.53
100.05
117.51
139.07
155.16
NSRWVR
85.51
93.54
110.20
123.75
147.40
172.93
194.79
0.42SRWVR
63.20
73.65
82.39
96.08
111.29
127.32
139.17
Note: NSRSV: no seawall rise with summer vegetation; NSRWVR: no seawall rise with vegetation removal; 0.42SRWVR: 0.42 m seawall rise with vegetation removal.
Table
4.
The cost of seawall heightening and wetland restoration according to the National Statistics Bureau of the People’s Republic of China (all units are converted to 2018 price based on the GDP deflator)
Ministry of Water Resources and Ministry of Finance of the People’s Republic of China, 2004
Ministry of Housing and Urban Rural Development and National Development and Reform Commission, 2018
2018 unit price
CNY 5.23 million
CNY 25 776–122 456
CNY 6 000–30 000
Figure 1. Sketch map showing the study area. a. The location of Chongming Dongtan Shoal and the observation location of survey vessels in Changjiang River Estuary. b. The seawall, vegetation pattern, and the location of field measurement on Chongming Dongtan Shoal. c. An aerial view of the seawall and coastal marshes at location 31°26′32′′N, 121°52′20′′E.
Figure 2. The modeling area. a. The path of 9711 Typhoon Winnie. b. The irregular triangular mesh coverage in the ocean model. c. The land elevation of Chongming Dongtan Shoal used in the coastal model.
Figure 3. The comparison of free surface elevation and current velocity between modeling results and field observation during neap tide.
Figure 4. The comparison of free surface elevation and current velocity between modeling results and field observation during spring tide.
Figure 5. Spatial distribution of saltmarsh species and Manning roughness coefficient on Chongming Dongtan Shoal. Examples of coastal marsh detection by RIEGL for high and middle marshes (a), low marsh and bare tidal flat (b). Mapping the spatial distribution of land-use coverage (c), and Manning friction value (d). Black points in c are the RIEGL observation locations as demonstrated in a and b.
Figure 6. Scenarios for soft and hard engineering solutions. a. Assuming the real seawall height with maximum foreshore biomass representing summer vegetation coverage condition. b. Assuming the real seawall height with foreshore vegetation removal representing winter condition. c. Assuming seawall heightening 0.1–1.0 m with foreshore vegetation removal representing winter condition.
Figure 7. Compare the change of significant wave heights (Hs) and current velocity for conditions with vegetation (dash line) and with vegetation removal (solid line) at the toe of the seawall.
Figure 8. Simulated hydraulic parameters representing max water level (a, b), max current velocity (c, d), and significant wave heights (Hs) (e, f) for the scenarios with and without vegetations.
Figure 9. Compare the effect of saltmarsh restoration and seawall heightening on flood reduction. Dot and diamond indicates the inundation area for summer foreshore vegetation coverage and for saltmarsh removal under no seawall rise condition, respectively. The lines show the change of inundation area behind seawall with seawall heightening 0–1 m for the situation without saltmarsh protection.
Figure 10. Scenario simulations of urban flooding behind seawall. The flooding area under the conditions of CMDS with summer saltmarsh coverage (a), CMDS with saltmarsh removal (b), 0.42 m seawall heightening with saltmarsh removal (c), and 1 m seawall increasing with saltmarsh removal (d).
Figure 11. Net present value (median estimates with 5%–95% bounds) for seawall measure, nature-based measure, and the hybrid measure during year 2000–2100 considering the discount rate 8% (a), 6% (b), and 4% (c).


 DownLoad:
 DownLoad:


 DownLoad: