Jing Li, Lin Mu, Linhao Zhong. Frequent central Pacific La Niña events may accelerate Arctic warming since the 1980s[J]. Acta Oceanologica Sinica, 2021, 40(11): 62-69. doi: 10.1007/s13131-021/1843-x
Citation:
Chunming Dong, Hongtao Nie, Xiaofan Luo, Hao Wei, Wei Zhao. Mechanisms for the link between onset and duration of open water in the Kara Sea[J]. Acta Oceanologica Sinica, 2021, 40(11): 119-128. doi: 10.1007/s13131-021-1767-5
School of Marine Science and Technology, Tianjin University, Tianjin 300072, China
Funds:
The National Key Research and Development Program of China under contract No. 2016YFC1401401; the National Natural Science Foundation of China under contract Nos 41630969, 41941013 and 41806225.
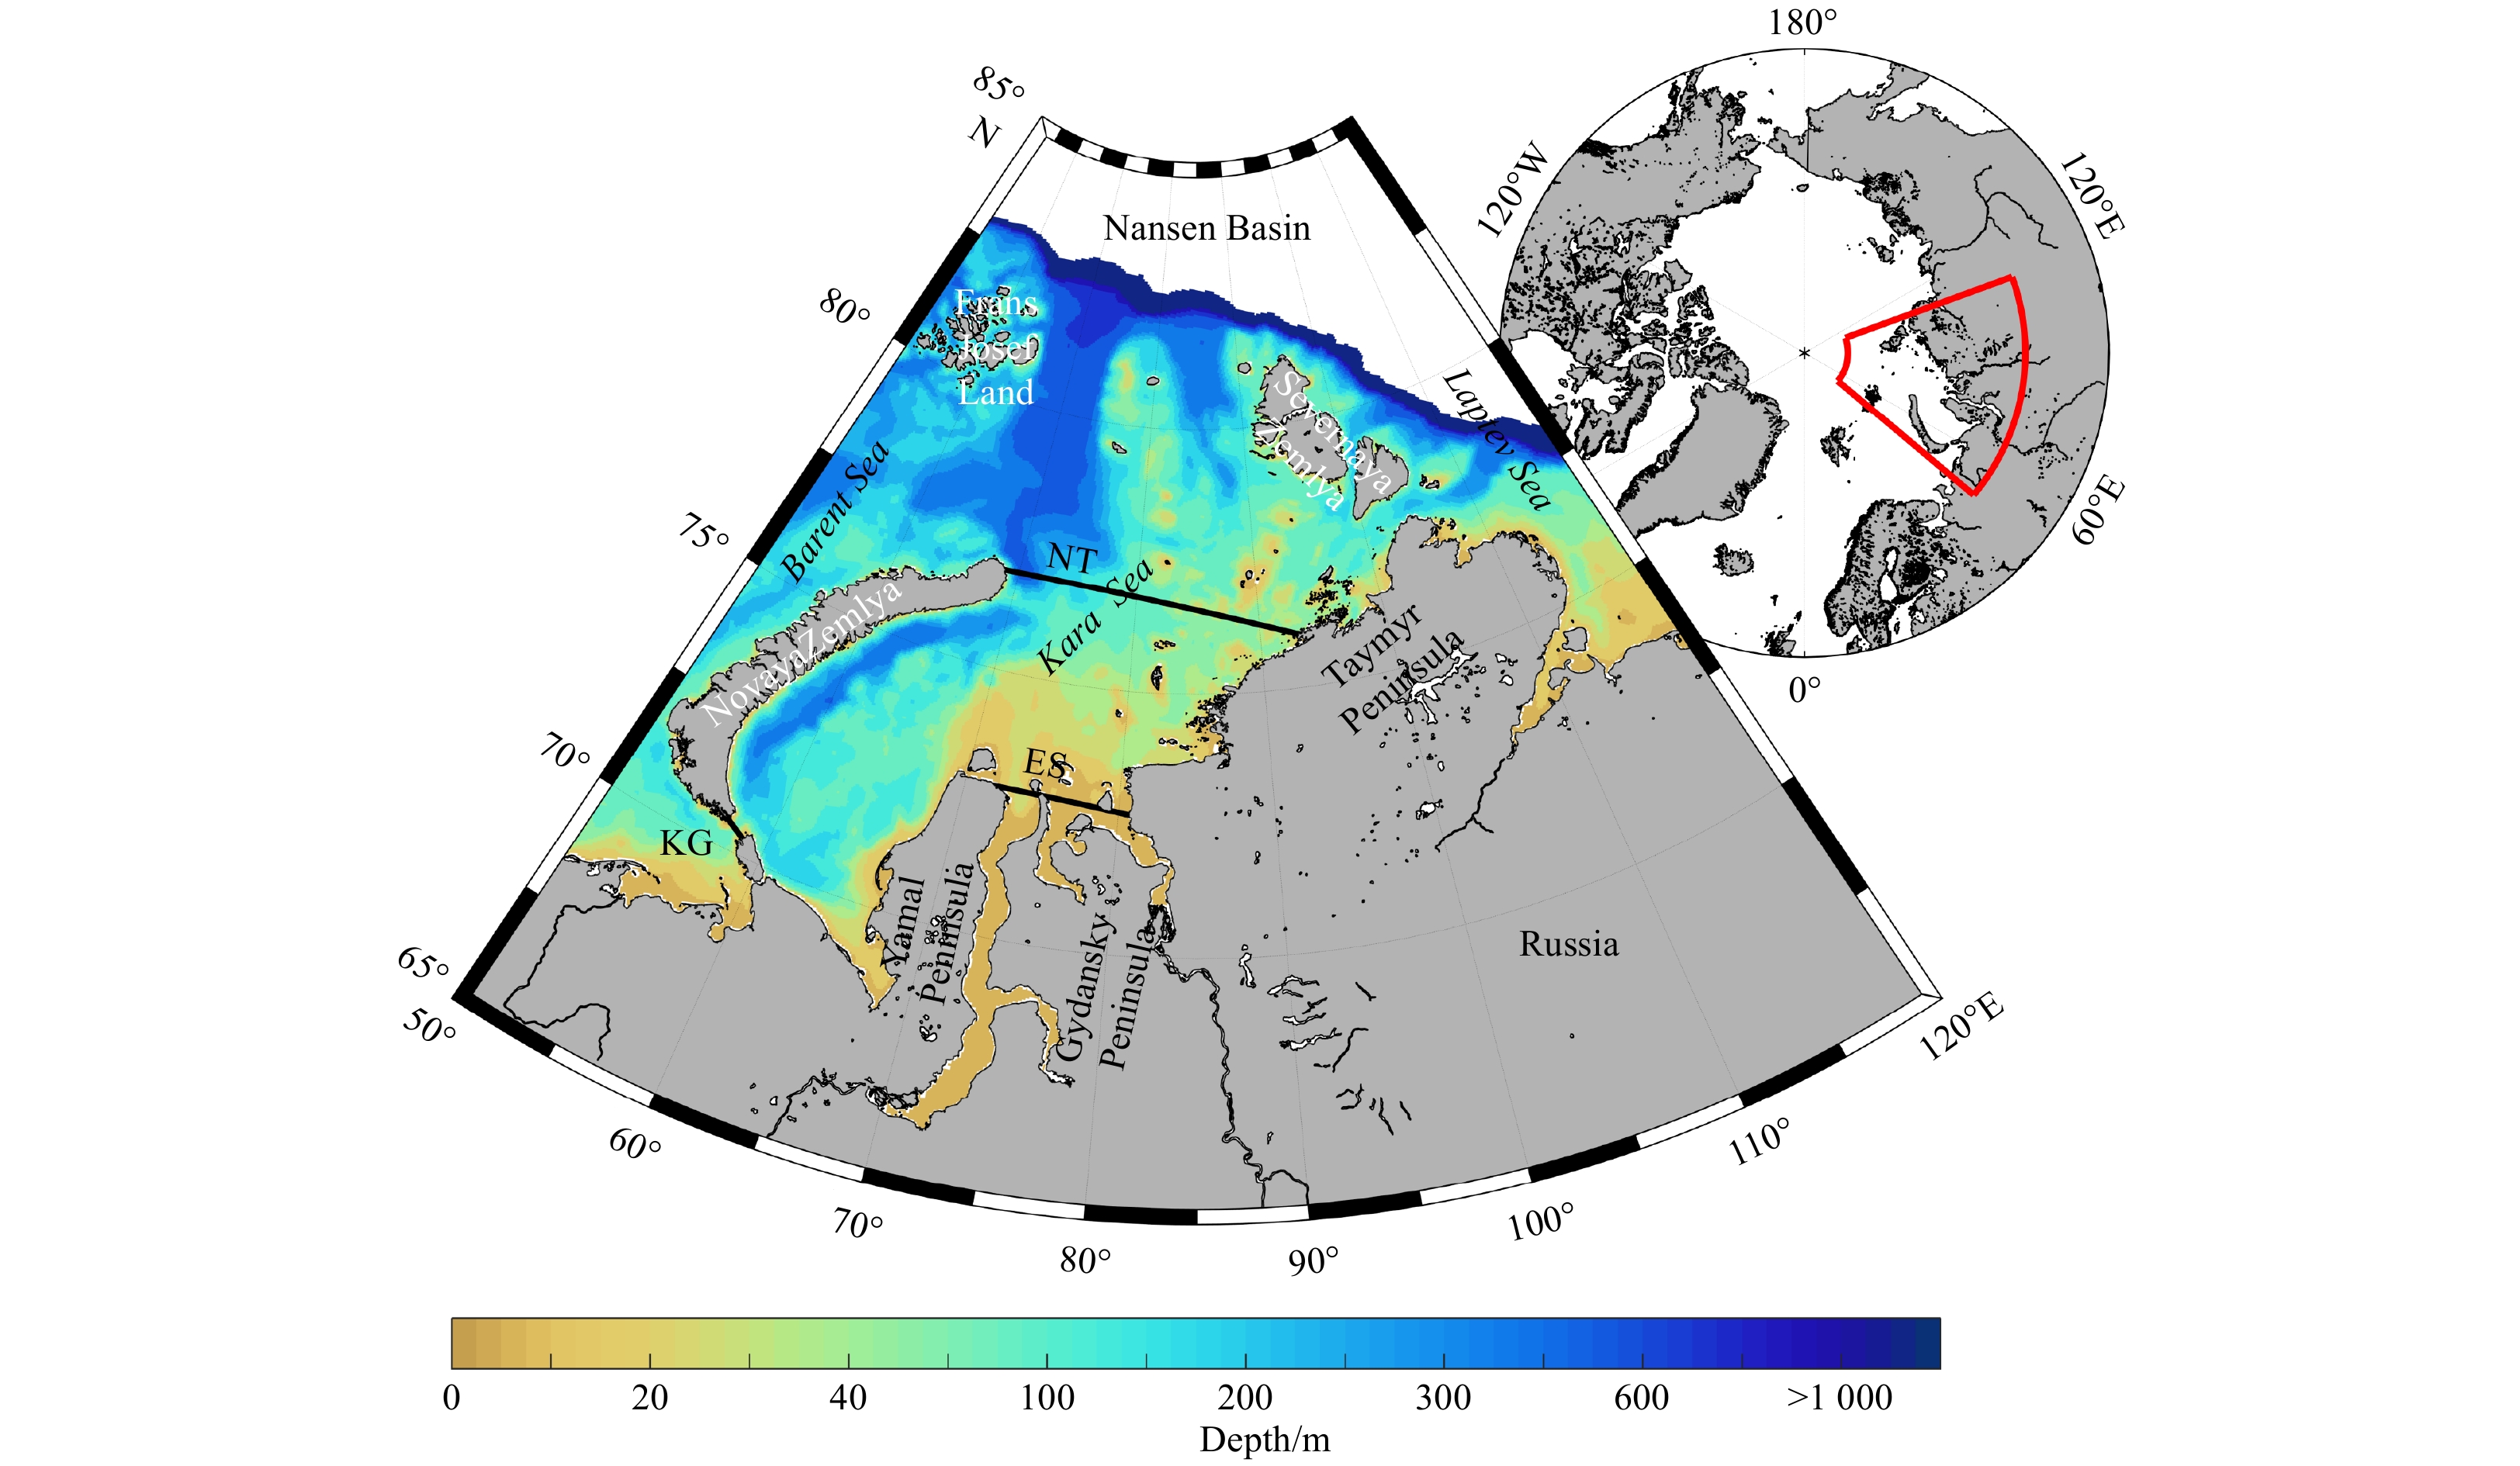
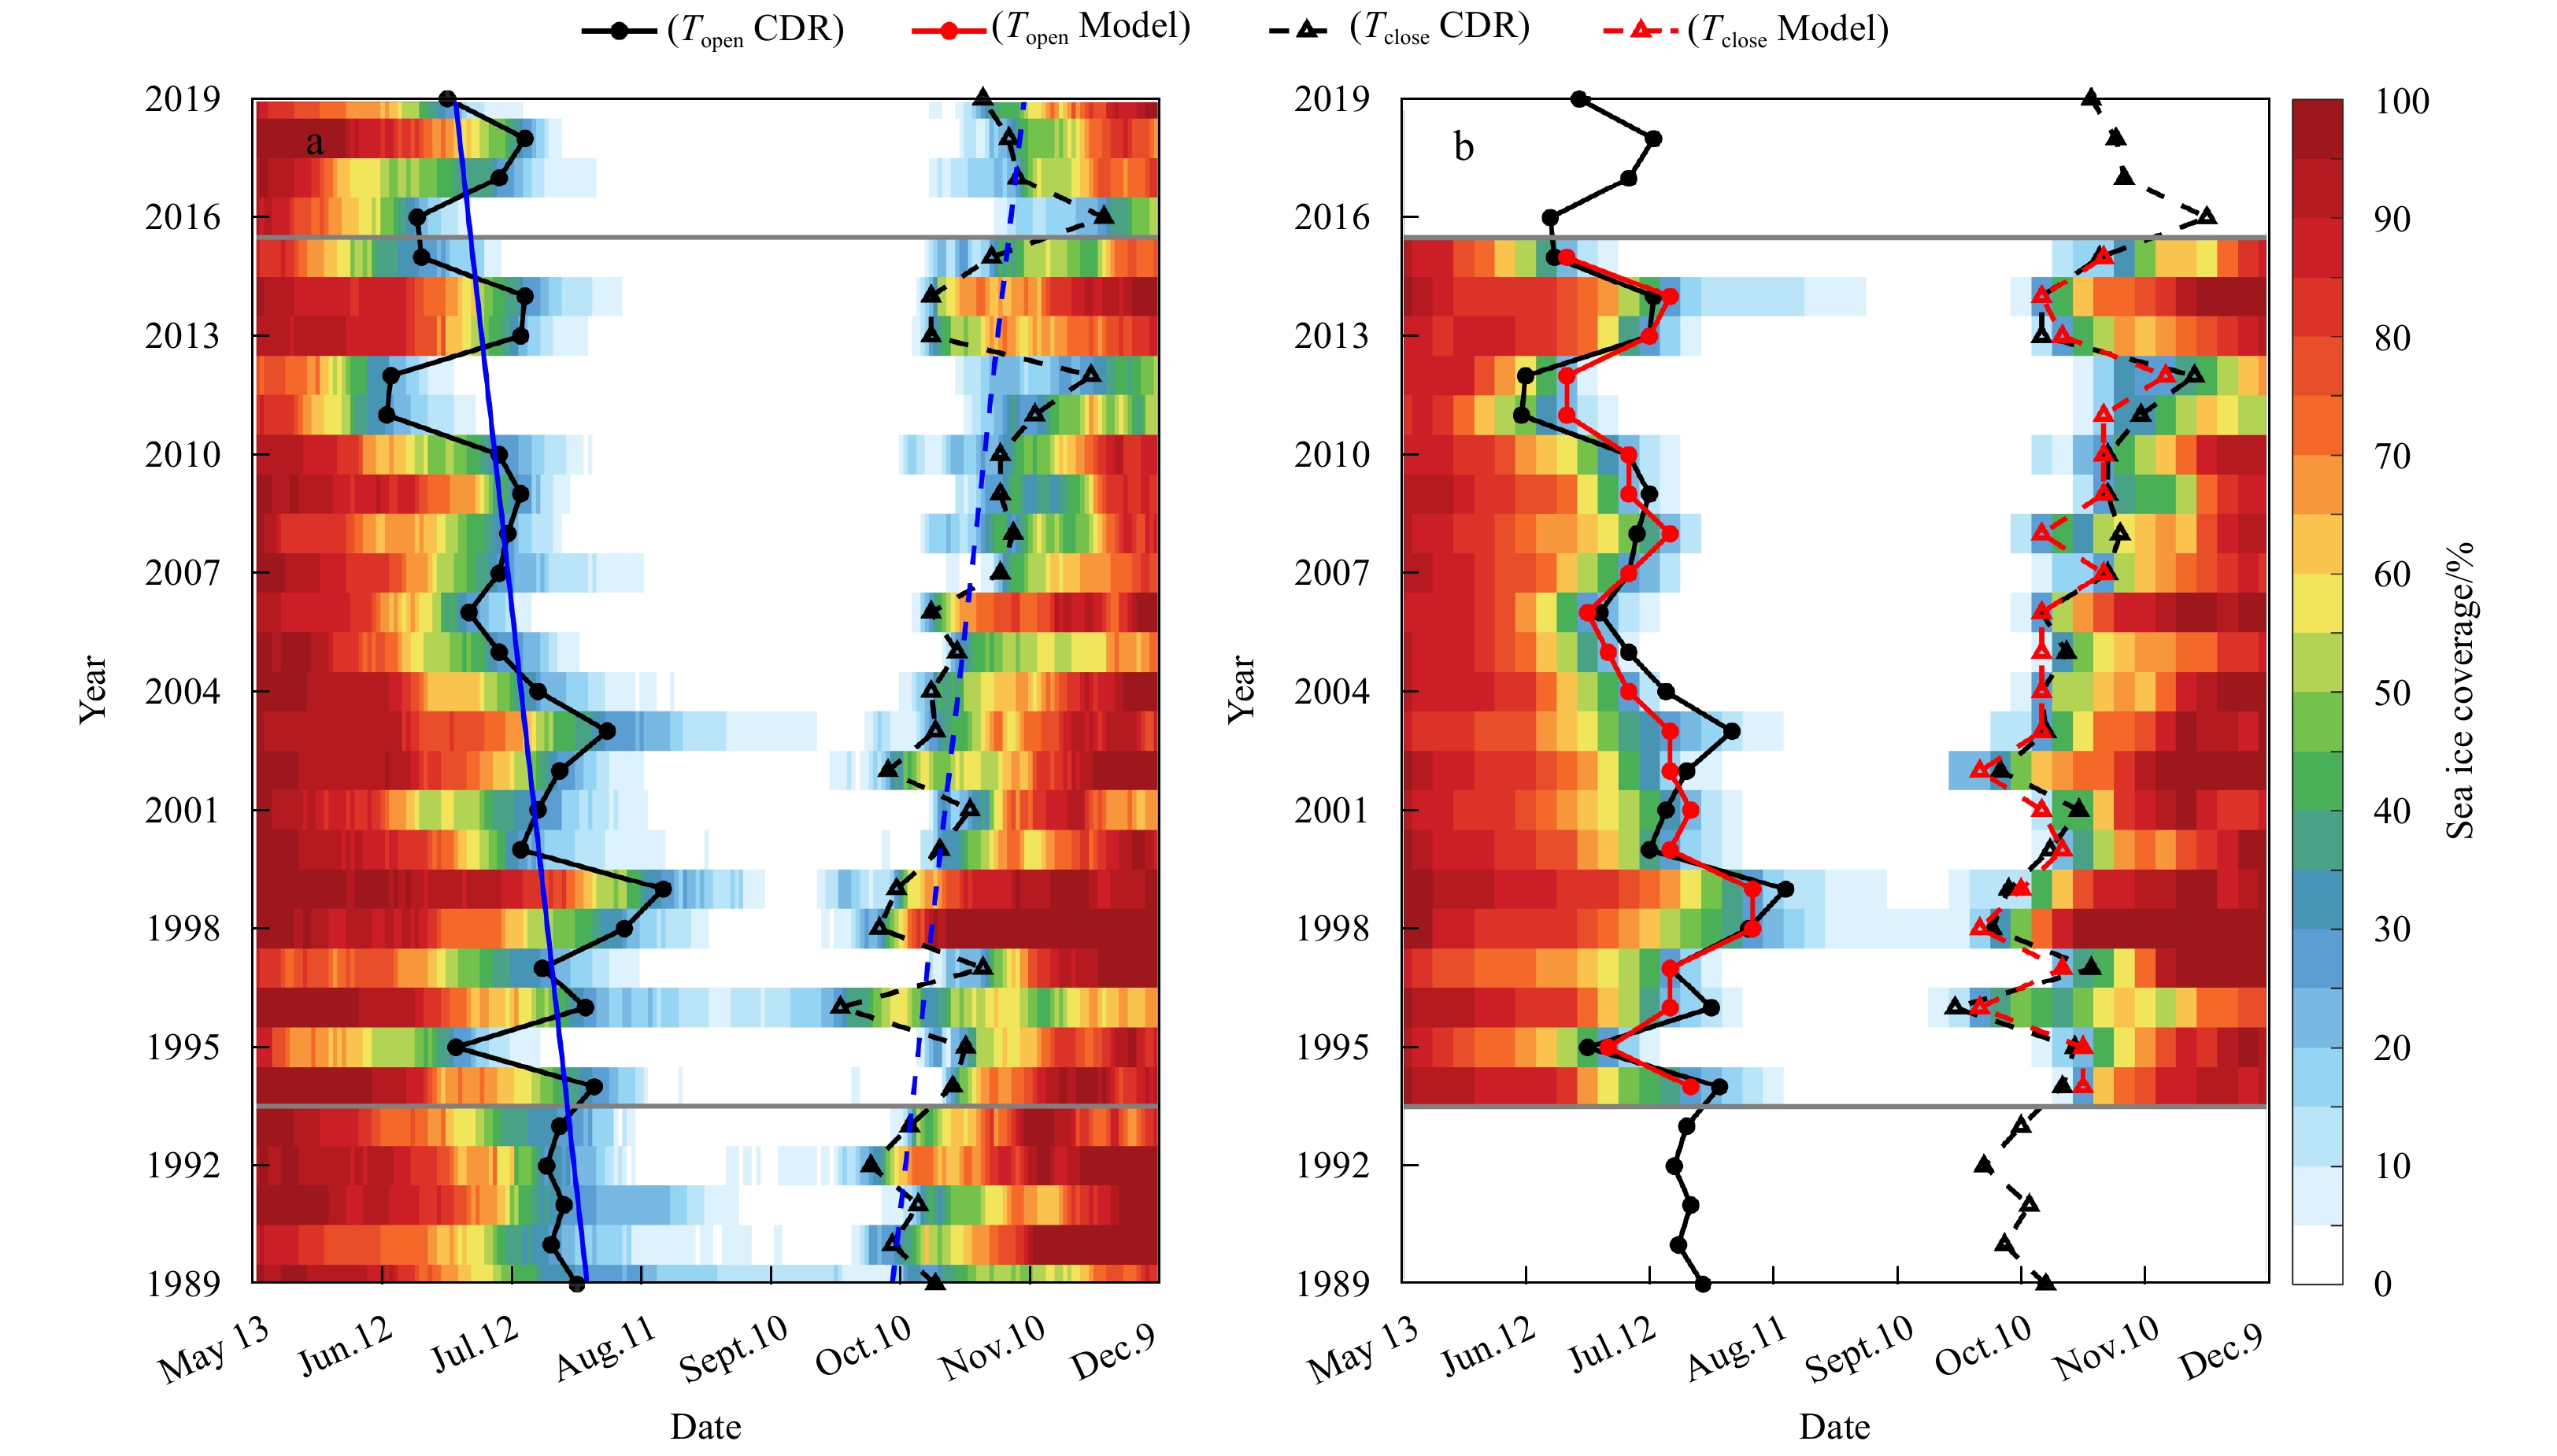
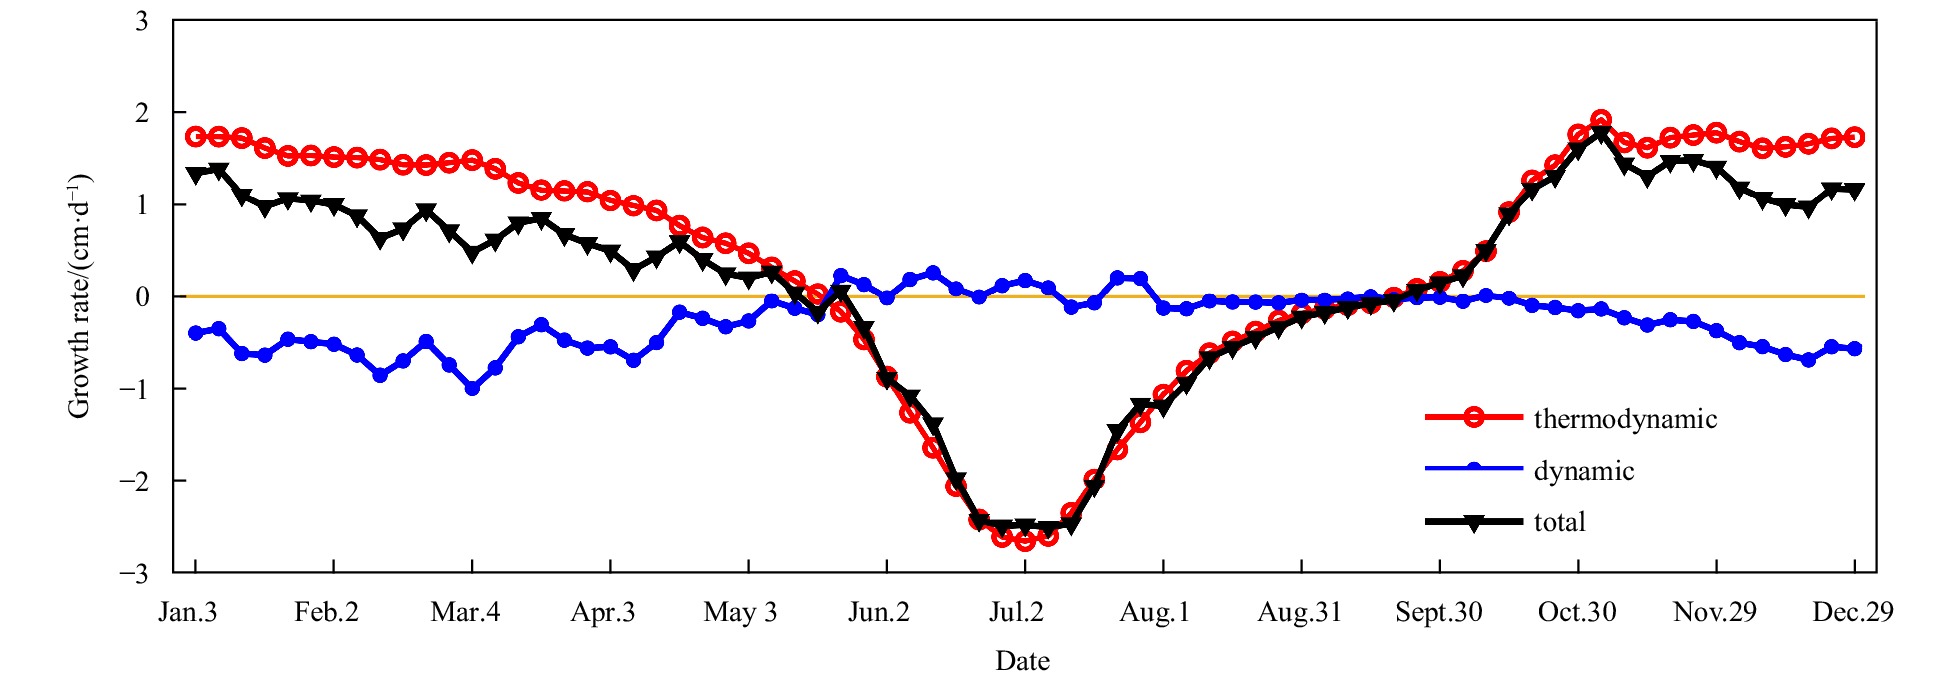
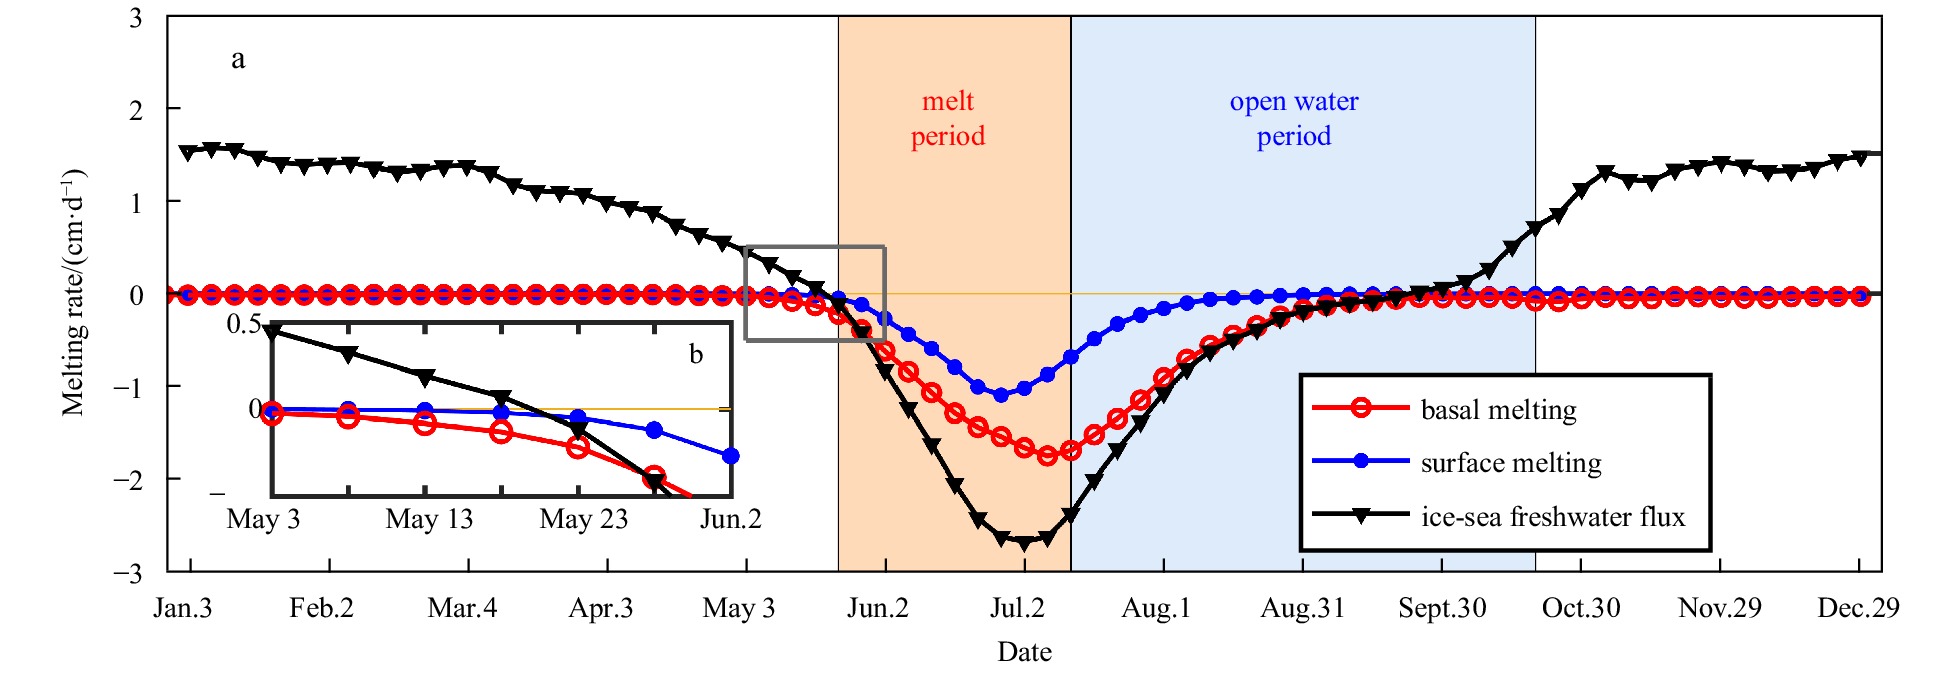
The sea ice conditions in the Kara Sea have important impacts on Arctic shipping, oil and gas production, and marine environmental changes. In this study, sea ice coverage (CR) less than 30% is considered as open water, its onset and end dates are defined as Topen and Tclose, respectively. The sea ice melt onset (Tmelt) is defined as the date when ice-sea freshwater flux initially changes from ice into the ocean. Satellite-based sea ice concentration (SIC) from 1989 to 2019 shows a negative correlation between Topen and Tclose (r = –0.77, p < 0.01) in the Kara Sea. This phenomenon is also obtained through analyzing the hindcast simulation from 1994 to 2015 by a coupled ocean and sea-ice model (NAPA1/4). The model results reveal that thermodynamics dominate the sea ice variations, and ice basal melt is greater than the ice surface melt. Heat budget estimation suggests that the heat flux is significant correlated with Topen (r = –0.95, p < 0.01) during the melt period (the duration of multi-year averaged Tmelt to Topen) influenced by the sea ice conditions. Additionally, this heat flux is also suggested to dominate the interannual variation of the heat input during the whole heat absorption process (r = 0.81, p < 0.01). The more heat input during this process leads to later Tclose (r = 0.77, p < 0.01). This is the physical basis of the negative correlation between Topen and Tclose. Therefore, the duration of open water can be predicted by Topen and thence support earlier planning of marine activities.
Considering these positive feedbacks, the Arctic warming or cooling can be triggered by the circulation disturbance, which can be originated from the tropical forcing through atmospheric teleconnections, particular the forcing from the El Niño and Southern Oscillation (ENSO) (Neelin et al., 1998; Lee, 2012; Hu et al., 2016; Timmermann et al., 2018). As a dominant source of global interannual climate variability, ENSO can induce interannual fluctuations in Arctic climate (Bjerknes, 1969; Wyrtki, 1975; Schopf and Suarez, 1988; Jin, 1997). ENSO-associated tropical sea surface temperature anomalies (SSTAs) and latent heat fluxes can excite poleward-propagating atmospheric Rossby waves, then regulate the Arctic climate (Hoskins and Karoly, 1981; Sardeshmukh and Hoskins, 1988; Lee and Yoo, 2014). Previous studies have reported that the El Niño usually coincides with anomalous cooling over the East Siberian Sea, while La Niña often coincides with anomalous warming of the Kara Sea during boreal winter (Lee, 2012).
However, considering the changes in ENSO diversity, these linkages between ENSO and Arctic climate are not stable. In particular, the so-called central Pacific (CP) El Niño events have prevailed since the 1980s, which stimulates a lot of research to be devoted to the changes and impacts of the ENSO diversity (Larkin and Harrison, 2005; Ashok et al., 2007; Zhang et al., 2015, 2019). At present, few studies focus on the relationship between ENSO and Arctic climate from the perspective of ENSO diversity. Recently, two studies have investigated the different impacts of the CP and eastern Pacific (EP) events on the Arctic climate during boreal summer and boreal winter. Hu et al. (2016) indicated that compared to the EP El Niño, the CP El Niño events have an opposite effect on the Arctic, which can inhibit the Arctic warming and sea-ice melting in summer. Li et al. (2019) investigated the different responses of Arctic surface air temperature to EP and CP ENSO types during boreal winter, and they found the EP ENSO events are accompanied by SAT responses over the Barents-Kara seas in February, while the CP events coincide with significant responses over the northeastern Canada and Greenland. And they also concluded that these impacts are largely of opposite sign for ENSO warm and cold phases.
The ENSO flavors are usually monitored by the sea surface temperature anomaly (SSTA) spatial patterns. Our previous studies have indicated that more than only CP and EP ENSO events, ten SSTA spatial patterns are obtained by a novel method, which combines the empirical orthogonal function (EOF) analysis and K-means clustering algorithm (Li et al., 2021). The changes of the warm and cold ENSO events are asymmetrical. And the changes in La Niña seems more distinct. Hence a question arises: Are there any changes of the impacts from the changing La Niña flavors?
To address the question, we identify the ENSO types based on our previous result. Section 2 provides the introduction of the datasets and methods. The changes in ENSO diversity are described in Section 3. The impacts of different La Niña events on the Arctic climate and the underlying mechanisms are investigated in Section 4. Finally, conclusions and discussions are highlighted.
2.
Data and methods
The present study uses monthly sea surface temperature (SSTs) from the Met Office Hadley Centre's sea ice and sea surface temperature (SST) data set version 1 (HadISST1) with a 1°×1° grid (Rayner, 2003) and the National Oceanic and Atmospheric Administration (NOAA) interpolated outgoing longwave radiation (OLR) dataset (Liebmann and Smith, 1996). The OLR available since 1979 represents tropical convection. The atmospheric components are taken from the National Centers for Environmental Prediction/National Center for Atmospheric Research (NCEP/NCAR) reanalysis products (Kalnay et al., 1996). These variables are available from 1948 to the present, with a 2.5°×2.5° horizontal resolution. In addition, a simple dry model named the linear baroclinic model (LBM) was used in our present study to examine the influence of the SSTAs-related convection on the Arctic climate. The LBM employed in this study is a time-dependent model based on primitive equations. The model had a resolution of T42 in the horizontal direction and 20 sigma levels in the vertical direction. More details can be found in Watanabe and Jin (2003).
3.
Changes in ENSO diversity
The ENSO diversity is made up of a rich variety of SSTA patterns among ENSO events. The recent accumulated CP El Niño events have been regarded as a possible harbinger of changes in ENSO due to global warming (Yeh et al., 2009). With the widespread attention to the different ENSO types, several methods have been proposed to identify the SSTA patterns. Besides the CP and EP ENSO events, much more ENSO types are identified via the details of the SSTAs spatial distribution (Ashok et al., 2012; Cai et al., 2014, 2015; Capotondi et al., 2015).
Inspired by these studies, we have proposed a novel method combining the EOF analysis and the K-means clustering method to identify the tropical SSTA flavors. The SSTA fields of all months are reasonably grouped into 10 categories (Li et al., 2021), and the cluster result can be found in Fig. S1. Since the ENSO events usually peak during the boreal winter, we combine the SSTA fields of each category during December, January, and February to illustrate the changes in ENSO diversity.
The composited SSTA spatial patterns during boreal winter are nearly consistent with our previous work (Li et al., 2021). Among the ten categories, three La Niña-like SSTA patterns (cluster 4, cluster 6, and cluster 7) and three El Niño-like patterns (cluster 2, cluster 5, and cluster 9) are contained (Fig. 1). Our current study is mainly focused on these three La Niña type events. Cluster 4 shows a basin-wide cooling spatial pattern, cluster 6 represents the canonical La Niña, and cluster 7 exhibits a typical central Pacific La Niña event. The last two types of La Niña events have a cooling center near the dateline, and the extreme La Niña events usually belong to cluster 6.
Figure
1.
Composited sea surface temperature anomaly (SSTA) spatial distribution for ten clusters in boreal winter month (December, January and February) during 1950−2016, where the dots indicate 95% significance.
Then to depict the changes of the ENSO diversity clearly, the occurrence frequency differences for different ENSO events are compared before and after 1980 (Fig. 2). Before 1980, the basin-wide cooling event (cluster 4) acts as the dominant cold event with the highest frequency. After 1980, the frequency for this dominant cold event has dropped to a low level. In contrast, the frequencies for the other two kinds of La Niña events with central Pacific cooling have increased, which also supports the westward air-sea interaction center under global warming. Therefore, we will check the different impacts on Arctic climate due to the La Niña type changing.
Figure
2.
The percentage of occurrence frequency (months) of ten clusters respectively in winter (December, January, and February) during 1950−1979 (blue bars) and 1980−2016 (red bars).
4.
Opposite impacts of different La Niña events on Arctic SAT
The ENSO events usually influence the interannual Arctic climate via the poleward-propagating atmospheric Rossby waves (Lee and Yoo, 2014). Therefore, the La Niña-related atmospheric waves are first examined to confirm the physical linkage between ENSO and the Arctic climate.
These three La Niña types all exhibit significant extratropical Rossby wave propagation pathways. The large-scale circulation anomalies (200 hPa geopotential height and wave activity flux) for the three type events are shown in Fig. 3. For the basin-wide cooling events (cluster 4), significant negative height anomalies are evident mainly over the tropics and northern Canada (Fig. 3a). The canonical La Niña events (cluster 6) excite a similar teleconnection pattern (Fig. 3b). Around the Arctic region, significant negative height anomalies extend from the Beaufort Sea to Greenland. In contrast to these two La Niña types, the recent frequent CP La Niña events (cluster 7) triggered positive height anomalies around the Arctic from the Barents-Kara seas to Greenland (Fig. 3c).
Figure
3.
Composited 200 hPa geopotential height anomalies (shading) and the wave activity flux anomalies (black vectors, unit: W/m2) for the events of cluster 4 (a), cluster 6 (b) and cluster 7 (c), respectively, and the dots indicate 95% significance.
Consistent with the opposite anomalous geophysical height anomalies over the Arctic, the low-level temperature anomalies for the recent frequent CP La Niña events (cluster 7) are also opposed to those of the canonical and basin-wide cooling La Niña events (Fig. 4). Both the canonical La Niña events and the basin-wide cooling La Niña events seem to induce anomalous cooling from the Beaufort Sea to Greenland (Figs 4a and b), while the CP La Niña events seem to induce anomalous warming over northern Canada and southern Greenland (Fig. 4c). Since the areas from the Beaufort Sea to Greenland are the key regions for Arctic warming (e.g., Screen and Simmonds, 2010), it seems that in contrast to previous La Niña events, the recent frequent CP cold ENSO events may warm northern Canada and Greenland accelerating Arctic warming.
Figure
4.
Composited temperature anomalies at 925 hPa for the events of cluster 4 (a), cluster 6 (b) and cluster 7 (c), respectively, and the dots indicate 95% significance.
The canonical La Niña-related atmospheric teleconnections are nearly consistent with those of the basin-wide cooling events, and the canonical La Niña events also occur frequently since the 1980s. Considering the limitation of the OLR dataset, the canonical La Niña events and the frequent CP La Niña events are compared to illustrate the changes for the impacts on Arctic climate. Since the tropical ENSO-related convections act as the energy source driving the atmospheric circulation, the changes in these La Niña-related SSTA spatial patterns may change the convection distribution over the tropical Pacific basin, then can trigger different atmospheric teleconnections inducing different Arctic responses.
The convection distributions and the low-level circulation for the canonical La Niña events and the CP La Niña events are compared in Fig. 5. A dipole convection pattern in the tropics and strengthened Walker Circulation can be found in both La Niña events, with enhanced convection over the western Pacific and suppressed convection over the eastern Pacific. The enhanced convection distributions over the western Pacific show significant differences for these two La Niña types. The enhanced convections for the canonical La Niña events over the western Pacific are nearly symmetrical about the equator (Fig. 5a), however, the CP La Niña-related enhanced convections are over the north of the equator (Fig. 5b). A typical Matsuno-Gill response can be found for the canonical La Niña events (Fig. 5a), and the related teleconnections to the extratropics are triggered by the enhanced tropical convection, inducing large-scale subsidence within an anticyclone over the northeast Pacific near the Aleutian Islands with positive 850 hPa height anomalies (Fig. 5c). Within the subtropical anticyclones, anomalous upper tropospheric convergence is the most important source of Rossby wave forcing and these waves can eventually propagate to the mid-latitudes and high latitudes (Brands, 2017). On the other hand, the northward enhanced deep convections for the CP La Niña events over the western Pacific induce a basin-wide anticyclone over the North Pacific, which tilts from southwest to northeast (Fig. 5b). The anticyclone related positive 850 hPa height anomalies even extends to Greenland with a negative center over the northeast Asia. In contrast to the induced cooling around the north of Canada by the canonical La Niña events (Fig. 4b), significant warming extends from the Beaufort Sea to Greenland for the frequent CP La Niña events (Fig. 4c), which is related with the positive 850 hPa height anomalies (Fig. 5d). Considering the influences of topography, the composition for the height anomalies at 850 hPa is not statistically significant. However, the compositions at the up levels (Fig. 3c) have passed the significance test, indicating a significant equivalent barotropic feature. The positive height anomalies are corresponding to the surface warming as a result of subsidence.
Figure
5.
Composited outgoing longwave radiation (OLR) anomalies (shading; the dots indicate 95% significance) and anomalous wind at 850 hPa (vector) for the events of cluster 6 (a) and cluster 7 (b), respectively; and composited 850 hPa geopotential height anomalies for cluster 6 (c) and cluster 7 (d), respectively.
Based on the above analysis, we speculated that the northward deep convections over the western Pacific may change the impacts on the Arctic, particularly from the Beaufort Sea to Greenland. To confirm our hypothesis, two sensitive numerical experiments by the linear baroclinic model (LBM) are carried. Since the convection mainly drives the atmospheric circulation through the diabatic heating, the different elliptical areas of additional heating are added for the sensitive experiments according to the convection distributions of the ENSO events (Fig. S2). In this study, the sensitive numerical experiment is set up according to the convection distributions for the canonical La Niña events and CP La Niña events, respectively (Fig. 6) by changing the location of the sensible heating center (Fig. S2). Results from the experiments support the effectiveness of the northward convections for the CP La Niña events (Fig. 6b). The heating over the north of the equator induces positive 850 hPa height anomalies over the north of Canada, which is opposite to the results induced by the symmetric heating about the equator. Considering the local positive feedbacks over the Arctic, the canonical La Niña events could trigger the north of Canada cooling, while the CP La Niña events can warm northern Canada and part of Greenland through the meridional movement of the convection center.
Figure
6.
Geopotential height anomalies at 850 hPa resulted from heat forcing sensitive experiments that are set according to Figs 4b and c, respectively.
Considering the great impacts of the Arctic amplification, the Arctic climate has received increasing attention under global warming. Meanwhile, ENSO events exhibit considerable diversity in their frequency, location, intensity, and meridional scale. However, few studies investigate the linkage between ENSO and Arctic climate from the perspective of ENSO diversity. The recent studies have investigated the different impacts on Arctic climate of the CP and EP ENSO events and concluded that these impacts are largely of opposite sign for ENSO warm and cold phases. Following our previous results, the changes for the warm and clod ENSO events show significant asymmetrical features, particularly the La Niña events. Therefore, the impacts on the Arctic climate by the changing La Niña types are investigated.
Compared to the past frequent basin-wide cooling La Niña events, since the 1980s the cooling center for the La Niña event has strengthened and moved westward along with the increasing frequency for the canonical and CP La Niña events. The impacts of the recent frequent CP La Niña events induce significant warming from the Beaufort Sea to Greenland, which is opposite to those of the basin-wide cooling and canonical La Niña events and is in favor of the Arctic warming.
In contrast to the other La Niña types, the deep convection centers for the CP La Niña events are located over the north of the equator instead of nearly symmetrical about the equator. The changes in the meridional movement of the ENSO-related convection center cause variations in atmospheric teleconnections inducing different responses in the Arctic via local positive feedbacks, such as the ice-albedo feedback (Budyko, 1969; Sellers, 1969; Hall, 2004; Ogi and Wallace, 2012; Stroeve et al., 2012), water vapor-cloud cover feedbacks (Francis and Hunter, 2006; Abbot and Tziperman, 2008; Kay et al., 2008; Screen and Simmonds, 2010; Ghatak and Miller, 2013) and the local lapse rate feedback (Pithan and Mauritsen, 2014; Stuecker et al., 2018). The observed Arctic responses are also supported by the numerical experiments. The changes in ENSO diversity are suggested to be regulated by changes in the tropical Pacific mean state under global warming. Our results suggest that besides the direct impacts from the greenhouse gas, the changes in La Niña type may also accelerate the Arctic warming.
Aksenov Y, Popova E E, Yool A, et al. 2017. On the future navigability of Arctic sea routes: High-resolution projections of the Arctic Ocean and sea ice. Marine Policy, 75: 300–317. doi: 10.1016/j.marpol.2015.12.027
[2]
Barnhart K R, Miller C R, Overeem I, et al. 2016. Mapping the future expansion of Arctic open water. Nature Climate Change, 6(3): 280–285. doi: 10.1038/nclimate2848
[3]
Belchansky G I, Douglas D C, Platonov N G. 2004. Duration of the Arctic Sea ice melt season: Regional and interannual variability, 1979–2001. Journal of Climate, 17(1): 67–80. doi: 10.1175/1520-0442(2004)017<0067:DOTASI>2.0.CO;2
[4]
Bird K J, Charpentier R R, Gautier D L, et al. 2008. Circum-arctic resource appraisal: Estimates of Undiscovered Oil and Gas North of the Arctic Circle. USGS Numbered Series 2008–3049. U.S. Geological Survey, 1–4
[5]
Bitz C M, Holland M M, Weaver A J, et al. 2001. Simulating the ice-thickness distribution in a coupled climate model. Journal of Geophysical Research: Oceans, 106(C2): 2441–2463. doi: 10.1029/1999jc000113
[6]
Blanchard-Wrigglesworth E, Armour K C, Bitz C M, et al. 2011. Persistence and inherent predictability of arctic sea ice in a GCM ensemble and observations. Journal of Climate, 24(1): 231–250. doi: 10.1175/2010JCLI3775.1
[7]
Bliss A C, Anderson M R. 2014. Daily area of snow melt onset on Arctic sea ice from passive microwave satellite observations 1979–2012. Remote Sensing, 6(11): 11283–11314. doi: 10.3390/rs61111283
[8]
Cavalieri D J, Gloersen P, Campbell W J. 1984. Determination of sea ice parameters with the Nimbus 7 SMMR. Journal of Geophysical Research: Atmospheres, 89(D4): 5355–5369. doi: 10.1029/JD089iD04p05355
[9]
Cavalieri D J, Parkinson C L. 2012. Arctic sea ice variability and trends, 1979–2010. The Cryosphere, 6(4): 881–889. doi: 10.5194/tc-6-881-2012
[10]
Chen Ping, Zhao Jinping. 2017. Impacts of surface wind on regional and integrated changes of sea ice in the Arctic. Periodical of Ocean University of China (in Chinese), 47(8): 1–12. doi: 10.16441/j.cnki.hdxb.20160212
[11]
Comiso J C. 1986. Characteristics of Arctic winter sea ice from satellite multispectral microwave observations. Journal of Geophysical Research: Oceans, 91(C1): 975–994. doi: 10.1029/JC091iC01p00975
[12]
Comiso J C, Nishio F. 2008. Trends in the sea ice cover using enhanced and compatible AMSR-E, SSM/I, and SMMR data. Journal of Geophysical Research: Oceans, 113(2): C02S07. doi: 10.1029/2007JC004257
Dmitrenko I A, Rudels B, Kirillov S A, et al. 2015. Atlantic water flow into the Arctic Ocean through the St. Anna Trough in the northern Kara Sea. Journal of Geophysical Research: Oceans, 120(7): 5158–5178. doi: 10.1002/2015JC010804
[15]
Duan Chenglin, Dong Sheng, Wang Zhifeng. 2019a. Sea ice regime in the Kara Sea during 2003–2017 based on high-resolution satellite data. Polish Polar Research, 40(3): 205–225. doi: 10.24425/ppr.2019.129671
[16]
Duan Chenglin, Dong Sheng, Xie Zexiao, et al. 2019b. Temporal variability and trends of sea ice in the Kara Sea and their relationship with atmospheric factors. Polar Science, 20: 136–147. doi: 10.1016/j.polar.2019.03.002
[17]
Flanner M G, Shell K M, Barlage M, et al. 2011. Radiative forcing and albedo feedback from the Northern Hemisphere cryosphere between 1979 and 2008. Nature Geoscience, 4(3): 151–155. doi: 10.1038/ngeo1062
[18]
Gautier D L, Bird K J, Charpentier R R, et al. 2009. Assessment of undiscovered oil and gas in the Arctic. Science, 324(5931): 1175–1179. doi: 10.1126/science.1169467
[19]
Hu Xianmin, Sun Jiangfan, Chan T O, et al. 2018. Thermodynamic and dynamic ice thickness contributions in the Canadian Arctic Archipelago in NEMO-LIM2 numerical simulations. The Cryosphere, 12(4): 1233–1247. doi: 10.5194/tc-12-1233-2018
[20]
Ikeda M, Wang Jiang, Zhao Jinping. 2011. Hypersensitive decadal oscillations in the Arctic/subarctic climate. Geophysical Research Letters, 28(7): 1275–1278. doi: 10.1029/2000GL011773
[21]
Johnson M A, Eicken H. 2016. Estimating Arctic sea-ice freeze-up and break-up from the satellite record: A comparison of different approaches in the Chukchi and Beaufort Seas. Elementa-Science of the Anthropocene, 4: 000124. doi: 10.12952/journal.elementa.000124
[22]
Kern S, Harms I, Bakan S, et al. 2005. A comprehensive view of Kara Sea polynya dynamics, sea-ice compactness and export from model and remote sensing data. Geophysical Research Letters, 32(15): L15501. doi: 10.1029/2005GL023532
[23]
Kim K Y, Hamlington B D, Na H N, et al. 2016. Mechanism of seasonal Arctic sea ice evolution and Arctic amplification. The Cryosphere, 10(5): 2191–2202. doi: 10.5194/tc-10-2191-2016
[24]
Lebrun M, Vancoppenolle M, Madec G, et al. 2019. Arctic sea-ice-free season projected to extend into autumn. The Cryosphere, 13(1): 79–96. doi: 10.5194/tc-13-79-2019
[25]
Lei Ruibo, Tian-Kunze X, Leppäranta M, et al. 2016. Changes in summer sea ice, albedo, and portioning of surface solar radiation in the Pacific sector of Arctic Ocean during 1982–2009. Journal of Geophysical Research: Oceans, 121(8): 5470–5486. doi: 10.1002/2016JC011831
[26]
Lei Ruibo, Xie Hongjie, Wang Jia, et al. 2015. Changes in sea ice conditions along the Arctic Northeast Passage from 1979 to 2012. Cold Regions Science and Technology, 119: 132–144. doi: 10.1016/j.coldregions.2015.08.004
[27]
Leifer I, Chen F R, McClimans T, et al. 2018. Satellite ice extent, sea surface temperature, and atmospheric methane trends in the Barents and Kara seas. The Cryosphere Discuss, 1–45. doi: 10.5194/tc-2018-75
[28]
Lien V S, Schlichtholz P, Skagseth Ø, et al. 2017. Wind-driven atlantic water flow as a direct mode for reduced barents sea ice cover. Journal of Climate, 30(2): 803–812. doi: 10.1175/jcli-d-16-0025.1
[29]
Lindsay R, Schweiger A. 2015. Arctic sea ice thickness loss determined using subsurface, aircraft, and satellite observations. The Cryosphere, 9(1): 269–283. doi: 10.5194/tc-9-269-2015
[30]
Lindsay R W, Zhang Jinlun. 2005. The thinning of Arctic Sea Ice, 1988–2003: have we passed a tipping point?. Journal of Climate, 18(22): 4879–4894. doi: 10.1175/JCLI3587.1
[31]
Luo Xiaofan, Hu Xianmin, Nie Hongtao, et al. 2019. Evaluation of hindcast simulation with the ocean and sea-ice model covering the Arctic and adjacent oceans. Haiyang Xuebao (in Chinese), 41(9): 1–12. doi: 10.3969/j.issn.0253-4193.2019.09.001
[32]
Madec G. 2008. NEMO ocean engine, version 3.6. Note du Pôle de Modélisation, Institut Pierre-Simon Laplace, 27: 386
[33]
Madec G, Imbard M. 1996. A global ocean mesh to overcome the North Pole singularity. Climate Dynamics, 12(6): 381–388. doi: 10.1007/BF00211684
[34]
Markus T, Stroeve J C, Miller J. 2009. Recent changes in Arctic sea ice melt onset, freezeup, and melt season length. Journal of Geophysical Research: Oceans, 114(C12): C12024. doi: 10.1029/2009JC005436
[35]
Maslanik J A, Serreze M C, Barry R G. 1996. Recent decreases in Arctic summer ice cover and linkages to atmospheric circulation anomalies. Geophysical Research Letters, 23(13): 1677–1680. doi: 10.1029/96GL01426
[36]
Meier W N, Fetterer F, Duerr R, et al. 2017. NOAA/NSIDC climate data record of passive microwave sea ice concentration, Version 3. Boulder, Colorado USA. NSIDC: National Snow and Ice Data Center, doi: 10.7265/N59P2ZTG
[37]
Mysak L A, Venegas S A. 1998. Decadal climate oscillations in the Arctic: A new feedback loop for atmosphere-ice-ocean interactions. Geophysical Research Letters, 25(19): 3607–3610. doi: 10.1029/98GL02782
[38]
Navy’s Task Force Climate Change. 2014. The United States navy arctic roadmap for 2014 to 2030. Washington, D C: University of North Texas Libraries, UNT Digital Library
[39]
Ogi M, Rigor I G, McPhee M G, et al. 2008. Summer retreat of Arctic sea ice: Role of summer winds. Geophysical Research Letters, 35(24): L24701. doi: 10.1029/2008GL035672
[40]
Onarheim I H, Eldevik T, Smedsrud L H, et al. 2018. Seasonal and regional manifestation of arctic sea ice loss. Journal of Climate, 31(12): 4917–4932. doi: 10.1175/JCLI-D-17-0427.1
[41]
Osadchiev A A, Izhitskiy A S, Zavialov P O, et al. 2017. Structure of the buoyant plume formed by Ob and Yenisei river discharge in the southern part of the Kara Sea during summer and autumn. Journal of Geophysical Research: Oceans, 122(7): 5916–5935. doi: 10.1002/2016JC012603
[42]
Perovich D K, Light B, Eicken H, et al. 2007b. Increasing solar heating of the Arctic Ocean and adjacent seas, 1979–2005: Attribution and role in the ice-albedo feedback. Geophysical Research Letters, 34(19): L19505. doi: 10.1029/2007GL031480
[43]
Perovich D K, Nghiem S V, Markus T, et al. 2007a. Seasonal evolution and interannual variability of the local solar energy absorbed by the Arctic sea ice-ocean system. Journal of Geophysical Research: Oceans, 112(3): C03005. doi: 10.1029/2006JC003558
[44]
Polyakov I V, Alekseev G V, Bekryaev R V, et al. 2003. Long-term ice variability in Arctic marginal seas. Journal of Climate, 16(12): 2078–2085. doi: 10.1175/1520-0442(2003)016<2078:LIVIAM>2.0.CO;2
Rousset C, Vancoppenolle M, Madec G, et al. 2015. The Louvain-La-Neuve sea ice model LIM3.6: global and regional capabilities. Geoscientific Model Development, 8(10): 2991–3005. doi: 10.5194/gmd-8-2991-2015
[47]
Screen J A, Simmonds I. 2010. The central role of diminishing sea ice in recent Arctic temperature amplification. Nature, 464(7293): 1334–1337. doi: 10.1038/nature09051
[48]
Serreze M C, Barry R G. 2011. Processes and impacts of Arctic amplification: A research synthesis. Global and Planetary Change, 77(1–2): 85–96. doi: 10.1016/j.gloplacha.2011.03.004
[49]
Serreze M C, Crawford A D, Stroeve J C, et al. 2016. Variability, trends, and predictability of seasonal sea ice retreat and advance in the Chukchi Sea. Journal of Geophysical Research: Oceans, 121(10): 7308–7325. doi: 10.1002/2016JC011977
[50]
Simmonds I. 2015. Comparing and contrasting the behaviour of Arctic and Antarctic sea ice over the 35 year period 1979–2013. Annals of Glaciology, 56(691): 18–28. doi: 10.3189/2015AoG69A909
[51]
Stammerjohn S, Massom R, Rind D, et al. 2012. Regions of rapid sea ice change: An inter-hemispheric seasonal comparison. Geophysical Research Letters, 39(6): L06501. doi: 10.1029/2012GL050874
[52]
Stroeve J C, Crawford A D, Stammerjohn S. 2016. Using timing of ice retreat to predict timing of fall freeze-up in the Arctic. Geophysical Research Letters, 43(12): 6332–6340. doi: 10.1002/2016GL069314
[53]
Stroeve J C, Markus T, Boisvert L, et al. 2014. Changes in Arctic melt season and implications for sea ice loss. Geophysical Research Letters, 41(4): 1216–1225. doi: 10.1002/2013GL058951
[54]
Stroeve J C, Notz D. 2018. Changing state of Arctic sea ice across all seasons. Environmental Research Letters, 13(10): 3001. doi: 10.1088/1748-9326/aade56
[55]
Uotila P, Iovino D, Vancoppenolle M, et al. 2017. Comparing sea ice, hydrography and circulation between NEMO3.6 LIM3 and LIM2. Geoscientific Model Development, 10(2): 1009–1031. doi: 10.5194/gmd-10-1009-2017
[56]
Vancoppenolle M, Fichefet T, Goosse H, et al. 2009. Simulating the mass balance and salinity of Arctic and Antarctic sea ice. 1. Model description and validation. Ocean Modelling, 27(1–2): 33–53. doi: 10.1016/j.ocemod.2008.10.005
[57]
Wang Yali, Luo Xiaofan, Zhang Yongli, et al. 2019a. Heat budget analysis during the ice-melting season in the Chukchi Sea based on a model simulation. Chinese Science Bulletin (in Chinese), 64(33): 3485–3497. doi: 10.1360/N972019-00322
[58]
Wang Yunhe, Bi Haibo, Huang Haijun, et al. 2019b. Satellite-observed trends in the Arctic sea ice concentration for the period 1979–2016. Journal of Oceanology and Limnology, 37(1): 18–37. doi: 10.1007/s00343-019-7284-0
[59]
Woodgate R A. 2018. Increases in the Pacific inflow to the Arctic from 1990 to 2015, and insights into seasonal trends and driving mechanisms from year-round Bering Strait mooring data. Progress in Oceanography, 160: 124–154. doi: 10.1016/j.pocean.2017.12.007
[60]
Woodgate R A, Stafford K M, Prahl F G. 2015. A synthesis of year-round interdisciplinary mooring measurements in the bering strait (1990–2014) and the RUSALCA Years (2004–2011). Oceanography, 28(3SI): 46–67. doi: 10.5670/oceanog.2015.57
[61]
Zhang Jinlun, Rothrock D, Steele M. 2000. Recent changes in Arctic sea ice: The interplay between ice dynamics and thermodynamics. Journal of Climate, 13(17): 3099–3114. doi: 10.1175/1520-0442(2000)013<3099:RCIASI>2.0.CO;2
[62]
Zhang Yongli, Wei Hao, Lu Youyu, et al. 2020. Dependence of Beaufort Sea low ice condition in the summer of 1998 on ice export in the prior winter. Journal of Climate, 33(21): 9247–9259. doi: 10.1175/jcli-d-19-0943.1
Pavel Shabanov, Alexander Osadchiev, Natalya Shabanova, et al. Decline in Ice Coverage and Ice-Free Period Extension in the Kara and Laptev Seas during 1979–2022. Remote Sensing, 2024, 16(11): 1875. doi:10.3390/rs16111875
2.
Chunming Dong, Xiaofan Luo, Hongtao Nie, et al. Effect of compressive strength on the performance of the NEMO-LIM model in Arctic Sea ice simulation. Journal of Oceanology and Limnology, 2023, 41(1): 1. doi:10.1007/s00343-022-1241-z
3.
Zijia Zheng, Xiaofan Luo, Hao Wei, et al. Modeling the Continental Shelf Pump for Dissolved Inorganic Carbon in the Chukchi Sea From 1998 to 2015. Journal of Geophysical Research: Oceans, 2023, 128(8) doi:10.1029/2023JC020094
4.
Chunming Dong, Xiaofan Luo, Zijia Zheng, et al. Regime Shift in Annual Nitrate Concentration in the Upper Southern Chukchi Borderland Responded to the Westward Shift of the Beaufort Gyre. Journal of Geophysical Research: Oceans, 2022, 127(10) doi:10.1029/2022JC018846
Jing Li, Lin Mu, Linhao Zhong. Frequent central Pacific La Niña events may accelerate Arctic warming since the 1980s[J]. Acta Oceanologica Sinica, 2021, 40(11): 62-69. doi: 10.1007/s13131-021/1843-x
Jing Li, Lin Mu, Linhao Zhong. Frequent central Pacific La Niña events may accelerate Arctic warming since the 1980s[J]. Acta Oceanologica Sinica, 2021, 40(11): 62-69. doi: 10.1007/s13131-021/1843-x
Figure 1. Location and bathymetry of the Kara Sea (the topography data came from the ORCA025 developed for the DRAKKAR project, https://www.drakkar-ocean.eu/global-models/orca025). The study region is bounded by three sections (thick black lines), Kara Gate (KG), Novaya Zemlya-Taymyr Peninsula (NT), Estuaries of Ob and Yenisei (ES).
Figure 2. Spatial distributions of sea ice concentration from May to October from the CDR data set (a–f) and simulation results of NAPA1/4 (g–l), averaged over 1994–2015 in the Kara Sea; and the Taylor diagram showing normalized standard deviations (distant from the origin), correlations (azimuth angle), and bias removed RMS differences (Euclidian distance from the reference point) between NAPA 1/4 and the CDR data set (m). The reference point (blue star) applies to all satellite observed values. The red dots represent 5 d averaged time series in each year from 1994 to 2015.
Figure 3. Variations in CR based on the climate data record (CDR) data set (a) and NAPA1/4 model (b). The black and red lines in both subfigures denote the Topen (solid) and Tclose (dashed), respectively. The blue lines represent the linear trend of Topen and Tclose based on the CDR.
Figure 4. Annual cycle of sea ice growth and decay rate of ice thickness averaged over 1994–2015 based on NAPA1/4. The negative (positive) value indicates the sea ice decay (growth) rate. Lines with the red circle, blue dot and black triangle represent the thermodynamic, dynamic process and the total contributions to ice variation, respectively.
Figure 5. Annual cycle average of the sea ice surface melting rate (blue dot), basal melting rate (red circle), and freshwater flux from ice to the ocean (black triangle) in the Kara Sea averaged over 1994–2015 (a); and melting rates from May 3rd to June 2nd (box outlined in gray in a) (b). These variables are calculated from NAPA1/4 (see the guide book available at http://www.climate.be/users/lecomte/LIM3_users_guide_2012.pdf). The negative (positive) value indicates the sea ice melting (formation) rate.
Figure 6. Annual cycles of regional mean sea surface temperature (black dot), the lateral (blue triangle) and vertical (red dot) net heat flux averaged over 1994–2015 based on NAPA1/4. Positive (negative) values denote heat absorption (release).
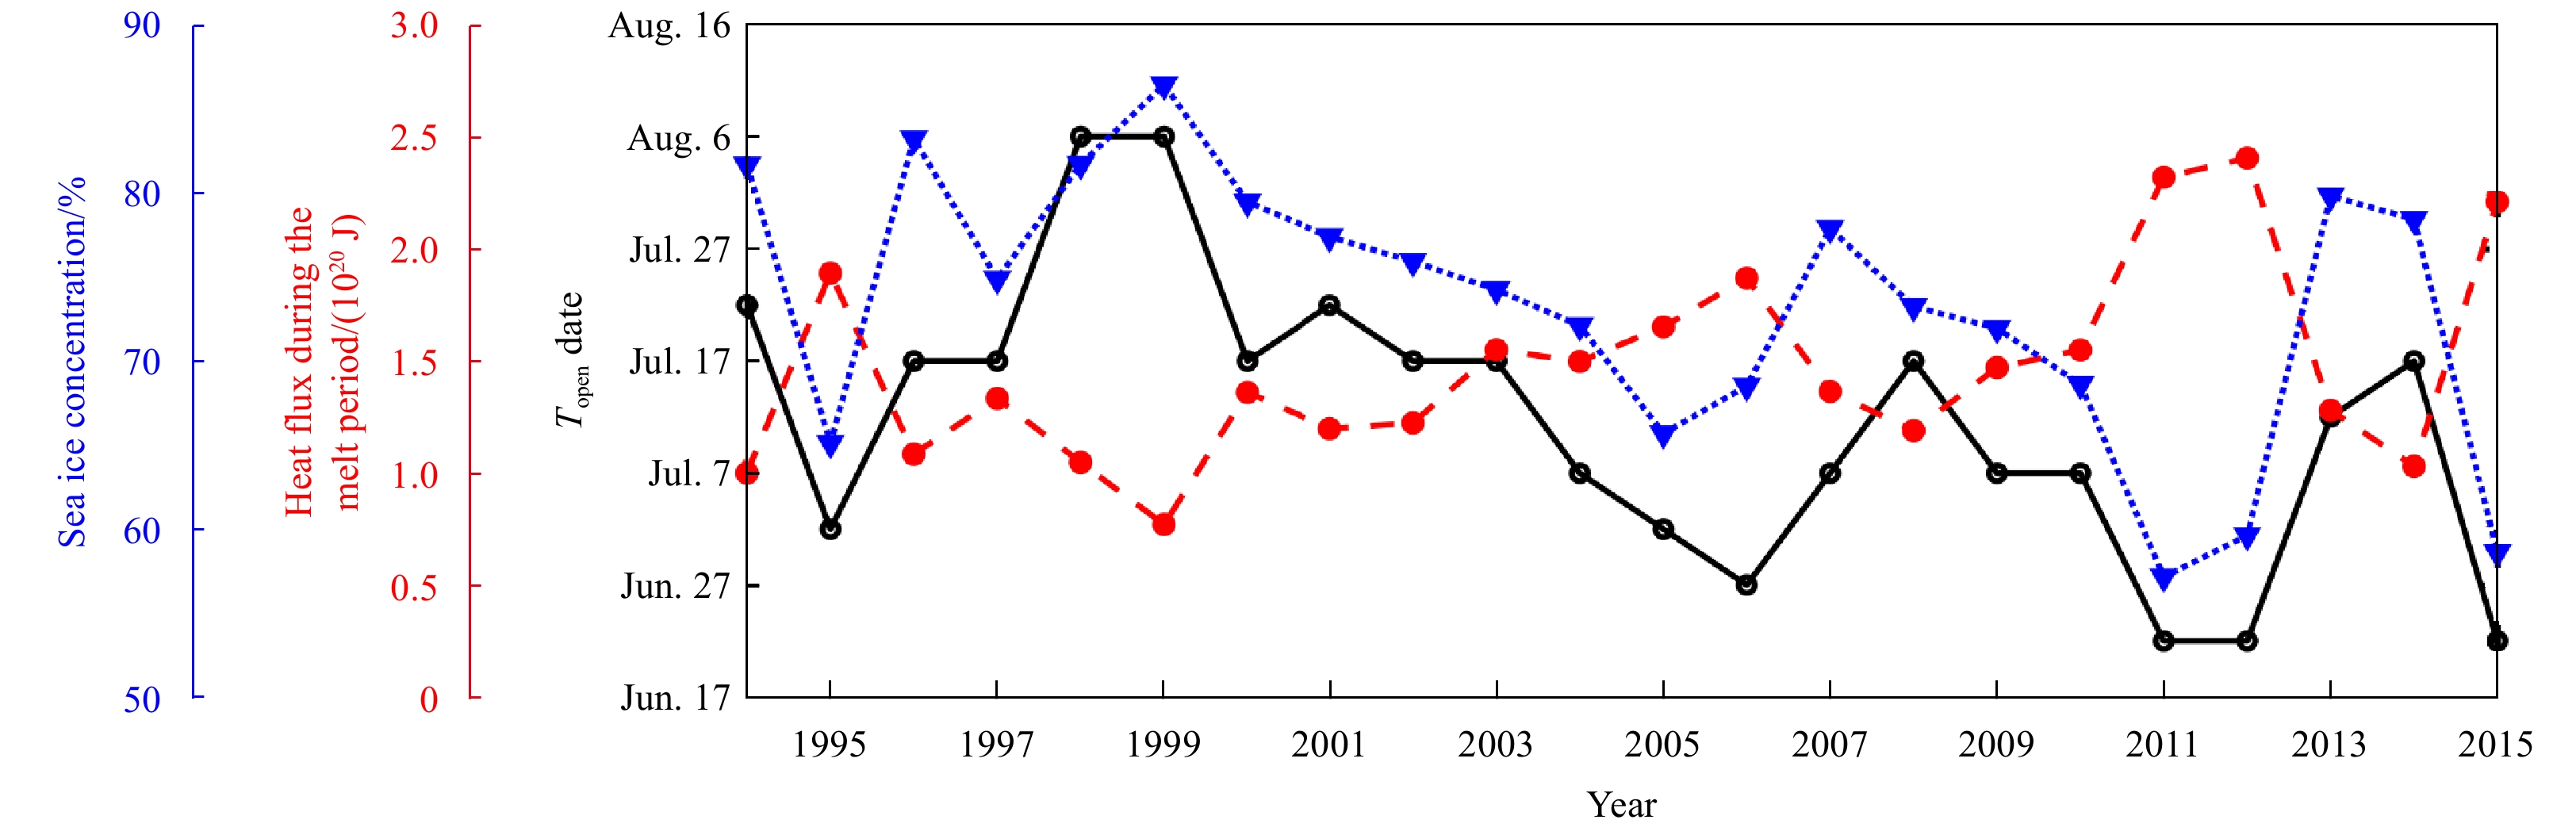
Figure 7. Interannual variations in sea ice concentration (blue triangle), Topen (black dot), and accumulated heat flux during the melt period (red dot) based on NAPA1/4 in the Kara Sea.
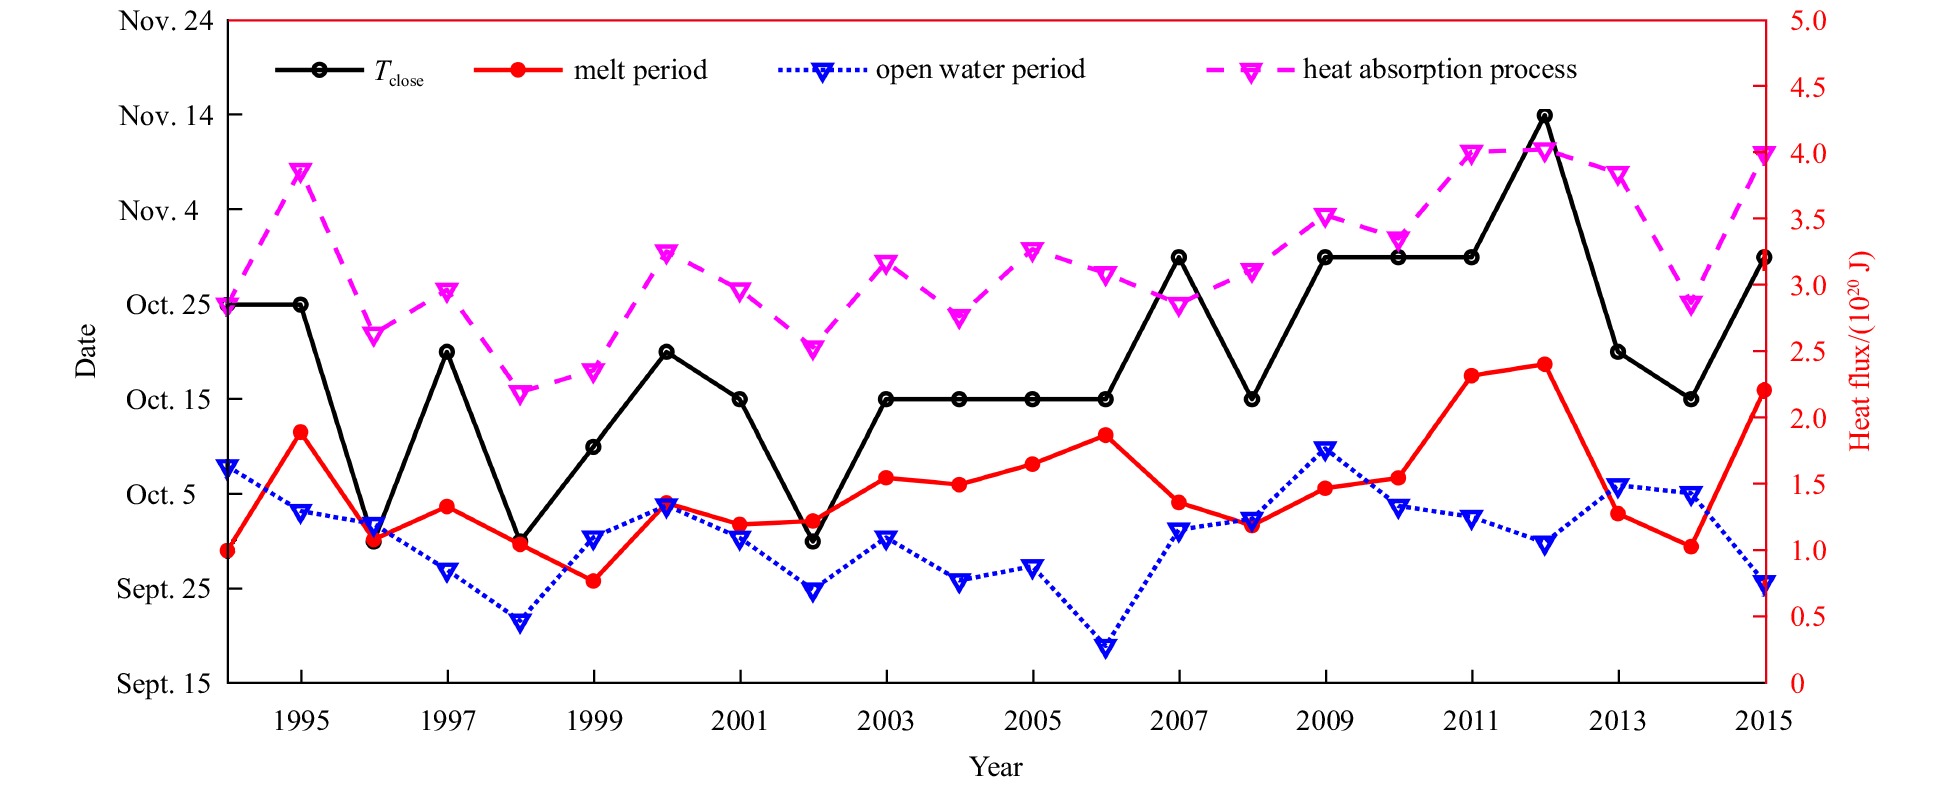
Figure 8. Interannual variations in Tclose (black circle), accumulated heat flux during the melt period (red dot), the open water period (blue triangle) and the heat absorption process (magenta triangle) based on NAPA1/4 in the Kara Sea.
Figure 9. Relationship between Topen (black dot) and duration of open water (DOW) of the Kara Sea derived from the CDR data set. a. Scatter diagram of DOW versus Topen, with their linear regression shown by the red line and 95% confidence bounds shown by the black lines. The sizes of open circles increase from 1989 to 2019. b. Detrended time series from 1989 to 2019. The red triangle and blue circle lines denote CDR derived DOW (DOWobs) and predicted DOW (DOWpre), respectively.


 DownLoad: