Key Laboratory of Marine Geology and Metallogeny, First Institute of Oceanography, Ministry of Natural Resources, Qingdao 266061, China
2.
Laboratory for Marine Geology, Pilot National Laboratory for Marine Science and Technology (Qingdao), Qingdao 266061, China
Funds:
The Shandong Provincial Natural Science Foundation of China under contract No. ZR2014DP009; the China Ocean Mineral Resource Research and Development Association Research Program under contract Nos DY135-N-1-03, DY135-C1-1-04 and DY135-R2-1-03; the Fund of the Construction and Operation of Test and Technical Support System for Natural Resources Investigation and Evaluation.
Ferromanganese (Fe-Mn) crusts are potential archives of the Cu and Zn isotope compositions of seawater through time. In this study, the Cu and Zn isotopes of the top surface of 28 Fe-Mn crusts and 2 Fe-Mn nodules were analysed by MC-ICP-MS using combined sample-standard bracketing for mass bias correction. The Zn isotope compositions of the top surface of Fe-Mn crusts are in the range of 0.71‰ to 1.08‰, with a mean δ66Zn value of 0.94‰±0.21‰ (2SD, n=28). The δ65Cu values of the top surface of Fe-Mn crusts range from 0.33‰ to 0.73‰, with a mean value of 0.58‰±0.20‰ (2SD, n=28). The Cu isotope compositions of Fe-Mn crusts are isotopically lighter than that of dissolved Cu in deep seawater (0.58‰ vs. 0.9‰). In contrast, the δ66Zn values of Fe-Mn crusts appear to be isotopically heavy compared to deep seawater (0.94‰±0.21‰ vs. 0.51‰±0.14‰). The isotope fractionation between Fe-Mn crusts and seawater is attributed to equilibrium partitioning between the sorption to crusts and the organic-ligand-bound Cu and Zn in seawater. The Cu and Zn isotopes in the top surface of Fe-Mn crusts are not a direct reflection of the Cu and Zn isotopes, but a function of Cu and Zn isotopes in modern seawater. This study proposes that Fe-Mn crusts have the potential to be archives for paleoceanography through Cu and Zn isotope analysis.
Chaeturichthys stigmatias and Amblychaeturichthys hexanema, belong to the Gobiiade, Perciforms (Wu and Zhong, 2008). They are offshore warm fish species which are widely distributed in Korea, Japan and China. Chaeturichthys stigmatias mainly inhabits the sandy-mud bottom and lives on benthonic fauna (Chen et al., 2016). It was reported to be the dominant species in the Huanghe River Estuary and its adjacent waters (Meng et al., 2017). Amblychaeturichthys hexanema mainly inhabits the shallow and estuarine waters (Li et al., 2000) and lives on more than 40 kinds of food organisms (Han et al., 2013).
The morphological characters like body shape and color of C. stigmatias are similar to A. hexanema (Nelson et al., 2006), and then they are often wrongly classified. Both species roughly have the same number of fin ray and fin spines on their first dorsal fin. Besides, they have 3−4 pairs of short tentacles on the chin of both species, which are different from most other gobies. The dorsal fins of these two species have scattered black stripes, while C. stigmatias has a black spot on the posterior of the first dorsal fin (Wu and Zhong, 2008). However, this characteristic is often not obvious enough to distinguish them. Previous ichthyologic researches had placed them into the Chaeturichthys genus (East China Sea Fishery Research Institute of Chinese Academy of Fishery Sciences, 1990). Qu (2018) thought that C. stigmatias and A. hexanema were very similar in morphology and showed closely genetic relationship in morphological tree among 28 goby fish. The otolith morphology of the two species was also relatively similar, and it was difficult to distinguish them (Yu, 2014).
There have been abundant reports on morphology, otolith, ingestion of C. stigmatias and A. hexanema until now (Mei et al., 2010; Han et al., 2013; Meng et al., 2017). However, few genetic studies of C. stigmatias and A. hexanema were conducted. The complete mitochondrial sequences of C. stigmatias (KC495071.1) and A. hexanema (KT781104) were determined (Sun et al., 2015; Jin et al., 2012), however, two complete mitochondrial genomes showed high homology. The structures of mtDNA D-loop region and mitochondrial cytochrome c oxidase subunit I (COI) sequence between the two sequences are also basically the same. Therefore, these two species may have been misidentified.
The molecular tools like DNA barcoding are often required to identify marine fish because the morphological characters of many species are too similar to identify (Smith et al., 2008). The mitochondrial COI gene, usually used as DNA barcoding, has been widely used in species identification (Wang et al., 2018; Puckridge et al., 2013), description of new record species or new species (Guo et al., 2010; Gao et al., 2011) and discovery of cryptic species (Zemlak et al., 2009; Suh et al., 2019). Besides, 12S rRNA gene has been recently developed as DNA mini-barcoding. It can be used in environmental samples needing universal primers, processed biological material such as food products and archival specimens of DNA degradation because it has shorter length and can be more efficient amplification (Meusnier et al., 2008; Shokralla et al., 2015). Masaki et al. (2015) aligned whole 12S rRNA sequences from 180 species and designed a set of universal PCR primers (MiFish-U/E) of fish, and they have been widely used for identification of marine fish.
This study re-determined the complete mitochondrial genome of C. stigmatias and analyzed the interspecific difference between C. stigmatias and A. hexanema by COI gene and 12S rRNA gene. This study is conducive to reconstruct the phylogeny of the Gobiiade and can provide effective basic data for two goby species.
2.
Materials and methods
2.1
Sample collection
A total of 30 ind. of C. stigmatias and 24 ind. of A. hexanema from the seacoast of Qingdao, Shandong Province, China, were collected in this study. The information of samples was shown in Table 1. The two goby species were initially identified by the morphological characters like black spot on the first dorsal fin, and then COI and 12S rRNA sequences were amplified and analyzed. A piece of skeletal muscle of these samples was excised for DNA extraction and preserved in 95% ethanol until use. The COI sequences and 12S rRNA sequences of 30 ind. of C. stigmatias and 24 ind. of A. hexanema were amplified for studying the interspecific difference. One ind. of C. stigmatias was used for determining its complete mitochondrial genome sequence.
Table
1.
The sampling information of C. stigmatias and A. hexanema
2.2
DNA extraction, PCR amplification and sequencing
Total genomic DNA was isolated from the muscle tissue by proteinase K digestion followed by the standard phenol/chloroform method (Sambrook et al., 1989).
Primers used for the amplification of the COI gene were F1-5′-TCAACCAACCACAAAGACATTGGCAC-3′ and R1-5′-TAGACTT CTGGGTGGCCAAAGAATCA-3′ (Ward et al., 2008), and the 12S rRNA sequences were amplified by primers, MiFish-U-F: 5′-GTCGGTAAAACTCGTGCCAGC-3′ and MiFish-U-R: 5′-CATAGTGGGGTATCTAATCCCAGTTTG-3′ (Masaki et al., 2015).
All PCRs were performed in an Eppendorf thermal cycler (A300 Fast Thermal Cycler). TaKaRa Ex Taq were used for polymerase chain reaction (PCR). PCR was carried out in 25 µL volumes containing 0.15 µL Taq DNA polymerase, 1 µL template DNA, 2.5 µL 10× DNA loading buffer, 2 µL dNTP, 1 µL forward and reverse primer. The PCR amplification was carried out under the following conditions: 3 min initial denaturation at 95°C, and 40 cycles of 45 s at 94°C for denaturation, 45 s at 52°C for annealing, and 45 s at 72°C for extension, and a final extension at 72°C for 5 min (Liu et al., 2007).
Subsequent complete sequence of C. stigmatias was accomplished by primer walking method. Thirty-five normal PCR primer sets were designed to accomplish the entire mitogenome (Table A1). It was essential that every two contiguous segments overlapped by at least 50 bp to ascertain the accuracy of sequencing. The PCR amplification process was the same as above except for the annealing temperature. The annealing temperature of primers were shown in Table A1.
All PCR products were detected by 2% agarose gel electrophoresis, the products with good amplification effect were sent to Tsingke Biotech Co., Ltd. (China) for sequencing. To ensure the accuracy of the sequences, each sample was sequenced in both directions.
2.3
Sequence analysis
The obtained sequences were analyzed by DNASTAR software (Madison, USA). ARLEQUIN 3.5 was used to calculate haplotype diversity (h), and nucleotide diversity (π) (Excoffier et al., 2005). Nucleotide composition and genetic distance were analyzed using MEGA 5 based on the Kimura 2-parameter model (Tamura et al., 2011).
The mitochondrial genome sequence alignment was performed initially using DNASTAR software (Madison, USA) with default parameters, and further adjusted manually (Burland, 2000). Locations for protein-coding genes and rRNAs were determined by DOGMA (Wyman et al., 2004) with default settings.
3.1
The interspecific difference between C. stigmatias and A. hexanema
In this study, the length of COI homologous fragments of C. stigmatias and A. hexanema was 622 bp (GenBank accession: MT568667-MT568696 and MT568697-MT568720). The average base composition content of C. stigmatias was 23.6% for A, 26.9% for C, 18.2% for G, 31.3% for T, and A. hexanema was 23.8% for A, 28.0% for C, 19.0% for G, 29.2% for T. The content of C+G was slightly higher than that of C. stigmatias.
A total of 9 polymorphic sites, 7 transition and 2 transversion were detected in 30 ind. of C. stigmatias. These sequences could be defined as 11 haplotypes. Besides, a total of 13 polymorphic sites, 11 transition and 2 transversion were detected in 24 ind. of A. hexanema, and 7 haplotypes were defined by these sites. No base insertions or deletions were detected within the two species.
The number of haplotype and haplotype diversity of two gobies obtained based on the COI gene were shown in Table 2. The genetic diversity parameters of C. stigmatias were higher than those of A. hexanema. The intraspecific genetic distance of A. hexanema and C. stigmatias was 0.002 and 0.003, respectively, and the intraspecific genetic distance between two species was 0.187. Clustering analysis of COI haplotypes was conducted using NJ method (Fig. 1). The result showed that the two species clustered separately, without sharing haplotype.
Table
2.
Genetic diversity parameters of C. stigmatias and A. hexanema based on COI gene
Figure
1.
Neighbor-joining tree for COI haplotypes of A. hexanema and C. stigmatias. Bootstrap values of >70% (out of 1 000 replicates) are shown on the nodes.
A total of 194 bp 12S rRNA gene homologous fragments of C. stigmatias and A. hexanema were amplified (GenBank accession: MT614220-MT614249 and MT614190-MT614213). The contents of A, T, C and G of C. stigmatias and A. hexanema were 20.6%, 34.9%, 20.3%, 24.2% and 20.8%, 32.5%, 22.2%, 24.5%, respectively. The content of A+T was slightly higher than that of G+C, which was similar to the characteristics of higher A+T content in other fishes (Sun et al., 2012; Liu et al., 2012).
A total of 1 polymorphic site was found within the 12S rRNA sequences. Two haplotypes were defined by these sites in the 30 ind. of C. stigmatias (Table 3). There was 1 polymorphic site in the 12S rRNA sequences of 24 ind. A. hexanema. This site could be defined as 2 haplotypes (Table 3). The NJ phylogenetic tree constructed by haplotypes of this two species showed that the two species could be clearly divided into two branches, which was consistent with the analysis results of the COI sequences (Fig. 2).
Table
3.
Genetic diversity parameters of C. stigmatias and A. hexanema based on 12S rRNA gene
The mitochondrial genome of C. stigmatias was acquired (MN038166), and it was 17 134 bp in length, covering 13 protein-coding genes, 22 tRNA, 2 rRNA genes, 1 OL and 1 D-loop region (Fig. 3). The overall nucleotide composition was 28.2% for A, 27.7% for T, 28.0% for C, and 16.1% for G, with a slight AT bias of 55.9%, which was similar to other goby fishes (Jin et al., 2012). In 13 protein-coding genes, the longest one was ND5 (1 842 bp in length), whereas the shortest one was ATP8 (165 bp in length). The lengths of tRNA genes were ranged from 64 bp (tRNA-Cys) to 74 bp (tRNA-Val, tRNA-Asn). As other vertebrates, with the exception of ND6 and 8 tRNAs (tRNA-Ala, tRNA-Asn, tRNA-Cys, tRNA-Gln, tRNA-Tyr, tRNA-Pro, tRNA-Glu, tRNA-Ser), all of the observed mitochondrial genes were found to be encoded on H strand.
Figure
3.
The gene map of the complete mitochondrial genome of C. stigmatias. Genes encoded on the H-strand and L-strand are shown outside and inside the circular map of the mitogenome, respectively.
All the protein-coding genes started with the ATG codon except for COI and ND6, that started with GTG and CTA, respectively. Two types of stop codons were used by the coding genes: TAA (ND1, ND2, COI, ATP8, ATP6, ND4L, and ND5) and incomplete stop codon T (COII, COIII, ND3, ND4, and ND6). The control region (D-loop) was 992 bp sequence located between the tRNA-Pro and tRNA-Phe genes. The 12S rRNA and 16S rRNA were located between the tRNA-Phe and tRNA-Leu genes and separated by the tRNA-Val gene. Sequence analysis showed that many overlaps between genes (Table 4).
Table
4.
Complete mitochondrial genome characteristics of C. stigmatias
Gene
Start position/bp
Stop position/bp
Size/bp
Intergenic nucleotide
Start codon
Stop codon
Strand
tRNA-Phe
1
68
68
0
−
−
H
12S rRNA
69
1 017
949
0
−
−
H
tRNA−Val
1 018
1 091
74
0
−
−
H
16S rRNA
1 092
2 774
1 683
0
−
−
H
tRNA−Leu
2 775
2 847
73
0
−
−
H
ND1
2 848
3 822
975
3
ATG
TAA
H
tRNA−Ile
3 826
3 895
70
−1
−
−
H
tRNA−Gln
3 895
3 964
70
1
−
−
L
tRNA−Met
3 966
4 033
68
1
−
−
H
ND2
4 035
5 079
1 044
−2
ATG
T − −
H
tRNA−Trp
5 078
5 149
72
0
−
−
H
tRNA−Ala
5 150
5 221
72
0
−
−
L
tRNA−Asn
5 222
5 295
74
1
−
−
L
tRNA−Cys
5 327
5 390
64
0
−
−
L
tRNA−Tyr
5 391
5 461
71
3
−
−
L
COXI
5 465
7 018
1 554
0
GTG
TAA
H
tRNA−Ser
7 019
7 089
71
3
−
−
L
tRNA−Asp
7 093
7 163
71
2
−
−
H
COXII
7 166
7 856
691
1
ATG
T − −
H
tRNA−Lys
7 858
7 931
74
0
−
−
H
ATP8
7 932
8 096
165
−5
ATG
TAA
H
ATP6
8 090
8 773
684
0
ATG
TAA
H
COXIII
8 774
9 557
784
0
ATG
T − −
H
tRNA−Gly
9 558
9 629
72
0
−
−
H
ND3
9 630
9 978
349
0
ATG
T − −
H
tRNA−Arg
9 979
10 046
68
0
−
−
H
ND4L
10 047
10 343
297
0
ATG
TAA
H
ND4
10 344
11 724
1 381
0
ATG
T − −
H
tRNA−His
11 725
11 794
70
−1
−
−
H
tRNA−Ser
11 794
11 861
68
5
−
−
H
tRNA−Leu
11 867
11 939
73
0
−
−
H
ND5
11 940
13 781
1 842
−1
ATG
TAA
H
ND6
13 781
14 792
1 012
0
CTA
T − −
L
tRNA−Glu
14 793
14 863
71
0
−
−
L
Cyt b
14 864
16 000
1 137
5
ATG
TAA
H
tRNA−Thr
16 001
16 072
72
−1
−
−
H
tRNA−Pro
16 072
16 142
71
0
−
−
L
D−loop
16 143
17 134
992
−
−
−
H
Note: H represents genes encoded on the H-strand; L, genes encoded on L-strand. −, no data.
Phylogenetic tree based on the tandem 13 coding protein genes nucleotide sequences was constructed by NJ method (Fig. 4). From the tree topologies, this study could conclude that C. stigmatias was genetically closest to A. hexanema, and then to Oxyurichthys formosanus among 12 species within Gobioidei.
Figure
4.
The phylogenetic analyses investigated using Neighbor-Joining based on nucleotide sequences of 13 concatenated protein-coding genes. Cyprinus carpio (GenBank: KP993139) was used as an outgroup. The black box represented sequences of C. stigmatias sequenced in this study.
DNA barcoding developed in recent years is an effective and efficient molecular tool used in species identification, especially for closely related fish species (Stoeckle, 2003; Hebert et al., 2003a, b). For example, Ward et al. (2005) analyzed the COI gene of 270 species of marine fish and resulted in all fish species could be discriminated by the COI gene. Compared with the conventional DNA barcoding, mini-barcoding like 12S rRNA barcoding was developed recently. It has shorter length and can be efficiently amplified, which can overcome some problems existing in traditional DNA barcoding, such as DNA degradation in biological food products and old archival specimens, high sequence variability in environmental samples (Meusnier et al., 2008; Shokralla et al., 2015).
A1.
Primers for complete mitochondrial genome of C. stigmatias
In this study, the result of conventional COI barcoding and 12S rRNA mini-barcoding analysis all indicated that there were significant genetic differences between C. stigmatias and A. hexanema, and the NJ tree based on COI and 12S rRNA haplotypes showed that the two species were clustered separately, which verified the validity of these two barcoding in interspecific identification. Therefore, combination of morphology and DNA barcoding to solve the problems of classification and identification will be more effective and accurate (Cywinska et al., 2006; Pfenninger et al., 2007).
The mitochondrial genome has been widely used in evolutionary biology, population genetics and molecular ecology (Inoue et al., 2001; Miya et al., 2005; Lavoué et al., 2007). It has been proved that mitogenomic data can be used to resolve the controversial problems of phylogenetic relationships (Miya et al., 2003; Boore, 2006). In this study, the mitochondrial genome sequence of C. stigmatias was 17 134 bp, which was shorter than the sequence previously reported (Sun et al., 2015). This is due to the fact that there was repeat region in D-loop region of C. stigmatias previously reported. Some researchers have reported the COI sequence of C. stigmatias (Xing et al., 2018; Lu et al., 2016). These sequences were high homology with the COI sequences determined in this study, which showed significant difference with that in previous study. Therefore, C. stigmatias in previous study may have been misidentified as A. hexanema. The phylogenetic tree showed that the sequence of C. stigmatias clustered with most of Gobioidei. Phylogenetic analysis suggested that C. stigmatias had a close relationship with A. hexanema, which was consistent with the study result of morphological classification (Qu, 2018). The mitochondrial genome of C. stigmatias characterized in the present study would facilitate further studies on the genetic constitution of C. stigmatias population. It would also enrich essential information for investigating the biodiversity and conservation biology of C. stigmatias.
Amira S, Spångberg D, Hermansson K. 2005. Distorted five-fold coordination of Cu2+(aq) from a Car-Parrinello molecular dynamics simulation. Physical Chemistry Chemical Physics, 7(15): 2874–2880. doi: 10.1039/b502427g
[2]
Anbar A D, Rouxel O. 2007. Metal stable isotopes in paleoceanography. Annual Review of Earth and Planetary Sciences, 35(1): 717–746. doi: 10.1146/annurev.earth.34.031405.125029
[3]
Aplin A C, Cronan D S. 1985. Ferromanganese oxide deposits from the Central Pacific Ocean: I. Encrustations from the Line Islands Archipelago. Geochimica Et Cosmochimica Acta, 49(2): 427–436. doi: 10.1016/0016-7037(85)90034-1
[4]
Archer C, Andersen M B, Cloquet C, et al. 2017. Inter-calibration of a proposed new primary reference standard AA-ETH Zn for zinc isotopic analysis. Journal of Analytical Atomic Spectrometry, 32(2): 415–419. doi: 10.1039/C6JA00282J
[5]
Albarède B, Beard B. 2004. Analytical methods for non-traditional isotopes in geochemistry of non-traditional stable isotopes. Reviews in Mineralogy & Geochemistry, 55: 113–152
[6]
Arrhenius G, Bonatti E. 1963. Neptunism and vulcanism in the ocean. Progress in Oceanography, 3: 7–22
[7]
Beard B L, Johnson C M, Cox L, et al. 1999. Iron isotope biosignatures. Science, 285(5435): 1889–1892. doi: 10.1126/science.285.5435.1889
[8]
Bertine K K, Turekian K K. 1973. Molybdenum in marine deposits. Geochimica et Cosmochimica Acta, 37(6): 1415–1434. doi: 10.1016/0016-7037(73)90080-X
[9]
Boyle E A, Edmond J M, Sholkovitz E R. 1977. The mechanism of iron removal in estuaries. Geochimica et Cosmochimica Acta, 41(9): 1313–1324. doi: 10.1016/0016-7037(77)90075-8
[10]
Boyle E A, John S, Abouchami W, et al. 2012. GEOTRACES IC1(BATS) contamination-prone trace element isotopes Cd, Fe, Pb, Zn, Cu, and Mo intercalibration. Limnology and Oceanography: Methods, 10(9): 653–665. doi: 10.4319/lom.2012.10.653
[11]
Bruland K W. 1980. Oceanographic distributions of cadmium, zinc, nickel, and copper in the North Pacific. Earth and Planetary Science Letters, 47(2): 176–198. doi: 10.1016/0012-821X(80)90035-7
[12]
Bruland K W. 1989. Complexation of zinc by natural organic ligands in the Central North Pacific. Limnology and Oceanography, 34(2): 269–285. doi: 10.4319/lo.1989.34.2.0269
[13]
Bruland K W, Lohan M C. 2003. Controls of trace metals in seawater. Treatise on Geochemistry, 6: 23–47
[14]
Bruland K W, Orians K J, Cowen J P. 1994. Reactive trace metals in the stratified central North Pacific. Geochimica et Cosmochimica Acta, 58(15): 3171–3182. doi: 10.1016/0016-7037(94)90044-2
[15]
Coale K H, Bruland K W. 1988. Copper complexation in the Northeast Pacific. Limnology and Oceanography, 33(5): 1084–1101. doi: 10.4319/lo.1988.33.5.1084
[16]
Craig J D, Andrews J E, Meylan M A. 1982. Ferromanganese deposits in the Hawaiian Archipelago. Marine Geology, 45(1–2): 127–157. doi: 10.1016/0025-3227(82)90183-9
[17]
Donat J R, Bruland K W. 1990. A comparison of two voltammetric techniques for determining zinc speciation in Northeast Pacific Ocean waters. Marine Chemistry, 28(4): 301–323. doi: 10.1016/0304-4203(90)90050-M
[18]
Fujii T, Moynier F, Dauphas N, et al. 2011. Theoretical and experimental investigation of nickel isotopic fractionation in species relevant to modern and ancient oceans. Geochimica et Cosmochimica Acta, 75(2): 469–482. doi: 10.1016/j.gca.2010.11.003
[19]
Gao Jingjing, Liu Jihua, Li Xianguo, et al. 2017. The determination of 52 elements in marine geological samples by an inductively coupled plasma optical emission spectrometry and an inductively coupled plasma mass spectrometry with a high-pressure closed digestion method. Acta Oceanologica Sinica, 36(1): 109–117. doi: 10.1007/s13131-017-0991-5
[20]
Halbach P, Segl M, Puteanus D, et al. 1983. Co-fluxes and growth rates in ferromanganese deposits from central Pacific seamount areas. Nature, 304(5928): 716–719. doi: 10.1038/304716a0
[21]
He Lianhua, Liu Jihua, Zhang Jun, et al. 2016. Separation of Cu and Zn in cobalt-rich crusts for isotope determination by MC-ICP MS. Journal of Instrumental Analysis (in Chinese), 35(10): 1347–1350
[22]
Hein J R, Bohrson W A, Schulz M S, et al. 1992. Variations in the fine-scale composition of a central Pacific ferromanganese crust: Paleoceanographic implications. Paleoceanography, 7(1): 63–77. doi: 10.1029/91PA02936
[23]
Hein J R, Koschinsky A, Halbach P, et al. 1997. Iron and Manganese Oxide Mineralization in the Pacific. Geological Society, London, Special Publications, 119(1): 123–138. doi: 10.1144/GSL.SP.1997.119.01.09
[24]
Hein J R, Schwab W C, Davis A S. 1988. Cobalt- and platinum-rich ferromanganese crusts and associated substrate rocks from the Marshall Islands. Marine Geology, 78(3–4): 255–283. doi: 10.1016/0025-3227(88)90113-2
[25]
John S G, Geis R W, Saito M A, et al. 2007. Zinc isotope fractionation during high-affinity and low-affinity zinc transport by the marine diatom Thalassiosira oceanica. Limnology and Oceanography, 52(6): 2710–2714. doi: 10.4319/lo.2007.52.6.2710
[26]
Kashiwabara T, Takahashi Y, Tanimizu M. 2009. A XAFS study on the mechanism of isotopic fractionation of molybdenum during its adsorption on ferromanganese oxides. Geochemical Journal, 43(6): e31–e36. doi: 10.2343/geochemj.1.0060
[27]
Koschinsky A, Halbach P. 1995. Sequential leaching of marine ferromanganese precipitates: Genetic implications. Geochimica et Cosmochimica Acta, 59(24): 5113–5132. doi: 10.1016/0016-7037(95)00358-4
[28]
Koschinsky A, Hein J R. 2003. Uptake of elements from seawater by ferromanganese crusts: solid-phase associations and seawater speciation. Marine Geology, 198(3–4): 331–351. doi: 10.1016/S0025-3227(03)00122-1
[29]
Little S H, Sherman D M, Vance D, et al. 2014a. Molecular controls on Cu and Zn isotopic fractionation in Fe-Mn crusts. Earth and Planetary Science Letters, 396: 213–222. doi: 10.1016/j.jpgl.2014.04.021
[30]
Little S H, Vance D, McManus J, et al. 2017. Copper isotope signatures in modern marine sediments. Geochimica et Cosmochimica Acta, 212: 253–273. doi: 10.1016/j.gca.2017.06.019
[31]
Little S H, Vance D, Walker-Brown C, et al. 2014b. The oceanic mass balance of copper and zinc isotopes, investigated by analysis of their inputs, and outputs to ferromanganese oxide sediments. Geochimica et Cosmochimica Acta, 125: 673–693. doi: 10.1016/j.gca.2013.07.046
[32]
Lohan M C, Statham P J, Crawford D W. 2002. Total dissolved zinc in the upper water column of the subarctic North East Pacific. Deep-Sea Research Part II: Topical Studies in Oceanography, 49(24–25): 5793–5808. doi: 10.1016/S0967-0645(02)00215-1
[33]
Marcus M A, Manceau A, Kersten M. 2004. Mn, Fe, Zn and As speciation in a fast-growing ferromanganese marine nodule. Geochimica et Cosmochimica Acta, 68(14): 3125–3136. doi: 10.1016/j.gca.2004.01.015
[34]
Maréchal C N, Nicolas E, Douchet C, et al. 2000. Abundance of zinc isotopes as a marine biogeochemical tracer. Geochemistry, Geophysics, Geosystems, 1(5): 1015
[35]
Maréchal C N, Télouk P, Albarède F. 1999. Precise analysis of copper and zinc isotopic compositions by plasma-source mass spectrometry. Chemical Geology, 156(1–4): 251–273. doi: 10.1016/S0009-2541(98)00191-0
[36]
Mason T F D, Weiss D J, Chapman J B, et al. 2005. Zn and Cu isotopic variability in the Alexandrinka volcanic-hosted massive sulphide (VHMS) ore deposit, Urals, Russia. Chemical Geology, 221(3–4): 170–187. doi: 10.1016/j.chemgeo.2005.04.011
[37]
Mason T F D, Weiss D J, Horstwood M, et al. 2004. High-precision Cu and Zn isotope analysis by plasma source mass spectrometry Part 1: Spectral interferences and their correction. Journal of Analytical Atomic Spectrometry, 19: 209–217. doi: 10.1039/b306958c
[38]
McManus J, Berelson W M, Severmann S, et al. 2006. Molybdenum and uranium geochemistry in continental margin sediments: Paleoproxy potential. Geochimica et Cosmochimica Acta, 70(18): 4643–4662. doi: 10.1016/j.gca.2006.06.1564
[39]
Moeller K, Schoenberg R, Pedersen R B, et al. 2012. Calibration of the new certified reference materials ERM-AE633 and ERM-AE647 for Copper and IRMM-3702 for zinc isotope amount ratio determinations. Geostandards and Geoanalytical Research, 36(2): 177–199. doi: 10.1111/j.1751-908X.2011.00153.x
[40]
Moffett J W, Dupont C. 2007. Cu complexation by organic ligands in the sub-arctic NW Pacific and Bering Sea. Deep-Sea Research Part I: Oceanographic Research Papers, 54(4): 586–595. doi: 10.1016/j.dsr.2006.12.013
[41]
Morel F M M, Price N M. 2003. The biogeochemical cycles of trace metals in the oceans. Science, 300(5621): 944–947. doi: 10.1126/science.1083545
[42]
Nägler T F, Neubert N, Böttcher M E, et al. 2011. Molybdenum isotope fractionation in pelagic euxinia: Evidence from the modern Black and Baltic Seas. Chemical Geology, 289(1–2): 1–11. doi: 10.1016/j.chemgeo.2011.07.001
[43]
Navarrete J U, Borrok D M, Viveros M, et al. 2011. Copper isotope fractionation during surface adsorption and intracellular incorporation by bacteria. Geochimica et Cosmochimica Acta, 75(3): 784–799. doi: 10.1016/j.gca.2010.11.011
[44]
Pasquarello A, Petri I, Salmon P S, et al. 2001. First solvation shell of the Cu(II) aqua ion: evidence for fivefold coordination. Science, 291(5505): 856–859. doi: 10.1126/science.291.5505.856
[45]
Peacock C L, Sherman D M. 2007. Crystal-chemistry of Ni in marine ferromanganese crusts and nodules. American Mineralogist, 92(7): 1087–1092. doi: 10.2138/am.2007.2378
[46]
Pichat S, Douchet C, Albarède F. 2003. Zinc isotope variations in deep-sea carbonates from the eastern equatorial Pacific over the last 175 ka. Earth and Planetary Science Letters, 210(1–2): 167–178. doi: 10.1016/S0012-821X(03)00106-7
[47]
Piper D Z, Williamson M E. 1977. Composition of Pacific Ocean ferromanganese nodules. Marine Geology, 23(4): 285–303. doi: 10.1016/0025-3227(77)90036-6
[48]
Poulson Brucker R L, McManus J, Severmann S, et al. 2009. Molybdenum behavior during early diagenesis: Insights from Mo isotopes. Geochemistry, Geophysics, Geosystems, 10(6): Q06010
[49]
Poulson R L, Siebert C, McManus J, et al. 2006. Authigenic molybdenum isotope signatures in marine sediments. Geology, 34(8): 617–620. doi: 10.1130/G22485.1
[50]
Schauble E A. 2004. Applying stable isotope fractionation theory to new systems. Reviews in Mineralogy & Geochemistry, 55(1): 65–111
[51]
Scott C, Lyons T W. 2012. Contrasting molybdenum cycling and isotopic properties in euxinic versus non-euxinic sediments and sedimentary rocks: Refining the paleoproxies. Chemical Geology, 324–325: 19–27. doi: 10.1016/j.chemgeo.2012.05.012
[52]
Siebert C, McManus J, Bice A, et al. 2006. Molybdenum isotope signatures in continental margin marine sediments. Earth and Planetary Science Letters, 241(3–4): 723–733. doi: 10.1016/j.jpgl.2005.11.010
[53]
Takano S, Tanimizu M, Hirata T, et al. 2014. Isotopic constraints on biogeochemical cycling of copper in the ocean. Nature Communications, 5(1): 5663. doi: 10.1038/ncomms6663
[54]
Thompson C M, Ellwood M J. 2014. Dissolved copper isotope biogeochemistry in the Tasman Sea, SW Pacific Ocean. Marine Chemistry, 165: 1–9. doi: 10.1016/j.marchem.2014.06.009
[55]
Thompson C M, Ellwood M J, Wille M. 2013. A solvent extraction technique for the isotopic measurement of dissolved copper in seawater. Analytica Chimica Acta, 775: 106–113. doi: 10.1016/j.aca.2013.03.020
[56]
Valley J W, Cole D R. 2001. Reviews in Mineralogy and Geochemistry Volume 43: Stable Isotope Geochemistry. Washington, DC: Mineralogical Society of America, 87–94
[57]
Vance D, Archer C, Bermin J, et al. 2008. The copper isotope geochemistry of rivers and the oceans. Earth and Planetary Science Letters, 274(1–2): 204–213. doi: 10.1016/j.jpgl.2008.07.026
[58]
Vance D, Zhao Y, Cullen J, et al. 2012. Zinc isotopic data from the NE Pacific reveals shallow recycling. Mineral Mag, 76: 1486
Shike Gao, Yongqi Yao, Jinchi Wan, et al. Study on seasonal variations of Chaeturichthys stigmatias population resources and its environmental factors in marine ranching areas. Ocean & Coastal Management, 2024, 257: 107305. doi:10.1016/j.ocecoaman.2024.107305
2.
Jiaqiao Wang, Weiyi He, Hao Huang, et al. A Comprehensive Analysis of the Fowleria variegata (Valenciennes, 1832) Mitochondrial Genome and Its Phylogenetic Implications within the Family Apogonidae. Genes, 2023, 14(8): 1612. doi:10.3390/genes14081612
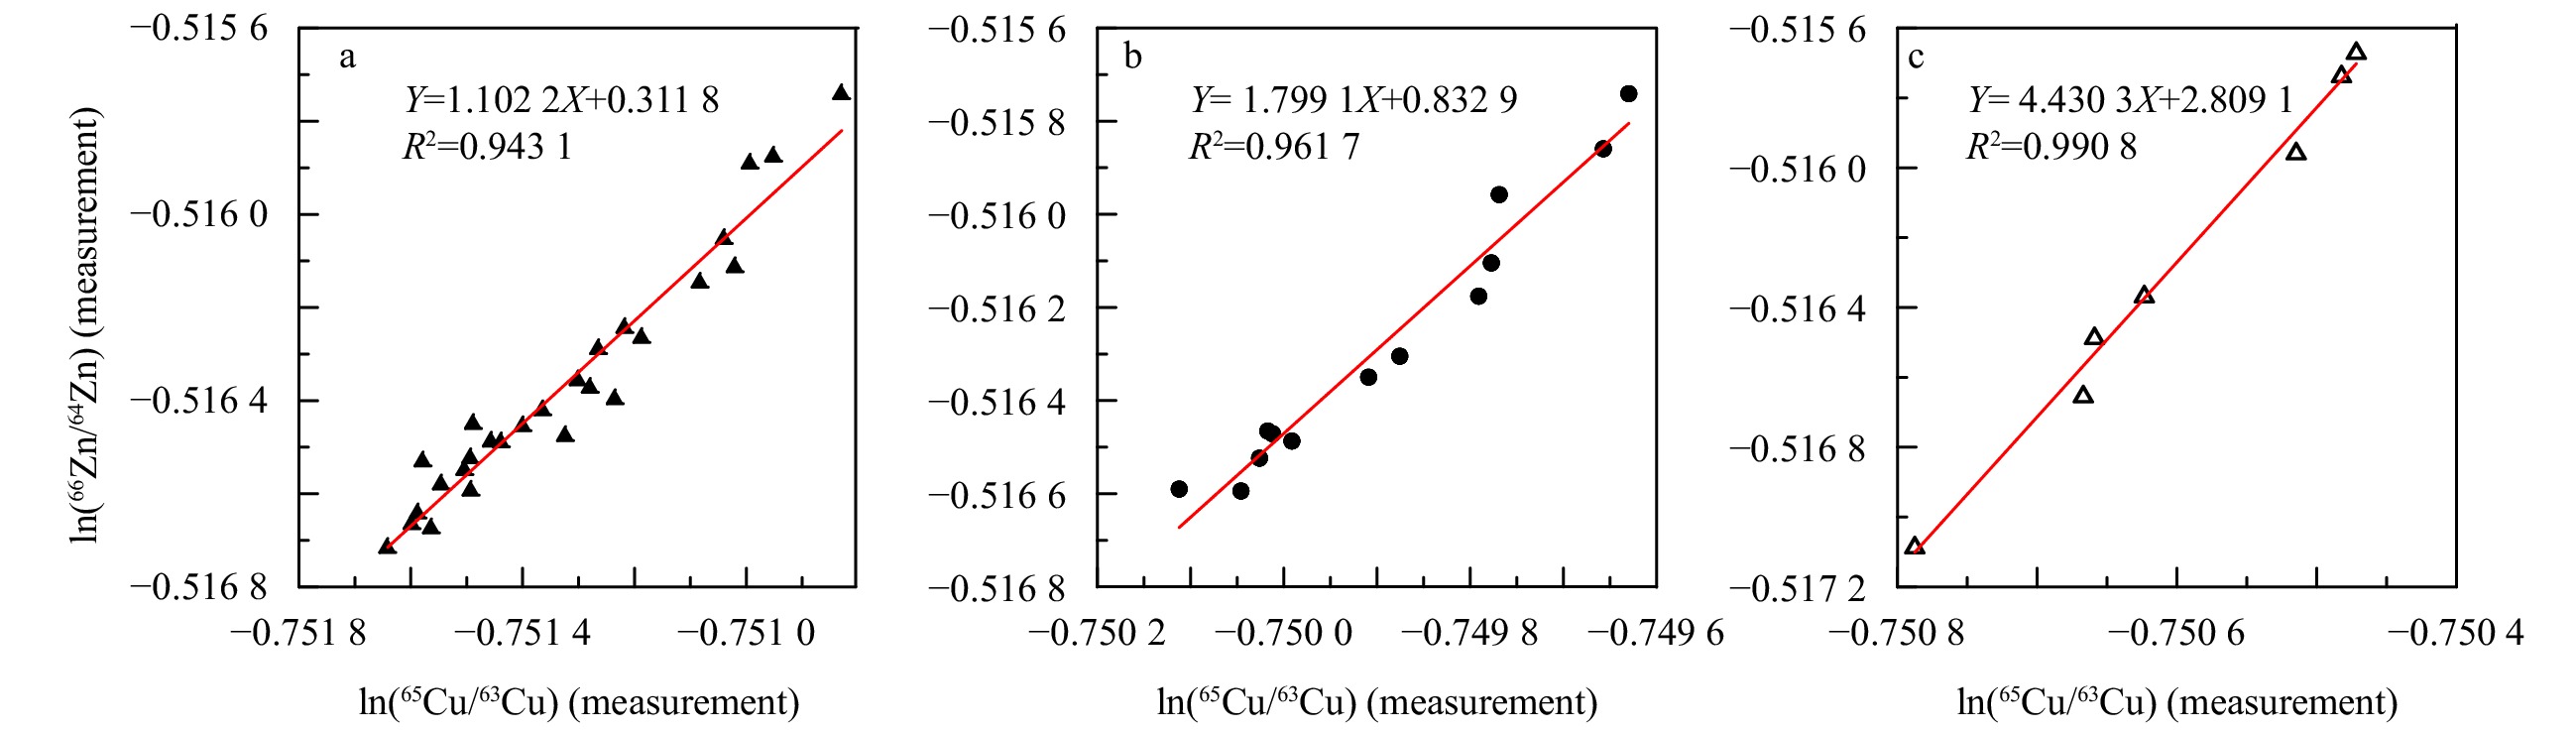
Figure 2. Regression lines fitted through a mixed standard of IRMM 3702 Zn and IRMM 633 Cu during one single measurement session. a. 24 h analysis; b. 8 h analysis; c. 4 h analysis.
Figure 3. Photographs of Fe-Mn nodule samples and Fe-Mn crust samples.
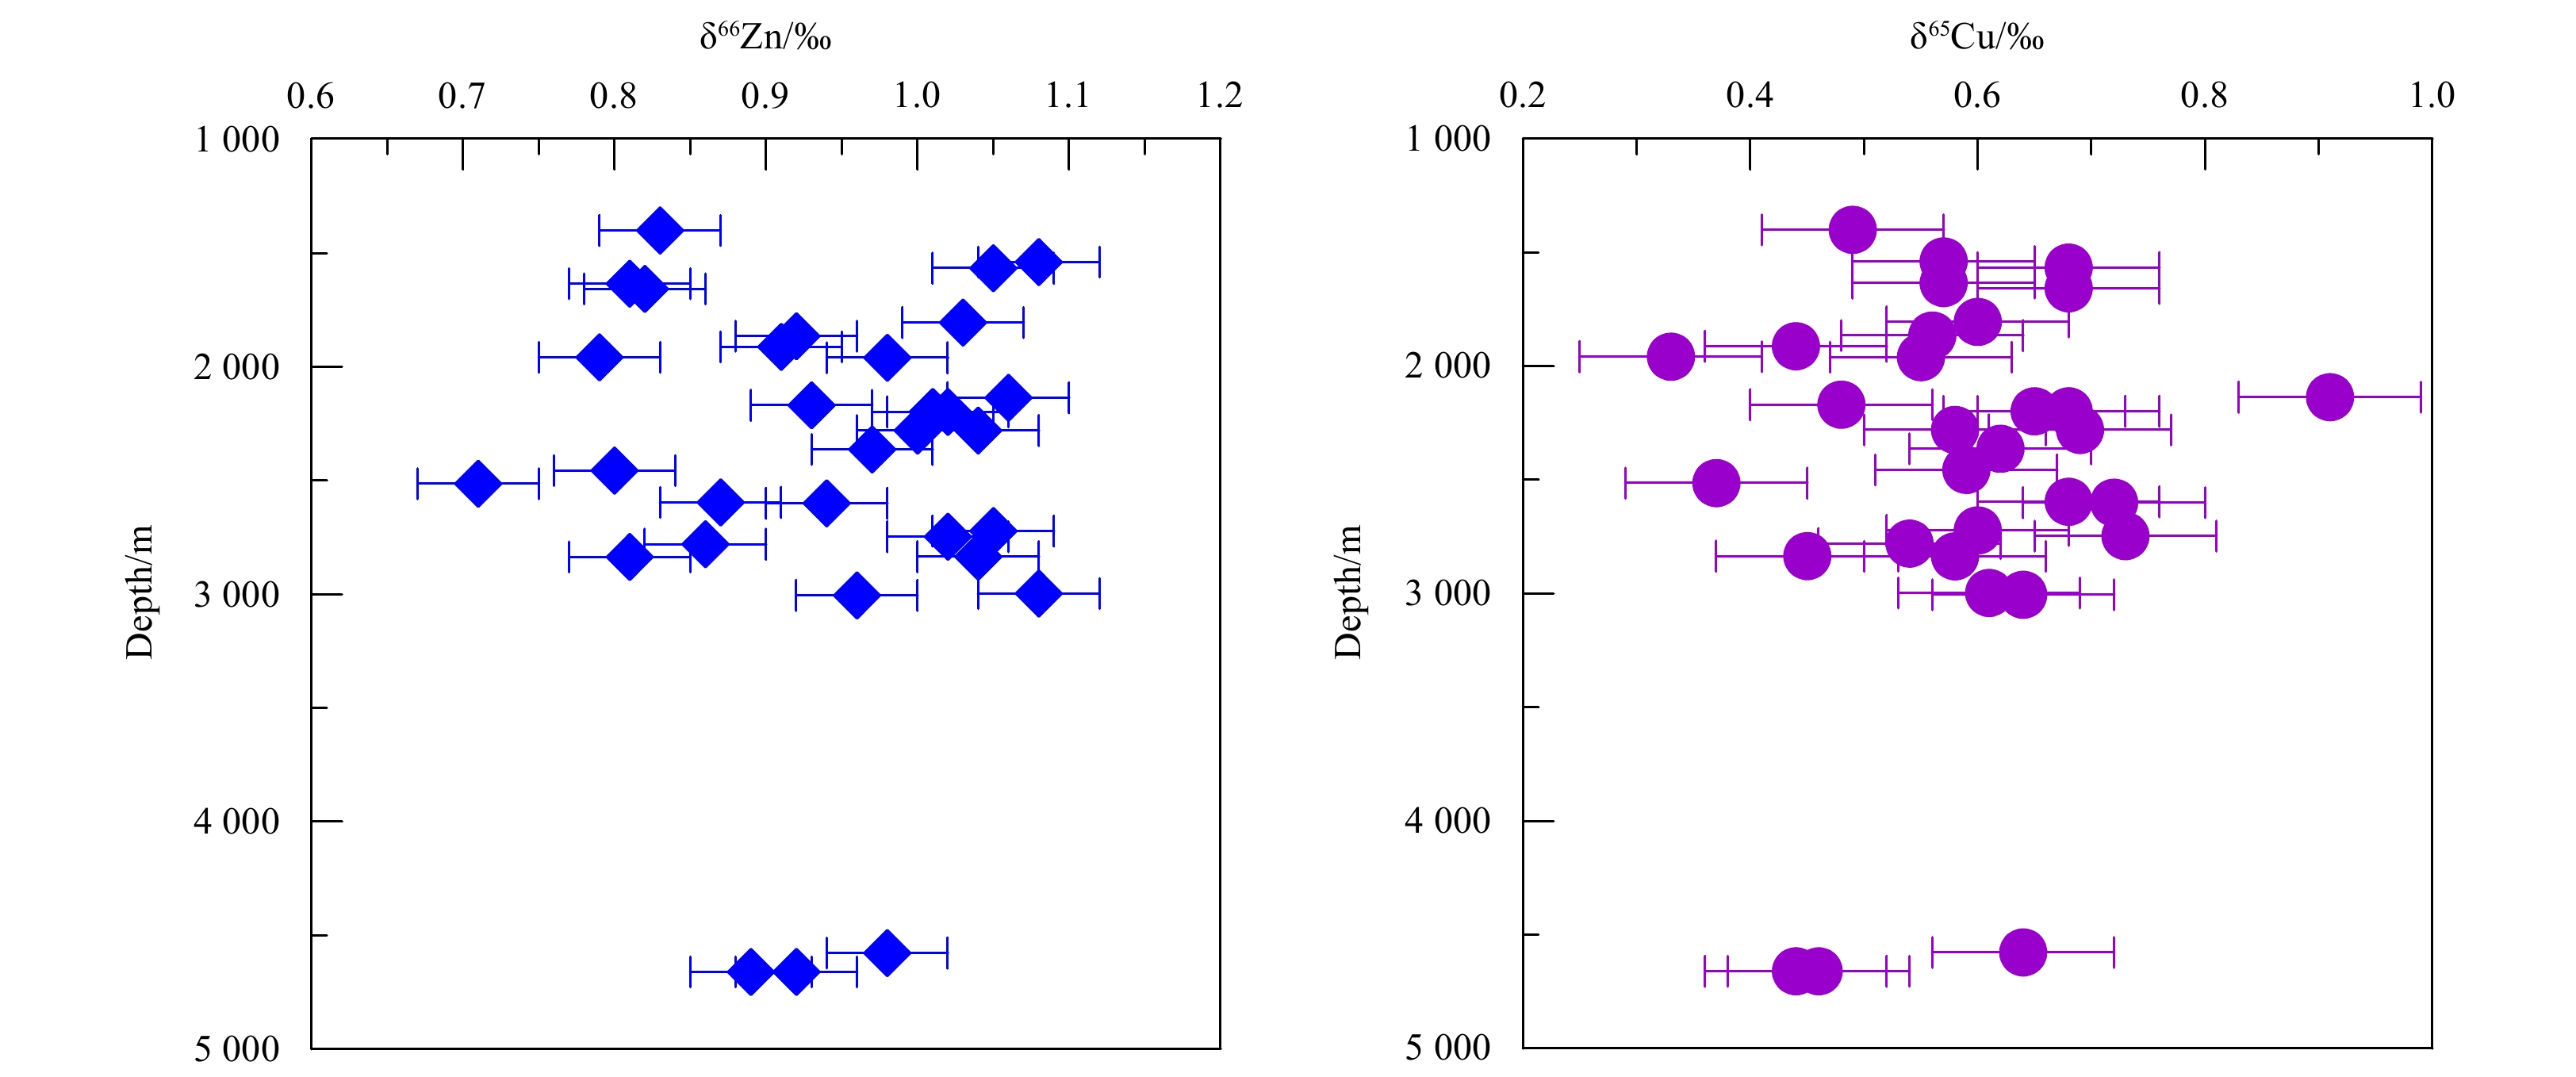
Figure 4. Cu and Zn isotope ratios of Fe-Mn crusts collected at different depths. The error bars correspond to ±0.04‰ for Zn and ±0.08‰ for Cu.
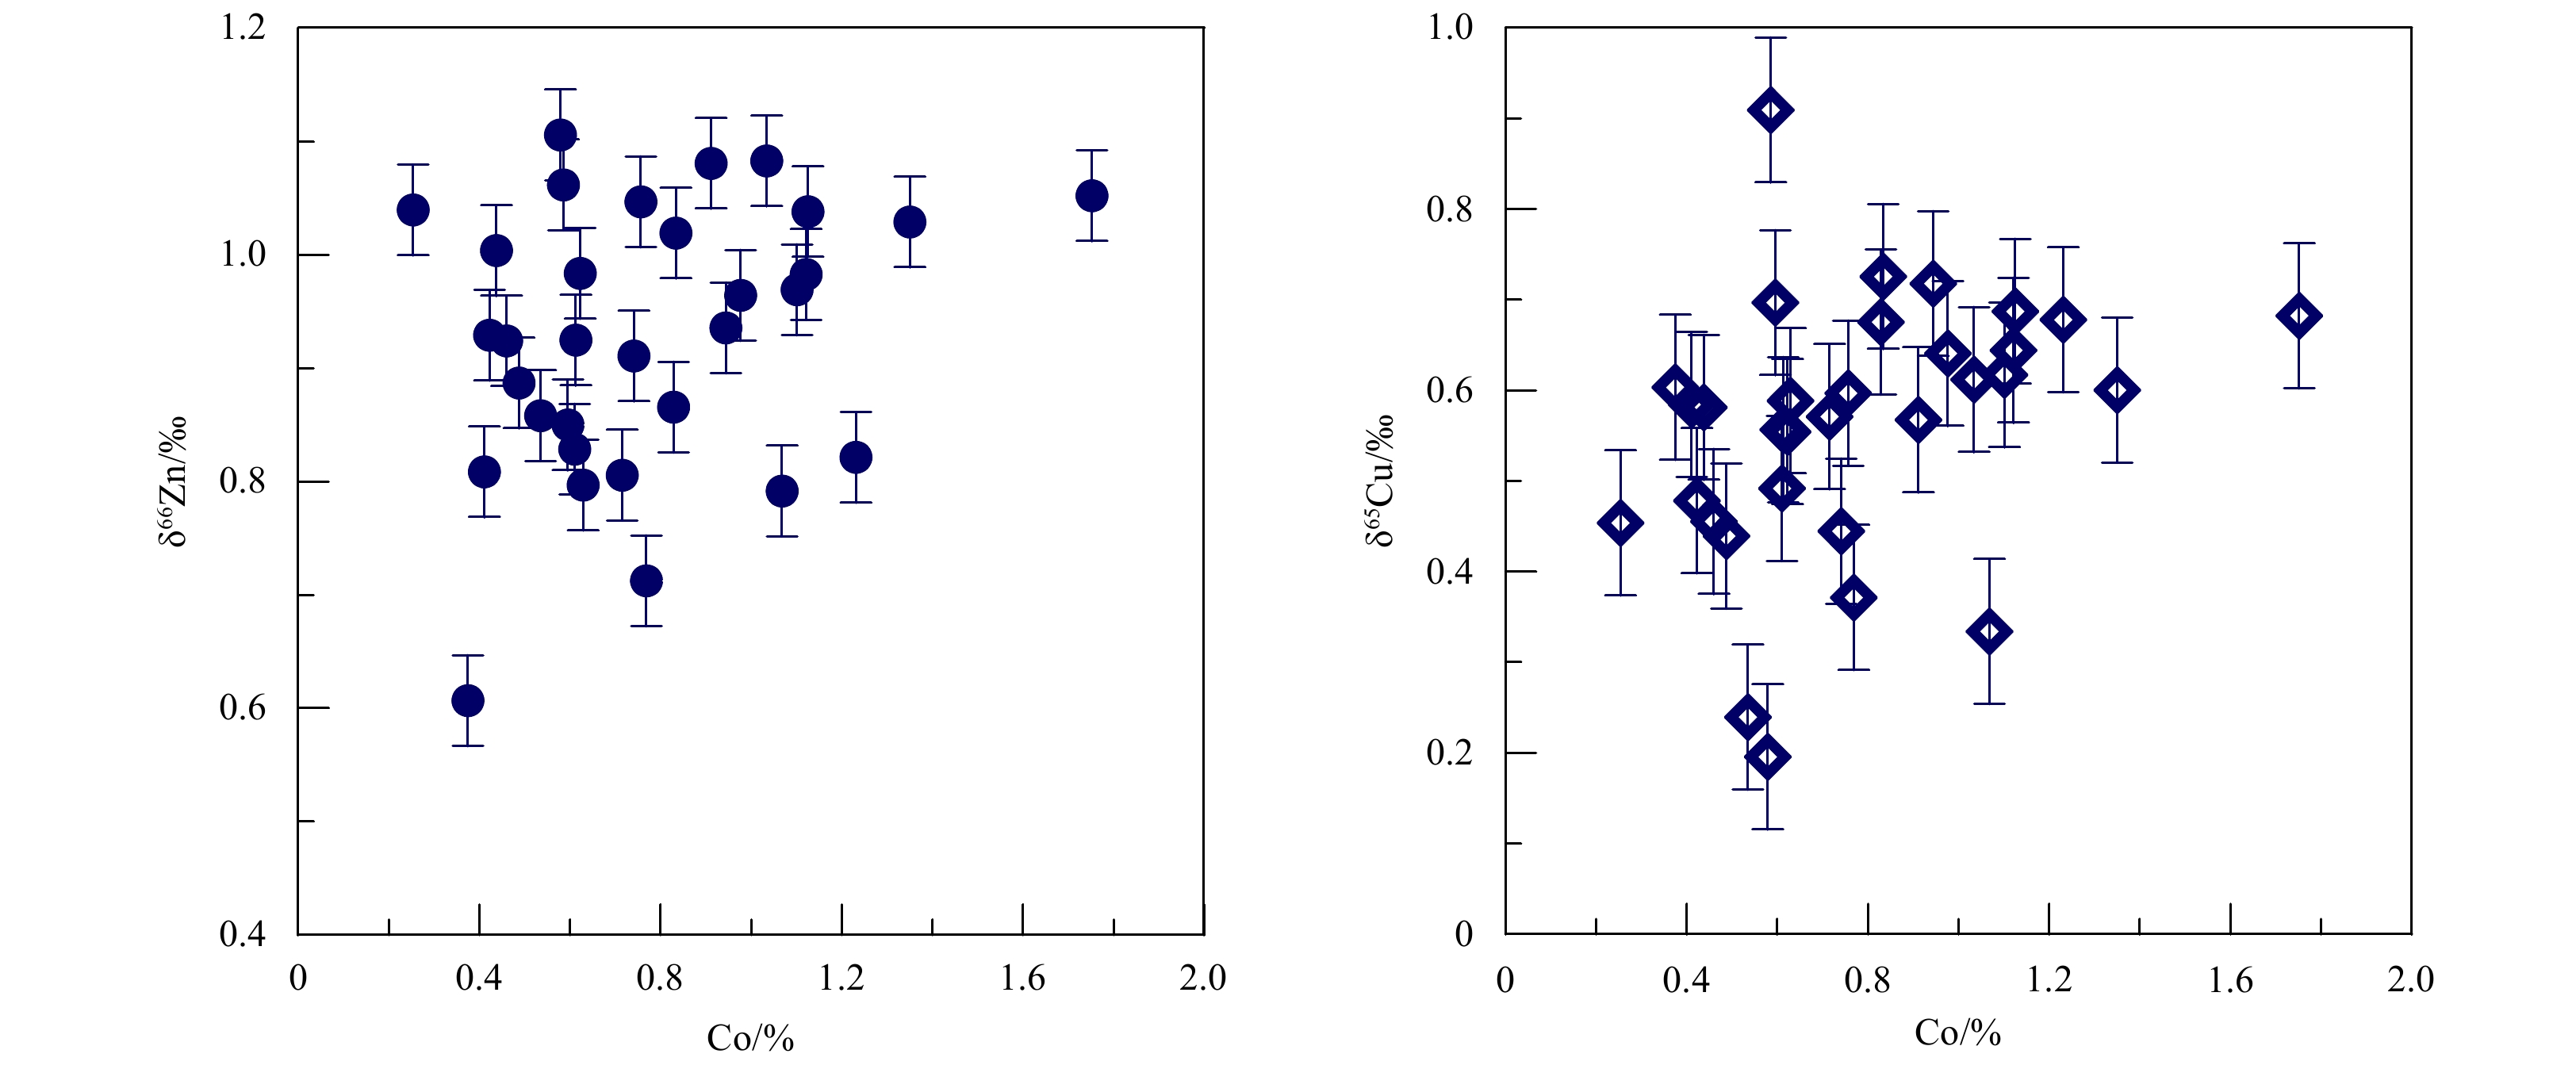
Figure 5. Cu and Zn isotope ratios of Fe-Mn crusts plotted against their Co contents. The error bars correspond to ±0.04‰ for Zn and ±0.08‰ for Cu.


 DownLoad:

 DownLoad:


 DownLoad: