Key Laboratory of Mariculture of Ministry of Education, Ocean University of China, Qingdao 266003, China
2.
Fishery College, Zhejiang Ocean University, Zhoushan 316022, China
Funds:
The National Key R&D Program of China under contract No. 2018YFD0900905; the National Natural Science Foundation of China under contract No. 41776171.
Chaeturichthys stigmatias and Amblychaeturichthys hexanema belong to the family Gobiidae, which are offshore warm fish species and widely distribute in the western Pacific Ocean. In this study, the mitochondrial cytochrome c oxidase subunit I (COI) sequences and 12S ribosomal RNA (12S rRNA) sequences were used to analyze the interspecific differences between the two species. The phylogenetic analysis showed that the interspecific distance was significantly higher than the intraspecific genetic distance. The Neighbor-Joining tree showed two separate clusters, without sharing haplotype. The mitochondrial genome sequence of C. stigmatias was also reported. This genome was 17 134 bp in size, with a high A+T content of 55.9%. The phylogenetic analysis based on the tandem 13 coding protein genes nucleotide sequences indicated that C. stigmatias showed a close relationship with A. hexanema. This study can provide the basic genetic data for two species and will help for constructing the phylogeny of the Gobiiade.
Chaeturichthys stigmatias and Amblychaeturichthys hexanema, belong to the Gobiiade, Perciforms (Wu and Zhong, 2008). They are offshore warm fish species which are widely distributed in Korea, Japan and China. Chaeturichthys stigmatias mainly inhabits the sandy-mud bottom and lives on benthonic fauna (Chen et al., 2016). It was reported to be the dominant species in the Huanghe River Estuary and its adjacent waters (Meng et al., 2017). Amblychaeturichthys hexanema mainly inhabits the shallow and estuarine waters (Li et al., 2000) and lives on more than 40 kinds of food organisms (Han et al., 2013).
The morphological characters like body shape and color of C. stigmatias are similar to A. hexanema (Nelson et al., 2006), and then they are often wrongly classified. Both species roughly have the same number of fin ray and fin spines on their first dorsal fin. Besides, they have 3−4 pairs of short tentacles on the chin of both species, which are different from most other gobies. The dorsal fins of these two species have scattered black stripes, while C. stigmatias has a black spot on the posterior of the first dorsal fin (Wu and Zhong, 2008). However, this characteristic is often not obvious enough to distinguish them. Previous ichthyologic researches had placed them into the Chaeturichthys genus (East China Sea Fishery Research Institute of Chinese Academy of Fishery Sciences, 1990). Qu (2018) thought that C. stigmatias and A. hexanema were very similar in morphology and showed closely genetic relationship in morphological tree among 28 goby fish. The otolith morphology of the two species was also relatively similar, and it was difficult to distinguish them (Yu, 2014).
There have been abundant reports on morphology, otolith, ingestion of C. stigmatias and A. hexanema until now (Mei et al., 2010; Han et al., 2013; Meng et al., 2017). However, few genetic studies of C. stigmatias and A. hexanema were conducted. The complete mitochondrial sequences of C. stigmatias (KC495071.1) and A. hexanema (KT781104) were determined (Sun et al., 2015; Jin et al., 2012), however, two complete mitochondrial genomes showed high homology. The structures of mtDNA D-loop region and mitochondrial cytochrome c oxidase subunit I (COI) sequence between the two sequences are also basically the same. Therefore, these two species may have been misidentified.
The molecular tools like DNA barcoding are often required to identify marine fish because the morphological characters of many species are too similar to identify (Smith et al., 2008). The mitochondrial COI gene, usually used as DNA barcoding, has been widely used in species identification (Wang et al., 2018; Puckridge et al., 2013), description of new record species or new species (Guo et al., 2010; Gao et al., 2011) and discovery of cryptic species (Zemlak et al., 2009; Suh et al., 2019). Besides, 12S rRNA gene has been recently developed as DNA mini-barcoding. It can be used in environmental samples needing universal primers, processed biological material such as food products and archival specimens of DNA degradation because it has shorter length and can be more efficient amplification (Meusnier et al., 2008; Shokralla et al., 2015). Masaki et al. (2015) aligned whole 12S rRNA sequences from 180 species and designed a set of universal PCR primers (MiFish-U/E) of fish, and they have been widely used for identification of marine fish.
This study re-determined the complete mitochondrial genome of C. stigmatias and analyzed the interspecific difference between C. stigmatias and A. hexanema by COI gene and 12S rRNA gene. This study is conducive to reconstruct the phylogeny of the Gobiiade and can provide effective basic data for two goby species.
2.
Materials and methods
2.1
Sample collection
A total of 30 ind. of C. stigmatias and 24 ind. of A. hexanema from the seacoast of Qingdao, Shandong Province, China, were collected in this study. The information of samples was shown in Table 1. The two goby species were initially identified by the morphological characters like black spot on the first dorsal fin, and then COI and 12S rRNA sequences were amplified and analyzed. A piece of skeletal muscle of these samples was excised for DNA extraction and preserved in 95% ethanol until use. The COI sequences and 12S rRNA sequences of 30 ind. of C. stigmatias and 24 ind. of A. hexanema were amplified for studying the interspecific difference. One ind. of C. stigmatias was used for determining its complete mitochondrial genome sequence.
Table
1.
The sampling information of C. stigmatias and A. hexanema
2.2
DNA extraction, PCR amplification and sequencing
Total genomic DNA was isolated from the muscle tissue by proteinase K digestion followed by the standard phenol/chloroform method (Sambrook et al., 1989).
Primers used for the amplification of the COI gene were F1-5′-TCAACCAACCACAAAGACATTGGCAC-3′ and R1-5′-TAGACTT CTGGGTGGCCAAAGAATCA-3′ (Ward et al., 2008), and the 12S rRNA sequences were amplified by primers, MiFish-U-F: 5′-GTCGGTAAAACTCGTGCCAGC-3′ and MiFish-U-R: 5′-CATAGTGGGGTATCTAATCCCAGTTTG-3′ (Masaki et al., 2015).
All PCRs were performed in an Eppendorf thermal cycler (A300 Fast Thermal Cycler). TaKaRa Ex Taq were used for polymerase chain reaction (PCR). PCR was carried out in 25 µL volumes containing 0.15 µL Taq DNA polymerase, 1 µL template DNA, 2.5 µL 10× DNA loading buffer, 2 µL dNTP, 1 µL forward and reverse primer. The PCR amplification was carried out under the following conditions: 3 min initial denaturation at 95°C, and 40 cycles of 45 s at 94°C for denaturation, 45 s at 52°C for annealing, and 45 s at 72°C for extension, and a final extension at 72°C for 5 min (Liu et al., 2007).
Subsequent complete sequence of C. stigmatias was accomplished by primer walking method. Thirty-five normal PCR primer sets were designed to accomplish the entire mitogenome (Table A1). It was essential that every two contiguous segments overlapped by at least 50 bp to ascertain the accuracy of sequencing. The PCR amplification process was the same as above except for the annealing temperature. The annealing temperature of primers were shown in Table A1.
All PCR products were detected by 2% agarose gel electrophoresis, the products with good amplification effect were sent to Tsingke Biotech Co., Ltd. (China) for sequencing. To ensure the accuracy of the sequences, each sample was sequenced in both directions.
2.3
Sequence analysis
The obtained sequences were analyzed by DNASTAR software (Madison, USA). ARLEQUIN 3.5 was used to calculate haplotype diversity (h), and nucleotide diversity (π) (Excoffier et al., 2005). Nucleotide composition and genetic distance were analyzed using MEGA 5 based on the Kimura 2-parameter model (Tamura et al., 2011).
The mitochondrial genome sequence alignment was performed initially using DNASTAR software (Madison, USA) with default parameters, and further adjusted manually (Burland, 2000). Locations for protein-coding genes and rRNAs were determined by DOGMA (Wyman et al., 2004) with default settings.
3.1
The interspecific difference between C. stigmatias and A. hexanema
In this study, the length of COI homologous fragments of C. stigmatias and A. hexanema was 622 bp (GenBank accession: MT568667-MT568696 and MT568697-MT568720). The average base composition content of C. stigmatias was 23.6% for A, 26.9% for C, 18.2% for G, 31.3% for T, and A. hexanema was 23.8% for A, 28.0% for C, 19.0% for G, 29.2% for T. The content of C+G was slightly higher than that of C. stigmatias.
A total of 9 polymorphic sites, 7 transition and 2 transversion were detected in 30 ind. of C. stigmatias. These sequences could be defined as 11 haplotypes. Besides, a total of 13 polymorphic sites, 11 transition and 2 transversion were detected in 24 ind. of A. hexanema, and 7 haplotypes were defined by these sites. No base insertions or deletions were detected within the two species.
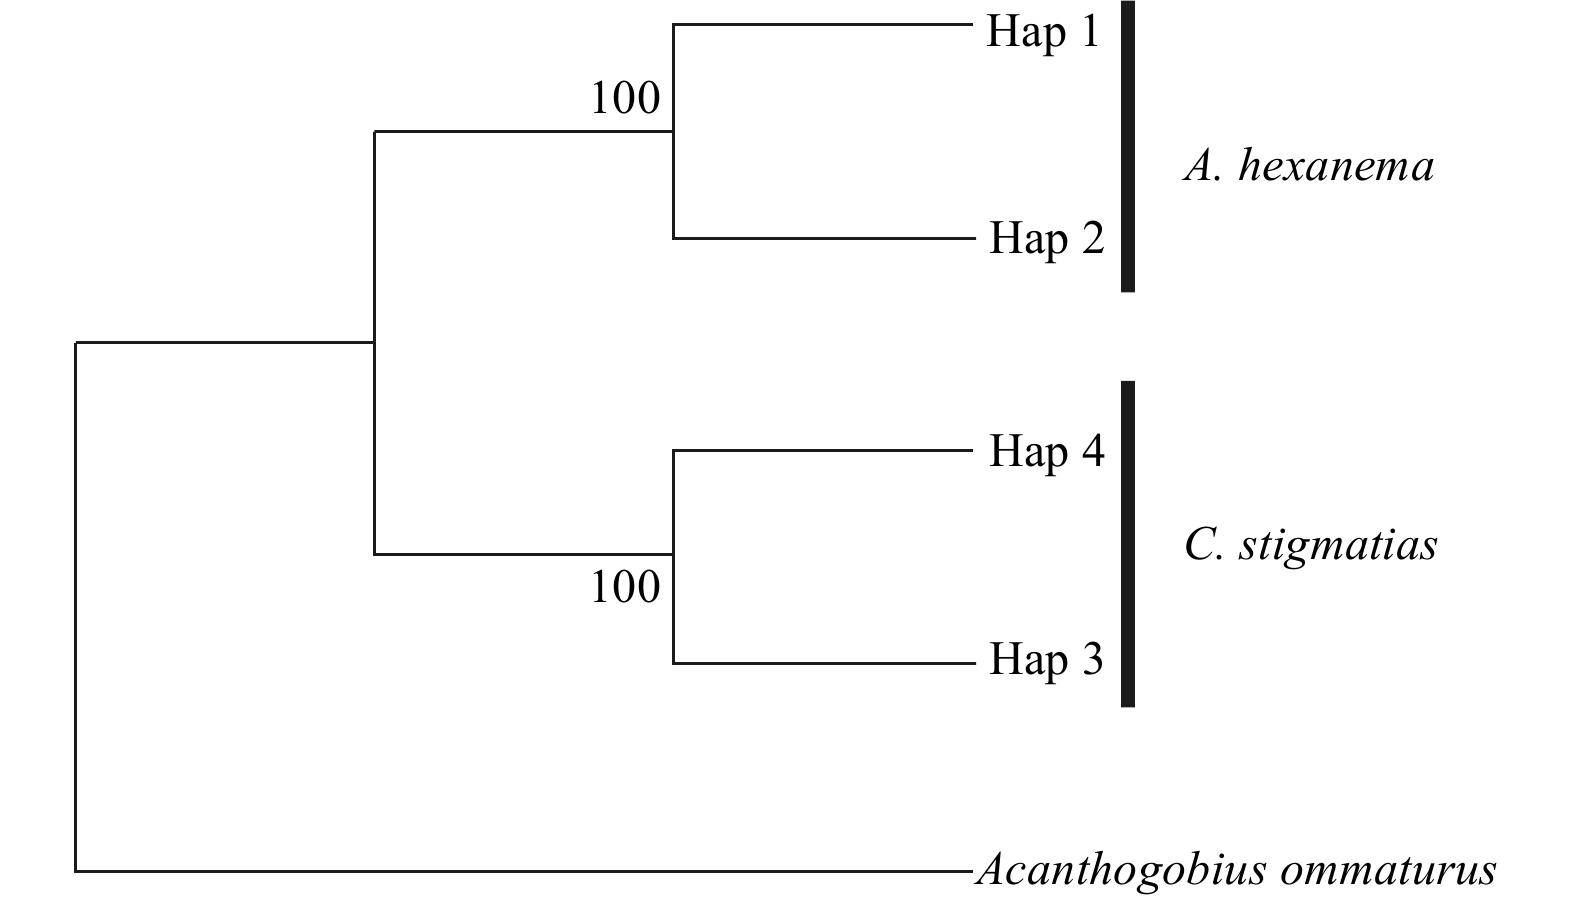
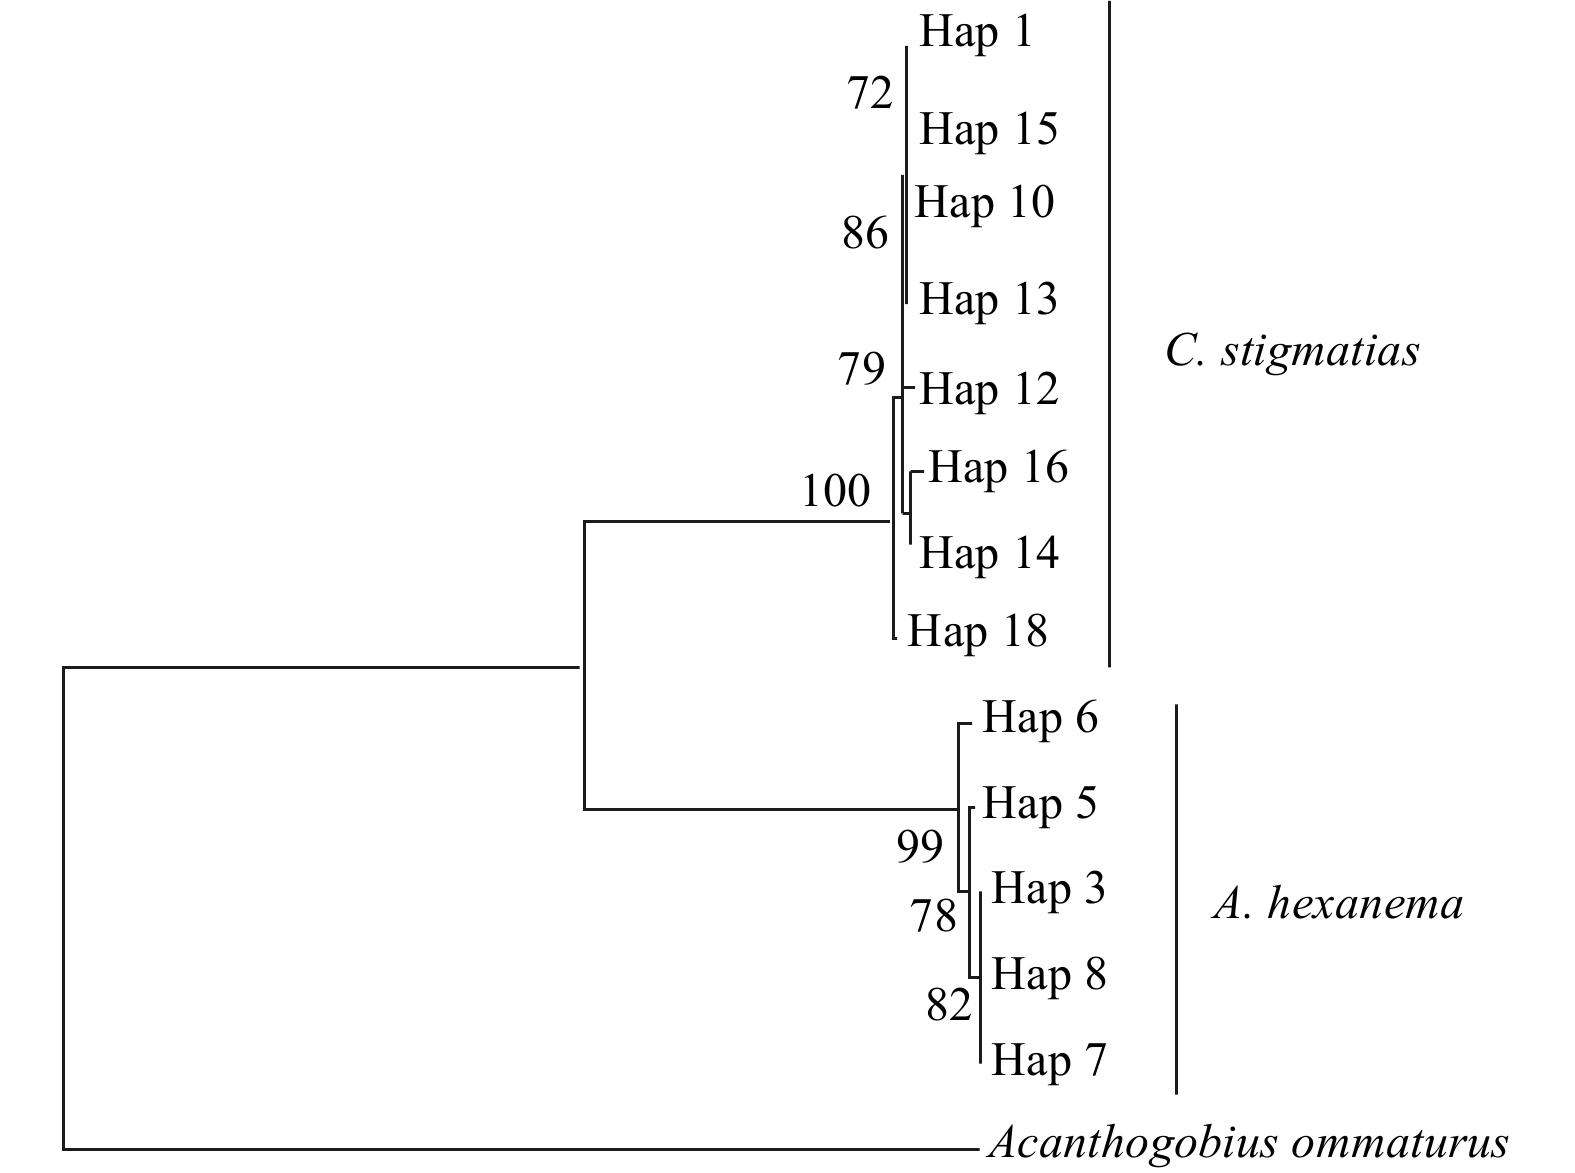
The number of haplotype and haplotype diversity of two gobies obtained based on the COI gene were shown in Table 2. The genetic diversity parameters of C. stigmatias were higher than those of A. hexanema. The intraspecific genetic distance of A. hexanema and C. stigmatias was 0.002 and 0.003, respectively, and the intraspecific genetic distance between two species was 0.187. Clustering analysis of COI haplotypes was conducted using NJ method (Fig. 1). The result showed that the two species clustered separately, without sharing haplotype.
Table
2.
Genetic diversity parameters of C. stigmatias and A. hexanema based on COI gene
Figure
1.
Neighbor-joining tree for COI haplotypes of A. hexanema and C. stigmatias. Bootstrap values of >70% (out of 1 000 replicates) are shown on the nodes.
A total of 194 bp 12S rRNA gene homologous fragments of C. stigmatias and A. hexanema were amplified (GenBank accession: MT614220-MT614249 and MT614190-MT614213). The contents of A, T, C and G of C. stigmatias and A. hexanema were 20.6%, 34.9%, 20.3%, 24.2% and 20.8%, 32.5%, 22.2%, 24.5%, respectively. The content of A+T was slightly higher than that of G+C, which was similar to the characteristics of higher A+T content in other fishes (Sun et al., 2012; Liu et al., 2012).
A total of 1 polymorphic site was found within the 12S rRNA sequences. Two haplotypes were defined by these sites in the 30 ind. of C. stigmatias (Table 3). There was 1 polymorphic site in the 12S rRNA sequences of 24 ind. A. hexanema. This site could be defined as 2 haplotypes (Table 3). The NJ phylogenetic tree constructed by haplotypes of this two species showed that the two species could be clearly divided into two branches, which was consistent with the analysis results of the COI sequences (Fig. 2).
Table
3.
Genetic diversity parameters of C. stigmatias and A. hexanema based on 12S rRNA gene
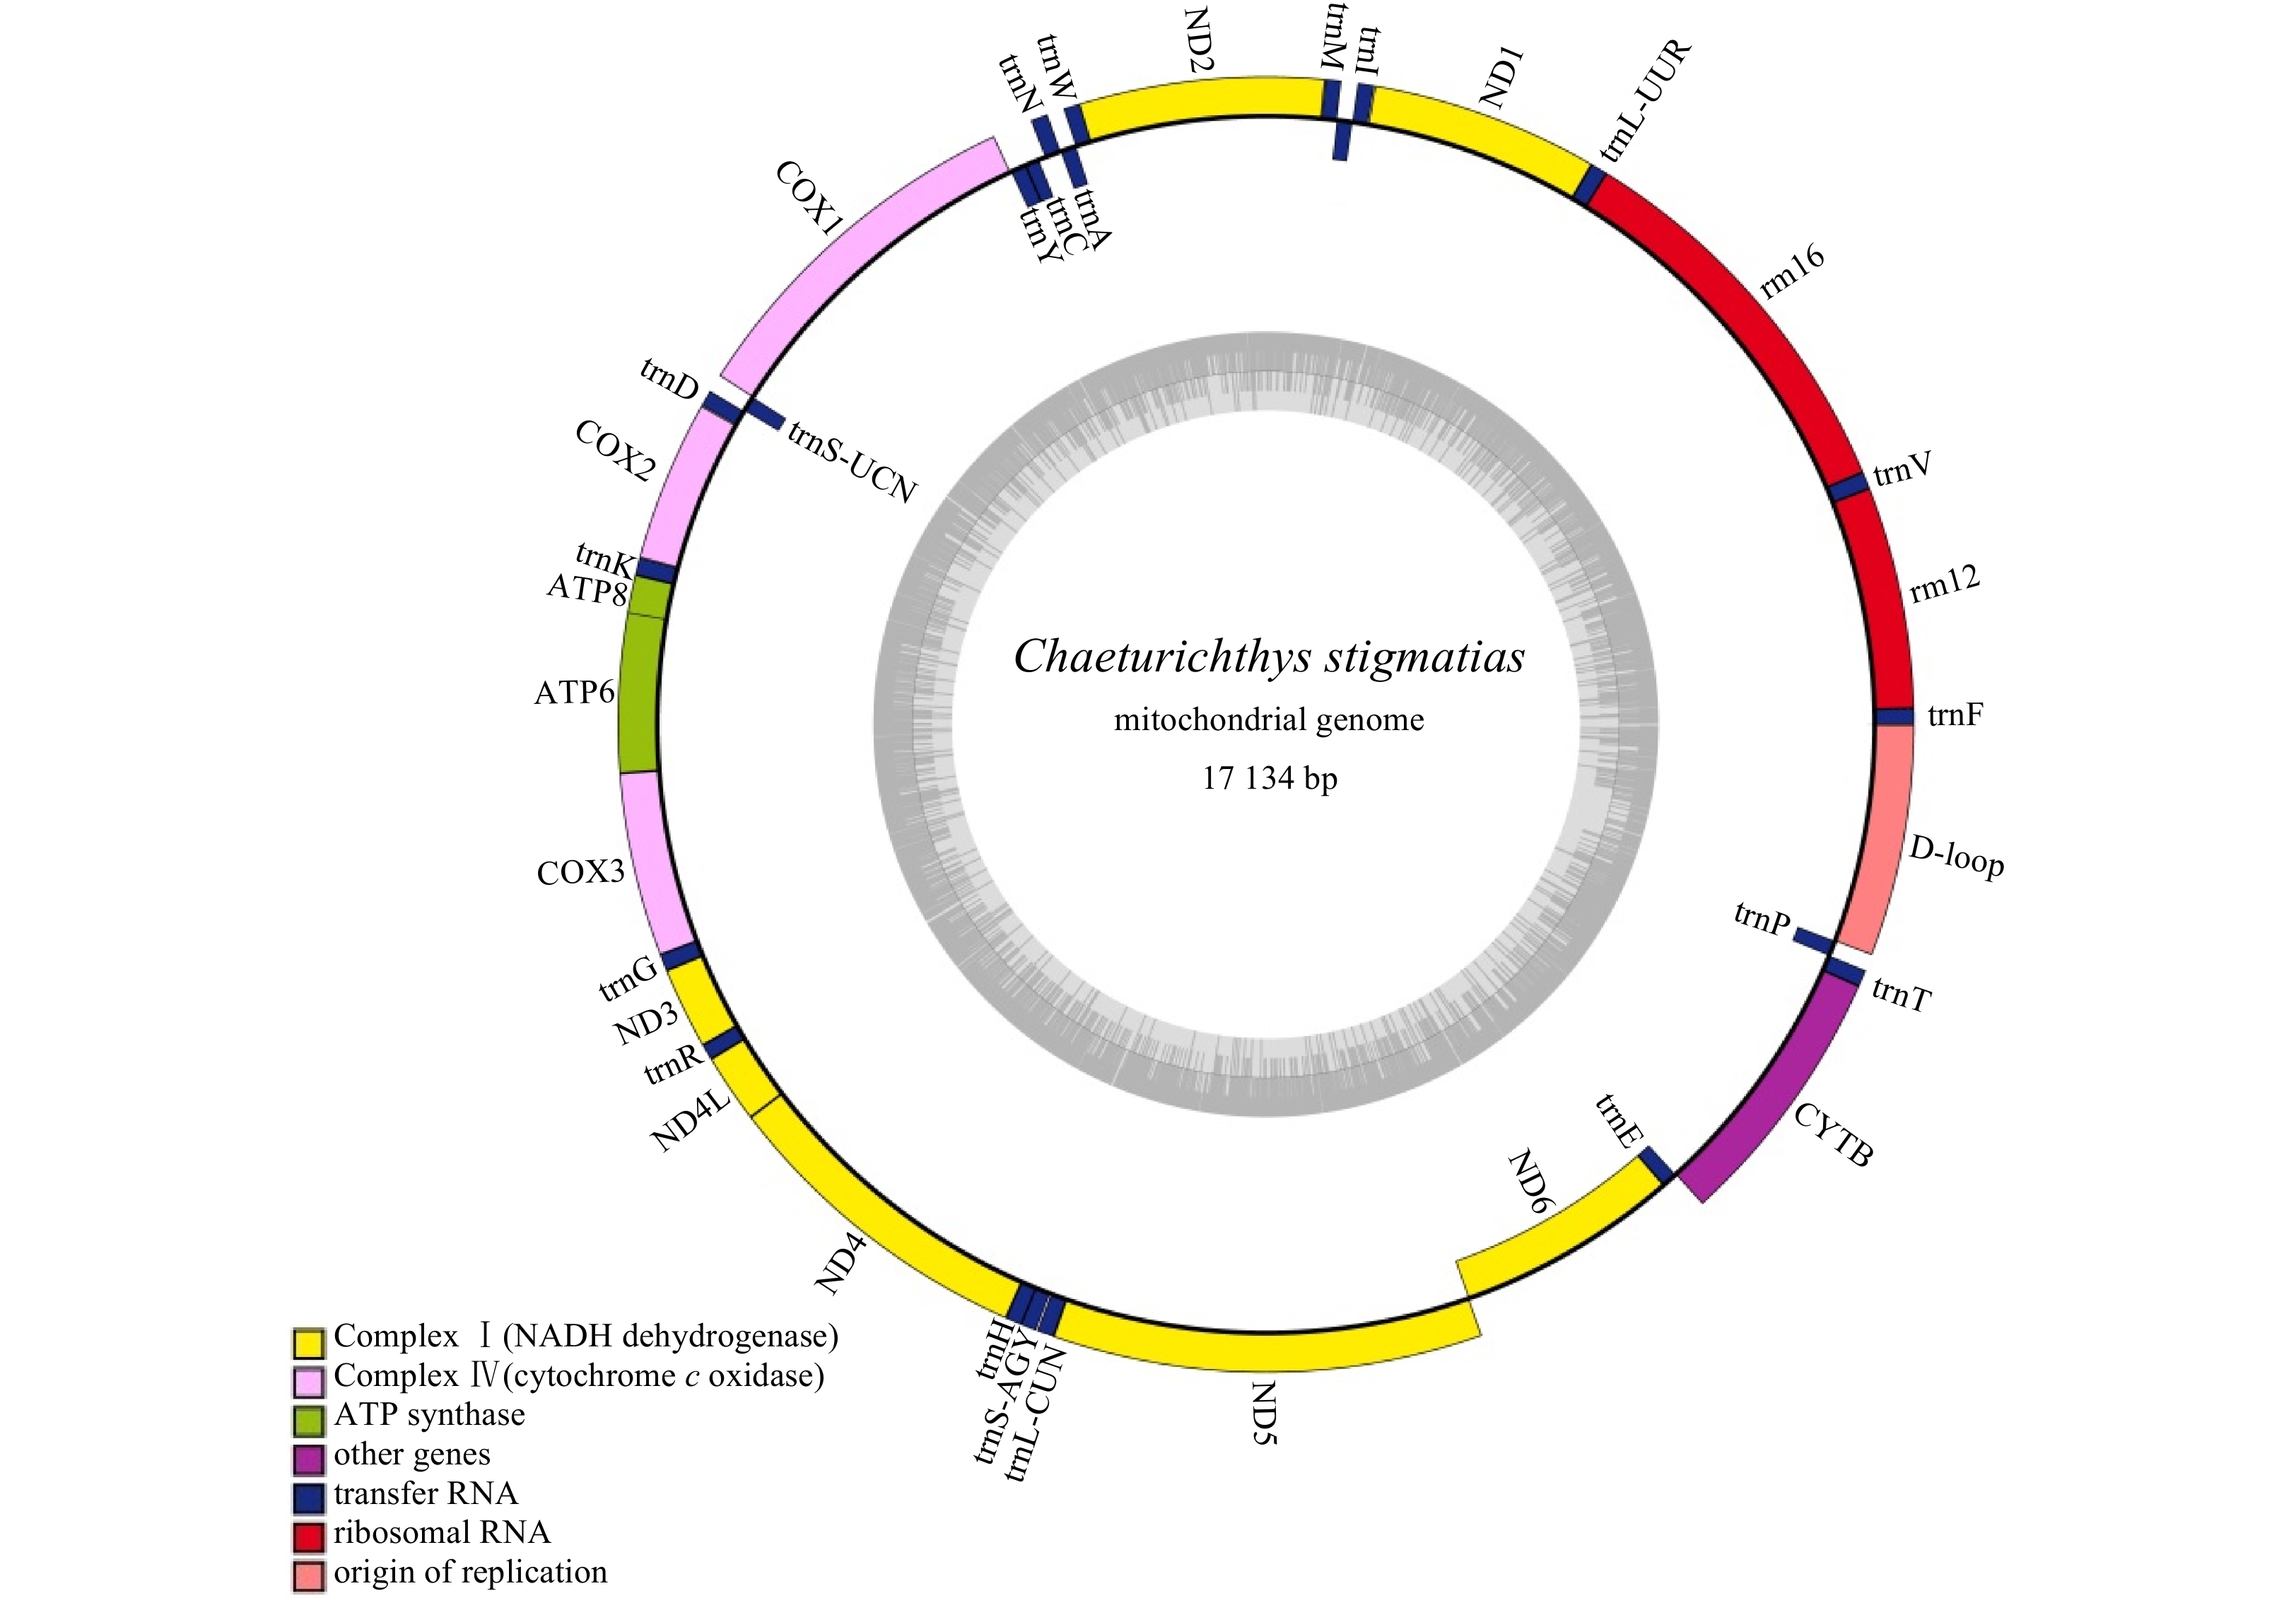
The mitochondrial genome of C. stigmatias was acquired (MN038166), and it was 17 134 bp in length, covering 13 protein-coding genes, 22 tRNA, 2 rRNA genes, 1 OL and 1 D-loop region (Fig. 3). The overall nucleotide composition was 28.2% for A, 27.7% for T, 28.0% for C, and 16.1% for G, with a slight AT bias of 55.9%, which was similar to other goby fishes (Jin et al., 2012). In 13 protein-coding genes, the longest one was ND5 (1 842 bp in length), whereas the shortest one was ATP8 (165 bp in length). The lengths of tRNA genes were ranged from 64 bp (tRNA-Cys) to 74 bp (tRNA-Val, tRNA-Asn). As other vertebrates, with the exception of ND6 and 8 tRNAs (tRNA-Ala, tRNA-Asn, tRNA-Cys, tRNA-Gln, tRNA-Tyr, tRNA-Pro, tRNA-Glu, tRNA-Ser), all of the observed mitochondrial genes were found to be encoded on H strand.
Figure
3.
The gene map of the complete mitochondrial genome of C. stigmatias. Genes encoded on the H-strand and L-strand are shown outside and inside the circular map of the mitogenome, respectively.
All the protein-coding genes started with the ATG codon except for COI and ND6, that started with GTG and CTA, respectively. Two types of stop codons were used by the coding genes: TAA (ND1, ND2, COI, ATP8, ATP6, ND4L, and ND5) and incomplete stop codon T (COII, COIII, ND3, ND4, and ND6). The control region (D-loop) was 992 bp sequence located between the tRNA-Pro and tRNA-Phe genes. The 12S rRNA and 16S rRNA were located between the tRNA-Phe and tRNA-Leu genes and separated by the tRNA-Val gene. Sequence analysis showed that many overlaps between genes (Table 4).
Table
4.
Complete mitochondrial genome characteristics of C. stigmatias
Gene
Start position/bp
Stop position/bp
Size/bp
Intergenic nucleotide
Start codon
Stop codon
Strand
tRNA-Phe
1
68
68
0
−
−
H
12S rRNA
69
1 017
949
0
−
−
H
tRNA−Val
1 018
1 091
74
0
−
−
H
16S rRNA
1 092
2 774
1 683
0
−
−
H
tRNA−Leu
2 775
2 847
73
0
−
−
H
ND1
2 848
3 822
975
3
ATG
TAA
H
tRNA−Ile
3 826
3 895
70
−1
−
−
H
tRNA−Gln
3 895
3 964
70
1
−
−
L
tRNA−Met
3 966
4 033
68
1
−
−
H
ND2
4 035
5 079
1 044
−2
ATG
T − −
H
tRNA−Trp
5 078
5 149
72
0
−
−
H
tRNA−Ala
5 150
5 221
72
0
−
−
L
tRNA−Asn
5 222
5 295
74
1
−
−
L
tRNA−Cys
5 327
5 390
64
0
−
−
L
tRNA−Tyr
5 391
5 461
71
3
−
−
L
COXI
5 465
7 018
1 554
0
GTG
TAA
H
tRNA−Ser
7 019
7 089
71
3
−
−
L
tRNA−Asp
7 093
7 163
71
2
−
−
H
COXII
7 166
7 856
691
1
ATG
T − −
H
tRNA−Lys
7 858
7 931
74
0
−
−
H
ATP8
7 932
8 096
165
−5
ATG
TAA
H
ATP6
8 090
8 773
684
0
ATG
TAA
H
COXIII
8 774
9 557
784
0
ATG
T − −
H
tRNA−Gly
9 558
9 629
72
0
−
−
H
ND3
9 630
9 978
349
0
ATG
T − −
H
tRNA−Arg
9 979
10 046
68
0
−
−
H
ND4L
10 047
10 343
297
0
ATG
TAA
H
ND4
10 344
11 724
1 381
0
ATG
T − −
H
tRNA−His
11 725
11 794
70
−1
−
−
H
tRNA−Ser
11 794
11 861
68
5
−
−
H
tRNA−Leu
11 867
11 939
73
0
−
−
H
ND5
11 940
13 781
1 842
−1
ATG
TAA
H
ND6
13 781
14 792
1 012
0
CTA
T − −
L
tRNA−Glu
14 793
14 863
71
0
−
−
L
Cyt b
14 864
16 000
1 137
5
ATG
TAA
H
tRNA−Thr
16 001
16 072
72
−1
−
−
H
tRNA−Pro
16 072
16 142
71
0
−
−
L
D−loop
16 143
17 134
992
−
−
−
H
Note: H represents genes encoded on the H-strand; L, genes encoded on L-strand. −, no data.
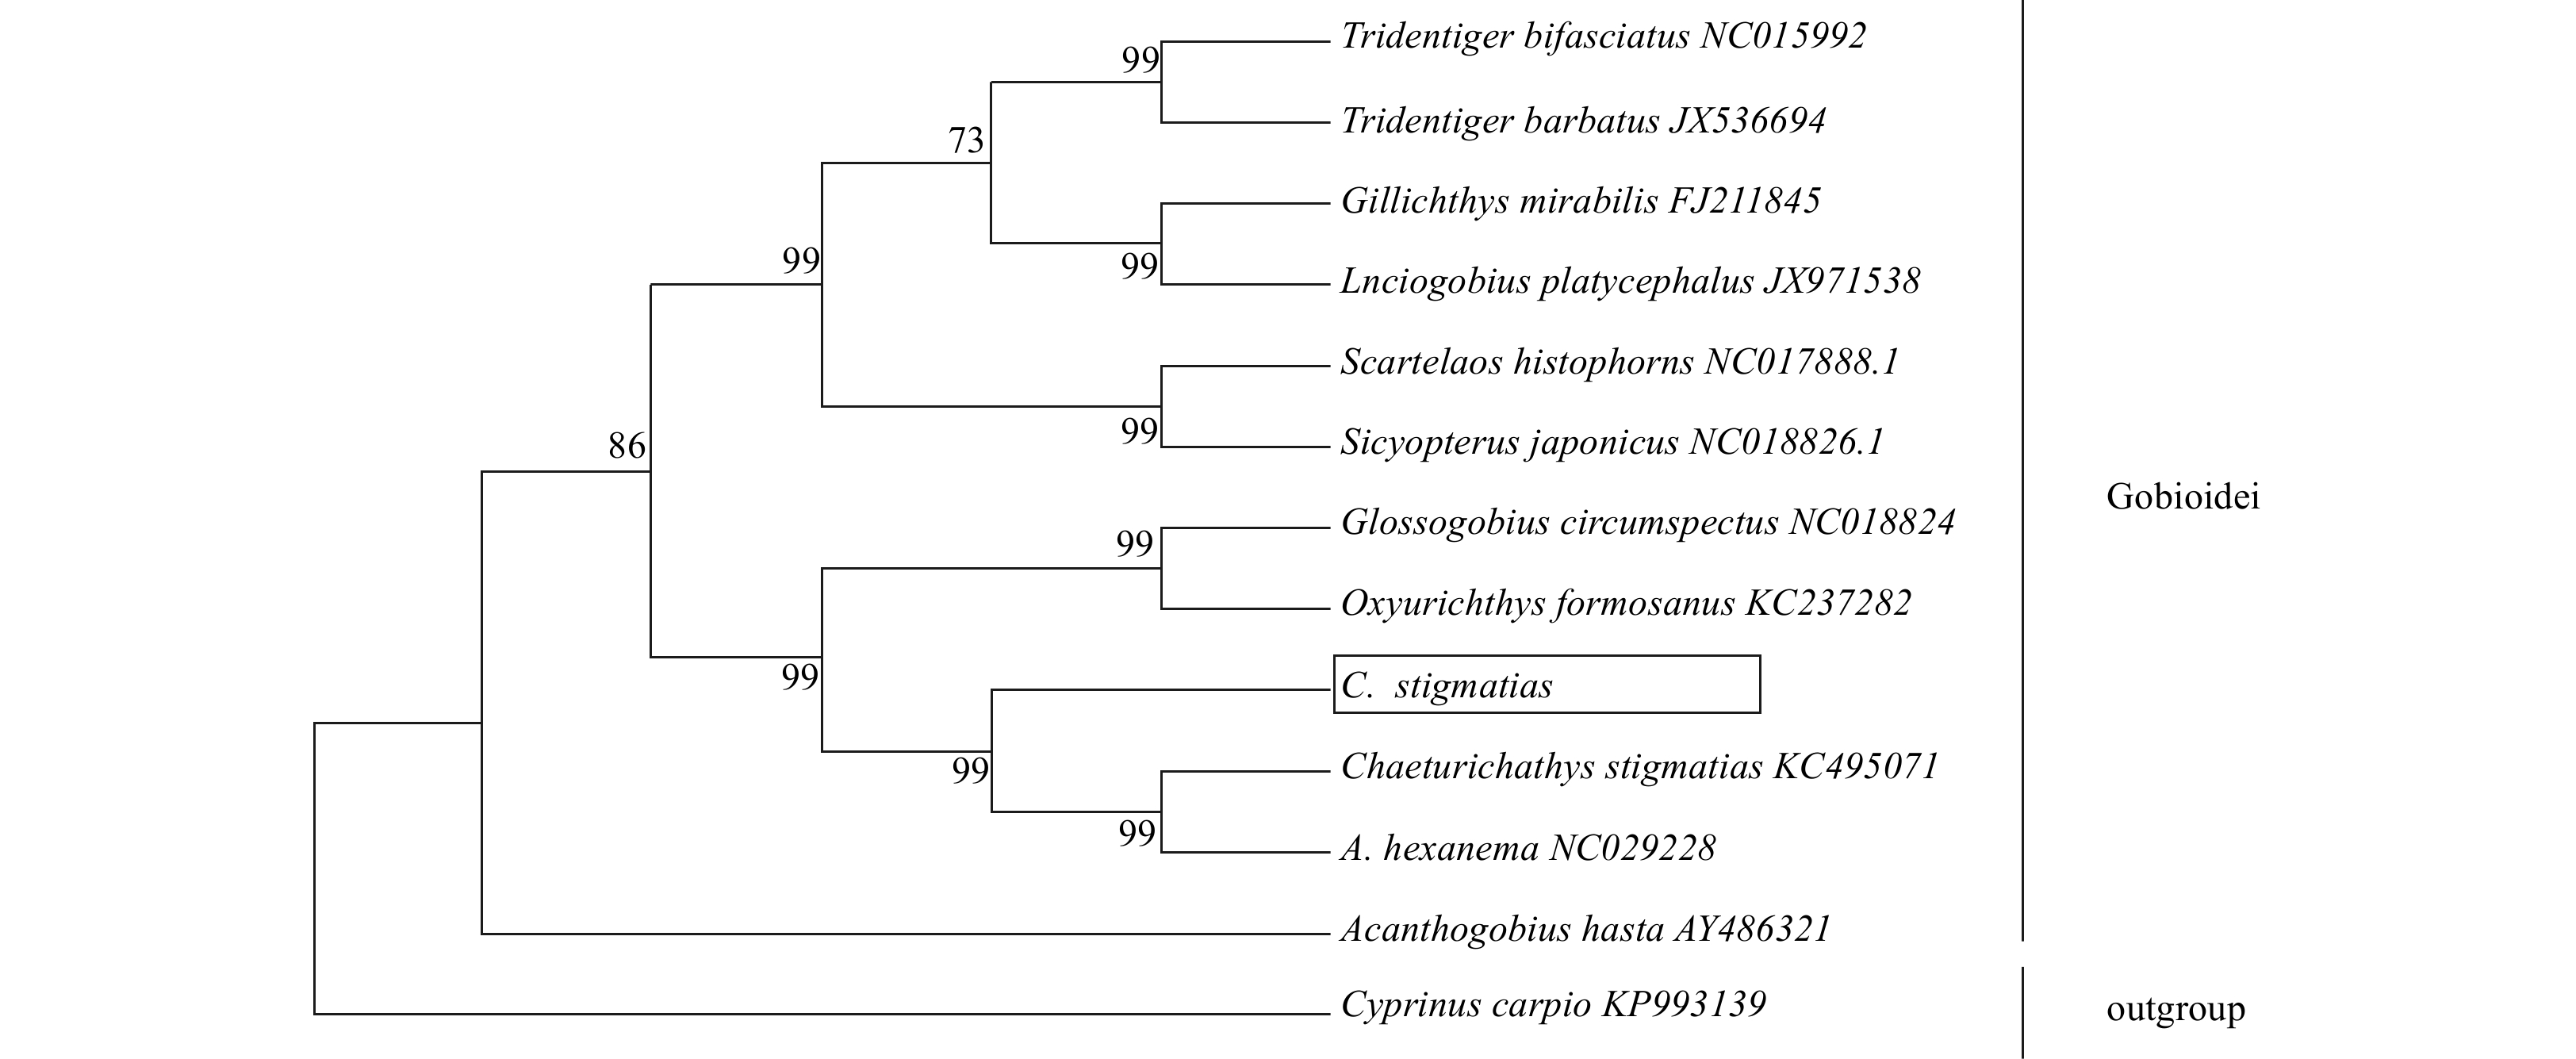
Phylogenetic tree based on the tandem 13 coding protein genes nucleotide sequences was constructed by NJ method (Fig. 4). From the tree topologies, this study could conclude that C. stigmatias was genetically closest to A. hexanema, and then to Oxyurichthys formosanus among 12 species within Gobioidei.
Figure
4.
The phylogenetic analyses investigated using Neighbor-Joining based on nucleotide sequences of 13 concatenated protein-coding genes. Cyprinus carpio (GenBank: KP993139) was used as an outgroup. The black box represented sequences of C. stigmatias sequenced in this study.
DNA barcoding developed in recent years is an effective and efficient molecular tool used in species identification, especially for closely related fish species (Stoeckle, 2003; Hebert et al., 2003a, b). For example, Ward et al. (2005) analyzed the COI gene of 270 species of marine fish and resulted in all fish species could be discriminated by the COI gene. Compared with the conventional DNA barcoding, mini-barcoding like 12S rRNA barcoding was developed recently. It has shorter length and can be efficiently amplified, which can overcome some problems existing in traditional DNA barcoding, such as DNA degradation in biological food products and old archival specimens, high sequence variability in environmental samples (Meusnier et al., 2008; Shokralla et al., 2015).
A1.
Primers for complete mitochondrial genome of C. stigmatias
In this study, the result of conventional COI barcoding and 12S rRNA mini-barcoding analysis all indicated that there were significant genetic differences between C. stigmatias and A. hexanema, and the NJ tree based on COI and 12S rRNA haplotypes showed that the two species were clustered separately, which verified the validity of these two barcoding in interspecific identification. Therefore, combination of morphology and DNA barcoding to solve the problems of classification and identification will be more effective and accurate (Cywinska et al., 2006; Pfenninger et al., 2007).
The mitochondrial genome has been widely used in evolutionary biology, population genetics and molecular ecology (Inoue et al., 2001; Miya et al., 2005; Lavoué et al., 2007). It has been proved that mitogenomic data can be used to resolve the controversial problems of phylogenetic relationships (Miya et al., 2003; Boore, 2006). In this study, the mitochondrial genome sequence of C. stigmatias was 17 134 bp, which was shorter than the sequence previously reported (Sun et al., 2015). This is due to the fact that there was repeat region in D-loop region of C. stigmatias previously reported. Some researchers have reported the COI sequence of C. stigmatias (Xing et al., 2018; Lu et al., 2016). These sequences were high homology with the COI sequences determined in this study, which showed significant difference with that in previous study. Therefore, C. stigmatias in previous study may have been misidentified as A. hexanema. The phylogenetic tree showed that the sequence of C. stigmatias clustered with most of Gobioidei. Phylogenetic analysis suggested that C. stigmatias had a close relationship with A. hexanema, which was consistent with the study result of morphological classification (Qu, 2018). The mitochondrial genome of C. stigmatias characterized in the present study would facilitate further studies on the genetic constitution of C. stigmatias population. It would also enrich essential information for investigating the biodiversity and conservation biology of C. stigmatias.
Boore J L. 2006. The use of genome-level characters for phylogenetic reconstruction. Trends in Ecology & Evolution, 21(8): 439–446
[2]
Burland T G. 2000. DNASTAR’s lasergene sequence analysis software. In: Misener S, Krawetz S A, eds. Bioinformatics Methods and Protocols. Totowa, NJ: Humana Press, 71–91
[3]
Chen Fenfang, Ma Hongyu, Ma Chunyan, et al. 2016. The complete mitochondrial genome sequence and gene organization of Amblychaeturichthys hexanema (Gobiidae: Amblychaeturichthys) with phylogenetic consideration. Mitochondrial DNA Part A, 27(6): 4687–4688. doi: 10.3109/19401736.2015.1106503
[4]
Cywinska A, Hunter F F, Hebert P D N. 2006. Identifying Canadian mosquito species through DNA barcodes. Medical and Veterinary Entomology, 20(4): 413–424. doi: 10.1111/j.1365-2915.2006.00653.x
[5]
East China Sea Fishery Research Institute of Chinese Academy of Fishery Sciences. 1990. The Fishes of Shanghai (in Chinese). Shanghai: Shanghai Scientific & Technical Publishers
[6]
Excoffier L, Laval G, Schneider S. 2005. Arlequin (version 3.0): an integrated software package for population genetics data analysis. Evolutionary Bioinformatics Online, 1: 47–50
[7]
Felsenstein J. 1985. Confidence limits on phylogenies: an approach using the bootstrap. Evolution, 39(4): 783–791. doi: 10.1111/j.1558-5646.1985.tb00420.x
[8]
Gao Tianxiang, Ji Dongping, Xiao Yongshuang, et al. 2011. Description and DNA barcoding of a new Sillago species, Sillago sinica (Perciformes: Sillaginidae), from coastal waters of China. Zoological Studies, 50(2): 254–263
[9]
Guo Enmian, Liu Yuan, Liu Jing, et al. 2010. DNA barcoding discriminates Pampus minor (Liu et al., 1998) from Pampus species. Chinese Journal of Oceanology and Limnology, 28(6): 1266–1274. doi: 10.1007/s00343-010-9917-1
[10]
Han Dongyan, Xue Ying, Ji Yupeng, et al. 2013. Feeding ecology of Amblychaeturichthys hexanema in Jiaozhou Bay, China. Chinese Journal of Applied Ecology (in Chinese), 24(5): 1446–1452
[11]
Hebert P D N, Cywinska A, Ball S L, et al. 2003a. Biological identifications through DNA barcodes. Proceedings of the Royal Society B: Biological Sciences, 270(1512): 313–321. doi: 10.1098/rspb.2002.2218
[12]
Hebert P D N, Ratnasingham S, Dewaard J R. 2003b. Barcoding animal life: cytochrome c oxidase subunit 1 divergences among closely related species. Proceedings of the Royal Society B: Biological Sciences, 270(Suppl 1): S96–S99
[13]
Inoue J G, Miya M, Tsukamoto K, et al. 2001. A mitogenomic perspective on the basal teleostean phylogeny: resolving higher-level relationships with longer DNA sequences. Molecular Phylogenetics and Evolution, 20(2): 275–285. doi: 10.1006/mpev.2001.0970
[14]
Jin Xiaoxiao, Wang Rixin, Xu Tianjun, et al. 2012. Complete mitochondrial genome of Oxuderces dentatus (Perciformes, Gobioidei). Mitochondrial DNA, 23(2): 142–144. doi: 10.3109/19401736.2012.660930
[15]
Lavoué S, Miya M, Saitoh K, Ishiguro N B, et al. 2007. Phylogenetic relationships among anchovies, sardines, herrings and their relatives (Clupeiformes), inferred from whole mitogenome sequences. Molecular Phylogenetics and Evolution, 43(3): 1096–1105. doi: 10.1016/j.ympev.2006.09.018
[16]
Li Yongzhen, Chen Guobao, Sun Dianrong. 2000. Analysis of the composition of fishes in the Pearl River estuarine waters. Journal of Fisheries of China (in Chinese), 24(4): 312–317
[17]
Liu Jinxian, Gao Tianxiang, Wu Shifang, et al. 2007. Pleistocene isolation in the Northwestern Pacific marginal seas and limited dispersal in a marine fish, Chelon haematocheilus (Temminck & Schlegel, 1845). Molecular Ecology, 16(2): 275–288
[18]
Liu Lianwei, Xu Qianghua, Chen Xinjun. 2012. Population genetic structure of Ommastrephes bartramii in the North Pacific Ocean based on the COI and Cytb gene sequences analysis. Journal of Fisheries of China (in Chinese), 36(11): 1675–1684. doi: 10.3724/SP.J.1231.2012.27955
[19]
Lu Zhichuang, Xu Shengyong, Song Na, et al. 2016. Analysis of the diet of finless porpoise (Neophocaena asiaeorientalis sunameri) based on prey morphological characters and DNA barcoding. Conservation Genetics Resources, 8(4): 523–531. doi: 10.1007/s12686-016-0575-2
[20]
Masaki M, Yukuto S, Fukunaga, et al. 2015. Analytical pipeline for DNA sequences amplified by mifish primers. Biological Journal of the Linnean Society, 73: 259–316
[21]
Mei Chun, Xu Binduo, Xue Ying, et al. 2010. Fish community structure and species diversity during autumn and winter in the central waters of Jiaozhou Bay. Journal of Fishery Sciences of China (in Chinese), 17(1): 110–118
[22]
Meng Kuankuan, Wang Jing, Zhang Chongliang, et al. 2017. The fishery biological characteristics of Chaeturichthys stigmatias in the Yellow River Estuary and its adjacent waters. Journal of Fishery Sciences of China (in Chinese), 24(5): 939–945. doi: 10.3724/SP.J.1118.2017.17083
[23]
Meusnier I, Singer G A C, Landry J F, et al. 2008. A universal DNA mini-barcode for biodiversity analysis. BMC Genomics, 9: 214. doi: 10.1186/1471-2164-9-214
[24]
Miya Masaki, Sato Yukuto, Fukunaga Tsukasa, et al. 2015. Analytical pipeline for DNA sequences amplified by MiFish primers. Biological Journal of the Linnean Society, 73: 259–316
[25]
Miya M, Satoh T P, Nishida M. 2005. The phylogenetic position of toadfishes (Order Batrachoidiformes) in the higher ray-finned fish as inferred from partitioned Bayesian analysis of 102 whole mitochondrial genome sequences. Biological Journal of the Linnean Society, 85(3): 289–306. doi: 10.1111/j.1095-8312.2005.00483.x
[26]
Miya M, Takeshima H, Endo H, et al. 2003. Major patterns of higher teleostean phylogenies: a new perspective based on 100 complete mitochondrial DNA sequences. Molecular Phylogenetics and Evolution, 26(1): 121–138. doi: 10.1016/S1055-7903(02)00332-9
[27]
Nelson J S, Grande T C, Wilson M V H. 2006. Fishes of the World. 4th ed. New York: John Wiley and Sons, 601
[28]
Pfenninger M, Nowak C, Kley C, et al. 2007. Utility of DNA taxonomy and barcoding for the inference of larval community structure in morphologically cryptic Chironomus (Diptera) species. Molecular Ecology, 16(9): 1957–1968. doi: 10.1111/j.1365-294X.2006.03136.x
[29]
Puckridge M, Andreakis N, Appleyard S A, et al. 2013. Cryptic diversity in flathead fishes (Scorpaeniformes: Platycephalidae) across the Indo-West Pacific uncovered by DNA barcoding. Molecular Ecology Resources, 13(1): 32–42. doi: 10.1111/1755-0998.12022
[30]
Qu Liyan. 2018. Phylogenetic analysis of 28 species of gobies in the East China Sea based on morphology, barcode and nuclear genes (in Chinese) [dissertation]. Shanghai: Shanghai Ocean University
[31]
Saitou N, Nei M. 1987. The neighbor-joining method: a new method for reconstructing phylogenetic trees. Molecular Biology and Evolution, 4(4): 406–425
[32]
Sambrook J, Fritsch E F, Maniatis T. 1989. Molecular Cloning: A Laboratory Manual. 2nd ed. Harbor, NY: Cold Spring Harbor Laboratory Press
[33]
Shokralla S, Hellberg R S, Handy S M, et al. 2015. A DNA mini-barcoding system for authentication of processed fish products. Scientific Reports, 5: 15894. doi: 10.1038/srep15894
[34]
Smith P J, McVeagh S M, Steinke D. 2008. DNA barcoding for the identification of smoked fish products. Journal of Fish Biology, 72(2): 464–471. doi: 10.1111/j.1095-8649.2007.01745.x
Suh K I, Hwang J M, Bae Y J, et al. 2019. Comprehensive DNA barcodes for species identification and discovery of cryptic diversity in mayfly larvae from South Korea: implications for freshwater ecosystem biomonitoring. Entomological Research, 49(1): 46–54. doi: 10.1111/1748-5967.12334
[37]
Sun Yuena, Wang Tao, Jin Xiaoxiao. 2015. Unusual features of control region and a novel NADH 6 genes in mitochondrial genome of the finespot goby, Chaeturichthys stigmatias (Perciformes, Gobiidae). Mitochondrial DNA, 26(5): 665–667. doi: 10.3109/19401736.2013.840598
[38]
Sun Peng, Yin Fei, Shi Zhaohong, et al. 2012. Phylogenetic relationships and population structure of Pampus in the South China Sea inferred from COI gene segments. Marine Sciences (in Chinese), 36(6): 15–21
[39]
Tamura K, Peterson D, Peterson N, et al. 2011. MEGA5: molecular evolutionary genetics analysis using maximum likelihood, evolutionary distance, and maximum parsimony methods. Molecular Biology and Evolution, 28(10): 2731–2739. doi: 10.1093/molbev/msr121
[40]
Wang Lijuan, Wu Zhihao, Liu Mengxia, et al. 2018. DNA barcoding of marine fish species from Rongcheng Bay, China. PeerJ, 6: e5013. doi: 10.7717/peerj.5013
[41]
Ward R D, Holmes B H, Yearsley G K. 2008. DNA barcoding reveals a likely second species of Asian sea bass (barramundi) (Lates calcarifer). Journal of Fish Biology, 72(2): 458–463. doi: 10.1111/j.1095-8649.2007.01703.x
[42]
Ward R D, Zemlak T S, Innes B H, et al. 2005. DNA barcoding Australia’s fish species. Philosophical Transactions of the Royal Society B: Biological Sciences, 360(1462): 1847–1857. doi: 10.1098/rstb.2005.1716
Wyman S K, Jansen R K, Boore J L. 2004. Automatic annotation of organellar genomes with DOGMA. Bioinformatics, 20(17): 3252–3255. doi: 10.1093/bioinformatics/bth352
[45]
Xing Bingpeng, Lin Heshan, Zhang Zhilan, et al. 2018. DNA barcoding for identification of fish species in the Taiwan Strait. PLoS One, 13(6): e0198109. doi: 10.1371/journal.pone.0198109
[46]
Yu Xin. 2014. Methodology and case studies of fish otolith morphology and microchemistry analysis in stock discrimination (in Chinese) [dissertation]. Qingdao: Institute of Oceanography of Chinese Academy of Sciences
[47]
Zemlak T S, Ward R D, Connell A D, et al. 2009. DNA barcoding reveals overlooked marine fishes. Molecular Ecology Resources, 9(S1): 237–242
Shike Gao, Yongqi Yao, Jinchi Wan, et al. Study on seasonal variations of Chaeturichthys stigmatias population resources and its environmental factors in marine ranching areas. Ocean & Coastal Management, 2024, 257: 107305. doi:10.1016/j.ocecoaman.2024.107305
2.
Jiaqiao Wang, Weiyi He, Hao Huang, et al. A Comprehensive Analysis of the Fowleria variegata (Valenciennes, 1832) Mitochondrial Genome and Its Phylogenetic Implications within the Family Apogonidae. Genes, 2023, 14(8): 1612. doi:10.3390/genes14081612
Figure 1. Neighbor-joining tree for COI haplotypes of A. hexanema and C. stigmatias. Bootstrap values of >70% (out of 1 000 replicates) are shown on the nodes.
Figure 2. Neighbor-joining tree for 12S rRNA haplotypes of A. hexanema and C. stigmatias.
Figure 3. The gene map of the complete mitochondrial genome of C. stigmatias. Genes encoded on the H-strand and L-strand are shown outside and inside the circular map of the mitogenome, respectively.
Figure 4. The phylogenetic analyses investigated using Neighbor-Joining based on nucleotide sequences of 13 concatenated protein-coding genes. Cyprinus carpio (GenBank: KP993139) was used as an outgroup. The black box represented sequences of C. stigmatias sequenced in this study.


 DownLoad:

 DownLoad:


 DownLoad: