Figure
1.
Sampling stations and depth distribution of study area.
| Citation: | Xiangyu Long, Rong Wan, Zengguang Li, Yiping Ren, Pengbo Song, Yongjun Tian, Binduo Xu, Ying Xue. Spatio-temporal distribution of Konosirus punctatus spawning and nursing ground in the South Yellow Sea[J]. Acta Oceanologica Sinica, 2021, 40(8): 133-144. doi: 10.1007/s13131-021-1790-6

|
Annual aggregation for reproducing and breeding have been found in most marine bony fishes, which were known as spawning ground and nursing ground (Ciannelli et al., 2014). Spawning ground always limits in specific areas, with favorable environmental conditions for eggs hatch, and for offspring access to nursery habitat (Lelièvre et al., 2014; Weber et al., 2015). As key periods of fish early life stage, the processes were vulnerable to fishing pressure (Van Overzee and Rijnsdorp, 2014) and other anthropogenic activities (Stelzenmüller et al., 2010). Thus, there is an increasing need to monitor and protect spawning and nursing ground, to understand recruitment mechanisms profoundly and utilize fishery resources sustainably (Sassa et al., 2008; Gonzalez-Irusta and Wright, 2017).
To identify the distribution of spawning ground and nursing ground, species distribution models (SDMs) are widely used to analyze environmental influences on species distribution (Elith and Leathwick, 2009). As a method of SDMs, generalized additive model (GAM) can be used to analyze the nonlinear relationship between dependent variable and multiple independent variables (Stone, 1985; Hastie and Tibshirani, 1990). GAM is well applied, especially in fishery fields (Zhu et al., 2012; Zhao et al., 2013; Yang et al., 2017). However, there are a great many of zero values in fishery survey data due to limited factors, such as gear selectivity, sampling method and fish assemblage. It will affect the accuracy of log-normal distribution of GAM (Li, 2013). In order to process the data, Tweedie (1984) proposed a special distribution regularity called Tweedie distribution, which was suitable for characterizing nonnegative and skewed random variable. Shono (2008) regarded Tweedie distribution as better statistical performance than other models through catch per unit effort (CPUE) analyses of zero-catch data. Since then, Tweedie-GAM were widely used in fisheries, to fit zero-inflation fishing data and environmental factors. Wang et al (2017) analyzed the spatial-temporal variation of CPUE of Pseudocarcharias kamoharai and its relationship with environmental factors based on the Tweedie-GAM. Zhang et al (2019) utilized Tweedie-GAM to examine the relationship between the distribution of Larimichthys polyactis and environment factors in different seasons and ontogenetic stages. Wan et al (2020) predicted distribution and environmental characteristics of Scomberomorus niphonius by using Tweedie-GAM. The feasibility and effectiveness of Tweedie-GAM has been well proved.
Konosirus punctatus belongs to Clupeiformes, Clupeidae. Inhabiting offshore and inner bay, K. punctatus is a kind of euryhaline fish, and sometimes it can enter freshwater. Before juvenile stage, it feeds on microzooplankton like rotifer and copepod nauplius (Ying, 2011). It is a kind of economic fish in China, which distributed widely in the China seas, as well as the coast of Japan and Korea (Chen, 1975). In recent years, small pelagic fishes represented by K. punctatus increased gradually in the proportion of catch and became the major component of catch (Jin and Tang, 1998; Guo et al., 1999; Sun et al., 1999). It has replaced traditional economic species (e.g., L. polyactis and S. niphonius) which reduced due to seriously overfishing (Li, 2013; Wang, 2013).
Since K. punctatus played a significant role in fishery production, numerous studies have carried out, along the coast of Japan (Kong et al., 2004; Ishitobi et al., 2005), Korea (Gwak et al., 2015; Myoung and Kim, 2016) and China (Li et al., 2016, 2017). Chen (1975) found that a stock of K. punctatus spawned along south coast of Shandong Province from April, and migrated to the wintering ground of the Yellow Sea after August. Li et al. (2015) analyzed ichthyoplankton assemblages and environmental factors collected from Haizhou Bay and its adjacent coastal area, and illustrated that K. punctatus ichthyoplankton occurred at depth <20 m. Thus, this study focused on the coastal area of the South Yellow Sea (SYS) from 31.7°N to 37.0°N from April to August, covering the most of K. punctatus early life stages, both spatially and temporally.
The study area is an important spawning ground and nursing ground for many economic species (Tang and Ye, 1990; Lv et al., 2011). Covering the Qinghai fishing ground, the Haizhou Bay fishing ground and the Lüsi fishing ground, it has abundant fishery resources. The area is also characterized by unique current and topography. The Yellow Sea Coastal Current (YSCC) flows from north to south all year round (Guan, 1984, 2002; Lin, 2004). When it spreads to the area of radiate sand ridges in the Subei shoal, water slows down and mainly flows to the east, where are rich in nutrients and plankton (Zhang et al., 2016; He, 2016). Besides, the Qingdao Cold Water Mass (QDCWM) occurred in April and disappeared in June, which was located in northern study area (35.0°–36.5°N, 120.5°–123.0°E). It also affected hydrology distribution (Jin et al., 2017; Huang et al., 2019).
Despite several research focused on distributions of K. punctatus, a contemporary study on distribution of K. punctatus early life stage is lacking. The present study attempted to explore spatial and temporal distributions of K. punctatus spawning ground and nursing ground in the SYS. The GAM with Tweedie distribution was used to analyze the relationships between K. punctatus ichthyoplankton and environmental factors, and predict distributions of K. punctatus spawning ground and nursing ground, based on samplings collected in 6 months during 2014–2017. The results were classified into different groups, to compare differences in various years and months. The study would perfect the dominant economic species along the coast of China and provide reference of conservation and exploitation for K. punctatus.
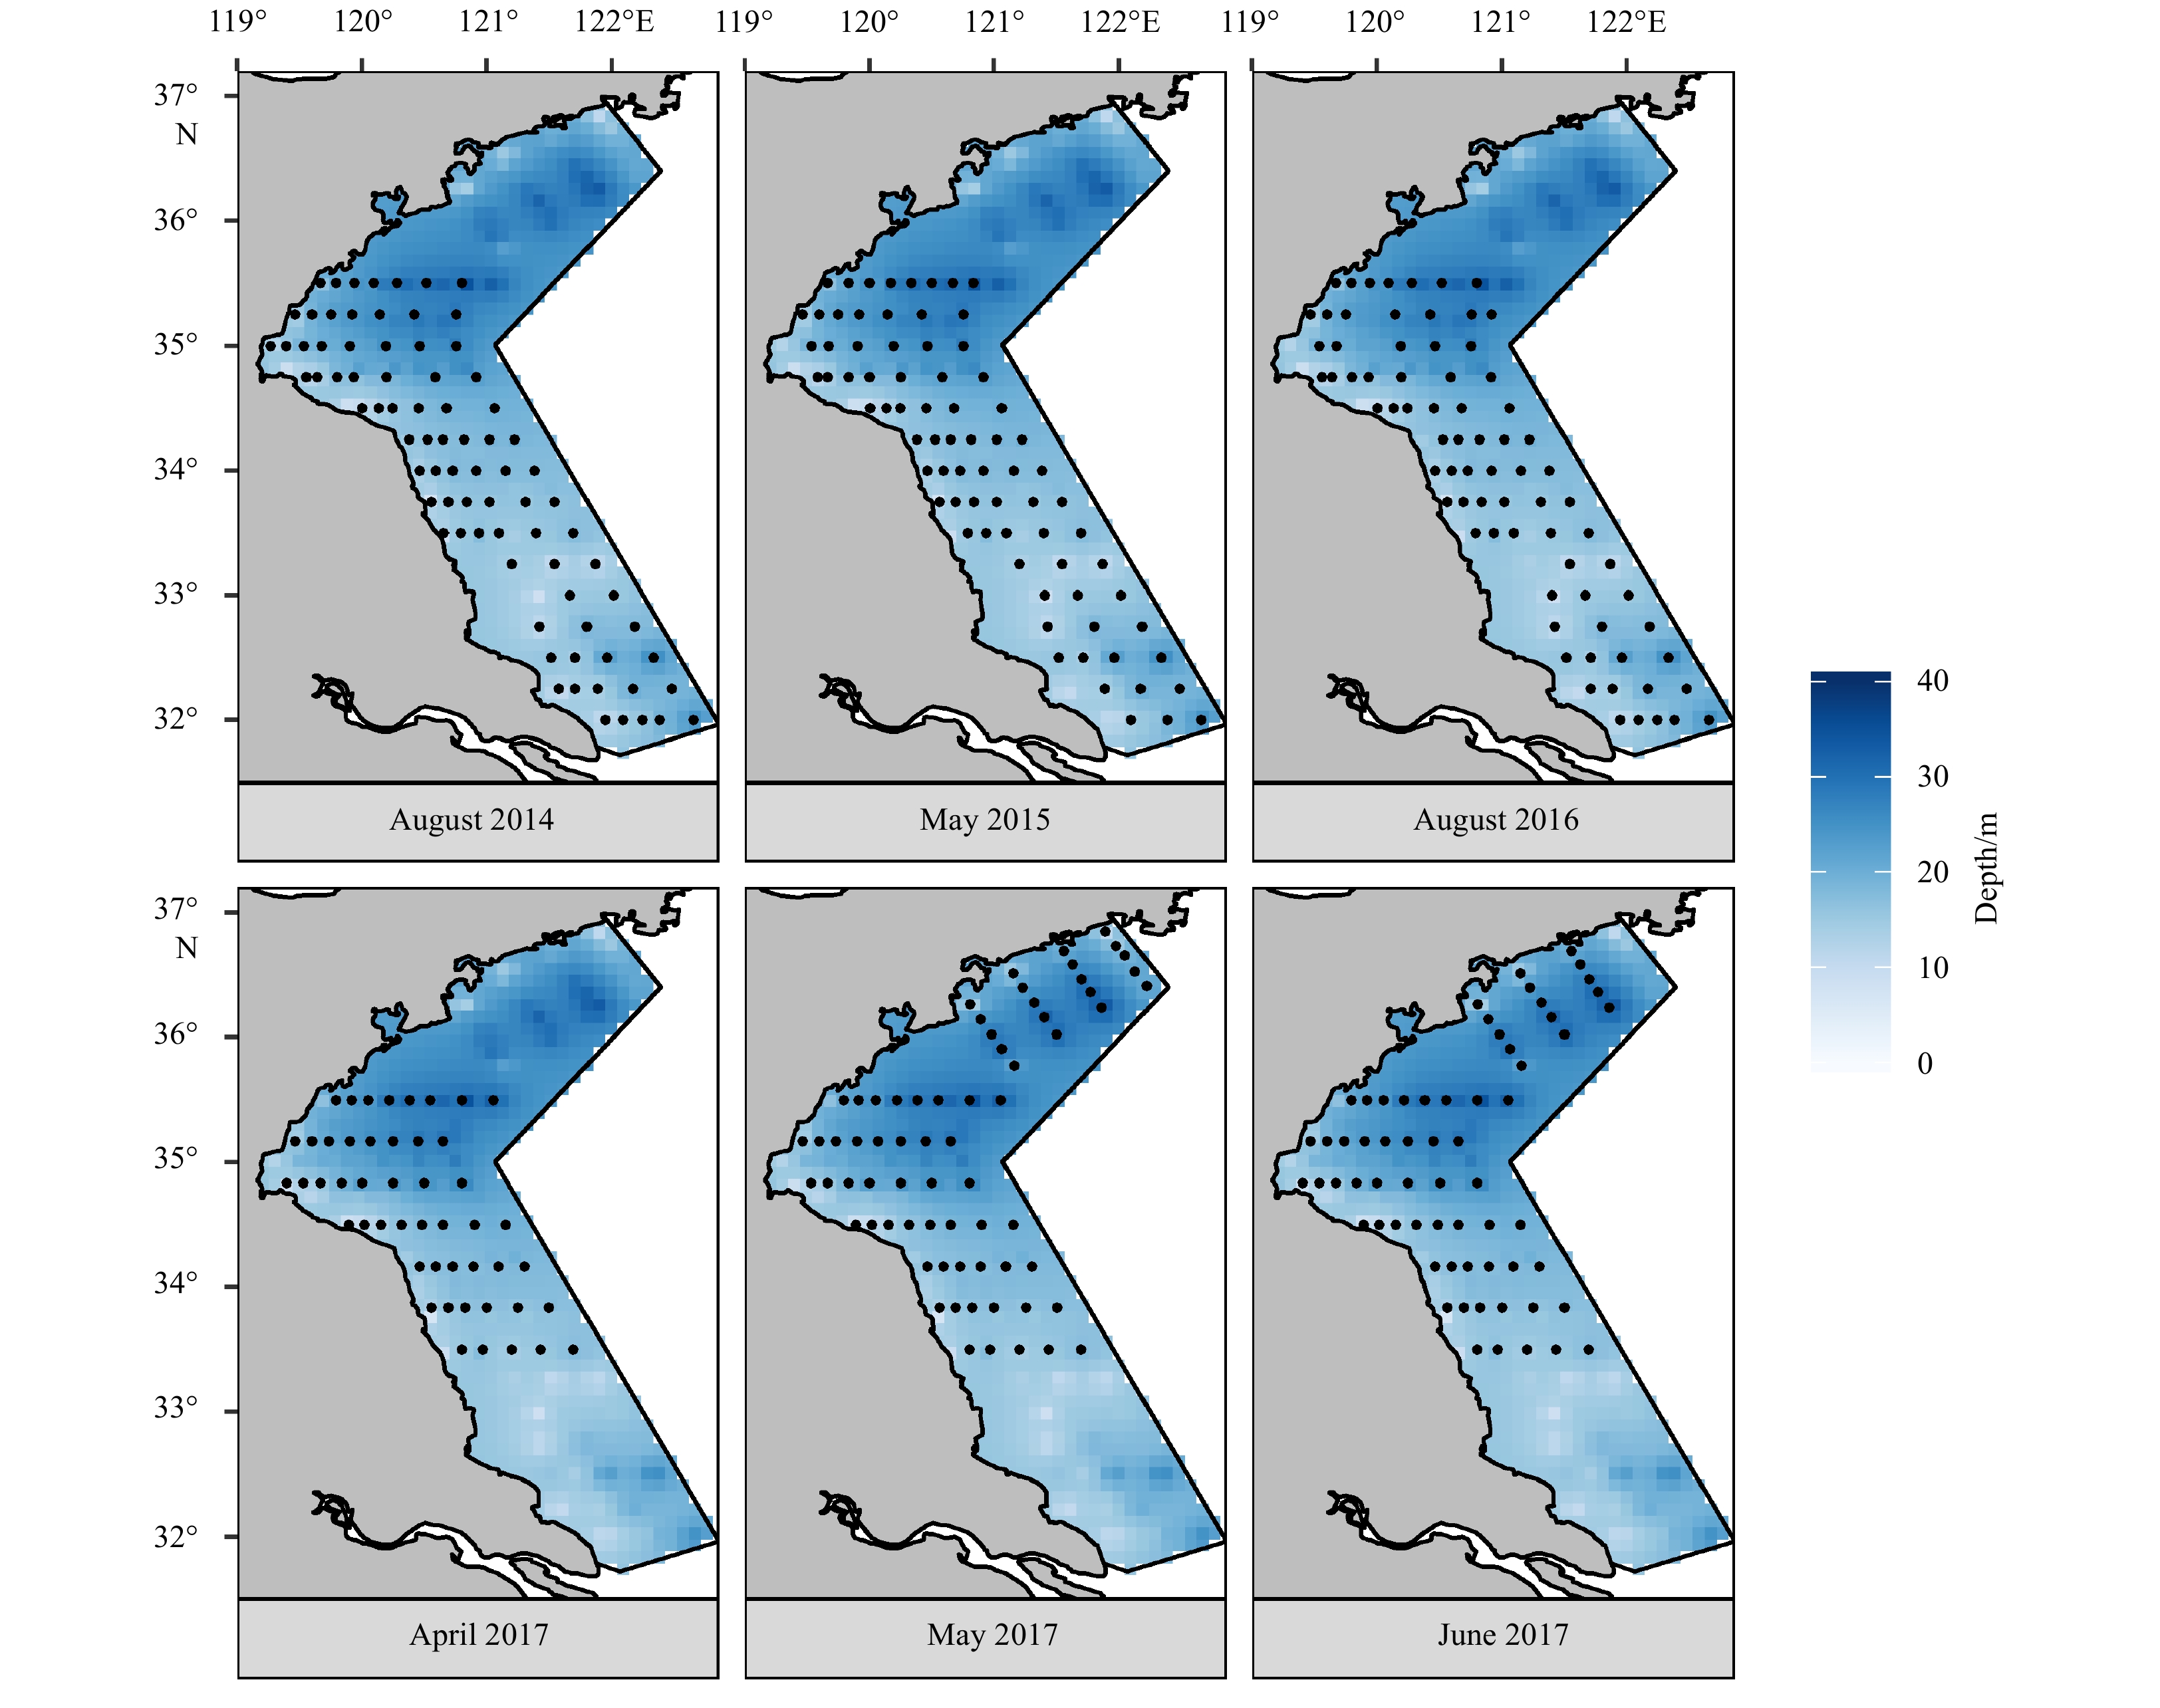
Previous study found that K. punctatus eggs and larvae occurred along the coast with depths of <20 m from April to August (Chen, 1975; Li et al., 2015). Thus, this study focused on the coastal area of the SYS (from 31.7°N to 37.0°N) from April to August, covering the whole period of K. punctatus early life stage, both spatially and temporally. Six surveys were carried out in August 2014, May 2015, August 2016, April, May and June 2017, respectively. During each survey, two research vessels were conducted to sampling eggs, larvae and environment factors. Differences in number and location of stations in each month were due to modification based on survey design and sea conditions (Fig. 1, Table 1).
| Survey | Month | Stations | Number collected (frequency of occurrence) | |
| eggs | larvae | |||
| 1 | August 2014 | 81 | 7 (2) | 111 (10) |
| 2 | May 2015 | 90 | 403 (9) | 46 (6) |
| 3 | August 2016 | 75 | 68 (3) | 36 (9) |
| 4 | April 2017 | 49 | 1 864 (4) | 0 (0) |
| 5 | May 2017 | 68 | 1 355 (17) | 9 (1) |
| 6 | June 2017 | 64 | 1 009 (13) | 38 (2) |
| Total | 427 | 4 706 (48) | 240 (28) | |
 DownLoad:
CSV
DownLoad:
CSV
Eggs and larvae were collected using plankton nets with 80 cm mouth diameter and 505 μm mesh size, equipped with a general oceanic flowmeter at the center of net mouth. Once sampling, the net was dragged horizontally along sea surface for 10 min, with a constant speed of 2–3 knots. Samples were preserved in 5% buffered formalin in seawater immediately. Once in the laboratory, eggs and larvae were classified, identified and counted to the lowest taxonomic level using a binocular microscope based on existing literature (Zhang et al., 1985; Okiyama, 1988; Shao et al., 2001). Besides, environmental factors, as temperature (°C), salinity and depth (m), were also recorded by CTD of RBR-XR-420 at each station.
According to the references, K. punctatus eggs and larvae were easy to identify. The fertilized eggs are transparent with the diameter of 1.10–1.60 mm. They were characterized by a small oil globule and reticular cleft yolk. Larvae were identified by counting the number of sarcomere and fin ray. They had 50–57 pairs of sarcomeres, with 17–19 dorsal fins, 22–25 anal fins, 31 tail fins, 15–16 pectoral fins and 7–8 ventral fins. Besides, morphological figures in references also contributed to identification (Zhang et al., 1985; Okiyama, 1988; Shao et al., 2001).
The data of K. punctatus eggs and larvae were standardized to fish egg density (FED) and fish larvae density (FLD), respectively. The FED and FLD were calculated by: ρ=A/V, where ρ is FED or FLD, A denotes the number of eggs and larvae collected, V is flow volume. The flow volume was calculated according to the revolution of flowmeter, which V=k×N×πr2, where k is correction factor (k=0.3, here), N is the revolution of flowmeter, r denotes the radius of net mouth.
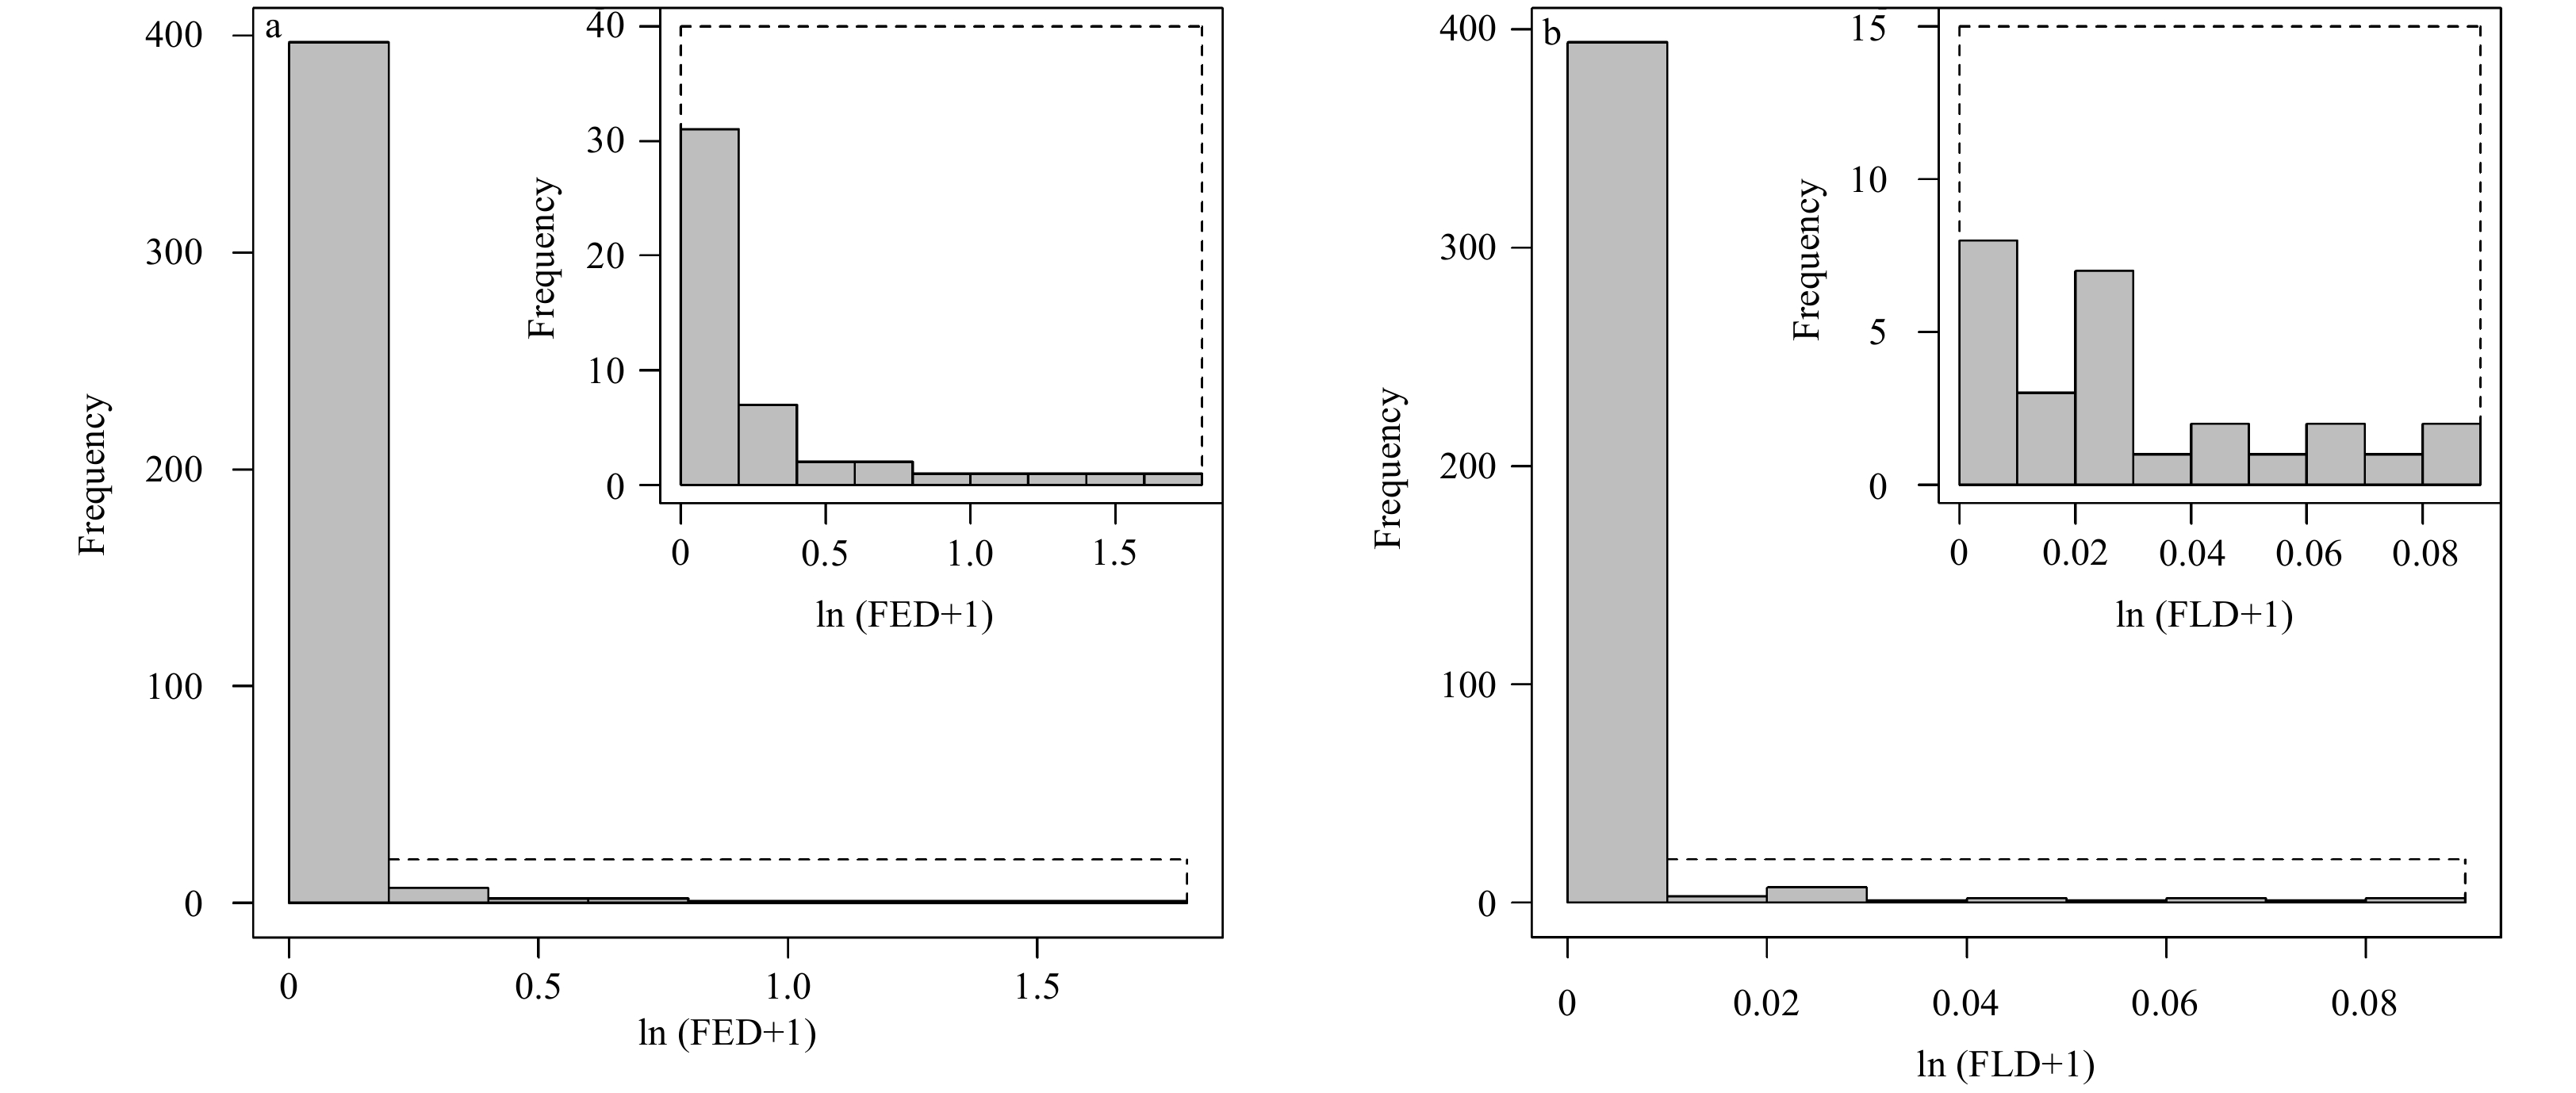
Figure 2 showed frequency distribution of log-transformed FED and FLD. It illustrated that a great number of zero values occurred in both FED and FLD (88.62% and 93.46%, respectively), leading to highly left-skewed of the frequency distribution. Consequently, Tweedie-GAM with a log-link was used in regression analysis, which can process data with plenty of zero values (Wang et al., 2017). The probability density function of the Tweedie distribution was expressed in the following formula:

| $$ f\left(y:\mu,{\sigma }^{2},p\right)=a(y:{\sigma }^{2},p)\mathrm{e}\mathrm{x}\mathrm{p}\left[-\frac{1}{2{\sigma }^{2}}d(y:\mu,p)\right]{\rm{,}} $$ | (1) |
where
The general expression of GAM is:
| $$ g\left(\rho \right)={\beta }_{0}+\sum\limits_{i=1}^{k}{f}_{i}\left({x}_{i}\right)+\varepsilon {\rm{,}} $$ | (2) |
where g(ρ) is the log-link function, β0 denotes the constant intercept term, xi denotes the explanatory variable and fi(xi) is a smooth function that can be used to describe the relationship between g(ρ) and xi, ε is the error term according with normal distribution. In this study, Tweedie-GAM was used to model FED and FLD with explanatory variables: longitude and latitude (Lon &Lat), sea surface temperature (SST), sea surface salinity (SSS) and depth (Dep). Year and month were treated as category variables.
Optimal models were identified by using a stepwise forward selection and judging from the Akaike information criterion (AIC) score (Akaike, 1974). The model with the lowest AIC score was the best model. Deviance explained measured the explanatory ability of models. In order to improve the accuracy of models, data of April was removed from FLD models, because there was no larva in April (Table 1). Moreover, this study focused on distributions of K. punctatus eggs and larvae, which meant Lon&Lat was important and indispensable. Therefore, this explanatory variable was subjectively fixed in regression processes. Based on optimal models, the effects of each environmental factor were also quantified, as well as their suitable ranges on eggs and larvae.
In order to analyze the potential distribution of K. punctatus spawning ground and nursing ground, a total of 1 000 quadrilateral grids were created for model prediction over the study area. Missing value of environmental factors in each grid were interpolated by inverse distance weighted (IDW), which was well performed for resource distribution in the Yellow Sea (Chen, 2017). Observations and predictions were ln(1 000x) transformed and compared with each other, to test accuracy of model prediction. The spatial-temporal distribution in different years and months were compared and analyzed with available data. All the processes of analysis were carried out with R software (version 3.6.0), using packages “mgcv” for GAM, “ggplot2” for figures and maps.
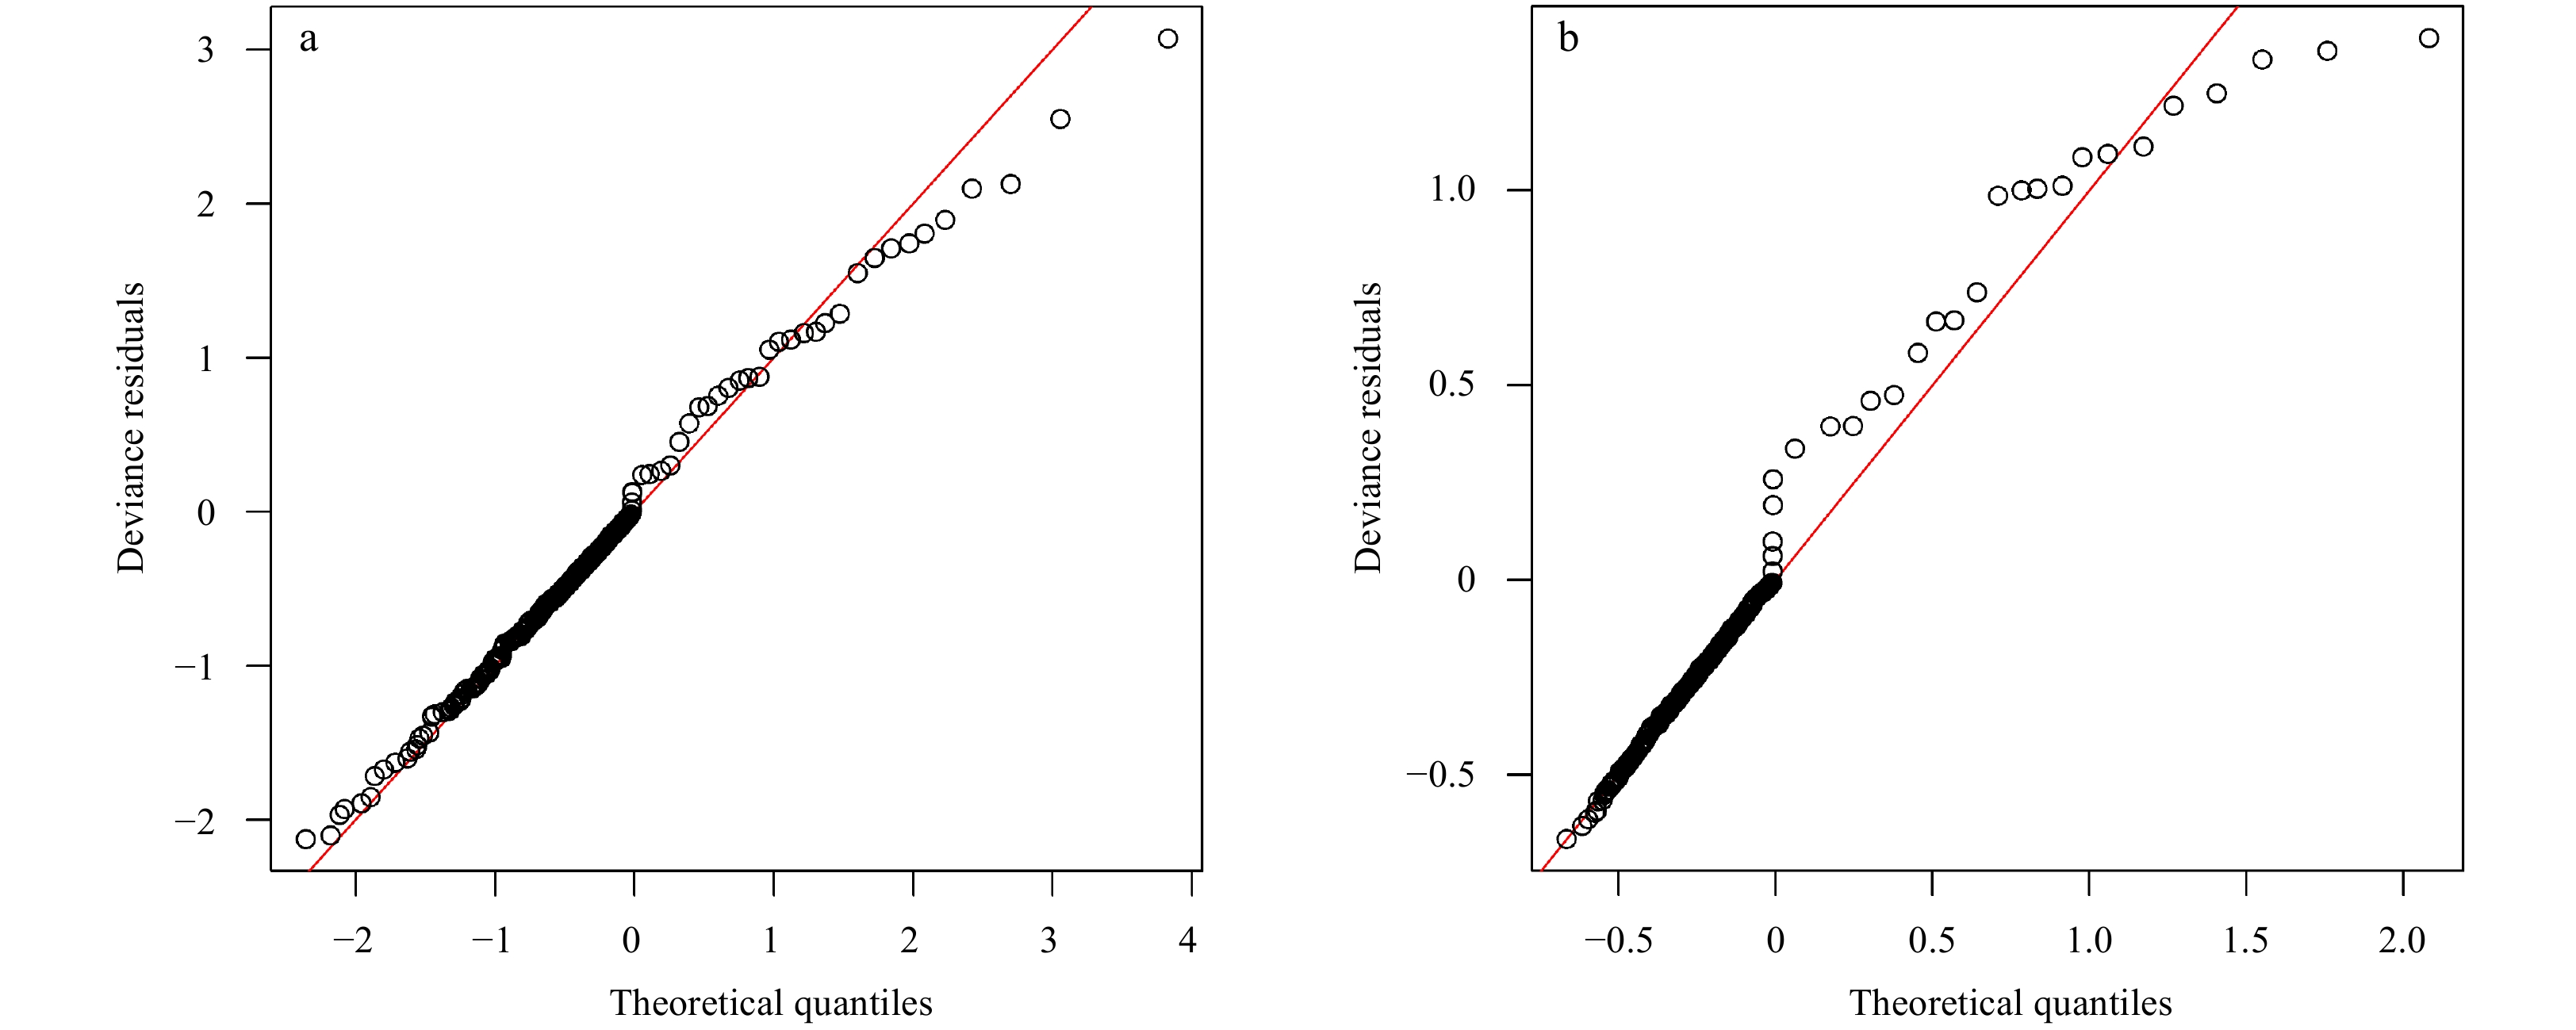
The variance inflation factor (VIF) was used to check collinearity of environmental factors, and factors should be removed if its VIF value were larger than 4 (Dormann et al., 2013; Li et al., 2018). The results showed that these variables did not exist collinearity (VIF of Dep, SST and SSS were 1.35, 1.11 and 1.47, respectively). Table 2 showed that the No.6 model of FED had the lower AIC score and higher deviance explained than that of other FED models, which meant it was the optimal GAM for FED. The results also demonstrated that FLD was related to Lon & Lat and SSS. By comparing all models, the No.1 model of FLD had the lowest AIC score, which was selected as the best model. Figure 3 showed the quantile-quantile (QQ) plots based on the value of deviance and standard residual in optimal models for FED and FLD. The two optimal models fitted well for most of the data. However, there was still deviation for higher density. According to the optimal models, the effective degrees of freedom for Lon & Lat, Dep, SST and SSS were 8.04, 3.31, 5.01 and 3.02, respectively. The effective degrees of freedom for Lon & Lat and SSS were 6.15 and 2.51, respectively.
| No. | Cumulative model factors | Deviance explained/% | AIC score | |
| FED | 1 | + (Lon & Lat) + (SSS) | 64.8 | 363.937 |
| 2 | + (Lon & Lat) + (SST) | 65.9 | 365.299 | |
| 3 | + (Lon & Lat) + (Dep) | 60.0 | 371.915 | |
| 4 | + (Lon & Lat) + (SSS) + (SST) | 71.9 | 355.896 | |
| 5 | + (Lon & Lat) + (SSS) + (Dep) | 66.6 | 360.939 | |
| 6 | + (Lon & Lat) + (SSS) + (SST) + (Dep) | 74.5 | 347.728 | |
| FLD | 1 | + (Lon & Lat) + (SSS) | 33.4 | 252.276 |
| 2 | + (Lon & Lat) + (Dep) | 31.6 | 254.144 | |
| 3 | + (Lon & Lat) + (SST) | 33.5 | 254.201 | |
| 4 | + (Lon & Lat) + (SSS) + (Dep) | 34.8 | 255.187 | |
| 5 | + (Lon & Lat) + (SSS) + (SST) | 35.9 | 256.069 | |
| 6 | + (Lon & Lat) + (SSS) + (Dep) + (SST) | 37.0 | 259.633 |
DownLoad:
CSV

The optimal GAMs of FED and FLD were as follow:
| $$\begin{split} g\left({{\rm{FED}}} \right) =& {\beta _0} \!+\! {\rm{year}} \!+\! {\rm{month}} \!+\! s\left({{\rm{SST}}} \right) \!+\! s\left({{\rm{Dep}}} \right) + s\left({{\rm{Lon}}\;\&\; {\rm{Lat}}} \right) +\\ & s\left({{\rm{SSS}}} \right) + \varepsilon{\rm{,}} \end{split}$$ | (3) |
| $$g\left({{\rm{FLD}}} \right) = {\beta _0} + {\rm{year}} + {\rm{month}} + s\left({{\rm{Lon}}\;\&\; {\rm{Lat}}} \right) + s\left({{\rm{SSS}}} \right) + \varepsilon .$$ | (4) |
where s is the spline smoothing function.
The relationship between FED and Lon & Lat demonstrated that Lon & Lat had positive effect on density of K. punctatus eggs in the area from 33.0°N to 37.0°N, and the effect became stronger with latitude increased. While density of K. punctatus larvae were positive correlated with Lon & Lat in the area from 31.7°N to 35.5°N, and the effect became stronger with latitude decreased (Fig. 4).

According to the optimal GAM of FED, the 3 environmental factors were all significant variables. The relationships between FED and environmental factors indicated that K. punctatus eggs were more abundant in the areas with intermediate depth and SST, whose suitable ranges were 9–23 m and 19–26°C, respectively. The effect of SSS suggested that K. punctatus eggs were more abundant between 25–30. While for K. punctatus larvae, SSS was the only environmental factor selected, which showed positive effect in the range of 29–31. The results of category variables revealed that FED were higher in 2015 and 2017, FLD were higher in 2014 and 2016 (Fig. 5).

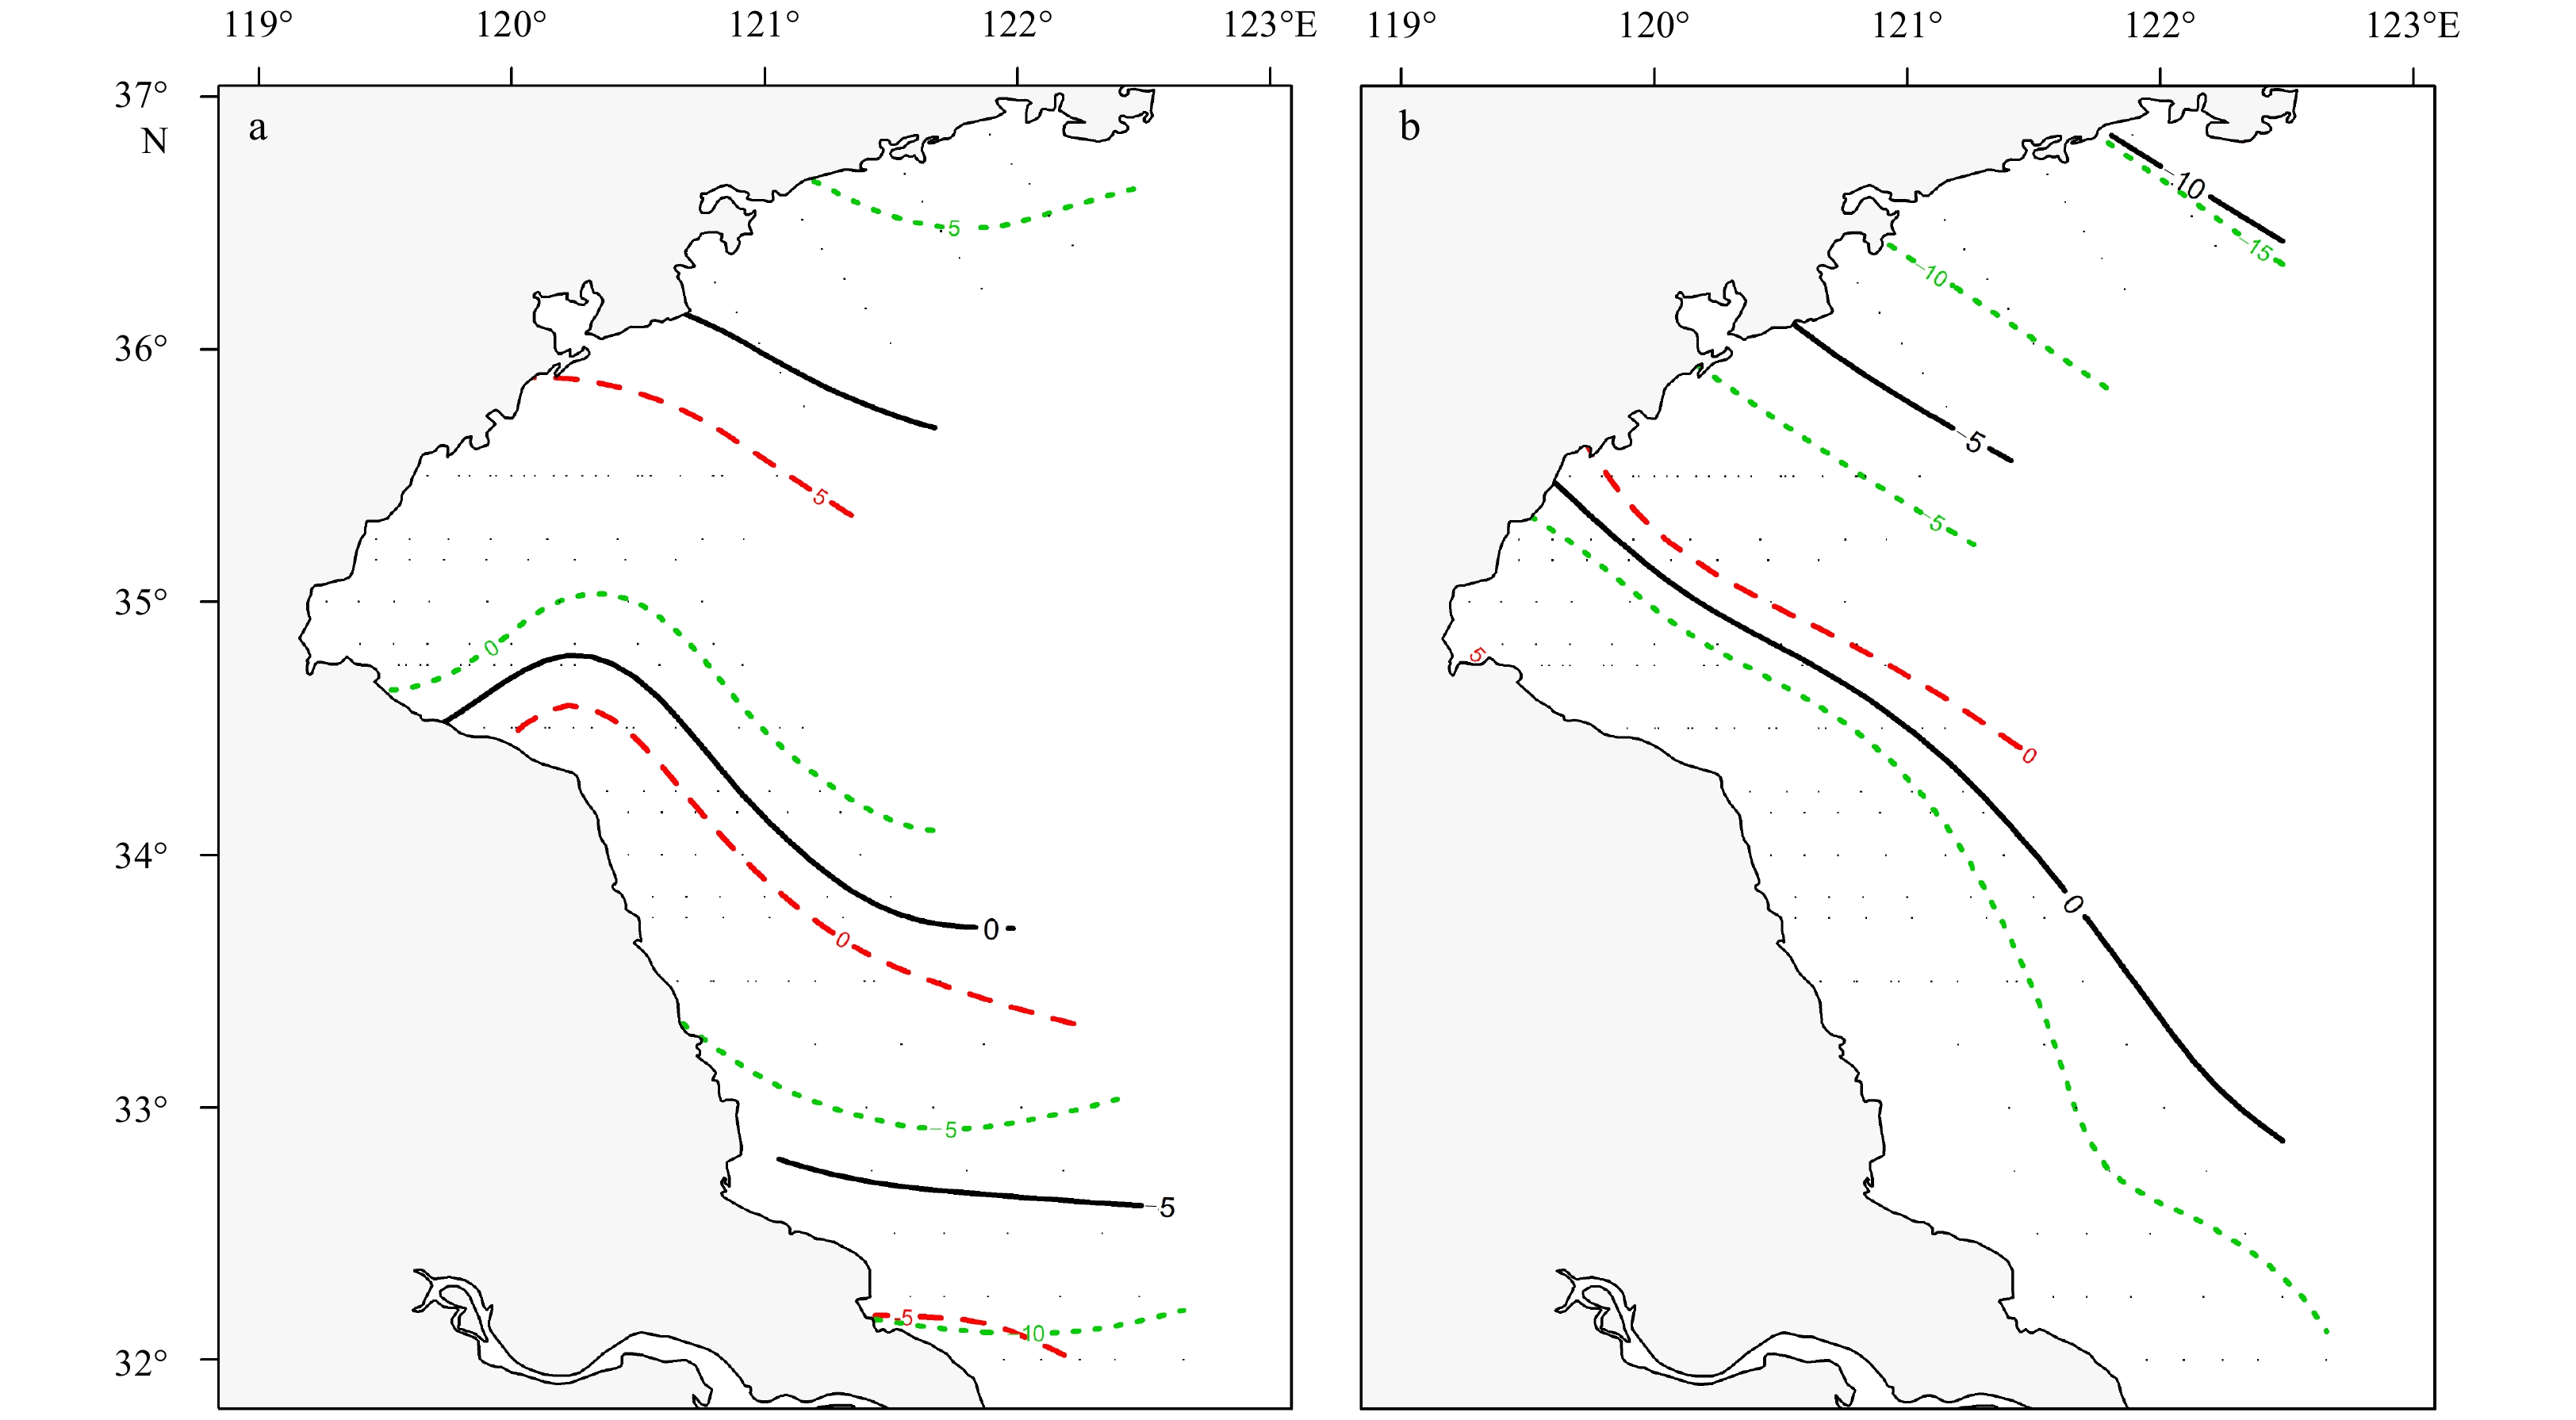
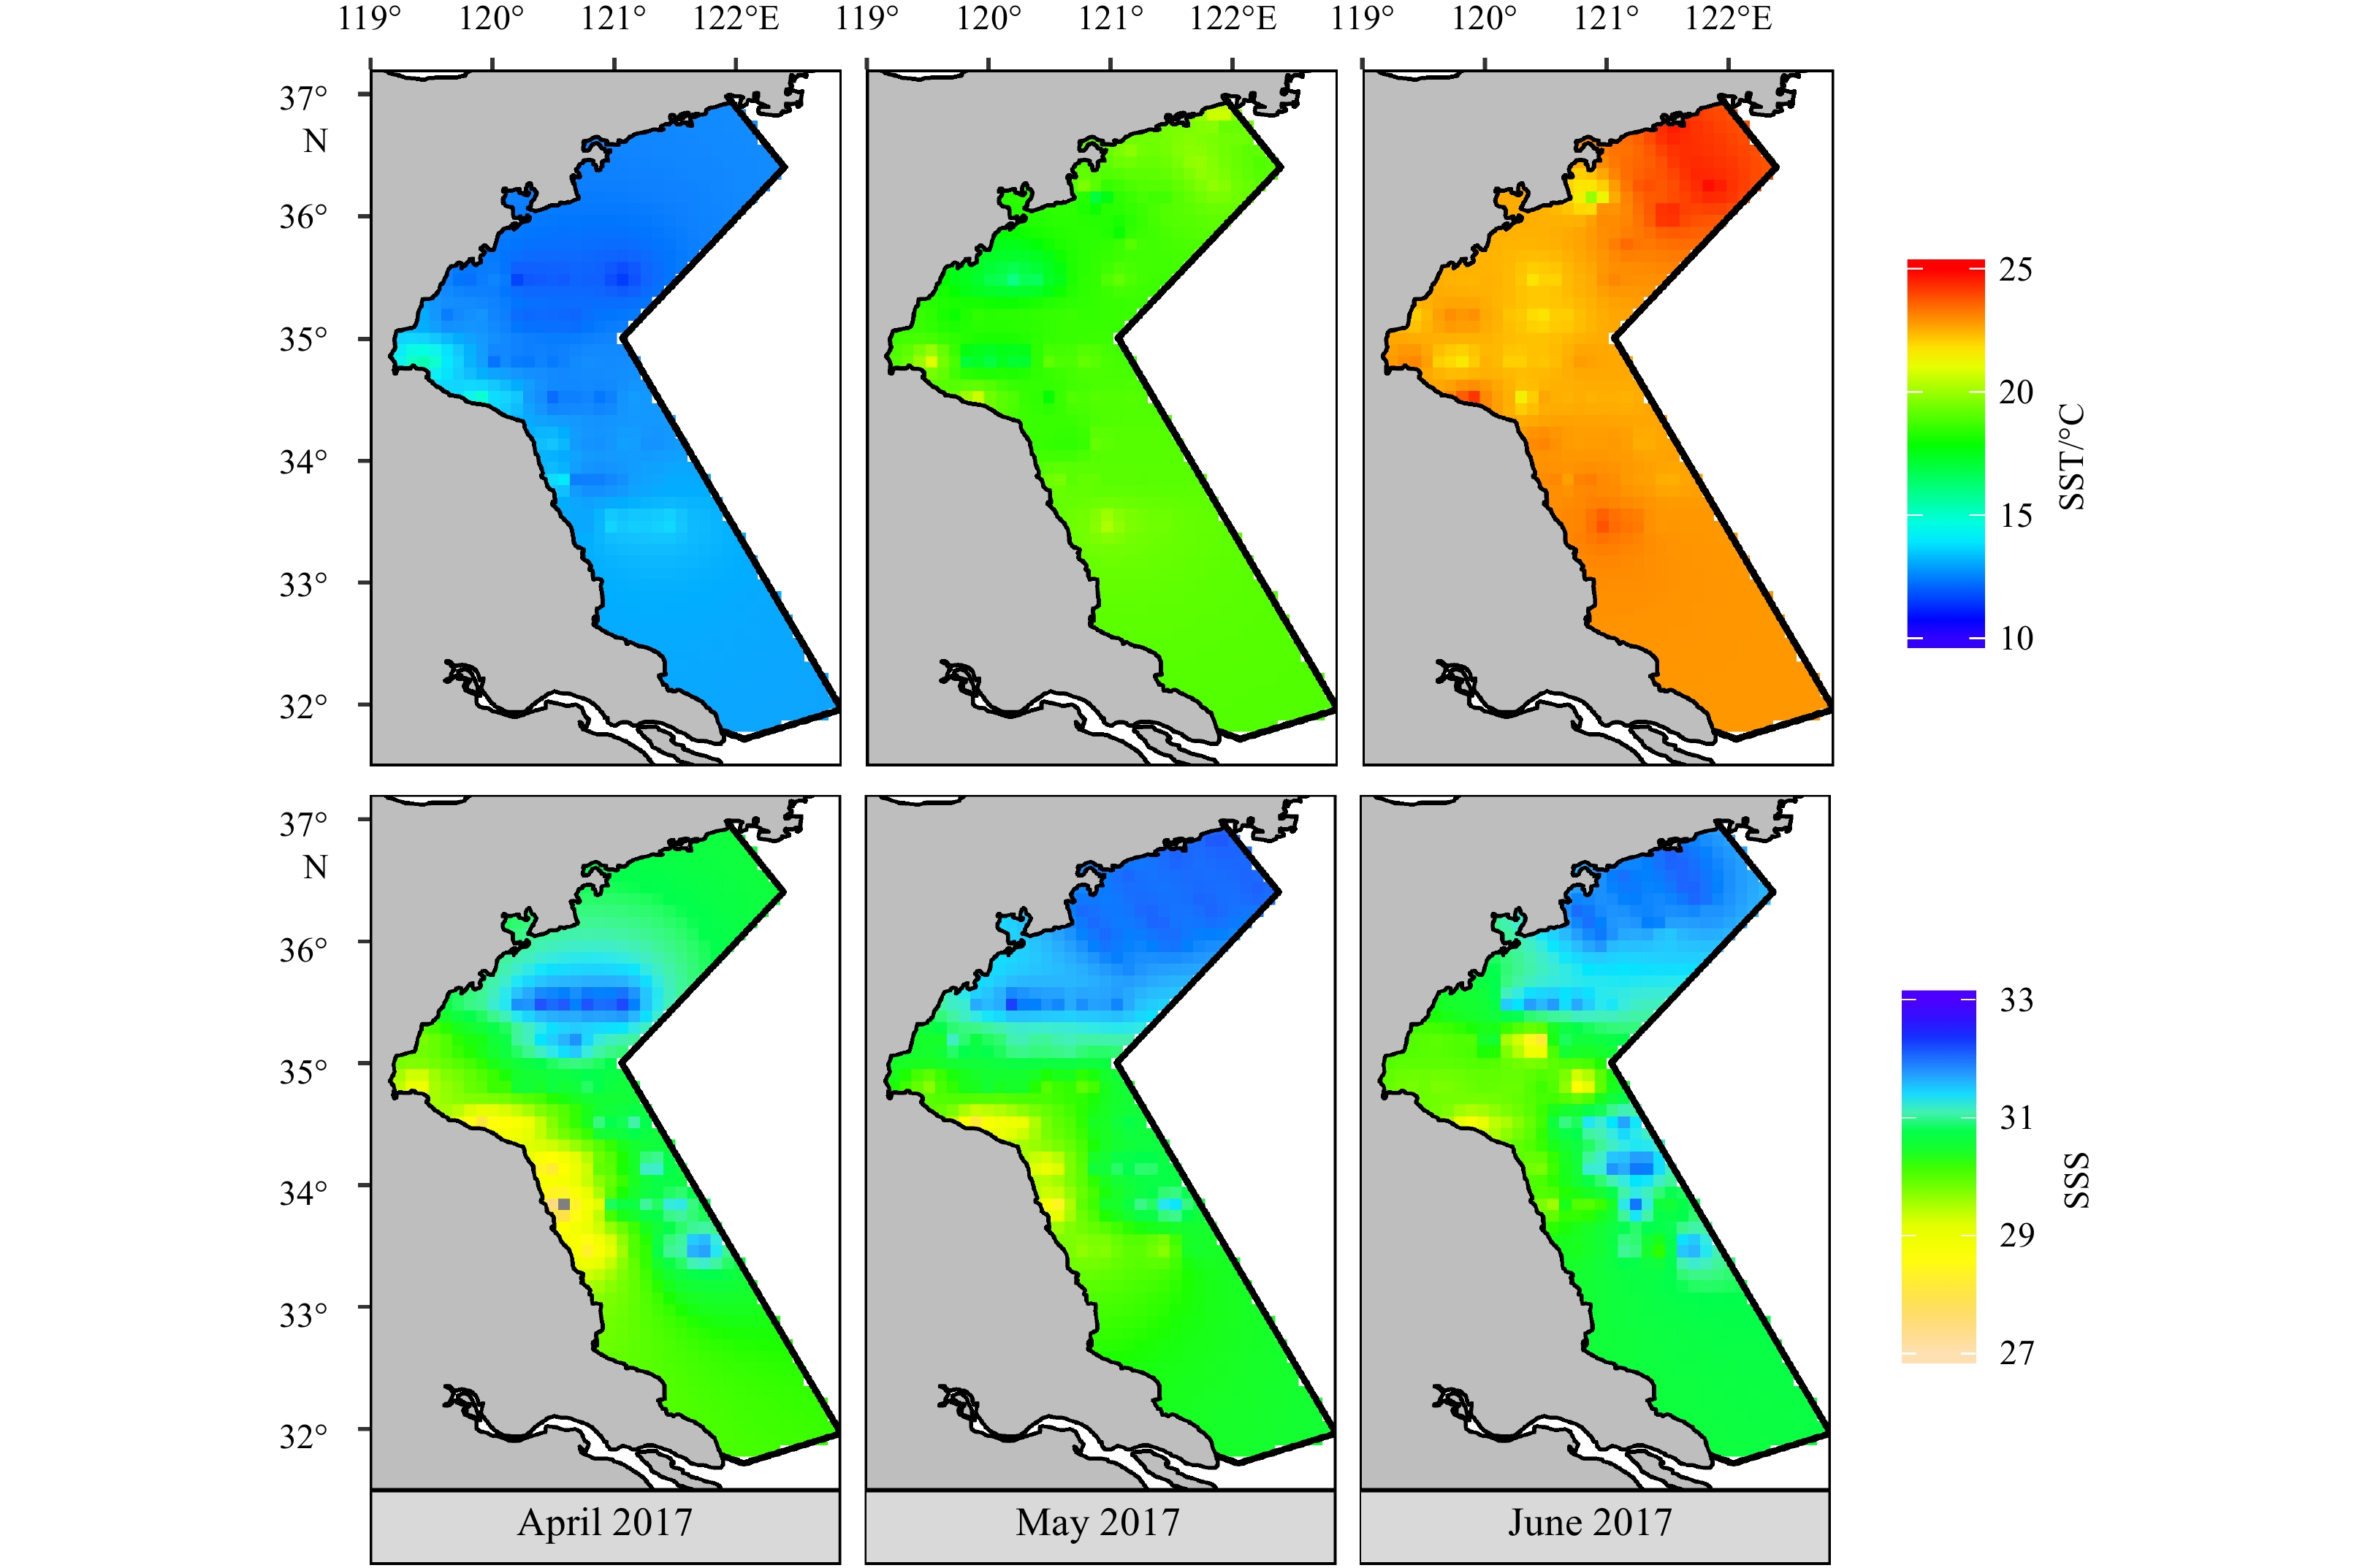
The oceanographic scenario clearly demonstrated that SST increased yearly, and SSS had no significant change with different years (Fig. 6). Their spatial distributions were strongly related to the region. High temperature and low salinity were distributed inside the Haizhou Bay and along south coast. Whereas low temperature and high salinity were occurred in the area of the QDCWM. The regional differences were also appeared in monthly group (Fig. 7). The region with high temperature and high salinity were found in the north of study area from May to June. Besides, SST showed a great increase from April to June in 2017.


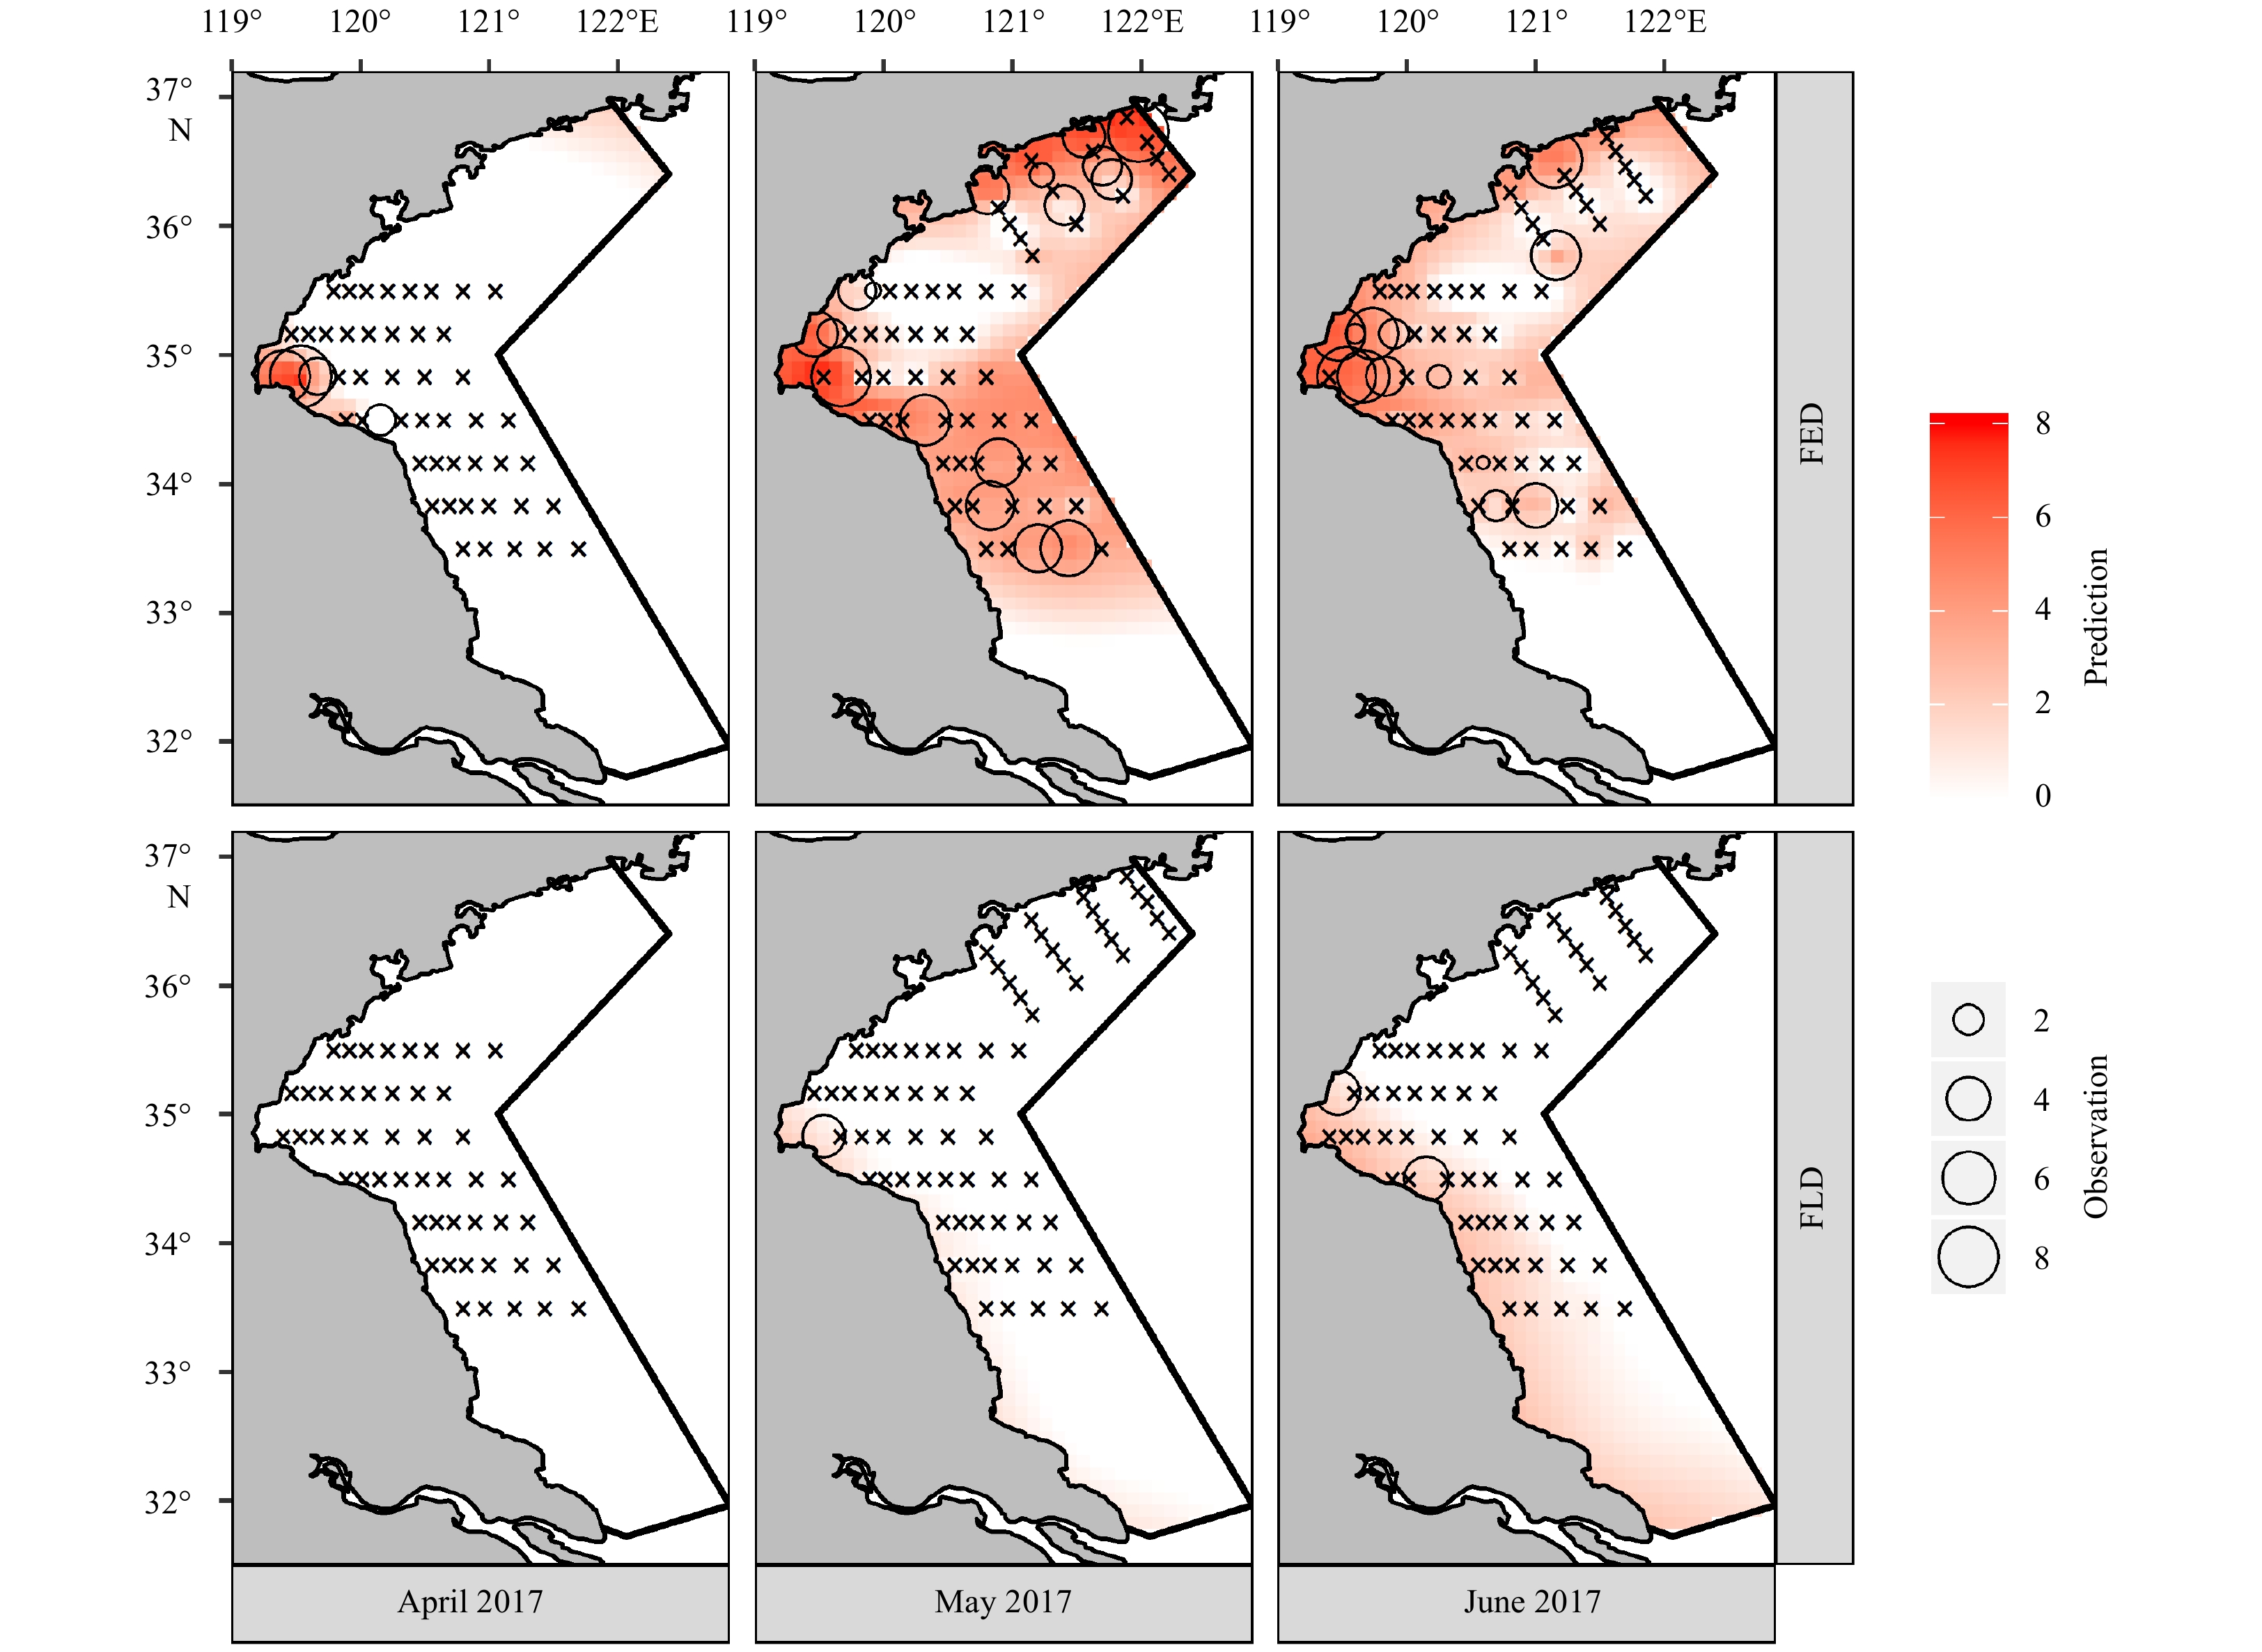
The distribution results were divided into monthly group (May 2015 and May 2017, August 2014 and August 2016) and yearly group (April, May and June 2017), to explore variations of K. punctatus eggs and larvae in different months and years (Figs 8 and 9). The results indicated that predictions agreed well with observations. The spawning ground were mainly distributed from 33.0°N to 37.0°N. The area of the QDCWM divided spawning site into north and south part. The nursing ground was in the area from 31.7°N to 35.5°N, which was more southward than the spawning area (Figs 8 and 9).


In spring, K. punctatus eggs of 2017 had larger abundance and wider domain than those of 2015, both of which were mainly distributed in the central and northern area (33.0–37.0°N). While K. punctatus larvae of 2017 were smaller than that of 2015, both in quantity and area. Larvae occurred along the coast of central and southern area (31.7°–35.0°N) (Fig. 8). The situation was different in summer, in which K. punctatus adults spawned mostly in the north and rarely in the center. And larvae appeared along seaside from 31.7°N to 35.5°N (Fig. 8). Compared with that in 2016, there were less eggs but more larvae in 2014 (Table 1). It was obvious that K. punctatus adults preferred to lay eggs in spring rather than in summer. There were more larvae in summer, comparing with that in spring. They were both located along coastal area (Fig. 8).
The results demonstrated that K. punctatus eggs were mainly distributed inside Haizhou Bay, and few appeared at the northern area in April. It expended to wider area in May and almost the whole area from 33.0°N to 37.0°N in June. While K. punctatus larvae did not appear in April. Only few larvae occurred inside the Haizhou Bay in May. But in June, there were more larvae distributing in a wider area, which was along coast of central and southern area (Fig. 9). K. punctatus eggs had the highest abundance in April, and decreased gradually in May and June. While K. punctatus larvae were more abundant in June than in May, and it did not occur in April (Table 1). No matter on abundance or on area size, eggs largely outweighed larvae.
In the present study, the Tweedie-GAM was used to analyze the relationships between K. punctatus ichthyoplankton and environmental factors based on samples from 2014 to 2017, and predict the distribution of spawning site and nursing ground. The different distributions of K. punctatus ichthyoplankton and environmental factors were also investigated among various months and years. The GAM has proved to be a valuable tool to understand distributions of marine fish, based on nonlinear regression between fish and environment (Bacheler et al., 2010). Tweedie distribution was appropriate for analysis of K. punctatus FED and FLD with a lot of zero values, because power-parameter (p) of optimal FED and FLD models were both in the range of 1<p<2 (1.613 and 1.443, respectively) (Shono, 2008). Tweedie-GAM has also been proved an effective method in this study, given that it fitted well for most of the data.
Eggs and larvae were vulnerable periods in the life history of fish, which were easily affected by environmental factors (Chambers and Trippel, 1997; Wan et al., 2014). The results suggested that K. punctatus FED had significant associations with SST, SSS and Dep. And FLD was significantly affected by SSS. The results were consistent with those of Kong et al. (2004) and Kawasaki et al. (2006). They found that water temperature and salinity were basic biological factors that determined K. punctatus spawning and distribution. The conclusions were well understood, not only for K. punctatus but for many other fishes. Sea temperature was one of the most important environmental factors affecting fish activities and dominating the life history of growth, development and reproduction (Yan et al., 2015; Zhao et al., 2013; Selleslagh and Amara, 2008). And salinity could influence the distribution of eggs and larvae by affecting brooding and breeding process (Jiang, 2010; Song et al., 2016). While, depth might indirectly affect ichthyoplankton distribution, through combining other factors listed and not listed in this study. It was more like a spatial signal for fish.
Although K. punctatus was an important economic species in China, there were few studies on this species, especially on its distribution and relationship with environmental factors. There were only few simple descriptions of breeding habit for K. punctatus found from the previous studies, which are lack of specific data to support their conclusions. Firstly, Chen (1975) and Fisheries Bureau of the Ministry of Agriculture, Yellow Sea Fishery Headquarters of the Ministry of Agriculture (1990) demonstrated that K. punctatus spawned with suitable temperature of 14–17°C. Secondly, Zhang et al. (1985) thought the suitable sea bottom temperature for K. punctatus spawning was 14.5–18.5°C. However, Wan and Jiang (2000) found the temperature for K. punctatus eggs hatching was 20.7–22.7°C. Chen and Zhang (1965) also found the suitable SST for K. punctatus eggs hatching was 10–23°C, in which higher SST led to faster hatching. In this study, the suitable SST for K. punctatus spawning was 19–26°C. The results seemed to be more reasonable according to the hatching temperature of K. punctatus. The traditional way to predict spawning ground was by identifying the distributions of females with the fifth stage gonad. The indirect method would predict earlier spawning period, resulting in lower suitable temperature. Because it was uncertain whether K. punctatus spawned at that moment. They might also wait for higher suitable temperature for spawning. Besides, as the spawning site of Arcto-Norwegian cod have changed in the past 40 years, K. punctatus spawning habit might also have changed in the past decades, which was a response to increasing SST and fishing pressure (Sundby and Nakken, 2008). That need to be proved in further study.
Environmental factors were expected to have great impacts on fish aggregation and reproduction, therefore they acted as significant factors limiting eggs and larvae distribution (Ciannelli et al., 2014). The optimal models predicted that K. punctatus spawning site were mainly distributed in study area from 33.0°N to 37.0°N. The absence of eggs in the QDCWM area might because low sea temperature and high salinity were unsuitable for K. punctatus eggs (Xiao et al, 2017). High FED was also predicted in the north area in August 2014 and 2016, though no station located there. The results were reasonable, as it was based on the relationship between environmental factors and FED distribution fitted by the optimal GAM of FED. High FED distribution in the north area for 2014 and 2016 meant that the environmental condition is suitable for spawning habitat of K. punctatus, although there might exist some uncertainty. While nursing ground were mostly located along the coast from 31.7°N to 35.5°N. Compared to K. punctatus eggs, larvae tended to the south and the coast. Reasons for regional differences between distributions of eggs and larvae might be reproduce strategy, aiming to improve survival rate of offspring, which were not limited to increase opportunity for larval feeding (Agostini and Bakun, 2002), or for access to suitable locations (Karnaukas et al., 2011). Since eggs can rely on yolksac whereas larvae must feed exogenously, parents would prefer to select the spawning site with certain hydrodynamic characteristics, which would increase the spatial overlap among subsequent larval stages, their prey and suitable environment (Reglero et al., 2017). K. punctatus eggs might be carried to the south by the YSCC during their hatching. When they were spread to the area of radiate sand ridges in the Subei shoal, water slowed down and larvae assembled (Yan, 2016; He, 2016). With sufficient food and suitable environment, there became K. punctatus nursing ground (Zhang, 2011). Then, they swam into the central Yellow Sea for recruitment, with the help of coastal current (Zhang et al., 2016; Chen, 1975; Fisheries Bureau of the Ministry of Agriculture, Yellow Sea Fishery Headquarters of the Ministry of Agriculture, 1990). That deserved further study in the future.
The spring results indicated that more K. punctatus eggs were found in 2017 than in 2015. It might because higher temperature in 2017 made wider area for more eggs to survive (Fig. 6). However, larvae only occurred inside the Haizhou Bay in May 2017 (Fig. 6). Those larvae might be hatched and spread from eggs in earlier time. Because eggs in April 2017 were spatially overlapped with larvae in May 2017 (Figs 8 and 9). That might be an evidence to support the opinion. And it also could explain that no larvae were found in April 2017, because eggs could not survive due to low temperature in the earlier time. In addition, eggs almost covered the whole area from 33.0°N to 37.0°N in June 2017. It was during this period that the QDCWM was fading and sea temperature returned to normal (Jin et al., 2017; Huang et al., 2019). Spawning area started to contain this region. In summary, results showed that more larvae but less eggs occurred in summer (Figs 8 and 9). As high temperature in summer might become a limiting factor for eggs.
In this study, there were some uncertainties of the results. The models fitted well for most of the data. There still had deviations when fitted for higher density. Rare high values might be difficult for models to fit. Nevertheless, sparse data of SSS less than 28 were still retained. These low SSS stations distributed along the south coast, which were caused by freshwater into sea from Jiangsu Province (Figs 6 and 7). Although these data might increase uncertainty of model, they were not deleted, in order to reflect the relationship between K. punctatus ichthyoplankton and SSS better. Besides, the deviance explained of GAM of FLD was low due to few number of K. punctatus larvae caught (Table 1). That partly because high mortality during hatching process and first feeding period limited the number of larvae. Partly because K. punctatus larvae might swim away from surface, which resulted in failure of catch by nets. In addition, the existing data only contained 6 months from 2014 to 2017. The limitation of data could not support analysis of dynamic of K. punctatus spawning and nursing ground. In order to make a systematic and comprehensive research on migration pattern of K. punctatus, more environmental factors and larger study area in every months were needed in further study.
In conclusion, a group of K. punctatus potential area for reproducing and breeding was found in the South Yellow Sea. Their spawning ground distributed from 33.0°N to 37.0°N. And it divided into north and south part. The nursing ground was in the area from 31.7°N to 35.5°N, which was more southward than spawning ground was (Fig. 9). They will migrate to the wintering ground in the central Yellow Sea (Chen, 1975; Fisheries Bureau of the Ministry of Agriculture, Yellow Sea Fishery Headquarters of the Ministry of Agriculture, 1990). The authors infer this group of K. punctatus, eggs decreased and larvae increased gradually from spring to summer. And eggs increased and larvae decreased year after year. That need to be proven by further study with long time series survey in the future.
We thank Laboratory of Fisheries Oceanography and Laboratory of Fisheries Ecosystem Monitoring and Assessment in Ocean University of China for providing with data.
| [1] |
Agostini V N, Bakun A. 2002. ‘Ocean triads’ in the Mediterranean Sea: physical mechanisms potentially structuring reproductive habitat suitability (with example application to European anchovy, Engraulis encrasicolus). Fisheries Oceanography, 11(3): 129–142. doi: 10.1046/j.1365-2419.2002.00201.x
|
| [2] |
Akaike H. 1974. A new look at the statistical model identification. IEEE Transactions on Automatic Control, 9(6): 716–723
|
| [3] |
Bacheler N M, Ciannelli L, Bailey K M, et al. 2010. Spatial and temporal patterns of walleye pollock (Theragra chalcogramma) spawning in the eastern Bering Sea inferred from egg and larval distributions. Fisheries Oceanography, 19(2): 107–120. doi: 10.1111/j.1365-2419.2009.00531.x
|
| [4] |
Chambers R C, Trippel E A. 1997. Early Life History and Recruitment in Fish Populations. Berlin, Germany: Springer
|
| [5] |
Chen Dagang. 1975. Konosirus punctatus. Fisheries Science & Technology Information (in Chinese), (9): 29–30
|
| [6] |
Chen Yunlong. 2017. Spatio-temporal variation of fishery resources in the Yellow Sea and Yangtze River estuary (in Chinese) [dissertation]. Beijing: University of Chinese Academy of Sciences
|
| [7] |
Chen Zhenran, Zhang Xiaowei. 1965. A description of the morphological characters of the eggs larvae and young of clupanodon punctatus (T&S). Oceanologia et Limnologia Sinica (in Chinese), 7(3): 205–219
|
| [8] |
Ciannelli L, Bailey K, Olsen E M. 2014. Evolutionary and ecological constraints of fish spawning habitats. ICES Journal of Marine Science, 72(2): 285–296
|
| [9] |
Dormann C F, Elith J, Bacher S, et al. 2013. Collinearity: a review of methods to deal with it and a simulation study evaluating their performance. Ecography, 36(1): 27–46. doi: 10.1111/j.1600-0587.2012.07348.x
|
| [10] |
Elith J, Leathwick J R. 2009. Species distribution models: Ecological explanation and prediction across space and time. Annual Review of Ecology, Evolution, and Systematics, 40: 677–697. doi: 10.1146/annurev.ecolsys.110308.120159
|
| [11] |
Fisheries Bureau of the Ministry of Agriculture, Yellow Sea Fishery Headquarters of the Ministry of Agriculture. 1990. Investigation and Regionalization of Fishery Resources in Yellow Sea and Bohai Sea Area (in Chinese). Beijing: China Ocean Press
|
| [12] |
Gonzalez-Irusta J M, Wright P J. 2017. Spawning grounds of whiting (Merlangius merlangus). Fisheries Research, 195: 141–151. doi: 10.1016/j.fishres.2017.07.005
|
| [13] |
Guan Bingxian. 1984. Bohai Sea, Yellow Sea and East China Sea Survey and Research Report (in Chinese). Qingdao: Institute of Oceanology, Chinese Academy of Sciences
|
| [14] |
Guan Bingxian. 2002. The Flow Opposing the Wind in Winter near the Southeastern Chinese Coast (in Chinese). Qingdao: China Ocean University Press
|
| [15] |
Guo Xuewu, Tang Qisheng, Sun Yao, et al. 1999. The consumption and ecological conversion efficiency of dotted gizzard shad (Clupanodon punctatus). Marine Fisheries Research (in Chinese), 20(2): 17–25
|
| [16] |
Gwak W S, Lee Y D, Nakayama K. 2015. Population structure and sequence divergence in the mitochondrial DNA control region of gizzard shad Konosirus punctatus in Korea and Japan. Ichthyological Research, 62(3): 379–385. doi: 10.1007/s10228-014-0450-7
|
| [17] |
Hastie T J, Tibshirani R J. 1990. Generalized Additive Models. New York, NY, USA: Chapman&Hall.
|
| [18] |
He Qun. 2016. Effect of Sand ridges and tidal creek system’s topography on spatial distribution and community structure of zooplankton in North Jiangsu shoal (in Chinese) [dissertation]. Shanghai: Shanghai Ocean University
|
| [19] |
Huang Hao, Chen Xueen, Lin Lin. 2019. Evolution and mechnism of the Qingdao Cold Water Mass. Oceanologia et Limnologia Sinica (in Chinese), 50(6): 1191–1200
|
| [20] |
Ishitobi Y, Hiratsuka J, Kuwahara H, et al. 2005. Growth, maturation and mass mortality of Konosirus punctatus in Lake Shinji, a Coastal Lagoon, Japan. Bulletin of the Japanese Society of Fisheries Oceanography, 69(1): 37–44
|
| [21] |
Jiang Qiang. 2010. Study on the macro-zooplankton and meso-zooplankton community ecology in the North Yellow Sea in the spring and autumn (in Chinese) [dissertation]. Qingdao: Ocean University of China
|
| [22] |
Jin Shanshan, Sun Jinchuan, Wei Zexun. 2017. Effects of the seasonal variability of the Bohai Sea coastal current on the Qingdao cold water mass. Advances in Marine Science (in Chinese), 35(3): 317–328
|
| [23] |
Jin Xianshi, Tang Qisheng. 1998. The structure, distribution and variation of the fishery resources in the Bohai Sea. Journal of Fishery Sciences of China (in Chinese), 5(3): 18–24
|
| [24] |
Karnaukas M, Chérubin L M, Paris C B. 2011. Adaptive significance of the formation of multi-species fish spawning aggregations near submerged capes. PLoS ONE, 6(7): e22067. doi: 10.1371/journal.pone.0022067
|
| [25] |
Kawasaki M, Watanabe Y, Shirafuji N, et al. 2006. Larval Konosirus punctatus (Clupeidae) in a brackish river mouth on the Pacific coast of central Japan. Journal of Fish Biology, 68(5): 1362–1375. doi: 10.1111/j.0022-1112.2006.01018.x
|
| [26] |
Kong L, Kawasaki M, Kuroda K, et al. 2004. Spawning characteristics of the konoshiro gizzard shad in Tokyo and Sagami Bays, central Japan. Fisheries Science, 70(1): 116–122. doi: 10.1111/j.1444-2906.2003.00779.x
|
| [27] |
Lelièvre S, Vaz S, Martin C S, et al. 2014. Delineating recurrent fish spawning habitats in the North Sea. Journal of Sea Research, 91: 1–14. doi: 10.1016/j.seares.2014.03.008
|
| [28] |
Li Zengguang. 2013. Distribution of main species of stow net in the South Yellow Sea based on GAM and preliminary study of characteristics of ichthyoplankton assemblages in Haizhou Bay (in Chinese) [dissertation]. Qingdao: Ocean University of China
|
| [29] |
Li Min, Xu Binduo, Ma Qiuyun, et al. 2017. Generalized additive model reveals effects of spatiotemporal and environmental factors on the relative abundance distribution of Konosirus punctatus in the Yellow River Estuary and its adjacent waters. Journal of Fishery Sciences of China (in Chinese), 24(5): 963–969. doi: 10.3724/SP.J.1118.2017.17078
|
| [30] |
Li Zengguang, Ye Zhenjiang, Wan Rong. 2015. Spatial and seasonal patterns of ichthyoplankton assemblages in the Haizhou Bay and its adjacent waters of China. Journal of Ocean University of China, 14(6): 1041–1052. doi: 10.1007/s11802-015-2603-3
|
| [31] |
Li Zengguang, Ye Zhenjiang, Wan Rong, et al. 2018. Density-independent and density-dependent factors affecting spatio-temporal dynamics of Atlantic cod (Gadus morhua) distribution in the Gulf of Maine. ICES Journal of Marine Science, 75(4): 1329–1340. doi: 10.1093/icesjms/fsx246
|
| [32] |
Li Yuan, Zhang Liyan, Wang Liangming, et al. 2016. Population genetics of Konosirus punctatus in Taiwan Strait. Journal of Applied Oceanography (in Chinese), 35(4): 522–528
|
| [33] |
Lin Jianguo. 2004. Numerical simulation of three-dimensional current field and temperature field of the Bohai Sea, the Yellow Sea and the East China Sea (in Chinese) [dissertation]. Qingdao: Ocean University of China
|
| [34] |
Lv Zhenbo, Xu Bingqing, Li Fan, et al. 2011. Structure and distribution of fish resources in the Yellow Sea off Shandong during spring and autumn 2006. Journal of Fishery Sciences of China (in Chinese), 18(6): 1335–1342
|
| [35] |
Myoung S H, Kim J K. 2016. Population structure of the Korean gizzard shad, Konosirus punctatus (Clupeiformes, Clupeidae) using multivariate morphometric analysis. Ocean Science Journal, 51(1): 33–41. doi: 10.1007/s12601-016-0004-1
|
| [36] |
Okiyama M. 1988. An Atlas of the Early Stage Fishes in Japan. Tokyo: Tokai University Press
|
| [37] |
Reglero P, Santos M, Balbín R, et al. 2017. Environmental and biological characteristics of Atlantic bluefin tuna and albacore spawning habitats based on their egg distributions. Deep-Sea Research Part II: Topical Studies in Oceanography, 140: 105–116. doi: 10.1016/j.dsr2.2017.03.013
|
| [38] |
Sassa C, Tsukamoto Y, Nishiuchi K, et al. 2008. Spawning ground and larval transport processes of jack mackerel Trachurus japonicus in the shelf-break region of the southern East China Sea. Continental Shelf Research, 28(18): 2574–2583. doi: 10.1016/j.csr.2008.08.002
|
| [39] |
Selleslagh J, Amara R. 2008. Environmental factors structuring fish composition and assemblages in a small macrotidal estuary (Eastern English Channel). Estuarine, Coastal and Shelf Science, 79(3): 507–517. doi: 10.1016/j.ecss.2008.05.006
|
| [40] |
Shao K T, Yang J S, Chen K C, et al. 2001. An identification guide of marine fish eggs from Taiwan (in Chinese). Taiwan: Institute of Zoology, Academia Sinica
|
| [41] |
Shono H. 2008. Application of the Tweedie distribution to zero-catch data in CPUE analysis. Fisheries Research, 93(1–2): 154–162
|
| [42] |
Song Chao, Wang Yutan, Liu Zunlei, et al. 2016. Relationship between environmental factors and distribution of Scomberomorus niphonius eggs, larvae, and juveniles in Xiangshan Bay. Journal of Fishery Sciences of China (in Chinese), 23(5): 1197–1204
|
| [43] |
Stelzenmüller V, Ellis J R, Rogers S I. 2010. Towards a spatially explicit risk assessment for marine management: assessing the vulnerability of fish to aggregate extraction. Biological Conservation, 143(1): 230–238. doi: 10.1016/j.biocon.2009.10.007
|
| [44] |
Stone C J. 1985. Additive regression and other nonparametric models. The Annals of Statistics, 13(2): 689–705
|
| [45] |
Sun Yao, Zhang Bo, Guo Xuewu, et al. 1999. Food consumption, growth, and ecological conversion efficiency of Clupanodon punctatus: applying in situ method in laboratory. Marine Fisheries Research (in Chinese), 20(2): 12–16
|
| [46] |
Sundby S, Nakken O. 2008. Spatial shifts in spawning habitats of Arcto-Norwegian cod related to multidecadal climate oscillations and climate change. ICES Journal of Marine Science, 65(6): 953–962. doi: 10.1093/icesjms/fsn085
|
| [47] |
Tang Qisheng, Ye Maozhong. 1990. Exploitation and Protection of Fishery Resources in Shandong Coastal Water (in Chinese). Beijing: Agriculture Press
|
| [48] |
Tweedie M C K. 1984. An index which distinguishes between some important exponential families. Statistics: Applications and new directions. In: Ghosh J K, Roy J, eds. Proceedings of the Indian Statistical Institute Golden Jubilee International Conference. Calcutta, India: Indian Statistical Institute, 579–604
|
| [49] |
Van Overzee H M J, Rijnsdorp A D. 2014. Effects of fishing during the spawning period: implications for sustainable management. Reviews in Fish Biology and Fisheries, 25(1): 65–83
|
| [50] |
Wan Ruijing, Jiang Yanwei. 2000. The species and biological characteristics of the eggs and larvae of Osteichthyes in the Bohai Sea and Yellow Sea. Journal of Shanghai Fisheries University (in Chinese), 9(4): 290–297
|
| [51] |
Wan Rong, Song Pengbo, Li Zengguang, et al. 2020. Distribution and environmental characteristics of the spawning grounds of Scomberomorus niphonius in the coastal waters of Yellow Sea, China. Chinese Journal of Applied Ecology (in Chinese), 31(1): 275–281
|
| [52] |
Wan Ruijing, Zeng Dingyong, Bian Xiaodong, et al. 2014. Species composition and abundance distribution pattern of ichthyoplankton and their relationship with environmental factors in the East China Sea ecosystem. Journal of Fisheries of China (in Chinese), 38(9): 1375–1398
|
| [53] |
Wang xiaolin. 2013. Temporal and spatial variations of the fish community structure in Haizhou Bay and adjacent waters (in Chinese) [dissertation]. Qingdao: Ocean University of China
|
| [54] |
Wang Haozhan, Dai Xiaojie, Guan Wenjiang, et al. 2017. Relationship between the environmental factors and the CPUE (catch per unit effort) of Pseudocarcharias kamoharai in tropical Atlantic Ocean based on the GAM-Tweedie model. Chinese Journal of Applied Ecology (in Chinese), 28(6): 2024–2032
|
| [55] |
Weber E D, Chao Yi, Chai Fei, et al. 2015. Transport patterns of Pacific sardine Sardinops sagax eggs and larvae in the California Current System. Deep-Sea Research Part I: Oceanographic Research Papers, 100: 127–139. doi: 10.1016/j.dsr.2015.02.012
|
| [56] |
Xiao Huanhuan, Zhang Chongliang, Xue Ying, et al. 2017. Community structure of ichthyoplankton from typical transects in Haizhou Bay and its adjacent waters during spring and summer. Journal of Fishery Sciences of China (in Chinese), 24(5): 1079–1090. doi: 10.3724/SP.J.1118.2017.17017
|
| [57] |
Yan Tailiang. 2016. Structure and distribution of fish community in northern Jiangsu shoal and its relation to topography (in Chinese) [dissertation]. Shanghai: Shanghai Ocean University
|
| [58] |
Yan Min, Zhang Heng, Wu Yumei, et al. 2015. Effects of spatio–temporal and environmental factors on fishing grounds of albacore tuna Thunnus alalunga in the South Pacific Ocean based on generalized additive model. Journal of Dalian Ocean University (in Chinese), 30(6): 681–685
|
| [59] |
Yang Shenglong, Zhang Bianbian, Tang Baojun, et al. 2017. Influence of vertical structure of the water temperature on bigeye tuna longline catch rates in the tropical Atlantic Ocean. Journal of Fishery Sciences of China, 24(4): 875–883
|
| [60] |
Ying Yiping. 2011. Population genetic structure and molecular phylogeography of Konosirus punctatus and Sardinella zunasi (in Chinese) [dissertation]. Qingdao: Ocean University of China
|
| [61] |
Zhang Haijing. 2011. Ecological characteristics of zooplankton in the northern Jiangsu shoal in spring and summer (in Chinese) [dissertation]. Shanghai: Shanghai Ocean University
|
| [62] |
Zhang Zhixin, Guo Jingsong, Qiao Fangli, et al. 2016. Whereabouts and freshwater origination of the Subei coastal water. Oceanologia et Limnologia Sinica (in Chinese), 47(3): 527–532
|
| [63] |
Zhang Renzhai, Lu Suifen, Zhao Chuanyin. 1985. Fish Eggs and Larvae in the Offshore Waters of China (in Chinese). Shanghai: Shanghai Scientific and Technical Publishers
|
| [64] |
Zhang Yunlei, Xu Binduo, Zhang Chongliang, et al. 2019. Relationship between the habitat factors and the abundance of small yellow croaker (Larimichthys polyactis) in Haizhou Bay based on the Tweedie-GAM model. Haiyang Xuebao (in Chinese), 41(12): 78–89
|
| [65] |
Zhao Jing, Zhang Shouyu, Wang Zhenhua, et al. 2013. Fish community diversity distribution and its affecting factors based on GAM model. Chinese Journal of Ecology (in Chinese), 32(12): 3226–3235
|
| [66] |
Zhou He, Yang Yi, Qian Wei. 2020. Tweedie gradient boosting for extremely unbalanced zero-inflated data. Communications in Statistics-Simulation and Computation, 1–23
|
| [67] |
Zhu Guoping, Zhu Xiaoyan, Xu Yiying, et al. 2012. The spatiotemporal distribution of fishing grounds for Antarctic krill (Euphausia superba) around the South Orkney Islands in austral summer-autumn and its relation to environmental factors based on a generalized additive model. Chinese Journal of Polar Research (in Chinese), 24(3): 266–273
|
| 1. | Sifan Wang, Fengxia Wu, Yiyong Rao, et al. The Variation in a Fish Egg Community and Its Relationship with Environmental Factors in Daya Bay, South China Sea. Fishes, 2025, 10(2): 67. doi:10.3390/fishes10020067 | |
| 2. | Mingxia Xia, Hui Jia, Yibang Wang, et al. Effects of Climate Change on the Distribution of Scomber japonicus and Konosirus punctatus in China’s Coastal and Adjacent Waters. Fishes, 2024, 9(10): 395. doi:10.3390/fishes9100395 | |
| 3. | Yunlong Chen, Chengcheng Su, Xiaomin Zhang, et al. Exploring changes in epibenthic food web structure after implementation of a water-sediment regulation scheme. Science of The Total Environment, 2024, 956: 176921. doi:10.1016/j.scitotenv.2024.176921 | |
| 4. | Nguyen Hong Nhat, Mitsuyo Saito, Mayuko Hamada, et al. Evaluation of the Effects of Environmental Factors on Seasonal Variations in Fish Diversity on a Coastal Island in Western Japan. Environments, 2024, 11(3): 60. doi:10.3390/environments11030060 | |
| 5. | Zhen Tan, Fengxia Wu, Yiyong Rao, et al. Spatial and temporal distribution of fish egg communities in the adjacent waters of Daya Bay nuclear power plant and their relationship with environmental factors. Frontiers in Marine Science, 2023, 10 doi:10.3389/fmars.2023.1182213 | |
| 6. | Rong Wan, Pengbo Song, Zengguang Li, et al. Use of Ensemble Model for Modeling the Larval Fish Habitats of Different Ecological Guilds in the Yangtze Estuary. Fishes, 2023, 8(4): 209. doi:10.3390/fishes8040209 | |
| 7. | Hao Xu, Bilin Liu, Yangming Cao. Assemblage Distribution of the Larval and Juvenile Myctophid Fish in the Kuroshio Extension Region: Winter 2020. Journal of Marine Science and Engineering, 2023, 11(5): 898. doi:10.3390/jmse11050898 | |
| 8. | Wen Ma, Chunxia Gao, Song Qin, et al. Do Two Different Approaches to the Season in Modeling Affect the Predicted Distribution of Fish? A Case Study for Decapterus maruadsi in the Offshore Waters of Southern Zhejiang, China. Fishes, 2022, 7(4): 153. doi:10.3390/fishes7040153 |


Figures(9) / Tables(2)

Supported by:
Beijing Renhe Information Technology Co. Ltd

Xiangyu Long, Rong Wan, Zengguang Li, Yiping Ren, Pengbo Song, Yongjun Tian, Binduo Xu, Ying Xue. Spatio-temporal distribution of Konosirus punctatus spawning and nursing ground in the South Yellow Sea[J]. Acta Oceanologica Sinica, 2021, 40(8): 133-144. doi: 10.1007/s13131-021-1790-6

| Survey | Month | Stations | Number collected (frequency of occurrence) | |
| eggs | larvae | |||
| 1 | August 2014 | 81 | 7 (2) | 111 (10) |
| 2 | May 2015 | 90 | 403 (9) | 46 (6) |
| 3 | August 2016 | 75 | 68 (3) | 36 (9) |
| 4 | April 2017 | 49 | 1 864 (4) | 0 (0) |
| 5 | May 2017 | 68 | 1 355 (17) | 9 (1) |
| 6 | June 2017 | 64 | 1 009 (13) | 38 (2) |
| Total | 427 | 4 706 (48) | 240 (28) | |
DownLoad:
CSV
| No. | Cumulative model factors | Deviance explained/% | AIC score | |
| FED | 1 | + (Lon & Lat) + (SSS) | 64.8 | 363.937 |
| 2 | + (Lon & Lat) + (SST) | 65.9 | 365.299 | |
| 3 | + (Lon & Lat) + (Dep) | 60.0 | 371.915 | |
| 4 | + (Lon & Lat) + (SSS) + (SST) | 71.9 | 355.896 | |
| 5 | + (Lon & Lat) + (SSS) + (Dep) | 66.6 | 360.939 | |
| 6 | + (Lon & Lat) + (SSS) + (SST) + (Dep) | 74.5 | 347.728 | |
| FLD | 1 | + (Lon & Lat) + (SSS) | 33.4 | 252.276 |
| 2 | + (Lon & Lat) + (Dep) | 31.6 | 254.144 | |
| 3 | + (Lon & Lat) + (SST) | 33.5 | 254.201 | |
| 4 | + (Lon & Lat) + (SSS) + (Dep) | 34.8 | 255.187 | |
| 5 | + (Lon & Lat) + (SSS) + (SST) | 35.9 | 256.069 | |
| 6 | + (Lon & Lat) + (SSS) + (Dep) + (SST) | 37.0 | 259.633 |
DownLoad:
CSV
| Survey | Month | Stations | Number collected (frequency of occurrence) | |
| eggs | larvae | |||
| 1 | August 2014 | 81 | 7 (2) | 111 (10) |
| 2 | May 2015 | 90 | 403 (9) | 46 (6) |
| 3 | August 2016 | 75 | 68 (3) | 36 (9) |
| 4 | April 2017 | 49 | 1 864 (4) | 0 (0) |
| 5 | May 2017 | 68 | 1 355 (17) | 9 (1) |
| 6 | June 2017 | 64 | 1 009 (13) | 38 (2) |
| Total | 427 | 4 706 (48) | 240 (28) | |
| No. | Cumulative model factors | Deviance explained/% | AIC score | |
| FED | 1 | + (Lon & Lat) + (SSS) | 64.8 | 363.937 |
| 2 | + (Lon & Lat) + (SST) | 65.9 | 365.299 | |
| 3 | + (Lon & Lat) + (Dep) | 60.0 | 371.915 | |
| 4 | + (Lon & Lat) + (SSS) + (SST) | 71.9 | 355.896 | |
| 5 | + (Lon & Lat) + (SSS) + (Dep) | 66.6 | 360.939 | |
| 6 | + (Lon & Lat) + (SSS) + (SST) + (Dep) | 74.5 | 347.728 | |
| FLD | 1 | + (Lon & Lat) + (SSS) | 33.4 | 252.276 |
| 2 | + (Lon & Lat) + (Dep) | 31.6 | 254.144 | |
| 3 | + (Lon & Lat) + (SST) | 33.5 | 254.201 | |
| 4 | + (Lon & Lat) + (SSS) + (Dep) | 34.8 | 255.187 | |
| 5 | + (Lon & Lat) + (SSS) + (SST) | 35.9 | 256.069 | |
| 6 | + (Lon & Lat) + (SSS) + (Dep) + (SST) | 37.0 | 259.633 |
 DownLoad: