


Figure
1.
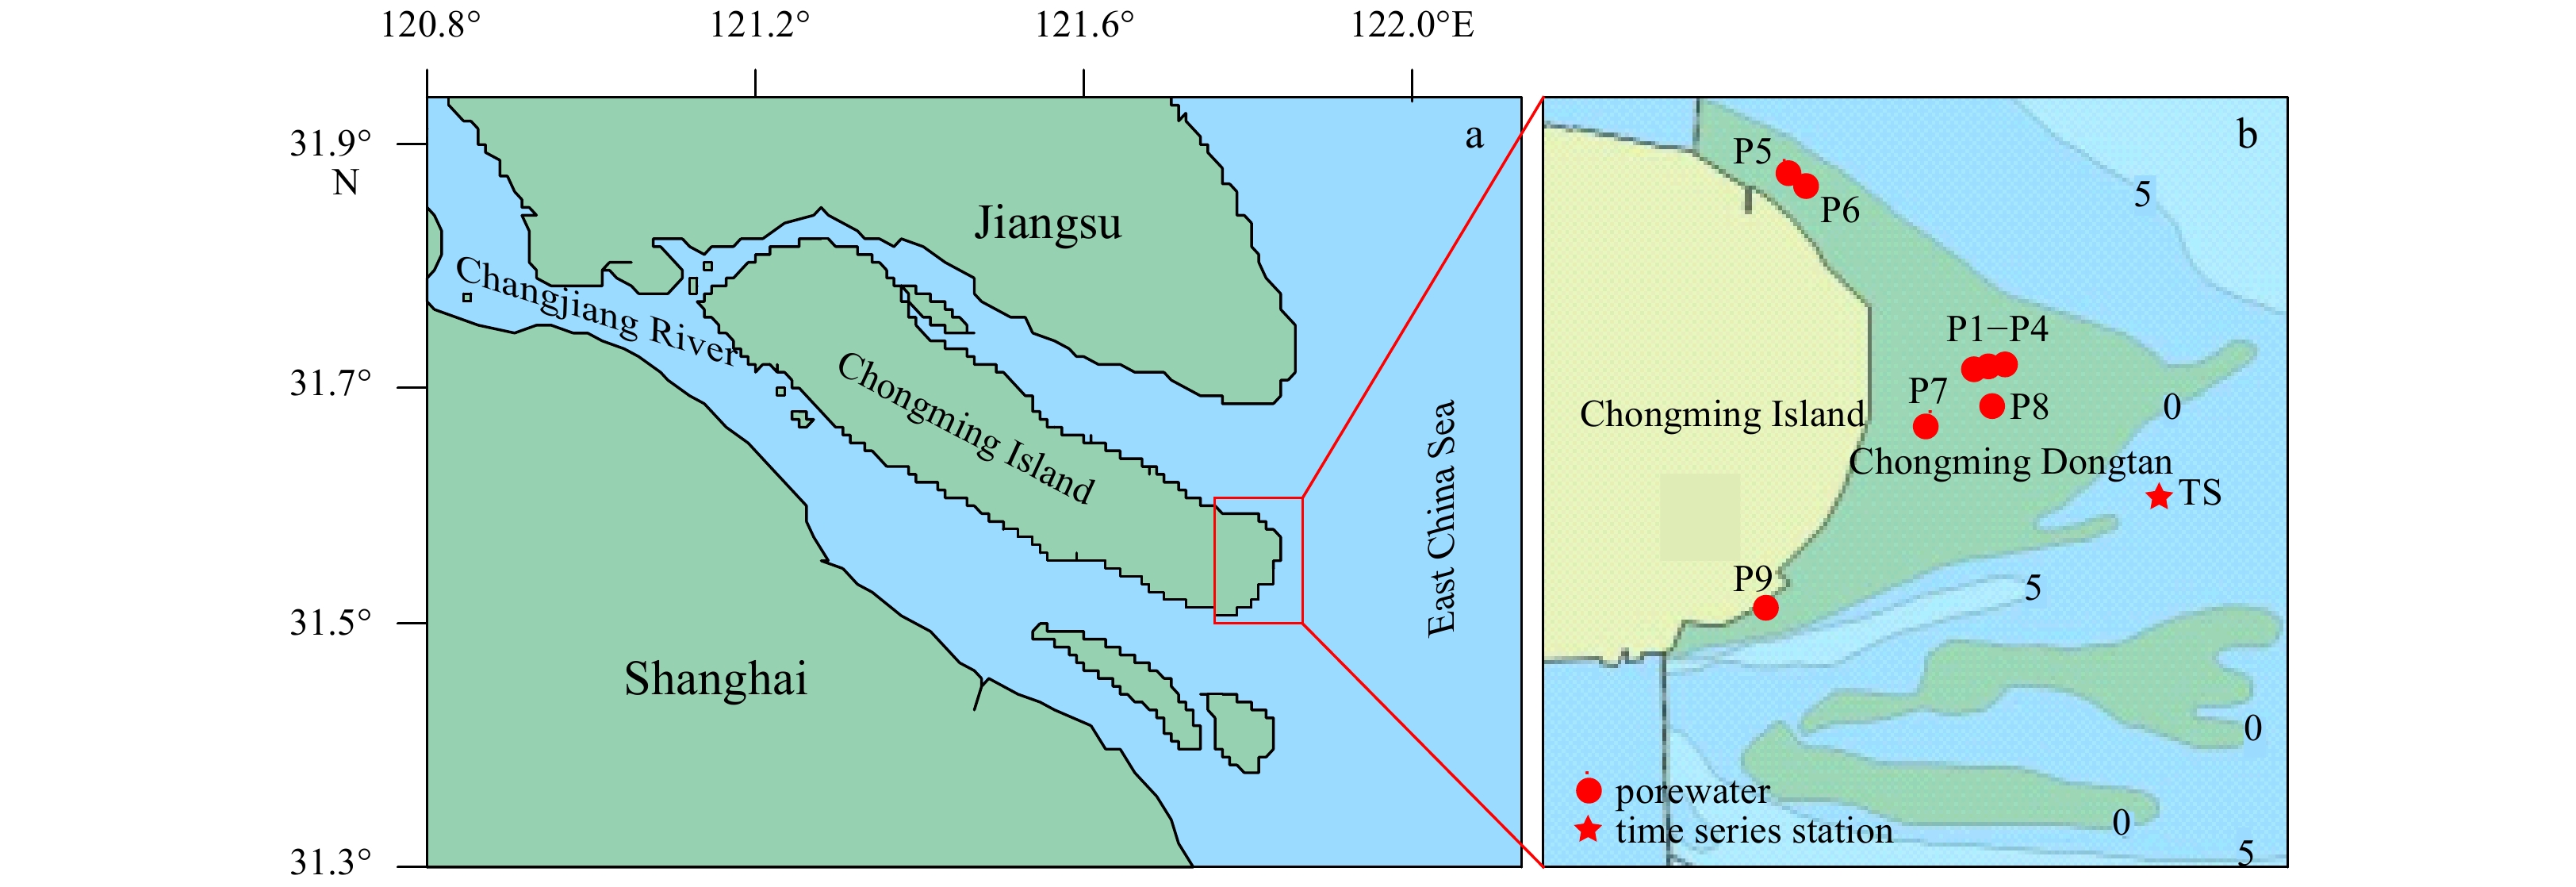
Study site location (a) and sampling stations (b) in Chongming Dongtan. Zero and five indicate water depths of 0 m and 5 m.
| Citation: | Xiaogang Chen, Jinzhou Du, Xueqing Yu, Xiaoxiong Wang. Porewater-derived dissolved inorganic carbon and nutrient fluxes in a saltmarsh of the Changjiang River Estuary[J]. Acta Oceanologica Sinica, 2021, 40(8): 32-43. doi: 10.1007/s13131-021-1797-z

|
Saltmarshes are one of the highest productive ecosystems on the earth, which have been considered to be important sources/sinks, and/or transformers of important compounds such as carbon and nutrients in the coastal landscape (Tobias and Neubauer, 2019). Atmospheric CO2 is assimilated into organic compounds (i.e., carbohydrates) by saltmarshes. Meanwhile, the carbohydrates are utilized by respiration for plant growth and reproduction (Liang et al., 2017; Tang et al., 2018). The dead plants of saltmarsh are decomposed into CO2, and other organic and inorganic matter by microorganisms, with the release of nutrients, and the remaining organic carbon is buried in the sediments (Mcleod et al., 2011; Tang et al., 2018). Some of the carbon and nutrients are then released to the coastal waters through submarine groundwater discharge (SGD) and/or porewater exchange (Charette, 2007; Santos et al., 2019; Liu et al., 2021).
SGD is defined as “all the fluid flow on continental margins from the seabed to the coastal ocean, with scale lengths of meters to kilometers, regardless of fluid composition and driving force” (Burnett et al., 2003). Some small scale processes with scale lengths of millimeters to meters such as flow- and topography-induced advection, wave pumping, ripple migration, shear flow and shallow bio-irrigation are collectively referred to as porewater exchange (Santos et al., 2012b; Hong et al., 2017). Although SGD or porewater exchange in coastal regions has received the increasing attention in recent decades (Burnett et al., 2001; Taniguchi et al., 2019), determining that the porewater exchange in coastal wetlands, especially in saltmarshes, is challenging and rarely reported because of complex and heterogeneous sediments, variability in tidal water flows and burrowing crab effects (Tait et al., 2016; Gutiérrez et al., 2018).
Over the past decades there have been significant advances in quantifying SGD or porewater exchange using natural geochemical tracers (Taniguchi et al., 2019; Santos et al., 2021). In particular, tracing SGD or porewater exchange with radon and/or radium radioisotopes has been widely applied to most coastal systems, such as estuaries (Xu et al., 2014; Correa et al., 2020; Guo et al., 2020), bays or lagoons (Su et al., 2014; Yi et al., 2016; Sugimoto et al., 2016), mangroves (Maher et al., 2013; Tait et al., 2016; Chen et al., 2021; Wang et al., 2021), coral reefs (Wang et al., 2014; Oehler et al., 2019), sandy beaches (Tamborski et al., 2017; Chen et al., 2019), karst systems (Rodellas et al., 2017; Chen et al., 2020a), marginal seas and shelves (Gu et al., 2012; Liu et al., 2017; Tan et al., 2018). Recently, a novel method, termed “the 224Ra/228Th disequilibrium approach”, was developed to quantify benthic solute fluxes from coastal sediments (Cai et al., 2014, 2015, 2020; Hong et al., 2017; Shi et al., 2019). Up to now, the estimates of porewater exchange and associated biogenic elemtnts such as carbon and nutrient fluxes in saltmarshes is limited (Cai et al., 2003; Charette, 2007; Krest et al., 2000; Santos et al., 2019). Although these studies estimated the porewater exchange and associated carbon and nutrient fluxes in saltmarshes using radon or radium tracers, they only calculated the fluxes of dissolved inorganic nitrogen (DIN, the sum of
Chongming Dongtan, located in the center of the Changjiang River Estuary, is a Ramsar Wetland of International Importance and National Nature Reserve (Li et al., 2014). Recent studies of Chongming Dongtan have primarily focused on biodiversity conservation, carbon sequestration capability and carbon storage capacity of wetland vegetation (e.g., Spartina alterniflora), as well as soil organic carbon content (Gan et al., 2009; Guo et al., 2009; Li et al., 2010). However, the carbon and nutrient fluxes via porewater exchange in Chongming Dongtan have not yet been estimated.
In this study, hypothesizing that porewater exchange will be a significant pathway for carbon and nutrients exported to the coastal waters. This hypothesis was tested by performing radon (222Rn, a natural groundwater tracer) time series observation in surface waters of Chongming Dongtan wetland and focusing on both dissolved inorganic carbon (DIC) and nutrient fluxes via porewater exchange.
Chongming Dongtan is the largest and youngest saltmarsh in the Changjiang River Estuary, located at the eastern end of Chongming Island, China (Fig. 1a). The climate of this region is classified as a subtropical ocean climate with a mean annual temperature of 15.3°C. The mean annual precipitation is 1 120 mm, with 60% of rainfall occurring from May to September (Hu et al., 2012). Tides in this region are irregular and semidiurnal, with a range of 2.0–3.1 m (Yang, 1999). The tidal flat has a large vegetation area (27.5 km2) dominated by native Phragmites australis, and S. alterniflora (Ge et al., 2015). Chongming Dongtan was designated a national nature reserve in 2005 because of its importance for bird conservation (Ma et al., 2009). More recently, Chongming Island has been strategically positioned by the Shanghai Overall Planning Office to be developed into a world-class eco-island and has received great attention and cooperation and involvement from international organizations (e.g., the United Nations Environmental Programs) (Luo et al., 2018).
Field investigations were performed in Chongming Dongtan wetland in December 2017. To assess how tidal fluctuations drive porewater exchange, a time series station was deployed for 24 h (two complete tidal cycles) at the surface waters of Chongming Dongtan wetland (Fig. 1b). Continuous 222Rn monitoring in coastal waters was conducted using a RAD7 detector connected with an air-water exchanger. Salinity, temperature, and dissolved oxygen (DO) were measured in the surface water every hour (Multi 3430 WTW, Weilheim, Germany).
Discrete samples for DIC, nutrients and 226Ra were collected every 3 h. DIC and nutrient samples were filtered through the 0.45 μm cellulose acetate filters into polyethylene bottles. Then the water samples were poisoned with saturated HgCl2 and kept away from light. DIC samples were analyzed using the CM140 Total Inorganic Carbon Analyzer (UIC Inc., Rockdale, IL, USA). Nutrient samples were analyzed using an auto-analyzer (Model: Skalar SANplus) (Liu et al., 2009). DIN represents the sum of
Porewater samples in the saltmarsh intertidal zone were collected from a push-point piezometer using a peristaltic pump (Fig. 1b). Crab burrows can strongly enhance porewater exchange in coastal wetlands (e.g., saltmarshes and mangroves) (Xin et al., 2009; Tait et al., 2016; Xiao et al., 2021). Based on the possible depths of crab burrows, the porewater depths (i.e., porewater end-member) were 0.4–1.5 m in this study. These depths are consistent with previous studies (0.3–1.5 m) (Maher et al., 2013; Tait et al., 2016). Temperature, salinity and DO were measured directly in the field using a digital multi parameter meter (Multi 3430 WTW, Weilheim, Germany). 222Rn samples were collected in 250 mL glass bottles using the overflow method and were immediately analyzed using a RAD7 detector (Chen et al., 2018a, 2018b). DIC and nutrient samples were stored and analyzed as described above.
To determine the diffusive flux of 222Rn from sediments, triplicate about 100 g sediments were collected at the time series station and incubated with 400−500 mL of radium-free water for 30 days. The 222Rn activities in equilibrated water were then analyzed using a RAD7 detector (Corbett et al., 1998).
A 222Rn mass balance model originally developed by Burnett and Dulaiova (2003) is used to quantify porewater exchange. This model has been widely applied to coastal systems (Tse and Jiao, 2008; Zhang et al., 2016; Chen et al., 2018a, 2018b; Wang et al., 2019). Based on this model, the 222Rn flux via porewater exchange (FPWE) is estimated after all other 222Rn sources and sinks are estimated. The other 222Rn sources include incoming surface water during flood tide (Fin), 226Ra decay (FRa-226) and 222Rn diffusion from sediments (Fsed), while the 222Rn sinks include outgoing surface waters during ebb tide (Fout), atmospheric evasion (Fatm), 222Rn decay (Fdec) and mixing loss with offshore waters (Fmix). Thus, the 222Rn mass balance model in the water column can be written as follows (unit of each item in equation is Bq/(m2·h)):
| $$ {\text{∆}}F{{= F}}_{\text{PWE}}+{{F}}_{\text{in}}+{{F}}_{\text{Ra-226}}+{{F}}_{\text{sed}}-{{F}}_{\text{out}}-{{F}}_{\text{atm}}-{{F}}_{\text{dec}}-{{F}}_{\text{mix}}\text{,} $$ | (1) |
in which,
| $$ {\text{∆}}F =\frac{{{I}}_{{t}+{\text{∆}}t}-{{I}}_{{t}}}{{\text{∆}}t}\text{,} $$ | (2) |
where ΔF is the variation of the excess 222Rn inventory between two successive periods; I is the 222Rn inventory (Bq/m2) defined as the product of 222Rn activity in the water (Cw, Bq/m3) and water depth; and Δt is the time interval (1 h in this study).
Tidal effects on the variation of 222Rn activity in coastal water cannot be ignored (Tse and Jiao, 2008; Chen et al., 2018a, 2018b), which can be described by the following equations (Zhang et al., 2016):
| $$ {{F}}_{\text{in}}\text=\frac{{{h}}_{{t}+{\text{∆}}t}{-{h}}_{{t}}}{\text{∆}t}{[b}\overline{{{C}}_{{{\rm{w}}}}}+{(1}-{b)}{{C}}_{\text{off}}\text{]}\text{,} $$ | (3) |
| $$ {{F}}_{\text{out}}=\frac{{{h}}_{{t}}{-{h}}_{{t}+{\text{∆}}t}}{\text{∆}t}{{C}}_{{{\rm{w}}}}{\text{,}} $$ | (4) |
where ht is the water depth (h, m) at time t;
Atmospheric evasion of 222Rn can be calculated by the following equation (Maclntryee et al., 1995):
| $$ {{F}}_{\text{atm}}{= k(}{{C}}_{{{\rm{w}}}}-\mathrm{\alpha }{{C}}_{\text{air}}\text{)}\text{,} $$ | (5) |
where Cair and Cw are the 222Rn activities in the air and surface water, respectively; α is partition coefficient, which is described by the Fritz Weigel equation (Burnett and Dulaiova, 2003); Gas transfer velocity (k) is calculated as follows (Maclntryee et al., 1995):
| $$ {{{k}}_{{\rm{600}}}}{\rm{ = }}\left\{ {\begin{aligned} & {{\rm{0}}{\rm{.45}}{{{\mu }}^{{\rm{1}}{\rm{.6}}}}{{\left(\frac{{{{{S}}_{{c}}}}}{{{\rm{600}}}}\right)}^{ - 0.5}}{{(\mu > 3}}{\rm{.6}}\;{\rm{m/s)}}}\\ & {{\rm{0}}{\rm{.45}}{{{\mu }}^{{\rm{1}}{\rm{.6}}}}{{\left(\frac{{{{{S}}_{{c}}}}}{{{\rm{600}}}}\right)}^{ - 0.666\;7}}{{(\mu }} \leqslant {\rm{3}}{\rm{.6}}\;{\rm{m/s)}}} \end{aligned}} \right.{\text{,}} $$ | (6) |
where μ is the wind speed; Sc is Schmidt number and calculated based on the formulations given by Pilson (1998).
The diffusive flux of 222Rn from sediments can be determined based on the following equation (Peng et al., 1974; Martens et al., 1980):
| $$ {{F}}_{\text{sed}}\text{= (}{\text{λ}}_{\text{Rn-222}}\times \mathrm{\varphi }\times {{D}}_{{m}}{\text{)}}^{\text{0.5}}\text{(}{{C}}_{\text{eq}}-{{C}}_{\text{o}}\text{)}\text{,} $$ | (7) |
where λRn-222 is the decay constant of 222Rn (0.181 d−1); φ is porosity of sediment; Dm is a function of temperature described by Peng et al. (1974); Ceq is the 222Rn activity (Bq/m3) in porewater that is equilibrium with that in sediment; Co is 222Rn activity (Bq/m3) in overlying water.
The 222Rn flux from the 226Ra decay and the 222Rn decay loss can be calculated by the following equations (Chen et al., 2018a):
| $$\ {{F}}_{\text{Ra-226}}\text={\text{λ}}_{\text{Rn-222}}\times {{C}}_{\text{Ra-226}}\times {h}\text{,} $$ | (8) |
| $$ {{F}}_{\text{dec}}\text={\text{λ}}_{\text{Rn-222}}\times {{C}}_{{{\rm{w}}}}\times (1-{\text{e}}^{-{\text{λ}}_{\text{Rn-222}}{\text{∆}}t})\times {h}\text{,} $$ | (9) |
where CRa-226 is the dissolved 226Ra activity in the surface waters (Bq/m3). Other items are described as above.
Net 222Rn flux (Fnet) can be evaluated by taking the change in inventories over time after correcting for atmospheric evasion, tidal effect, 226Ra support, 222Rn decay, and sediment diffusion (Zhang et al., 2016):
| $$ {{F}}_{\text{net}}{\text{= ∆}}F-{{F}}_{\text{in}}-{{F}}_{\text{Ra-226}}-{{F}}_{\text{sed}}\text+{{F}}_{\text{out}}\text+{{F}}_{\text{atm}}\text+{{F}}_{\text{dec}}\text{.} $$ | (10) |
Based on the Eqs (8) and (9), Fnet should be a balance between the FPWE and Fmix. To evaluate the conservative estimates of the Fmix, the maximum negative Fnet are selected as Fmix in adjacent periods because the conservative estimates of the mixing loss provide estimations of the minimum porewater exchange flux (Burnett and Dulaiova, 2003). Then the 222Rn fluxes via porewater exchange can be determined based on Eqs (1) and (2). And the porewater exchange rates (PW, cm/d) can be obtained by dividing the 222Rn fluxes via porewater exchange by the 222Rn activity of porewater end-member (CPW, Bq/m3):
| $$\ {{\rm{P}}}{{\rm{W}}}\text=\frac{{{F}}_{\text{PWE}}}{{{C}}_{{{\rm{PW}}}}}\text{.} $$ | (11) |
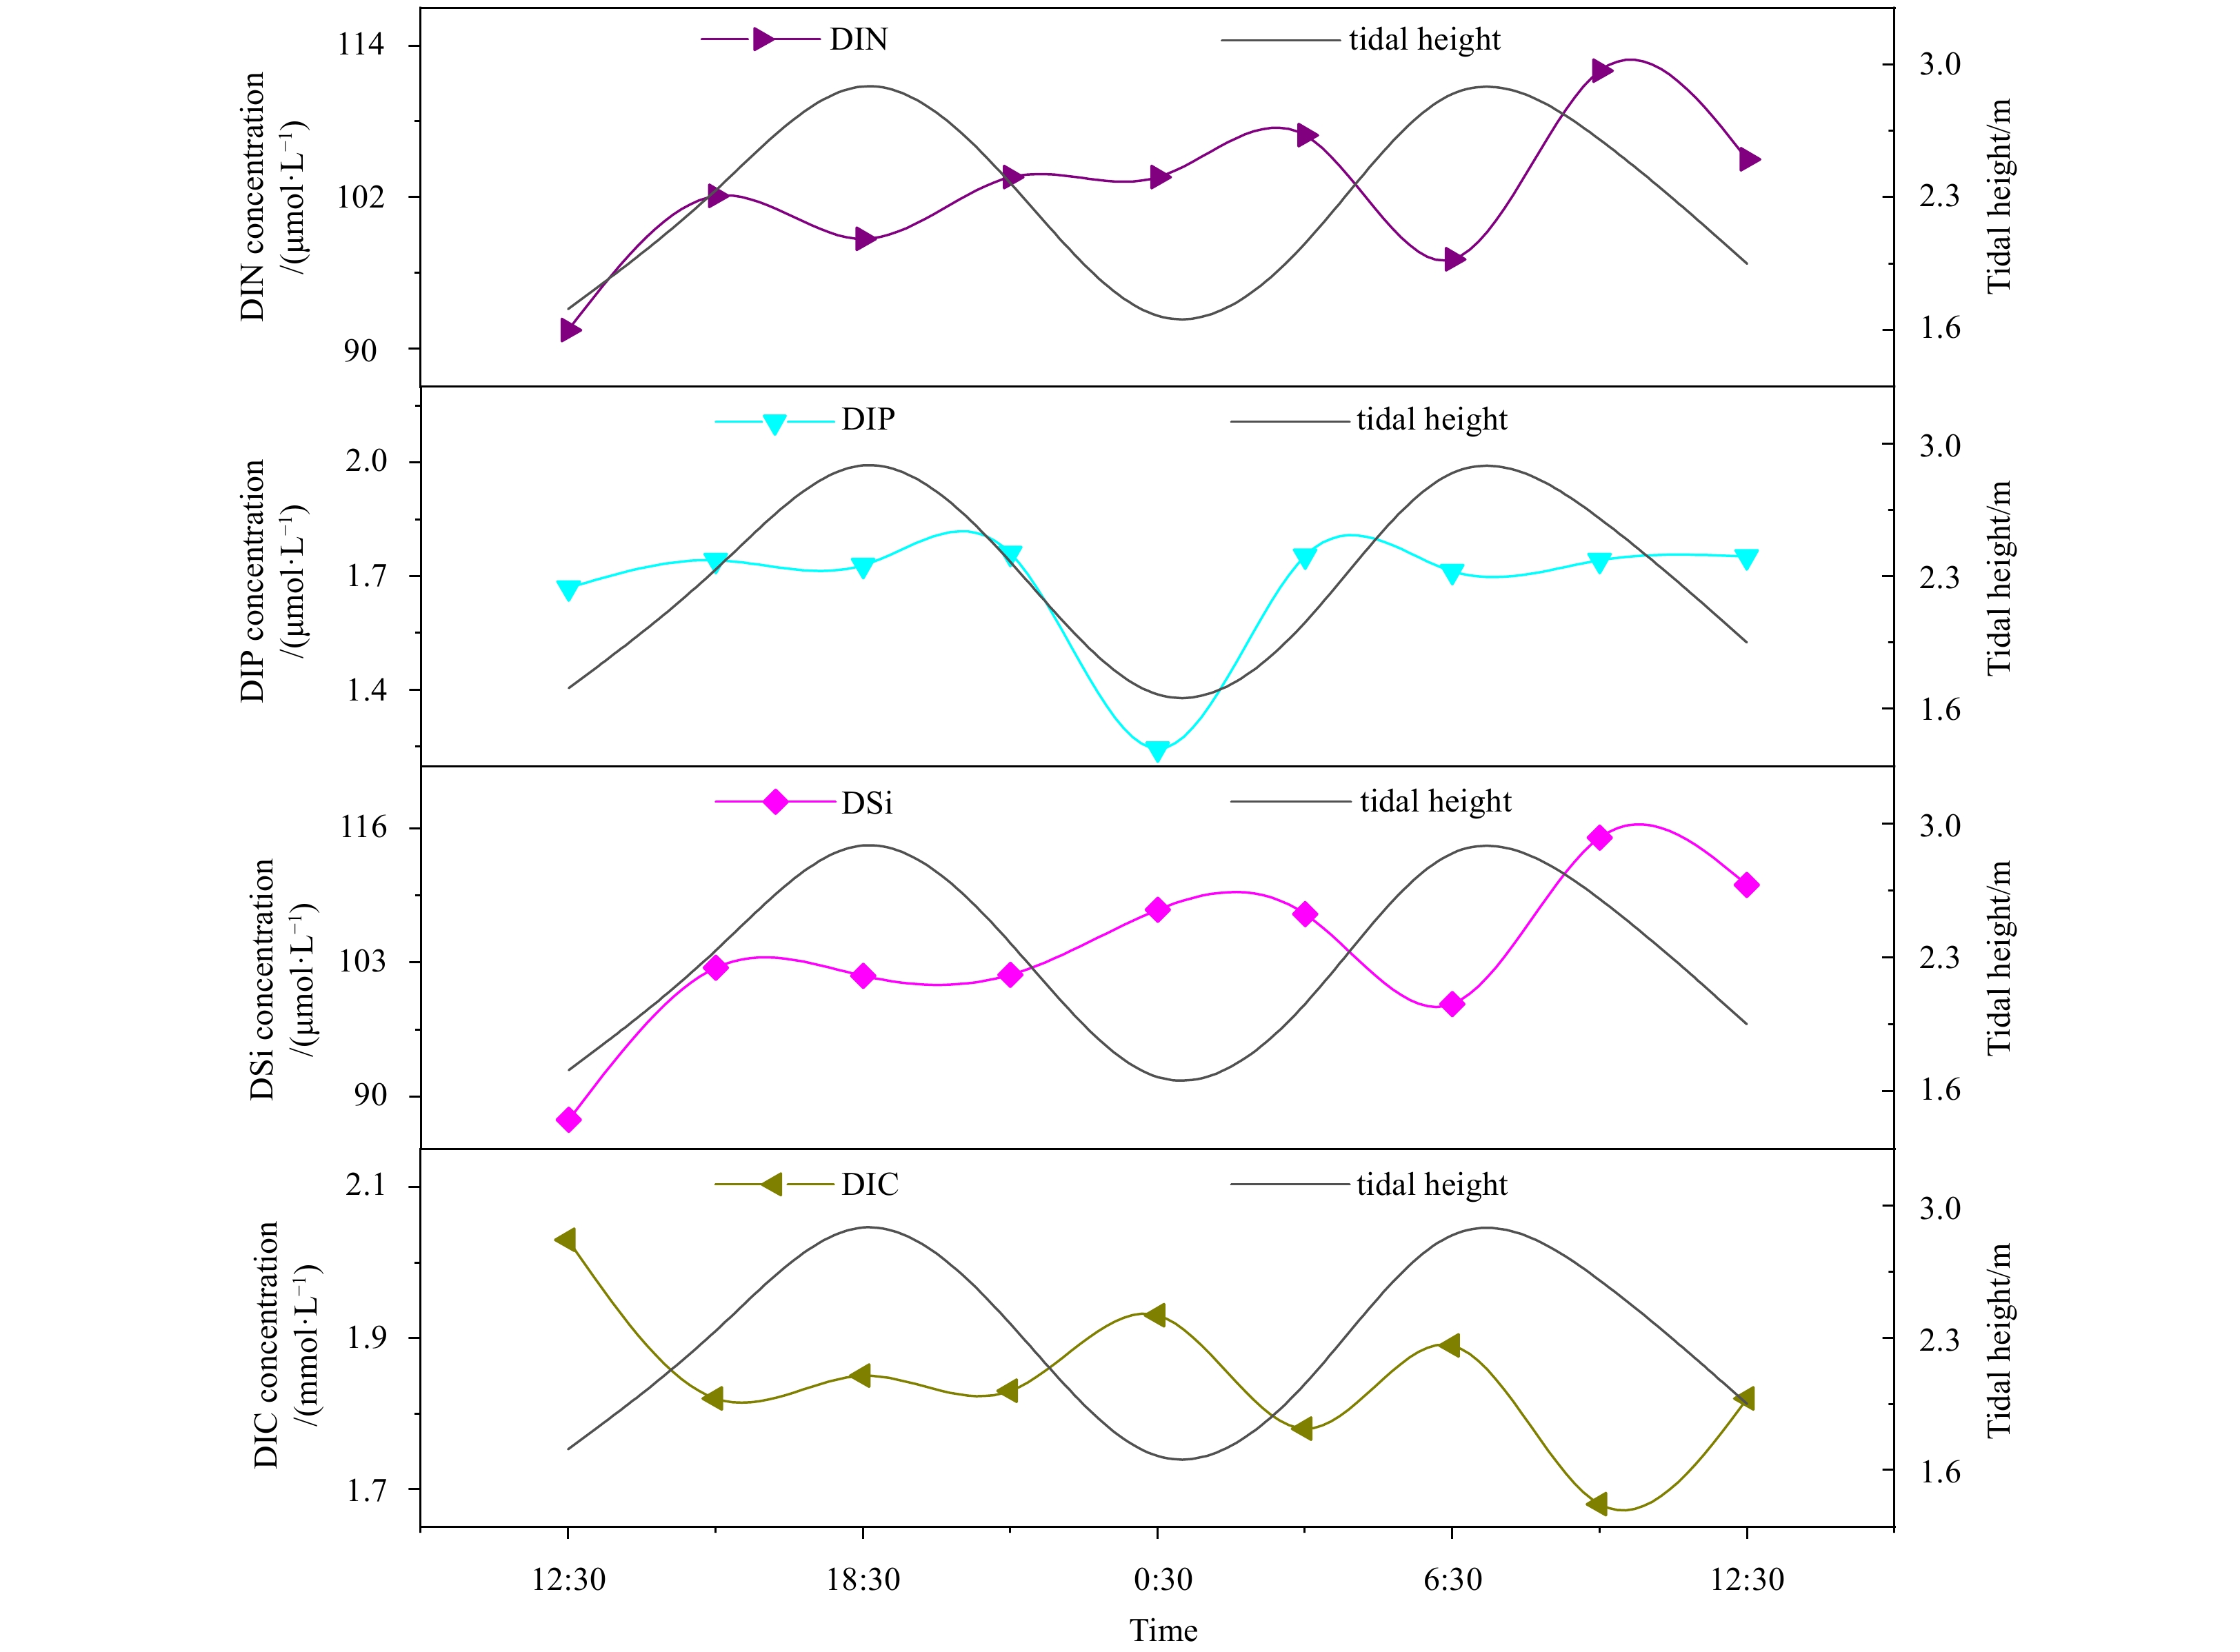
All measured parameters such as salinity, DO, 222Rn, nutrients and DIC fluctuated during time series observation without an obvious tidal pattern except the temperature (Figs 2 and 3). Salinity, temperature and DO ranged from 2.3 to 10.7, 10.5°C to 11.5°C and 10.8 mg/L to 11.4 mg/L, with averages of 6.3±2.4, (10.9±0.3)°C and (11.1±0.2) mg/L, respectively. 222Rn activity ranged from 10.6 Bq/m3 to 42.7 Bq/m3 with an average of (26.2±9.5) Bq/m3. Concentrations of DIN, DIP, DSi, and DIC ranged from 91.5 μmol/L to 112 μmol/L, 1.24 μmol/L to 1.76 μmol/L, 87.8 μmol/L to 115 μmol/L, and 1.68×10³ μmol/L to 2.03×10³ μmol/L, with averages of (102±6) μmol/L, (1.68±0.16) μmol/L, (104±7) μmol/L, and (1.85±0.09)×103 μmol/L, respectively.


Salinity, temperature and DO of porewater in Chongming Dongtan wetland changed from 1.4 to 20.5, 9.8°C to 12.3°C and 0.35 mg/L to 3.32 mg/L, with averages of 12.6±5.1, (10.9±0.7)°C and (1.06±0.88) mg/L, respectively. 222Rn activity of porewater varied from 1.59×10³ Bq/m3 to 4.35×10³ Bq/m3 with an average of (2.87±0.97)×103 Bq/m3 (Table 1), which was about 110 fold higher than that in surface water.
| Station | 222Rn activity/ (Bq·m−3) | Temperature/ °C | Salinity | DO concentration/ (mg·L−1) | DIN concentration/ (μmol·L−1) | DIP concentration/ (μmol·L−1) | DSi concentration/ (μmol·L−1) | DIC concentration/ (μmol·L−1) |
| P1 | 1.69×10³ | 11.4 | 12.8 | 0.70 | 339 | 0.42 | 216 | 7.71×10³ |
| P2 | 3.09×10³ | 10.7 | 12.3 | 0.65 | 386 | 0.21 | 233 | 9.20×10³ |
| P3 | 2.63×10³ | 10.7 | 13.2 | 0.55 | 339 | 1.18 | 203 | 9.06×10³ |
| P4 | 1.59×10³ | 10.8 | 12.2 | 0.50 | 840 | 1.25 | 181 | 8.12×10³ |
| P5 | 3.67×10³ | 10.3 | 19.0 | 0.35 | 208 | 0.09 | 249 | 12.0×10³ |
| P6 | 4.20×10³ | 10.4 | 20.5 | 1.05 | – | – | – | – |
| P7 | 4.35×10³ | 11.4 | 9.9 | 1.66 | 12 | 0.07 | 184 | 11.5×10³ |
| P8 | 2.24×10³ | 9.8 | 12.1 | 3.32 | 130 | 0.03 | 185 | 7.09×10³ |
| P9 | 2.35×10³ | 12.3 | 1.4 | 0.73 | 13 | 0.08 | 194 | 8.27×10³ |
| Average | (2.87±0.97)×103 | 10.9±0.7 | 12.6±5.1 | 1.06±0.88 | 283±251 | 0.42±0.48 | 206±23 | (9.12±1.65)×103 |
 DownLoad:
CSV
DownLoad:
CSV
Nutrients and DIC displayed considerable variability in intertidal porewater (Table 1). DIN (range: 12–840 μmol/L; mean: (283±251) μmol/L), DSi (range: 181–249 μmol/L; mean: (206±23) μmol/L) and DIC (range: (7.09×10³–12.0×10³) μmol/L; mean: (9.12±1.65)×103 μmol/L) concentrations were significantly higher than those in surface water. However, DIP concentration ranged from 0.03 μmol/L to 1.25 μmol/L with an average of (0.42±0.48) μmol/L, which was significantly lower than that in surface water.
According to Eqs (1)–(5), all 222Rn sources and sinks were estimated (Table 2). Based on 222Rn mass balance, porewater-derived 222Rn fluxes were calculated to be 0–138 Bq/(m2·h), mean: (43.8±42.4) Bq/(m2·h). In terms of the 222Rn sources in Chongming Dongtan wetland, porewater exchange flux, incoming surface water during flood tide, 222Rn diffusion from sediments and 226Ra decay accounted for 88.0%, 11.2%, 0.6% and 0.2% of the 222Rn sources, respectively. In terms of the 222Rn sinks, mixing loss with offshore waters, outgoing surface waters during ebb tide, atmospheric evasion and 222Rn decay accounted for 83.0%, 14.4%, 2.6% and <0.1% of the 222Rn sinks, respectively. 222Rn diffusion from sediments, 226Ra decay and 222Rn decay were minor components of the 222Rn mass balance and can be negligible as these items were <1% of the 222Rn sources or sinks. Similar results were found in other coastal areas (Burnett and Dulaiova, 2006; Chen et al., 2018a, 2018b; Sadat-Noori et al., 2018).
| Sources and sinks | 222Rn fluxes /(Bq·m−2·h−1) | Percentage to total 222Rn sources and sinks/% |
| Sources | ||
| 226Ra contribution | 0.13±0.02 | 0.2 |
| Sediment diffusion | 0.30±0.02 | 0.6 |
| Influx during flood tide | 5.56±3.74 | 11.2 |
| Porewater exchange flux | 43.8±42.4 | 88.0 |
| Sinks | ||
| 222Rn decay | 0.007±0.003 | 0.01 |
| Atmospheric evasion | 1.25±0.67 | 2.6 |
| Outflux during ebb tide | 6.90±2.89 | 14.4 |
| Mixing loss | 39.9±36.9 | 83.0 |
DownLoad:
CSV
Defining the porewater end-member is a crucial step in the estimates of porewater exchange and associated nutrient or carbon flux calculations, which has been recognized as a major source of uncertainty (Santos et al., 2012a; Cook et al., 2018; Chen et al., 2020b). In this study, a spatial porewater survey were conducted in Chongming Dongtan wetland (Fig. 1). The mean 222Rn value ((2.87±0.97)×103 Bq/m3) in the spatial porewater survey was selected as the most representative groundwater end-member. Hence, the porewater exchange rate was calculated to be (37±35) cm/d by using porewater exchange flux divided by this groundwater end-member value.
Previous studies have confirmed that porewater exchange plays an important even decisive role in coastal ecosystems (Cai et al., 2014, 2015; Tait et al., 2016; Chen et al., 2019). However, there are limited studies on nutrient and carbon fluxes through porewater exchange in saltmarsh ecosystem (Charette, 2007; Santos et al., 2019) due to the heterogenic geological matrix and highly dynamic aquifer system. Therefore, based on the porewater exchange rates calculated by 222Rn mass balance, the porewater-derived nutrient and DIC fluxes in Chongming Dongtan saltmarshes were estimated.
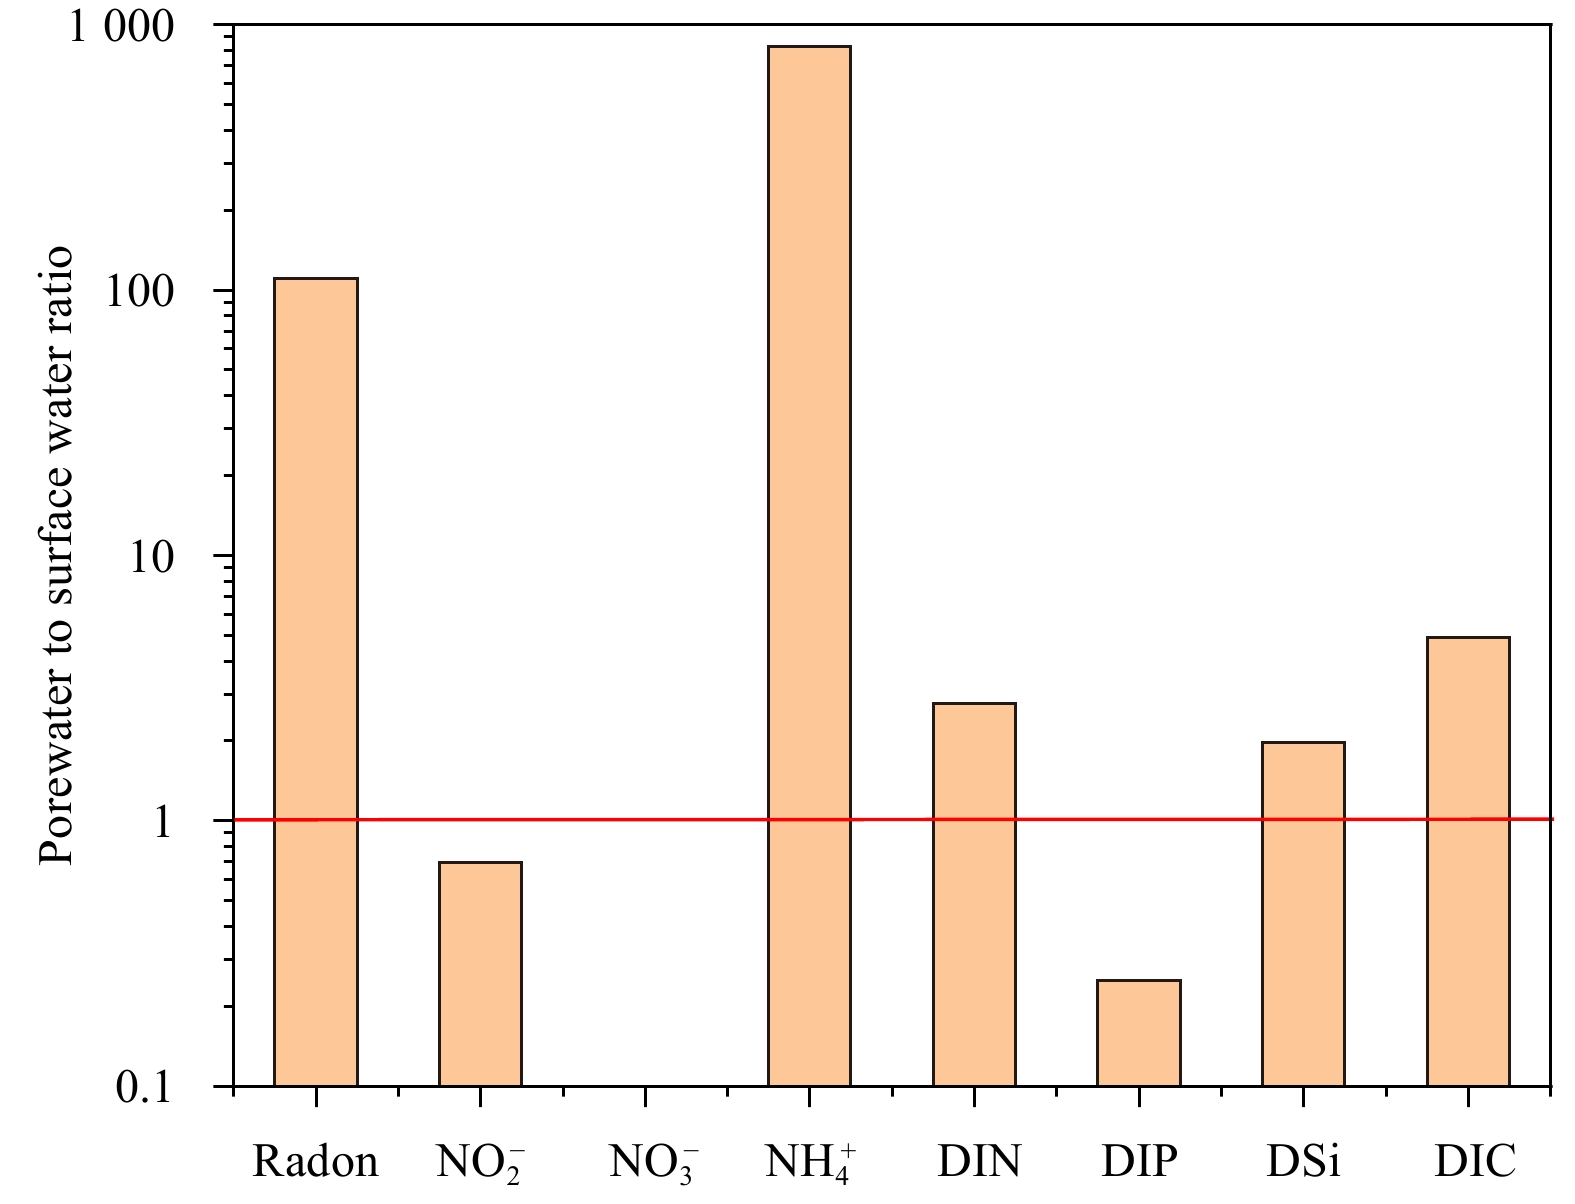
DIN and DSi had high porewater/surface water ratios while porewater DIP was significantly lower than that in surface water (Fig. 4). The low porewater/surface water ratio of DIP is due to mineralization (Slomp and Van Cappellen, 2004) and utilization of phosphate by saltmarshes (Patrick and Delaune, 1976), indicating that porewater exchange in Chongming Dongtan was not DIP source to coastal waters. Therefore, multiplying the porewater exchange rate by the corresponding concentration differences of DIN and DSi in porewater and overlying seawater yields porewater-derived DIN and DSi fluxes of 67 mmol/(m2·d) and 38 mmol/(m2·d), respectively, which are within the wide ranges (DIN: 0.1–680 mmol/(m2·d); DSi: 0.04×10³–1.40×10³ mmol/(m2·d)) of other coastal ecosystems (summarized in Chen et al. (2018a, 2020a) and Wang et al. (2018b)). Similarly, by multiplying the radon-derived porewater exchange by the concentration differences of

Based on the analysis of different inorganic nitrogen species, the concentrations of
| Study area | Ecosystem type | ${\rm {NO} }_2^- $ concentration /(μmol·L−1) | ${\rm {NH} }_4^+ $ concentration /(μmol·L−1) | ${\rm {NO} }_3^- $ concentration /(μmol·L−1) | DIN concentration /(μmol·L−1) | Reference |
| Yucatan Coast, Mexico | seagrass bed | 0.42 | 10.4 | 19.6 | 30.4 | Kantún-Manzano et al. (2018) |
| Laoye Lagoon, China | lagoon | 0.84 | 5.36 | 212 | 218 | Ji et al. (2013) |
| Sanggou Bay, China | bay | 0.73 | 1.17 | 1.64×10³ | 1.64×10³ | Wen (2013) |
| Shipu Bay, China | bay | 0.13 | 1.66 | 395 | 397 | Ji (2013) |
| La Paz, Mexico | bay | 0.47 | 4.80 | 122 | 127 | Urquidi-Gaume et al. (2016) |
| Sansha Bay, China | bay | 1.73 | 13.8 | 889 | 905 | Wang et al. (2018a) |
| Maowei Sea, China | bay/mangrove | 0.76 | 27.5 | 196 | 224 | Chen et al. (2018a) |
| Shengsi, China | sandy beach | 0.99 | 38.1 | 89.9 | 129 | Chen et al. (2019) |
| Yucatan Peninsula, Mexico | beach | 5.53 | 8.22 | 132 | 146 | Null et al. (2014) |
| Kinvara Bay, Ireland | bay/karst aquifer | 0.24 | 0.38 | 79.4 | 80.0 | Rocha et al. (2015) |
| Zaton Bay, Croatia | bay/anchialine cave | 0.09 | 0.89 | 164 | 165 | Chen et al. (2020a) |
| Yellow Sea, China | continental shelf/marginal sea | 0.42 | 7.72 | 182 | 190 | Ye et al. (2016) |
| Xiangshan, China | coastal aquifer | 0.24 | 2.18 | 325 | 327 | Wen (2013) |
| Chongming Dongtan, China | saltmarsh | 0.31 | 282 | 1.48 | 283 | this study |
DownLoad:
CSV

The DIC concentration in coastal groundwater is usually higher than that in surface waters (Maher et al., 2013; Tan et al., 2018; Reithmaier et al., 2021). The porewater DIC concentration in Chongming Dongtan ((9.12±1.65)×103 μmol/L) was also significantly higher than that in surface waters ((1.85±0.09)×103 μmol/L). In addition, the porewater DIC concentration in Chongming Dongtan was higher than that in other ecosystems such as bays, coral reefs, estuaries, continental shelves and marginal seas (range: 0−5.38 mmol/L; mean: 2.63 mmol/L), except for the Zhujiang River Estuary (1.2−19.5 mmol/L) (Table 4). Multiplying the porewater exchange rate by the corresponding concentration differences of DIC in porewater and overlying seawater yields porewater-derived DIC flux of 2.69×10³ mmol/(m2·d), which is higher than that in other coastal ecosystems (1.6×10³–1.96×10³ mmol/(m2·d), summarized in Sadat-Noori et al. (2016) and Chen et al. (2018b)). Therefore, the DIC flux into coastal waters via porewater exchange in saltmarsh wetlands may be an important DIC source, which may have an important contribution to the coastal carbon budget.
| Study area | Ecosystem type | DIC concentration/(mmol·L–1) | Reference |
| Western Port Bay, Australia | mangrove | 11.4 | Lee et al. (2016) |
| Watson Inlet, Australia | mangrove | 2.6 | Faber et al. (2014) |
| Chinaman Inlet, Australia | mangrove | 2.7 | Faber et al. (2014) |
| Blackwater River estuary, USA | mangrove | 4.62 | Atekwana et al. (2003) |
| Mangrove tidal creek, Australia | mangrove | 5.15 | Maher et al. (2013) |
| Haughton River Estuary, Australia | mangrove | 13.8 | Kristensen and Alongi (2006) |
| Ras Dege, Tanzania | mangrove | 2.82 | Bouillon et al. (2007) |
| Can Gio Mangrove Biosphere Reserve, Vietnam | mangrove | 4.86 | Taillardat et al. (2018) |
| Twin Cays, Belize | mangrove | about 12.5 | Lee et al. (2008) |
| Celestun Lagoon, Mexico | mangrove | 0.74−1.53 | Young et al. (2005) |
| Indian Sundarbans, India | mangrove | 2.18 | Ray et al. (2018) |
| Maowei Sea, China | mangrove | 1.6 | Chen et al. (2018b) |
| Rarotonga, Australia | coral reef | 0−3.06 | Cyronak et al. (2013) |
| Sanya Bay, China | coral reef | 1.44−2.54 | Wang et al. (2014) |
| Northern South China Sea | marginal sea | 4 | Liu et al. (2012) |
| Northern South China Sea | marginal sea | 4.71 | Tan et al. (2018) |
| East China Sea | marginal sea | 4.65 | Tan et al. (2018) |
| Waquoit Bay, USA | bay | 0.7−1.9 | Liu et al. (2017) |
| Sanggou Bay, China | bay | 0.07−0.12 | Jiang et al. (2015) |
| Bay of Puck, Poland | Bay | 5.38 | Szymczycha et al. (2014) |
| Had Head, Australia | estuary | 1.46 | Sadat-Noori et al. (2016) |
| Jiulong River Estuary, China | estuary | 0.5−1.4 | Wang et al. (2015) |
| Zhujiang River Estuary | estuary | 1.2−19.5 | Cai et al. (2015) |
| Weitou Bay, China | sandy beach | 2.2−3.1 | Cai et al. (2020) |
| Okatee, USA | saltmarsh | 3.51−22.7 | Moore et al. (2006) |
| North Inlet, USA | saltmarsh | 2−12 | Cai et al. (2003) |
| Chongming Dongtan, China | saltmarsh | 8.65 | this study |
DownLoad:
CSV
The concentrations of

| Study area | SGD/(106 mol·d–1) | River/(106 mol·d–1) | Ratio of SGD or porewater exchange to river | Reference | ||||||||
| DIN | DSi | DIC | DIN | DSi | DIC | DIN | DSi | DIC | ||||
| Chao Phraya River Estuary, Thailand | 0.19−0.48 | 0.11−0.65 | − | 0.49−2.3 | 0.26−4.3 | − | 0.21−0.40 | 0.15−0.44 | − | Burnett et al. (2007) | ||
| Yarra River Estuary, Australia | 0.01 | − | 0.23 | 0.04 | − | 0.41 | 0.25 | − | 0.55 | Santos et al. (2012a) | ||
| Caloosahatchee River Estuary, USA | 0.017 | − | − | 0.05 | − | − | 0.35 | − | − | Charette et al. (2013) | ||
| Tuckean Swamp, Australia | 0.005 | − | − | 0.013 | − | − | 0.41 | − | − | Santos et al. (2013) | ||
| Jiulong River Estuary, China | 0.88−4.8 | 1.5−7.9 | 13−72 | 11−20 | 10−22 | 35−58 | 0.14−0.32 | 0.07−0.19 | 0.24−1.1 | Wang et al. (2015) | ||
| Krka River Estuary, Croatia | 0.05−0.33 | 0.05−0.27 | 3.7−22 | 0.02 | 0.15 | 65.9 | 2.3−16.3 | 0.31−2.8 | 0.06−0.33 | Liu et al. (2019) | ||
| Urbanized Estuary, China | 0.18 | 0.069 | − | 0.61 | 0.093 | − | 0.3 | 0.7 | − | Xiao et al. (2019) | ||
| Zhujiang River Estuary, China | 8.2 | − | 115 | 33.4 | − | 649 | 0.25 | − | 0.18 | Cai et al. (2015) | ||
| Jiulong River Estuary, Chinaa | − | 1.4−1.5 | 34.6−85.4 | − | 6.2−12.6 | 28.1−39.5 | − | 0.11−0.23 | 1.2−2.4 | Hong et al. (2017) | ||
| Jiulong River Estuary, Chinab | − | 2.7−14.4 | 20.7−118 | − | 6.2−12.6 | 28.1−39.5 | − | 0.44−1.1 | 0.74−2.4 | Hong et al. (2017) | ||
| Chongming Dongtan, China | 9.72 | 5.56 | 390 | 83 | 118 | 2 190 | 0.12 | 0.05 | 0.18 | this study | ||
| Note: aporewater exchange; bSGD. | ||||||||||||
DownLoad:
CSV
The DIC flux via porewater exchange in Chongming Dongtan was significantly higher than that in other ecosystems as described above, which indicates that porewater exchange has an important contribution to coastal DIC budget. Similar with those of nutrients, the DIC flux via porewater exchange in the dry season of Chongming Dongtan was estimated to be 3.90×10⁸ mol/d, which accounted for 18% of DIC flux in the Changjiang River (Zhang et al., 2014) (Fig. 6). The ratio of porewater exchange to river for DIC are also within the range (0.06–2.4) observed in other estuarine systems worldwide (Table 5). Therefore, the high porewater-derived DIC flux may have a buffering effect on the decreased DIC concentration/flux in the Changjiang River Estuary due to upstream dam construction (Zhang et al., 2014).
Chongming Dongtan, the largest and youngest saltmarsh in the Changjiang River Estuary, is a typical subtropical saltmarsh ecosystem in China. In the present study, porewater and surface water (time series observation) data sets were collected from the Chongming Dongtan during December 2017. Based on the distribution patterns of the 222Rn, nutrients and DIC in porewater and surface water, the following conclusions have been drawn:
(1) Porewater exchange rate in Chongming Dongtan was estimated to be (37±35) cm/d during December 2017 using a 222Rn mass balance model. The estimated DIN, DSi and DIC fluxes via porewater exchange were 67 mmol/(m2·d), 38 mmol/(m2·d) and 2.69×10³ mmol/(m2·d), respectively. Porewater-derived
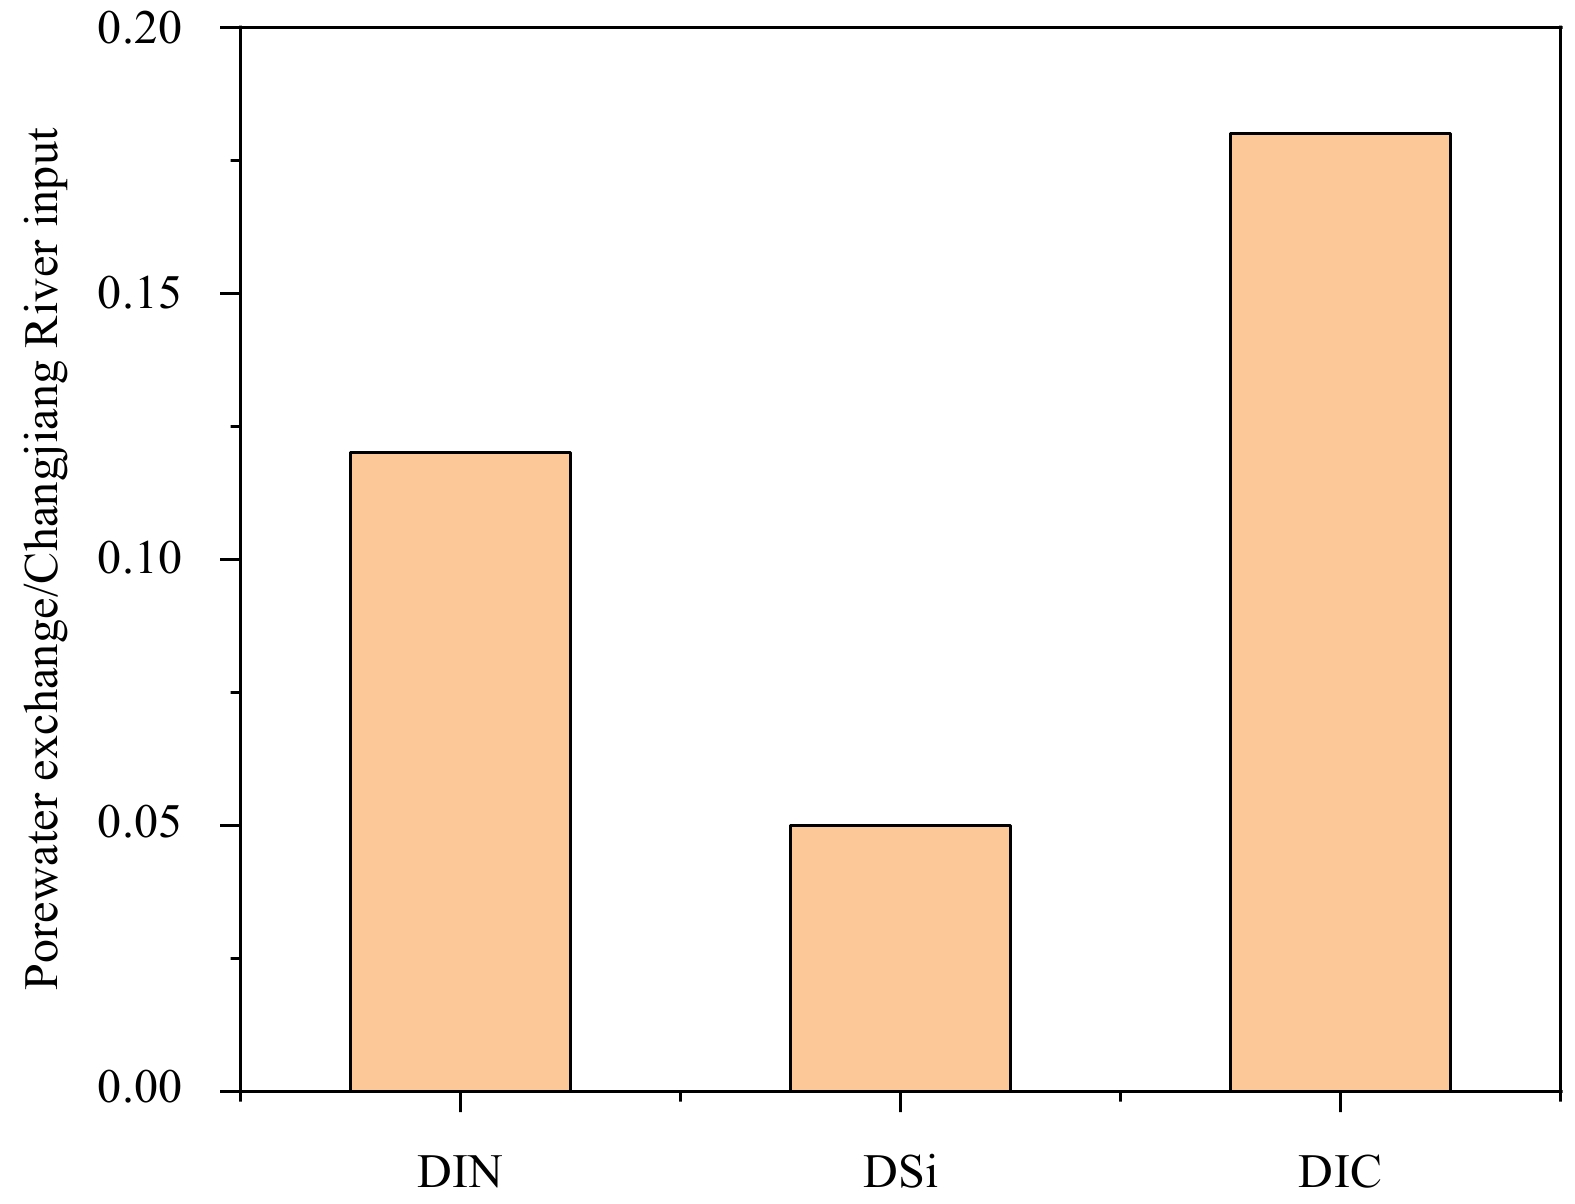
(2) Compared with the nutrient and carbon fluxes through the Changjiang River, porewater-derived DIN, DSi and DIC fluxes in Chongming Dongtan was equivalent to 12%, 5% and 18% of the riverine inputs during December 2017.
(3) Even though there is large riverine inputs, saltmarsh porewater exchange seems to be important sources of biogenic elements such as DIN and DIC into estuary or coastal area. This suggests that saltmarsh porewater exchange should be included in carbon and nutrient assessments in the Changjiang River Estuary.
We would like to thank Yali Wang and Fule Zhang from SKLEC/ECNU for their kind assistance in the field and laboratory. We thank two reviewers for their constructive comments and suggestions that helped improve the manuscript.
| [1] |
Atekwana E A, Tedesco L P, Jackson L R. 2003. Dissolved inorganic carbon (DIC) and hydrologic mixing in a subtropical riverine estuary, southwest Florida, USA. Estuaries, 26(6): 1391–1400. doi: 10.1007/BF02803648
|
| [2] |
Bouillon S, Middelburg J J, Dehairs F, et al. 2007. Importance of intertidal sediment processes and porewater exchange on the water column biogeochemistry in a pristine mangrove creek (Ras Dege, Tanzania). Biogeosciences, 4(3): 311–322. doi: 10.5194/bg-4-311-2007
|
| [3] |
Burnett W C, Bokuniewicz H, Huettel M, et al. 2003. Groundwater and pore water inputs to the coastal zone. Biogeochemistry, 66(1–2): 3–33
|
| [4] |
Burnett W C, Dulaiova H. 2003. Estimating the dynamics of groundwater input into the coastal zone via continuous radon-222 measurements. Journal of Environmental Radioactivity, 69(1–2): 21–35. doi: 10.1016/S0265-931X(03)00084-5
|
| [5] |
Burnett W C, Dulaiova H. 2006. Radon as a tracer of submarine groundwater discharge into a boat basin in Donnalucata, Sicily. Continental Shelf Research, 26(7): 862–873. doi: 10.1016/j.csr.2005.12.003
|
| [6] |
Burnett W C, Taniguchi M, Oberdorfer J. 2001. Measurement and significance of the direct discharge of groundwater into the coastal zone. Journal of Sea Research, 46(2): 109–116. doi: 10.1016/S1385-1101(01)00075-2
|
| [7] |
Burnett W C, Wattayakorn G, Taniguchi M, et al. 2007. Groundwater-derived nutrient inputs to the Upper Gulf of Thailand. Continental Shelf Research, 27(2): 176–190. doi: 10.1016/j.csr.2006.09.006
|
| [8] |
Cai Pinghe, Shi Xiangming, Hong Qingquan, et al. 2015. Using 224Ra/228Th disequilibrium to quantify benthic fluxes of dissolved inorganic carbon and nutrients into the Pearl River Estuary. Geochimica et Cosmochimica Acta, 170: 188–203. doi: 10.1016/j.gca.2015.08.015
|
| [9] |
Cai Pinghe, Shi Xiangming, Moore W S, et al. 2014. 224Ra: 228Th disequilibrium in coastal sediments: implications for solute transfer across the sediment-water interface. Geochimica et Cosmochimica Acta, 125: 68–84. doi: 10.1016/j.gca.2013.09.029
|
| [10] |
Cai Weijun, Wang Yongchen, Krest J, et al. 2003. The geochemistry of dissolved inorganic carbon in a surficial groundwater aquifer in North Inlet, South Carolina, and the carbon fluxes to the coastal ocean. Geochimica et Cosmochimica Acta, 67(4): 631–639. doi: 10.1016/S0016-7037(02)01167-5
|
| [11] |
Cai Pinghe, Wei Lin, Geibert W, et al. 2020. Carbon and nutrient export from intertidal sand systems elucidated by 224Ra/228Th disequilibria. Geochimica et Cosmochimica Acta, 274: 302–316. doi: 10.1016/j.gca.2020.02.007
|
| [12] |
Charette M A. 2007. Hydrologic forcing of submarine groundwater discharge: insight from a seasonal study of radium isotopes in a groundwater-dominated salt marsh estuary. Limnology and Oceanography, 52(1): 230–239. doi: 10.4319/lo.2007.52.1.0230
|
| [13] |
Charette M A, Henderson P B, Breier C F, et al. 2013. Submarine groundwater discharge in a river-dominated Florida estuary. Marine Chemistry, 156: 3–17. doi: 10.1016/j.marchem.2013.04.001
|
| [14] |
Chen Xiaogang, Cukrov N, Santos I R, et al. 2020a. Karstic submarine groundwater discharge into the Mediterranean: radon-based nutrient fluxes in an anchialine cave and a basin-wide upscaling. Geochimica et Cosmochimica Acta, 268: 467–484. doi: 10.1016/j.gca.2019.08.019
|
| [15] |
Chen Xiaogang, Lao Yanling, Wang Jinlong, et al. 2018a. Submarine groundwater-borne nutrients in a tropical bay (Maowei Sea, China) and their impacts on the oyster aquaculture. Geochemistry, Geophysics, Geosystem, 19(3): 932–951. doi: 10.1002/2017GC007330
|
| [16] |
Chen Xiaogang, Santos I R, Call M, et al. 2021. The mangrove CO2 pump: tidally driven pore-water exchange. Limnology and Oceanography, 66(4): 1563–1577. doi: 10.1002/lno.11704
|
| [17] |
Chen Xiaogang, Wang Jinlong, Cukrov N, et al. 2019. Porewater-derived nutrient fluxes in a coastal aquifer (Shengsi Island, China) and its implication. Estuarine, Coastal and Shelf Science, 218: 204–211. doi: 10.1016/j.ecss.2018.12.019
|
| [18] |
Chen Xiaogang, Ye Qi, Sanders C J, et al. 2020b. Bacterial-derived nutrient and carbon source-sink behaviors in a sandy beach subterranean estuary. Marine Pollution Bulletin, 160: 111570. doi: 10.1016/j.marpolbul.2020.111570
|
| [19] |
Chen Xiaogang, Zhang Fenfen, Lao Yanling, et al. 2018b. Submarine groundwater discharge-derived carbon fluxes in mangroves: an important component of blue carbon budgets?. Journal of Geophysical Research: Oceans, 123(9): 6962–6979. doi: 10.1029/2018JC014448
|
| [20] |
Cook P G, Rodellas V, Stieglitz T C. 2018. Quantifying surface water, porewater, and groundwater interactions using tracers: tracer fluxes, water fluxes, and end-member concentrations. Water Resources Research, 54(3): 2452–2465. doi: 10.1002/2017WR021780
|
| [21] |
Corbett D R, Burnett W C, Cable P H, et al. 1998. A multiple approach to the determination of radon fluxes from sediments. Journal of Radioanalytical and Nuclear Chemistry, 236(1–2): 247–253. doi: 10.1007/BF02386351
|
| [22] |
Correa R E, Tait D R, Sanders C J, et al. 2020. Submarine groundwater discharge and associated nutrient and carbon inputs into Sydney Harbour (Australia). Journal of Hydrology, 580: 124262. doi: 10.1016/j.jhydrol.2019.124262
|
| [23] |
Cyronak T, Santos I R, Erler D V, et al. 2013. Groundwater and porewater as major sources of alkalinity to a fringing coral reef lagoon (Muri Lagoon, Cook Islands). Biogeosciences, 10(4): 2467–2480. doi: 10.5194/bg-10-2467-2013
|
| [24] |
Faber P A, Evrard V, Woodland R J, et al. 2014. Pore-water exchange driven by tidal pumping causes alkalinity export in two intertidal inlets. Limnology and Oceanography, 59(5): 1749–1763. doi: 10.4319/lo.2014.59.5.1749
|
| [25] |
Gan Xiaojing, Cai Yinting, Choi C, et al. 2009. Potential impacts of invasive Spartina alterniflora on spring bird communities at Chongming Dongtan, a Chinese wetland of international importance. Estuarine, Coastal and Shelf Science, 83(2): 211–218. doi: 10.1016/j.ecss.2009.03.026
|
| [26] |
Ge Zhenming, Guo Haiqiang, Zhao Bin, et al. 2015. Plant invasion impacts on the gross and net primary production of the salt marsh on eastern coast of China: insights from leaf to ecosystem. Journal of Geophysical Research: Biogeosciences, 120(1): 169–186. doi: 10.1002/2014JG002736
|
| [27] |
Gu Hequan, Moore W S, Zhang Lei, et al. 2012. Using radium isotopes to estimate the residence time and the contribution of submarine groundwater discharge (SGD) in the Changjiang effluent plume, East China Sea. Continental Shelf Research, 35: 95–107. doi: 10.1016/j.csr.2012.01.002
|
| [28] |
Guo Haiqiang, Noormets A, Zhao Bin, et al. 2009. Tidal effects on net ecosystem exchange of carbon in an estuarine wetland. Agricultural and Forest Meteorology, 149(11): 1820–1828. doi: 10.1016/j.agrformet.2009.06.010
|
| [29] |
Guo Xiaoyi, Xu Bochao, Burnett W C, et al. 2020. Does submarine groundwater discharge contribute to summer hypoxia in the Changjiang (Yangtze) River Estuary?. Science of the Total Environment, 719: 137450. doi: 10.1016/j.scitotenv.2020.137450
|
| [30] |
Gutiérrez J L, Jones C G, Ribeiro P D, et al. 2018. Crab burrowing limits surface litter accumulation in a temperate salt marsh: implications for ecosystem functioning and connectivity. Ecosystems, 21(5): 1000–1012. doi: 10.1007/s10021-017-0200-6
|
| [31] |
Hong Qingquan, Cai Pinghe, Shi Xiangming, et al. 2017. Solute transport into the Jiulong River estuary via pore water exchange and submarine groundwater discharge: new insights from 224Ra/228Th disequilibrium. Geochimica et Cosmochimica Acta, 198: 338–359. doi: 10.1016/j.gca.2016.11.002
|
| [32] |
Hu Yu, Li Yanli, Wang Lei, et al. 2012. Variability of soil organic carbon reservation capability between coastal salt marsh and riverside freshwater wetland in Chongming Dongtan and its microbial mechanism. Journal of Environmental Sciences, 24(6): 1053–1063. doi: 10.1016/S1001-0742(11)60877-2
|
| [33] |
Ji Tao. 2013. Using radium isotopes to trace submarine groundwater discharge in the coastal area of East China Sea and the Lagoon in the East of Hainan Island (in Chinese)[dissertation]. Shanghai: East China Normal University
|
| [34] |
Ji Tao, Du Jinzhou, Moore W S, et al. 2013. Nutrient inputs to a Lagoon through submarine groundwater discharge: the case of Laoye Lagoon, Hainan, China. Journal of Marine Systems, 111−112: 253–262. doi: 10.1016/j.jmarsys.2012.11.007
|
| [35] |
Jiang Zengjie, Li Jiaqi, Qiao Xudong, et al. 2015. The budget of dissolved inorganic carbon in the shellfish and seaweed integrated mariculture area of Sanggou Bay, Shandong, China. Aquaculture, 446: 167–174. doi: 10.1016/j.aquaculture.2014.12.043
|
| [36] |
Kantún-Manzano C A, Herrera-Silveira J A, Arcega-Cabrera F. 2018. Influence of coastal submarine groundwater discharges on seagrass communities in a subtropical karstic environment. Bulletin of Environmental Contamination and Toxicology, 100(1): 176–183. doi: 10.1007/s00128-017-2259-3
|
| [37] |
Kim G, Burnett W C, Dulaiova H, et al. 2001. Measurement of 224Ra and 226Ra activities in natural waters using a radon-in-air monitor. Environmental Science & Technology, 35(23): 4680–4683
|
| [38] |
Krest J M, Moore W S, Gardner L R, et al. 2000. Marsh nutrient export supplied by groundwater discharge: evidence from radium measurements. Global Biogeochemical Cycles, 14(1): 167–176. doi: 10.1029/1999GB001197
|
| [39] |
Kristensen E, Alongi D M. 2006. Control by fiddler crabs (Uca vocans) and plant roots (Avicennia marina) on carbon, iron, and sulfur biogeochemistry in mangrove sediment. Limnology and Oceanography, 51(4): 1557–1571. doi: 10.4319/lo.2006.51.4.1557
|
| [40] |
Lee S, Currell M, Cendón D I. 2016. Marine water from mid-Holocene sea level highstand trapped in a coastal aquifer: evidence from groundwater isotopes, and environmental significance. Science of the Total Environment, 544: 995–1007. doi: 10.1016/j.scitotenv.2015.12.014
|
| [41] |
Lee R Y, Porubsky W P, Feller I C, et al. 2008. Porewater biogeochemistry and soil metabolism in dwarf red mangrove habitats (Twin Cays, Belize). Biogeochemistry, 87(2): 181–198. doi: 10.1007/s10533-008-9176-9
|
| [42] |
Li Yanli, Wang Lei, Zhang Wenquan, et al. 2010. Variability of soil carbon sequestration capability and microbial activity of different types of salt marsh soils at Chongming Dongtan. Ecological Engineering, 36(12): 1754–1760. doi: 10.1016/j.ecoleng.2010.07.029
|
| [43] |
Li Xing, Zhou Yunxuan, Zhang Lianpeng, et al. 2014. Shoreline change of Chongming Dongtan and response to river sediment load: a remote sensing assessment. Journal of Hydrology, 511: 432–442. doi: 10.1016/j.jhydrol.2014.02.013
|
| [44] |
Liang Chao, Schimel J P, Jastrow J D. 2017. The importance of anabolism in microbial control over soil carbon storage. Nature Microbiology, 2: 17105. doi: 10.1038/nmicrobiol.2017.105
|
| [45] |
Liu Qian, Charette M A, Breier C F, et al. 2017. Carbonate system biogeochemistry in a subterranean estuary-Waquoit Bay, USA. Geochimica et Cosmochimica Acta, 203: 422–439. doi: 10.1016/j.gca.2017.01.041
|
| [46] |
Liu Qian, Dai Minhan, Chen Weifang, et al. 2012. How significant is submarine groundwater discharge and its associated dissolved inorganic carbon in a river-dominated shelf system?. Biogeosciences, 9(5): 1777–1795. doi: 10.5194/bg-9-1777-2012
|
| [47] |
Liu Sumei, Hong G H, Zhang Jianmin, et al. 2009. Nutrient budgets for large Chinese estuaries. Biogeosciences, 6(10): 2245–2263. doi: 10.5194/bg-6-2245-2009
|
| [48] |
Liu Jianan, Hrustić E, Du Jinzhou, et al. 2019. Net submarine groundwater-derived dissolved inorganic nutrients and carbon input to the oligotrophic stratified karstic estuary of the Krka River (Adriatic Sea, Croatia). Journal of Geophysical Research: Oceans, 124(6): 4334–4349. doi: 10.1029/2018JC014814
|
| [49] |
Liu Jianan, Yu Xueqing, Chen Xiaogang, et al. 2021. Utility of radium quartet for evaluating porewater-derived carbon to a saltmarsh nearshore water: implications for blue carbon export. Science of the Total Environment, 764: 144238. doi: 10.1016/j.scitotenv.2020.144238
|
| [50] |
Luo Pengzhou, Yang Yi, Wang Hongtao, et al. 2018. Water footprint and scenario analysis in the transformation of Chongming into an international eco-island. Resources, Conservation and Recycling, 132: 376–385. doi: 10.1016/j.resconrec.2017.07.026
|
| [51] |
Ma Zhijun, Wang Yong, Gan Xiaojing, et al. 2009. Waterbird population changes in the wetlands at Chongming Dongtan in the Yangtze River estuary, China. Environmental Management, 43(6): 1187–1200. doi: 10.1007/s00267-008-9247-7
|
| [52] |
Macintyre S, Wanninkhof R, Chanton J P. 1995. Trace gas exchange across the air-water interface in freshwater and coastal marine environments. In: Matson P A, Harris R C, eds. Biogenic Trace Gases: Measuring Emissions from Soil and Water. Oxford, UK: Blackwell, 52−57
|
| [53] |
Maher D T, Santos I R, Golsby-Smith L, et al. 2013. Groundwater-derived dissolved inorganic and organic carbon exports from a mangrove tidal creek: the missing mangrove carbon sink?. Limnology and Oceanography, 58(2): 475–488. doi: 10.4319/lo.2013.58.2.0475
|
| [54] |
Martens C S, Kipphut G W, Van Klump J. 1980. Sediment-water chemical exchange in the coastal zone traced by in situ radon-222 flux measurements. Science, 208(4441): 285–288. doi: 10.1126/science.208.4441.285
|
| [55] |
Mcleod E, Chmura G L, Bouillon S, et al. 2011. A blueprint for blue carbon: toward an improved understanding of the role of vegetated coastal habitats in sequestering CO2. Frontiers in Ecology and the Environment, 9(10): 552–560. doi: 10.1890/110004
|
| [56] |
Moore W S, Arnold R. 1996. Measurement of 223Ra and 224Ra in coastal waters using a delayed coincidence counter. Journal of Geophysical Research: Oceans, 101(C1): 1321–1329. doi: 10.1029/95JC03139
|
| [57] |
Moore W S, Blanton J O, Joye S B. 2006. Estimates of flushing times, submarine groundwater discharge, and nutrient fluxes to Okatee Estuary, South Carolina. Journal of Geophysical Research: Oceans, 111(C9): C09006
|
| [58] |
Null K A, Knee K L, Crook E D, et al. 2014. Composition and fluxes of submarine groundwater along the Caribbean coast of the Yucatan Peninsula. Continental Shelf Research, 77: 38–50. doi: 10.1016/j.csr.2014.01.011
|
| [59] |
Oehler T, Bakti H, Lubis R F, et al. 2019. Nutrient dynamics in submarine groundwater discharge through a coral reef (western Lombok, Indonesia). Limnology and Oceanography, 64(6): 2646–2661. doi: 10.1002/lno.11240
|
| [60] |
Patrick Jr W H, Delaune R D. 1976. Nitrogen and phosphorus utilization by Spartina alterniflora in a salt marsh in Barataria Bay, Louisiana. Estuarine and Coastal Marine Science, 4(1): 59–64. doi: 10.1016/0302-3524(76)90006-2
|
| [61] |
Peng T H, Takahashi T, Broecker W S. 1974. Surface radon measurements in the North Pacific Ocean station Papa. Journal of Geophysical Research, 79(12): 1772–1780. doi: 10.1029/JC079i012p01772
|
| [62] |
Pilson M E Q. 1998. An Introduction to the Chemistry of the Sea. Upper Saddle River, New Jersey: Prentice Hall
|
| [63] |
Ray R, Baum A, Rixen T, et al. 2018. Exportation of dissolved (inorganic and organic) and particulate carbon from mangroves and its implication to the carbon budget in the Indian Sundarbans. Science of the Total Environment, 621: 535–547. doi: 10.1016/j.scitotenv.2017.11.225
|
| [64] |
Reithmaier G M S, Chen Xiaogang, Santos I R, et al. 2021. Rainfall drives rapid shifts in carbon and nutrient source-sink dynamics of an urbanised, mangrove-fringed estuary. Estuarine, Coastal and Shelf Science, 249: 107064. doi: 10.1016/j.ecss.2020.107064
|
| [65] |
Rocha C, Wilson J, Scholten J, et al. 2015. Retention and fate of groundwater-borne nitrogen in a coastal bay (Kinvara Bay, Western Ireland) during summer. Biogeochemistry, 125(2): 275–299. doi: 10.1007/s10533-015-0116-1
|
| [66] |
Rodellas V, Garcia-Orellana J, Trezzi G, et al. 2017. Using the radium quartet to quantify submarine groundwater discharge and porewater exchange. Geochimica et Cosmochimica Acta, 196: 58–73. doi: 10.1016/j.gca.2016.09.016
|
| [67] |
Sadat-Noori M, Maher D T, Santos I R. 2016. Groundwater discharge as a source of dissolved carbon and greenhouse gases in a subtropical estuary. Estuaries and Coasts, 39(3): 639–656. doi: 10.1007/s12237-015-0042-4
|
| [68] |
Sadat-Noori M, Tait D R, Maher D T, et al. 2018. Greenhouse gases and submarine groundwater discharge in a Sydney Harbour embayment (Australia). Estuarine, Coastal and Shelf Science, 207: 499–509. doi: 10.1016/j.ecss.2017.05.020
|
| [69] |
Santos I R, Chen X, Lecher A L, et al. 2021. Submarine groundwater discharge impacts on coastal nutrient biogeochemistry. Nature Reviews Earth & Environment, 2(5): 307–323
|
| [70] |
Santos I R, Cook P L M, Rogers L, et al. 2012a. The “salt wedge pump”: convection-driven pore-water exchange as a source of dissolved organic and inorganic carbon and nitrogen to an estuary. Limnology and Oceanography, 57(5): 1415–1426. doi: 10.4319/lo.2012.57.5.1415
|
| [71] |
Santos I R, de Weys J, Tait D R, et al. 2013. The contribution of groundwater discharge to nutrient exports from a coastal catchment: post-flood seepage increases estuarine N/P ratios. Estuaries and Coasts, 36(1): 56–73. doi: 10.1007/s12237-012-9561-4
|
| [72] |
Santos I R, Eyre B D, Huettel M. 2012b. The driving forces of porewater and groundwater flow in permeable coastal sediments: a review. Estuarine, Coastal and Shelf Science, 98: 1–15. doi: 10.1016/j.ecss.2011.10.024
|
| [73] |
Santos I R, Maher D T, Larkin R, et al. 2019. Carbon outwelling and outgassing vs. burial in an estuarine tidal creek surrounded by mangrove and saltmarsh wetlands. Limnology and Oceanography, 64(3): 996–1013. doi: 10.1002/lno.11090
|
| [74] |
Shi Xiangming, Benitez-Nelson C R, Cai Pinghe, et al. 2019. Development of a two-layer transport model in layered muddy-permeable marsh sediments using 224Ra-228Th disequilibria. Limnology and Oceanography, 64(4): 1672–1687. doi: 10.1002/lno.11143
|
| [75] |
Slomp C P, Van Cappellen P. 2004. Nutrient inputs to the coastal ocean through submarine groundwater discharge: controls and potential impact. Journal of Hydrology, 295(1–4): 64–86. doi: 10.1016/j.jhydrol.2004.02.018
|
| [76] |
Su Ni, Burnett W C, MacIntyre H L, et al. 2014. Natural radon and radium isotopes for assessing groundwater discharge into Little Lagoon, AL: implications for harmful algal blooms. Estuaries and Coasts, 37(4): 893–910. doi: 10.1007/s12237-013-9734-9
|
| [77] |
Sugimoto R, Honda H, Kobayashi S, et al. 2016. Seasonal changes in submarine groundwater discharge and associated nutrient transport into a tideless semi-enclosed embayment (Obama Bay, Japan). Estuaries and Coasts, 39(1): 13–26. doi: 10.1007/s12237-015-9986-7
|
| [78] |
Szymczycha B, Maciejewska A, Winogradow A, et al. 2014. Could submarine groundwater discharge be a significant carbon source to the southern Baltic Sea?. Oceanologia, 56(2): 327–347. doi: 10.5697/oc.56-2.327
|
| [79] |
Taillardat P, Willemsen P, Marchand C, et al. 2018. Assessing the contribution of porewater discharge in carbon export and CO2 evasion in a mangrove tidal creek (Can Gio, Vietnam). Journal of hydrology, 563: 303–318. doi: 10.1016/j.jhydrol.2018.05.042
|
| [80] |
Tait D R, Maher D T, Macklin P A, et al. 2016. Mangrove pore water exchange across a latitudinal gradient. Geophysical Research Letters, 43(7): 3334–3341. doi: 10.1002/2016GL068289
|
| [81] |
Tamborski J J, Cochran J K, Bokuniewicz H J. 2017. Submarine groundwater discharge driven nitrogen fluxes to Long Island Sound, NY: terrestrial vs. marine sources. Geochimica et Cosmochimica Acta, 218: 40–57. doi: 10.1016/j.gca.2017.09.003
|
| [82] |
Tan Ehui, Wang Guizhi, Moore W S, et al. 2018. Shelf-Scale submarine groundwater discharge in the northern South China Sea and East China Sea and its geochemical impacts. Journal of Geophysical Research: Oceans, 123(4): 2997–3013. doi: 10.1029/2017JC013405
|
| [83] |
Tang Jianwu, Ye Shufeng, Chen Xuechu, et al. 2018. Coastal blue carbon: concept, study method, and the application to ecological restoration. Science China Earth Sciences, 61(6): 637–646. doi: 10.1007/s11430-017-9181-x
|
| [84] |
Taniguchi M, Dulai H, Burnett K M, et al. 2019. Submarine groundwater discharge: updates on its measurement techniques, geophysical drivers, magnitudes, and effects. Frontiers in Environmental Science, 7: 141. doi: 10.3389/fenvs.2019.00141
|
| [85] |
Tobias C, Neubauer S C. 2019. Salt marsh biogeochemistry—an overview. In: Perillo G M E, Wolanski E, Cahoon D R, et al, eds. Coastal Wetlands. 2nd ed. Amsterdam, the Netherlands: Elsevier, 539−596
|
| [86] |
Tse K C, Jiao J J. 2008. Estimation of submarine groundwater discharge in plover cove, Tolo harbour, Hong Kong by 222Rn. Marine Chemistry, 111(3–4): 160–170. doi: 10.1016/j.marchem.2008.04.012
|
| [87] |
Urquidi-Gaume M, Santos I R, Lechuga-Deveze C. 2016. Submarine groundwater discharge as a source of dissolved nutrients to an arid coastal embayment (La Paz, Mexico). Environmental Earth Sciences, 75(2): 154. doi: 10.1007/s12665-015-4891-8
|
| [88] |
Wang Guizhi, Han Aiqin, Chen Liwen, et al. 2018a. Fluxes of dissolved organic carbon and nutrients via submarine groundwater discharge into subtropical Sansha Bay, China. Estuarine, Coastal and Shelf Science, 207: 269–282. doi: 10.1016/j.ecss.2018.04.018
|
| [89] |
Wang Guizhi, Jing Wenping, Wang Shuling, et al. 2014. Coastal acidification induced by tidal-driven submarine groundwater discharge in a coastal coral reef system. Environmental Science & Technology, 48(22): 13069–13075
|
| [90] |
Wang Xuejing, Li Hailong, Zhang Yan, et al. 2019. Submarine groundwater discharge revealed by 222Rn: comparison of two continuous on-site 222Rn-in-water measurement methods. Hydrogeology Journal, 27(5): 1879–1887. doi: 10.1007/s10040-019-01988-z
|
| [91] |
Wang Xuejing, Li Hailong, Zheng Chunmiao, et al. 2018b. Submarine groundwater discharge as an important nutrient source influencing nutrient structure in coastal water of Daya Bay, China. Geochimica et Cosmochimica Acta, 225: 52–65. doi: 10.1016/j.gca.2018.01.029
|
| [92] |
Wang Xilong, Su Kaijun, Chen Xiaogang, et al. 2021. Submarine groundwater discharge-driven nutrient fluxes in a typical mangrove and aquaculture bay of the Beibu Gulf, China. Marine Pollution Bulletin, 168: 112500. doi: 10.1016/j.marpolbul.2021.112500
|
| [93] |
Wang Guizhi, Wang Zhangyong, Zhai Weidong, et al. 2015. Net subterranean estuarine export fluxes of dissolved inorganic C, N, P, Si, and total alkalinity into the Jiulong River estuary, China. Geochimica et Cosmochimica Acta, 149: 103–114. doi: 10.1016/j.gca.2014.11.001
|
| [94] |
Wen Tingyu. 2013. Estimating submarine groundwater discharge via radon isotope: the case of Sanggou Bay and Xiangshan, China (in Chinese)[dissertation]. Shanghai: East China Normal University
|
| [95] |
White D S, Howes B L. 1994. Long-term 15N-nitrogen retention in the vegetated sediments of a New England salt marsh. Limnology and Oceanography, 39(8): 1878–1892. doi: 10.4319/lo.1994.39.8.1878
|
| [96] |
Xiao Kai, Li Gang, Li Hailong, et al. 2019. Combining hydrological investigations and radium isotopes to understand the environmental effect of groundwater discharge to a typical urbanized estuary in China. Science of the Total Environment, 695: 133872. doi: 10.1016/j.scitotenv.2019.133872
|
| [97] |
Xiao Kai, Wilson A M, Li Hailong, et al. 2021. Large CO2 release and tidal flushing in salt marsh crab burrows reduce the potential for blue carbon sequestration. Limnology and Oceanography, 66(1): 14–29. doi: 10.1002/lno.11582
|
| [98] |
Xin P, Jin Guangqiu, Li Ling, et al. 2009. Effects of crab burrows on pore water flows in salt marshes. Advances in Water Resources, 32(3): 439–449. doi: 10.1016/j.advwatres.2008.12.008
|
| [99] |
Xu Bochao, Xia Dong, Burnett W C, et al. 2014. Natural 222Rn and 220Rn indicate the impact of the Water-Sediment Regulation Scheme (WSRS) on submarine groundwater discharge in the Yellow River estuary, China. Applied Geochemistry, 51: 79–85. doi: 10.1016/j.apgeochem.2014.09.018
|
| [100] |
Yang Shilun. 1999. A study of coastal morphodynamics on the muddy islands in the Changjiang River estuary. Journal of Coastal Research, 15(1): 32–44
|
| [101] |
Ye Qi, Liu Jianan, Du Jinzhou, et al. 2016. Bacterial diversity in submarine groundwater along the coasts of the Yellow Sea. Frontiers in Microbiology, 6: 1519
|
| [102] |
Yi Lixin, Ma Bo, Liu Lingling, et al. 2016. Simulation of groundwater-seawater interaction in the coastal surficial aquifer in Bohai Bay, Tianjin, China. Estuarine, Coastal and Shelf Science, 177: 20–30. doi: 10.1016/j.ecss.2016.05.006
|
| [103] |
Young M B, Gonneea M E, Herrera-Silveira J, et al. 2005. Export of dissolved and particulate carbon and nitrogen from a mangrove-dominated lagoon, Yucatan Peninsula, Mexico. International Journal of Ecology and Environmental Sciences, 31(3): 189–202
|
| [104] |
Zhang Lei. 2007. Radium isotopes in Changjiang River Estuary/East China Sea and their application in analysis of mixing among multiple water masses (in Chinese)[dissertation]. Shanghai: East China Normal University
|
| [105] |
Zhang Yan, Li Hailong, Wang Xuejing, et al. 2016. Estimation of submarine groundwater discharge and associated nutrient fluxes in eastern Laizhou Bay, China using 222Rn. Journal of Hydrology, 533: 103–113. doi: 10.1016/j.jhydrol.2015.11.027
|
| [106] |
Zhang Jing, Liu Sumei, Ren Jingling, et al. 2007. Nutrient gradients from the eutrophic Changjiang (Yangtze River) Estuary to the oligotrophic Kuroshio waters and re-evaluation of budgets for the East China Sea Shelf. Progress in Oceanography, 74(4): 449–478. doi: 10.1016/j.pocean.2007.04.019
|
| [107] |
Zhang Longjun, Xue Ming, Wang Min, et al. 2014. The spatiotemporal distribution of dissolved inorganic and organic carbon in the main stem of the Changjiang (Yangtze) River and the effect of the Three Gorges Reservoir. Journal of Geophysical Research: Biogeosciences, 119(5): 741–757. doi: 10.1002/2012JG002230
|
| 1. | Zhengtao Sun, Xiaogang Chen, Peiyuan Zhu, et al. Unveiling the role of saltmarshes as coastal potassium sinks: A perspective from porewater-derived potassium exchange. Science of The Total Environment, 2025, 963: 178535. doi:10.1016/j.scitotenv.2025.178535 | |
| 2. | Ziying He, Lili Zhao, Xueyin Zhuang, et al. Tidally driven porewater exchange and the key affecting factors in mangroves in the Pearl River Estuary, China. Journal of Sea Research, 2025, 204: 102572. doi:10.1016/j.seares.2025.102572 | |
| 3. | Xiaogang Chen, Shan Jiang, Peiyuan Zhu, et al. Saltmarshes as selective nutrient filters: Insights from groundwater-derived nutrient exchange. Journal of Hydrology, 2024, 633: 130945. doi:10.1016/j.jhydrol.2024.130945 | |
| 4. | Xiaogang Chen, Isaac R. Santos, Lucheng Zhan, et al. Large porewater exchange reshapes saltmarsh carbon and greenhouse gas budgets on local and global scales. Science China Earth Sciences, 2024, 67(7): 2195. doi:10.1007/s11430-023-1305-6 | |
| 5. | 小刚 陈, R. SANTOS Isaac, 泸成 詹, et al. 间隙水交换重塑区域和全球盐沼的碳和温室气体收支. SCIENTIA SINICA Terrae, 2024. doi:10.1360/N072023-0170 | |
| 6. | Zhaoxi Liu, Mingchen Ge, Qianqian Wang, et al. Spatial distribution and export of nutrients and metal elements in the subterranean estuary of Daya Bay. Acta Oceanologica Sinica, 2023, 42(8): 77. doi:10.1007/s13131-023-2212-8 | |
| 7. | Fenfang Wang, Zeyang Lu, Yao Wang, et al. Porewater exchange drives the dissolved silicate export across the wetland‐estuarine continuum. Frontiers in Marine Science, 2023, 10 doi:10.3389/fmars.2023.1206776 | |
| 8. | Tianyi Zhu, Bochao Xu, Xiaoyi Guo, et al. Submarine groundwater discharge and seasonal hypoxia off the Changjiang River Estuary. Acta Oceanologica Sinica, 2023, 42(8): 125. doi:10.1007/s13131-023-2256-9 | |
| 9. | Daniel M. Alongi. Current status and emerging perspectives of coastal blue carbon ecosystems. Carbon Footprints, 2023, 2(3) doi:10.20517/cf.2023.04 | |
| 10. | Xiaogang Chen, Peiyuan Zhu, Yan Zhang, et al. Plum rain enhances porewater greenhouse gas fluxes and weakens the acidification buffering potential in saltmarshes. Journal of Hydrology, 2023, 616: 128686. doi:10.1016/j.jhydrol.2022.128686 | |
| 11. | Xiaogang Chen, Qi Ye, Jinzhou Du, et al. Linking bacterial and archaeal community dynamics to related hydrological, geochemical and environmental characteristics between surface water and groundwater in a karstic estuary. Acta Oceanologica Sinica, 2023, 42(8): 158. doi:10.1007/s13131-023-2185-7 | |
| 12. | Pei Xin, Alicia Wilson, Chengji Shen, et al. Surface Water and Groundwater Interactions in Salt Marshes and Their Impact on Plant Ecology and Coastal Biogeochemistry. Reviews of Geophysics, 2022, 60(1) doi:10.1029/2021RG000740 | |
| 13. | Xiaogang Chen, Isaac R. Santos, Duofei Hu, et al. Pore‐water exchange flushes blue carbon from intertidal saltmarsh sediments into the sea. Limnology and Oceanography Letters, 2022, 7(4): 312. doi:10.1002/lol2.10236 | |
| 14. | Yvonne Y.Y. Yau, Pei Xin, Xiaogang Chen, et al. Alkalinity export to the ocean is a major carbon sequestration mechanism in a macrotidal saltmarsh. Limnology and Oceanography, 2022, 67(S2) doi:10.1002/lno.12155 | |
| 15. | Peiyuan Zhu, Xiaogang Chen, Yan Zhang, et al. Porewater-Derived Blue Carbon Outwelling and Greenhouse Gas Emissions in a Subtropical Multi-Species Saltmarsh. Frontiers in Marine Science, 2022, 9 doi:10.3389/fmars.2022.884951 |


Figures(6) / Tables(5)

Supported by:
Beijing Renhe Information Technology Co. Ltd

Xiaogang Chen, Jinzhou Du, Xueqing Yu, Xiaoxiong Wang. Porewater-derived dissolved inorganic carbon and nutrient fluxes in a saltmarsh of the Changjiang River Estuary[J]. Acta Oceanologica Sinica, 2021, 40(8): 32-43. doi: 10.1007/s13131-021-1797-z

| Station | 222Rn activity/ (Bq·m−3) | Temperature/ °C | Salinity | DO concentration/ (mg·L−1) | DIN concentration/ (μmol·L−1) | DIP concentration/ (μmol·L−1) | DSi concentration/ (μmol·L−1) | DIC concentration/ (μmol·L−1) |
| P1 | 1.69×10³ | 11.4 | 12.8 | 0.70 | 339 | 0.42 | 216 | 7.71×10³ |
| P2 | 3.09×10³ | 10.7 | 12.3 | 0.65 | 386 | 0.21 | 233 | 9.20×10³ |
| P3 | 2.63×10³ | 10.7 | 13.2 | 0.55 | 339 | 1.18 | 203 | 9.06×10³ |
| P4 | 1.59×10³ | 10.8 | 12.2 | 0.50 | 840 | 1.25 | 181 | 8.12×10³ |
| P5 | 3.67×10³ | 10.3 | 19.0 | 0.35 | 208 | 0.09 | 249 | 12.0×10³ |
| P6 | 4.20×10³ | 10.4 | 20.5 | 1.05 | – | – | – | – |
| P7 | 4.35×10³ | 11.4 | 9.9 | 1.66 | 12 | 0.07 | 184 | 11.5×10³ |
| P8 | 2.24×10³ | 9.8 | 12.1 | 3.32 | 130 | 0.03 | 185 | 7.09×10³ |
| P9 | 2.35×10³ | 12.3 | 1.4 | 0.73 | 13 | 0.08 | 194 | 8.27×10³ |
| Average | (2.87±0.97)×103 | 10.9±0.7 | 12.6±5.1 | 1.06±0.88 | 283±251 | 0.42±0.48 | 206±23 | (9.12±1.65)×103 |
DownLoad:
CSV
| Sources and sinks | 222Rn fluxes /(Bq·m−2·h−1) | Percentage to total 222Rn sources and sinks/% |
| Sources | ||
| 226Ra contribution | 0.13±0.02 | 0.2 |
| Sediment diffusion | 0.30±0.02 | 0.6 |
| Influx during flood tide | 5.56±3.74 | 11.2 |
| Porewater exchange flux | 43.8±42.4 | 88.0 |
| Sinks | ||
| 222Rn decay | 0.007±0.003 | 0.01 |
| Atmospheric evasion | 1.25±0.67 | 2.6 |
| Outflux during ebb tide | 6.90±2.89 | 14.4 |
| Mixing loss | 39.9±36.9 | 83.0 |
DownLoad:
CSV
| Study area | Ecosystem type | ${\rm {NO} }_2^- $ concentration /(μmol·L−1) | ${\rm {NH} }_4^+ $ concentration /(μmol·L−1) | ${\rm {NO} }_3^- $ concentration /(μmol·L−1) | DIN concentration /(μmol·L−1) | Reference |
| Yucatan Coast, Mexico | seagrass bed | 0.42 | 10.4 | 19.6 | 30.4 | Kantún-Manzano et al. (2018) |
| Laoye Lagoon, China | lagoon | 0.84 | 5.36 | 212 | 218 | Ji et al. (2013) |
| Sanggou Bay, China | bay | 0.73 | 1.17 | 1.64×10³ | 1.64×10³ | Wen (2013) |
| Shipu Bay, China | bay | 0.13 | 1.66 | 395 | 397 | Ji (2013) |
| La Paz, Mexico | bay | 0.47 | 4.80 | 122 | 127 | Urquidi-Gaume et al. (2016) |
| Sansha Bay, China | bay | 1.73 | 13.8 | 889 | 905 | Wang et al. (2018a) |
| Maowei Sea, China | bay/mangrove | 0.76 | 27.5 | 196 | 224 | Chen et al. (2018a) |
| Shengsi, China | sandy beach | 0.99 | 38.1 | 89.9 | 129 | Chen et al. (2019) |
| Yucatan Peninsula, Mexico | beach | 5.53 | 8.22 | 132 | 146 | Null et al. (2014) |
| Kinvara Bay, Ireland | bay/karst aquifer | 0.24 | 0.38 | 79.4 | 80.0 | Rocha et al. (2015) |
| Zaton Bay, Croatia | bay/anchialine cave | 0.09 | 0.89 | 164 | 165 | Chen et al. (2020a) |
| Yellow Sea, China | continental shelf/marginal sea | 0.42 | 7.72 | 182 | 190 | Ye et al. (2016) |
| Xiangshan, China | coastal aquifer | 0.24 | 2.18 | 325 | 327 | Wen (2013) |
| Chongming Dongtan, China | saltmarsh | 0.31 | 282 | 1.48 | 283 | this study |
DownLoad:
CSV
| Study area | Ecosystem type | DIC concentration/(mmol·L–1) | Reference |
| Western Port Bay, Australia | mangrove | 11.4 | Lee et al. (2016) |
| Watson Inlet, Australia | mangrove | 2.6 | Faber et al. (2014) |
| Chinaman Inlet, Australia | mangrove | 2.7 | Faber et al. (2014) |
| Blackwater River estuary, USA | mangrove | 4.62 | Atekwana et al. (2003) |
| Mangrove tidal creek, Australia | mangrove | 5.15 | Maher et al. (2013) |
| Haughton River Estuary, Australia | mangrove | 13.8 | Kristensen and Alongi (2006) |
| Ras Dege, Tanzania | mangrove | 2.82 | Bouillon et al. (2007) |
| Can Gio Mangrove Biosphere Reserve, Vietnam | mangrove | 4.86 | Taillardat et al. (2018) |
| Twin Cays, Belize | mangrove | about 12.5 | Lee et al. (2008) |
| Celestun Lagoon, Mexico | mangrove | 0.74−1.53 | Young et al. (2005) |
| Indian Sundarbans, India | mangrove | 2.18 | Ray et al. (2018) |
| Maowei Sea, China | mangrove | 1.6 | Chen et al. (2018b) |
| Rarotonga, Australia | coral reef | 0−3.06 | Cyronak et al. (2013) |
| Sanya Bay, China | coral reef | 1.44−2.54 | Wang et al. (2014) |
| Northern South China Sea | marginal sea | 4 | Liu et al. (2012) |
| Northern South China Sea | marginal sea | 4.71 | Tan et al. (2018) |
| East China Sea | marginal sea | 4.65 | Tan et al. (2018) |
| Waquoit Bay, USA | bay | 0.7−1.9 | Liu et al. (2017) |
| Sanggou Bay, China | bay | 0.07−0.12 | Jiang et al. (2015) |
| Bay of Puck, Poland | Bay | 5.38 | Szymczycha et al. (2014) |
| Had Head, Australia | estuary | 1.46 | Sadat-Noori et al. (2016) |
| Jiulong River Estuary, China | estuary | 0.5−1.4 | Wang et al. (2015) |
| Zhujiang River Estuary | estuary | 1.2−19.5 | Cai et al. (2015) |
| Weitou Bay, China | sandy beach | 2.2−3.1 | Cai et al. (2020) |
| Okatee, USA | saltmarsh | 3.51−22.7 | Moore et al. (2006) |
| North Inlet, USA | saltmarsh | 2−12 | Cai et al. (2003) |
| Chongming Dongtan, China | saltmarsh | 8.65 | this study |
DownLoad:
CSV
| Study area | SGD/(106 mol·d–1) | River/(106 mol·d–1) | Ratio of SGD or porewater exchange to river | Reference | ||||||||
| DIN | DSi | DIC | DIN | DSi | DIC | DIN | DSi | DIC | ||||
| Chao Phraya River Estuary, Thailand | 0.19−0.48 | 0.11−0.65 | − | 0.49−2.3 | 0.26−4.3 | − | 0.21−0.40 | 0.15−0.44 | − | Burnett et al. (2007) | ||
| Yarra River Estuary, Australia | 0.01 | − | 0.23 | 0.04 | − | 0.41 | 0.25 | − | 0.55 | Santos et al. (2012a) | ||
| Caloosahatchee River Estuary, USA | 0.017 | − | − | 0.05 | − | − | 0.35 | − | − | Charette et al. (2013) | ||
| Tuckean Swamp, Australia | 0.005 | − | − | 0.013 | − | − | 0.41 | − | − | Santos et al. (2013) | ||
| Jiulong River Estuary, China | 0.88−4.8 | 1.5−7.9 | 13−72 | 11−20 | 10−22 | 35−58 | 0.14−0.32 | 0.07−0.19 | 0.24−1.1 | Wang et al. (2015) | ||
| Krka River Estuary, Croatia | 0.05−0.33 | 0.05−0.27 | 3.7−22 | 0.02 | 0.15 | 65.9 | 2.3−16.3 | 0.31−2.8 | 0.06−0.33 | Liu et al. (2019) | ||
| Urbanized Estuary, China | 0.18 | 0.069 | − | 0.61 | 0.093 | − | 0.3 | 0.7 | − | Xiao et al. (2019) | ||
| Zhujiang River Estuary, China | 8.2 | − | 115 | 33.4 | − | 649 | 0.25 | − | 0.18 | Cai et al. (2015) | ||
| Jiulong River Estuary, Chinaa | − | 1.4−1.5 | 34.6−85.4 | − | 6.2−12.6 | 28.1−39.5 | − | 0.11−0.23 | 1.2−2.4 | Hong et al. (2017) | ||
| Jiulong River Estuary, Chinab | − | 2.7−14.4 | 20.7−118 | − | 6.2−12.6 | 28.1−39.5 | − | 0.44−1.1 | 0.74−2.4 | Hong et al. (2017) | ||
| Chongming Dongtan, China | 9.72 | 5.56 | 390 | 83 | 118 | 2 190 | 0.12 | 0.05 | 0.18 | this study | ||
| Note: aporewater exchange; bSGD. | ||||||||||||
DownLoad:
CSV
| Station | 222Rn activity/ (Bq·m−3) | Temperature/ °C | Salinity | DO concentration/ (mg·L−1) | DIN concentration/ (μmol·L−1) | DIP concentration/ (μmol·L−1) | DSi concentration/ (μmol·L−1) | DIC concentration/ (μmol·L−1) |
| P1 | 1.69×10³ | 11.4 | 12.8 | 0.70 | 339 | 0.42 | 216 | 7.71×10³ |
| P2 | 3.09×10³ | 10.7 | 12.3 | 0.65 | 386 | 0.21 | 233 | 9.20×10³ |
| P3 | 2.63×10³ | 10.7 | 13.2 | 0.55 | 339 | 1.18 | 203 | 9.06×10³ |
| P4 | 1.59×10³ | 10.8 | 12.2 | 0.50 | 840 | 1.25 | 181 | 8.12×10³ |
| P5 | 3.67×10³ | 10.3 | 19.0 | 0.35 | 208 | 0.09 | 249 | 12.0×10³ |
| P6 | 4.20×10³ | 10.4 | 20.5 | 1.05 | – | – | – | – |
| P7 | 4.35×10³ | 11.4 | 9.9 | 1.66 | 12 | 0.07 | 184 | 11.5×10³ |
| P8 | 2.24×10³ | 9.8 | 12.1 | 3.32 | 130 | 0.03 | 185 | 7.09×10³ |
| P9 | 2.35×10³ | 12.3 | 1.4 | 0.73 | 13 | 0.08 | 194 | 8.27×10³ |
| Average | (2.87±0.97)×103 | 10.9±0.7 | 12.6±5.1 | 1.06±0.88 | 283±251 | 0.42±0.48 | 206±23 | (9.12±1.65)×103 |
| Sources and sinks | 222Rn fluxes /(Bq·m−2·h−1) | Percentage to total 222Rn sources and sinks/% |
| Sources | ||
| 226Ra contribution | 0.13±0.02 | 0.2 |
| Sediment diffusion | 0.30±0.02 | 0.6 |
| Influx during flood tide | 5.56±3.74 | 11.2 |
| Porewater exchange flux | 43.8±42.4 | 88.0 |
| Sinks | ||
| 222Rn decay | 0.007±0.003 | 0.01 |
| Atmospheric evasion | 1.25±0.67 | 2.6 |
| Outflux during ebb tide | 6.90±2.89 | 14.4 |
| Mixing loss | 39.9±36.9 | 83.0 |
| Study area | Ecosystem type | ${\rm {NO} }_2^- $ concentration /(μmol·L−1) | ${\rm {NH} }_4^+ $ concentration /(μmol·L−1) | ${\rm {NO} }_3^- $ concentration /(μmol·L−1) | DIN concentration /(μmol·L−1) | Reference |
| Yucatan Coast, Mexico | seagrass bed | 0.42 | 10.4 | 19.6 | 30.4 | Kantún-Manzano et al. (2018) |
| Laoye Lagoon, China | lagoon | 0.84 | 5.36 | 212 | 218 | Ji et al. (2013) |
| Sanggou Bay, China | bay | 0.73 | 1.17 | 1.64×10³ | 1.64×10³ | Wen (2013) |
| Shipu Bay, China | bay | 0.13 | 1.66 | 395 | 397 | Ji (2013) |
| La Paz, Mexico | bay | 0.47 | 4.80 | 122 | 127 | Urquidi-Gaume et al. (2016) |
| Sansha Bay, China | bay | 1.73 | 13.8 | 889 | 905 | Wang et al. (2018a) |
| Maowei Sea, China | bay/mangrove | 0.76 | 27.5 | 196 | 224 | Chen et al. (2018a) |
| Shengsi, China | sandy beach | 0.99 | 38.1 | 89.9 | 129 | Chen et al. (2019) |
| Yucatan Peninsula, Mexico | beach | 5.53 | 8.22 | 132 | 146 | Null et al. (2014) |
| Kinvara Bay, Ireland | bay/karst aquifer | 0.24 | 0.38 | 79.4 | 80.0 | Rocha et al. (2015) |
| Zaton Bay, Croatia | bay/anchialine cave | 0.09 | 0.89 | 164 | 165 | Chen et al. (2020a) |
| Yellow Sea, China | continental shelf/marginal sea | 0.42 | 7.72 | 182 | 190 | Ye et al. (2016) |
| Xiangshan, China | coastal aquifer | 0.24 | 2.18 | 325 | 327 | Wen (2013) |
| Chongming Dongtan, China | saltmarsh | 0.31 | 282 | 1.48 | 283 | this study |
| Study area | Ecosystem type | DIC concentration/(mmol·L–1) | Reference |
| Western Port Bay, Australia | mangrove | 11.4 | Lee et al. (2016) |
| Watson Inlet, Australia | mangrove | 2.6 | Faber et al. (2014) |
| Chinaman Inlet, Australia | mangrove | 2.7 | Faber et al. (2014) |
| Blackwater River estuary, USA | mangrove | 4.62 | Atekwana et al. (2003) |
| Mangrove tidal creek, Australia | mangrove | 5.15 | Maher et al. (2013) |
| Haughton River Estuary, Australia | mangrove | 13.8 | Kristensen and Alongi (2006) |
| Ras Dege, Tanzania | mangrove | 2.82 | Bouillon et al. (2007) |
| Can Gio Mangrove Biosphere Reserve, Vietnam | mangrove | 4.86 | Taillardat et al. (2018) |
| Twin Cays, Belize | mangrove | about 12.5 | Lee et al. (2008) |
| Celestun Lagoon, Mexico | mangrove | 0.74−1.53 | Young et al. (2005) |
| Indian Sundarbans, India | mangrove | 2.18 | Ray et al. (2018) |
| Maowei Sea, China | mangrove | 1.6 | Chen et al. (2018b) |
| Rarotonga, Australia | coral reef | 0−3.06 | Cyronak et al. (2013) |
| Sanya Bay, China | coral reef | 1.44−2.54 | Wang et al. (2014) |
| Northern South China Sea | marginal sea | 4 | Liu et al. (2012) |
| Northern South China Sea | marginal sea | 4.71 | Tan et al. (2018) |
| East China Sea | marginal sea | 4.65 | Tan et al. (2018) |
| Waquoit Bay, USA | bay | 0.7−1.9 | Liu et al. (2017) |
| Sanggou Bay, China | bay | 0.07−0.12 | Jiang et al. (2015) |
| Bay of Puck, Poland | Bay | 5.38 | Szymczycha et al. (2014) |
| Had Head, Australia | estuary | 1.46 | Sadat-Noori et al. (2016) |
| Jiulong River Estuary, China | estuary | 0.5−1.4 | Wang et al. (2015) |
| Zhujiang River Estuary | estuary | 1.2−19.5 | Cai et al. (2015) |
| Weitou Bay, China | sandy beach | 2.2−3.1 | Cai et al. (2020) |
| Okatee, USA | saltmarsh | 3.51−22.7 | Moore et al. (2006) |
| North Inlet, USA | saltmarsh | 2−12 | Cai et al. (2003) |
| Chongming Dongtan, China | saltmarsh | 8.65 | this study |
| Study area | SGD/(106 mol·d–1) | River/(106 mol·d–1) | Ratio of SGD or porewater exchange to river | Reference | ||||||||
| DIN | DSi | DIC | DIN | DSi | DIC | DIN | DSi | DIC | ||||
| Chao Phraya River Estuary, Thailand | 0.19−0.48 | 0.11−0.65 | − | 0.49−2.3 | 0.26−4.3 | − | 0.21−0.40 | 0.15−0.44 | − | Burnett et al. (2007) | ||
| Yarra River Estuary, Australia | 0.01 | − | 0.23 | 0.04 | − | 0.41 | 0.25 | − | 0.55 | Santos et al. (2012a) | ||
| Caloosahatchee River Estuary, USA | 0.017 | − | − | 0.05 | − | − | 0.35 | − | − | Charette et al. (2013) | ||
| Tuckean Swamp, Australia | 0.005 | − | − | 0.013 | − | − | 0.41 | − | − | Santos et al. (2013) | ||
| Jiulong River Estuary, China | 0.88−4.8 | 1.5−7.9 | 13−72 | 11−20 | 10−22 | 35−58 | 0.14−0.32 | 0.07−0.19 | 0.24−1.1 | Wang et al. (2015) | ||
| Krka River Estuary, Croatia | 0.05−0.33 | 0.05−0.27 | 3.7−22 | 0.02 | 0.15 | 65.9 | 2.3−16.3 | 0.31−2.8 | 0.06−0.33 | Liu et al. (2019) | ||
| Urbanized Estuary, China | 0.18 | 0.069 | − | 0.61 | 0.093 | − | 0.3 | 0.7 | − | Xiao et al. (2019) | ||
| Zhujiang River Estuary, China | 8.2 | − | 115 | 33.4 | − | 649 | 0.25 | − | 0.18 | Cai et al. (2015) | ||
| Jiulong River Estuary, Chinaa | − | 1.4−1.5 | 34.6−85.4 | − | 6.2−12.6 | 28.1−39.5 | − | 0.11−0.23 | 1.2−2.4 | Hong et al. (2017) | ||
| Jiulong River Estuary, Chinab | − | 2.7−14.4 | 20.7−118 | − | 6.2−12.6 | 28.1−39.5 | − | 0.44−1.1 | 0.74−2.4 | Hong et al. (2017) | ||
| Chongming Dongtan, China | 9.72 | 5.56 | 390 | 83 | 118 | 2 190 | 0.12 | 0.05 | 0.18 | this study | ||
| Note: aporewater exchange; bSGD. | ||||||||||||
 DownLoad: