CAS Key Laboratory of Gas Hydrate, Guangzhou Institute of Energy Conversion, Chinese Academy of Sciences, Guangzhou 510640, China
2.
Key Laboratroy of Submarine Geosciences & Second Institute of Oceanography, Ministry of Natural Resources, Hangzhou 310012, China
3.
School of Environmental and Chemical Engineering, Shanghai University, Shanghai 200444, China
4.
Institute of Environmental and Biogeochemistry (eBig), School of Earth Sciences, Zhejiang University, Hangzhou 310027, China
Funds:
The Key-Area Research and Development Program of Guangdong Province under contract No. 2020B1111010004; the Science and Technology Program of Guangzhou, China under contract Nos 201804010264 and 201804010372; the Guangdong MEPP Fund under contract No. GDOE[2019]A41; the National Natural Science Foundation of China under contract No. 91951201; the China Ocean Mineral Resources R&D Association Project under contract No. DY135-S2-1-05.
Hydrothermal venting has a profound effect on the chemical and biological properties of local and distal seawater and sediments. In this study, lipid biomarkers were analyzed to examine the potential influence of hydrothermal activity on the fate of organic matter (OM) in surface sediments around Tianxiu Hydrothermal Field in the Carlsberg Ridge (CR), Northwest Indian Ocean. By comparing the biomarker distributions of the samples with that of other typical hydrothermal sediments in the mid ocean ridge, it is shown that the location of the samples is not affected by the hydrothermal activity. The relatively low abundances of terrestrial n-alkyl lipids and riverine 1,15-C32 diol suggested a minor contribution of terrigenous OM to the study area. The bacteria contributed predominantly to sedimentary marine OM; however, other marine source organisms, e.g., eukaryotes (i.e., phytoplankton and fungi) could not be completely neglected. The marine-originated biomarkers showed significantly variable distributions between the two sediments, suggesting different dynamic physical and biogeochemical processes controlling the fate of marine OM. This study identified various diagnostic biomarkers (5,5-diethyl alkanes, diols and β-OH FAs), which may have significant environmental implications for future works in this region.
Hydrothermal venting, a common process along mid-ocean ridges, plays an important role in chemical and isotopic exchange between the heated seawater and oceanic basement, and has a profound effect on the chemical, physical and biological properties of local and distal seawater and sediments (Jannasch and Mottl, 1985; German et al., 1990; Elderfield and Schultz, 1996; Resing et al., 2015). Lipid biomarkers, due to their specificity and preservation virtue, form one group with high potential to trace organic matter (OM) origination, alteration and preservation under the influence of hydrothermal activity (Simoneit et al., 2004; Pancost et al., 2006; Blumenberg et al., 2007; Bradley et al., 2009; Li et al., 2011; Peng et al., 2011; Morgunova et al., 2012; McCollom et al., 2015; Pan et al., 2016, 2018). Based on these studies, the hydrothermal-induced biomarkers can be substantially subdivided into two major regimes, one involves hydrothermal-thriving microbe, such as (non-) isoprenoidal dialkyl glycerol diethers (DGDs), macrocyclic glycerol diethers (McGDs) and isoprenoid hydrocarbons (i.e., biphytane), and another involves hydrothermal-induced OM maturity, such as alkane-derived carbon preference index (CPI) and hopane-based ββ/(αβ+ββ+βα) and 22S/(22S+22R) ratios.
In this study, two surface sediments samples collected in the region of Tianxiu Hydrothermal Field during the Chinese DY49th cruise were investigated for their lipid biomarkers. The authors aim to understand whether these two samples have been influenced by the hydrothermal activities of Tianxiu Hydrothermal Field.
2.
Samples and methods
2.1
Study area and samples
In 2015, the first leg of China ocean voyage 33 carried out a comprehensive scientific investigation of the CR in the Northwest Indian Ocean. An active hydrothermal field was discovered at 3.683°N, 63.833°E and named as Tianxiu Hydrothermal Field. The Tianxiu Hydrothermal Field is ultramafic hosted and located in the south slope of the central rift valley of the CR in the Northwest Indian Ocean, about 5 km away from the central axis (Chen, 2019; Chen et al., 2020).
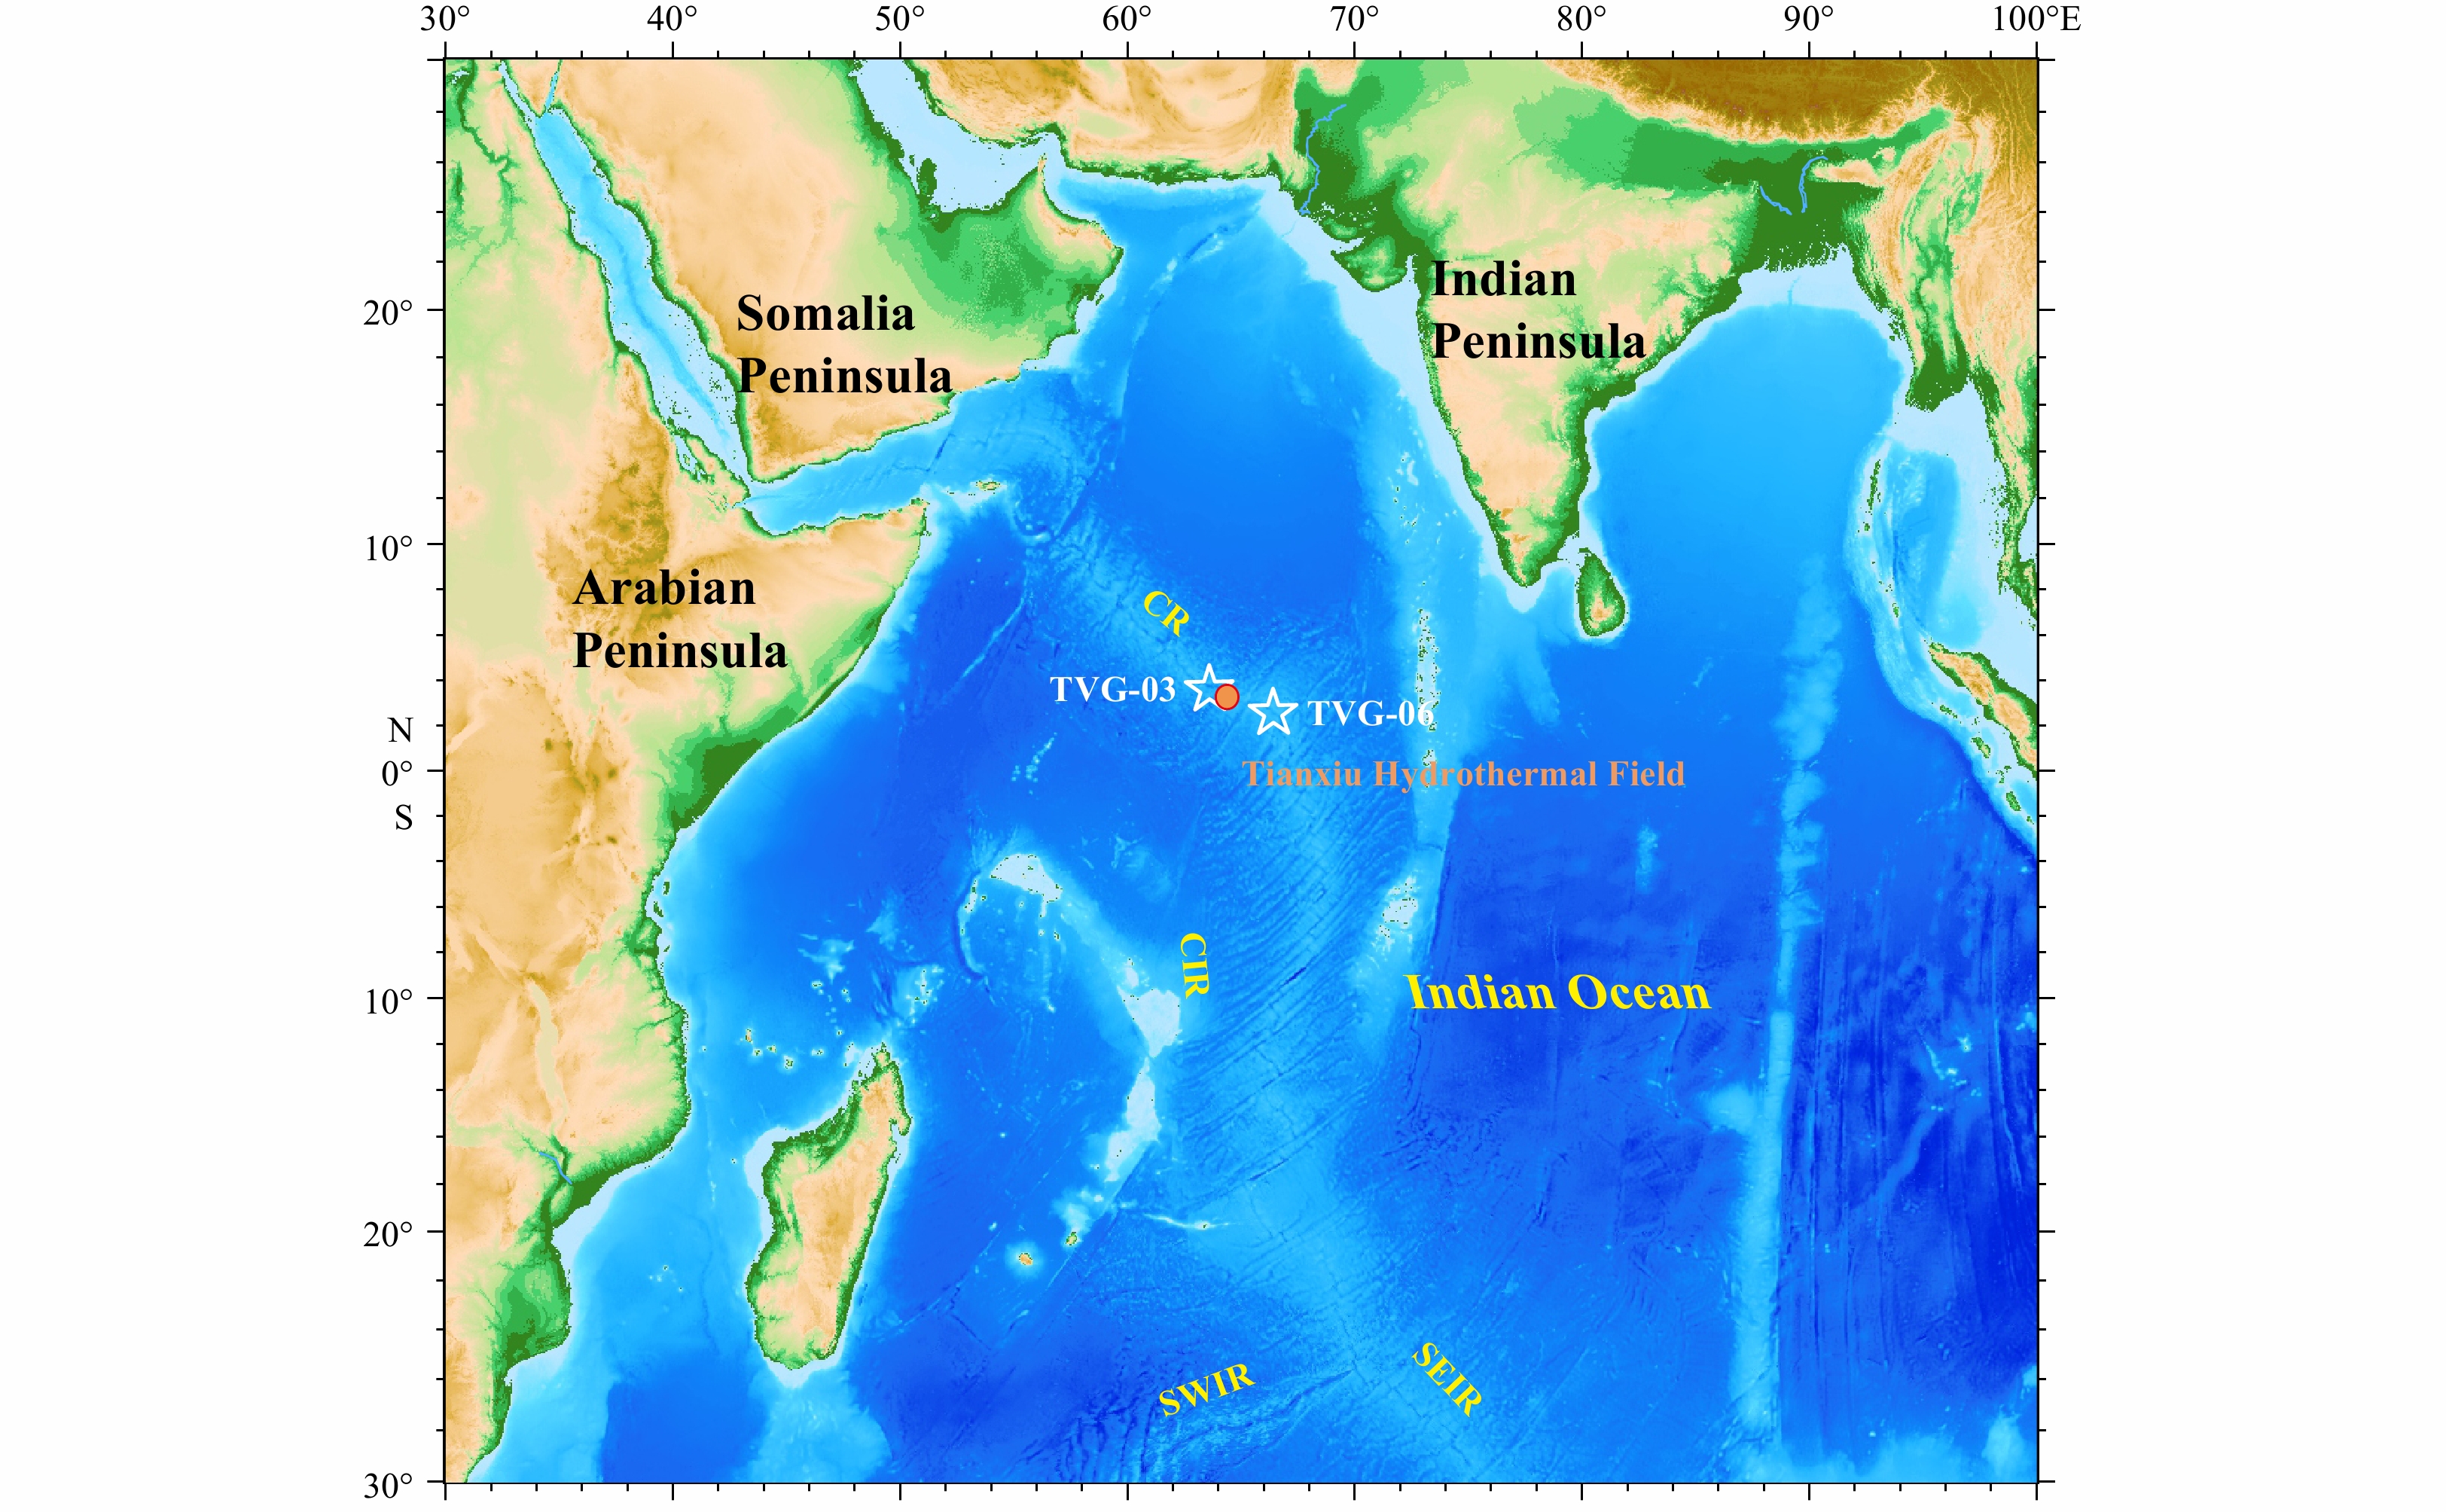
Two surface sediments (TVG-03, TVG-06) were collected using a TV-controlled grab in 2018 during Chinese DY49th cruise. Sampling sites are located 730 m and hundreds of kilometers away from Tianxiu Hydrothermal Field, respectively (Fig. 1) with a water depths of approximately 3 300–3 400 m. Sediment samples were immediately frozen and archived at −20°C until they were freeze-dried at −50°C in the laboratory, and then grounded with an agate mortar and pestle for further analyses.
Figure
1.
Geological location of sampling sites in the Carlsberg Ridge (CR). TVG-03 (3.692°N, 63.819°E) denotes near-filed/hydrothermal sediments (about 760 m away from Tianxiu Hydrothermal Field, 3.683°N, 63.833°E) and TVG-06 (2.653°N, 66.398°E) indicates far-filed sediments. Other Indian Ocean ridge systems include the Central Indian Ridge (CIR), the Southwest Indian Ridge (SWIR) and the Southeast Indian Ridge (SEIR).
The freeze-dried and powdered sediments were extracted with dichloromethane (DCM)/MeOH (93:7, V/V) for 72 h in a Soxhlet apparatus. The extraction was saponified with KOH/MeOH (1 mol/L), followed by separation of neutral fraction, acidification and filtration for fatty acid (FA) recovery. The neutral fraction containing alkanes and alcohols was converted to trimethylsilyl derivatives with bis (trimethylsilyl) trifluoroacetamide (BSTFA) prior to gas chromatography-mass spectrometry (GC-MS) analysis. The FAs were converted into FA methyl esters (FAMEs) with BF3/MeOH and extracted into hexane, further followed by conversion to trimethylsilyl derivatives with BSTFA prior to GC–MS analysis.
GC–MS analyses were performed in Guangzhou Geochemical Institute with a Thermo Scientific Trace gas chromatograph coupled to a Thermo Scientific DSQ II mass spectrometer. Separation was achieved with a 60 m×0.32 mm i.d. fused silica column (J & W HP-5) coated with a 0.25 μm film thickness. The oven temperature was programmed from 80°C (held 2 min) to 310°C (held 25 min) at 3°C/min. Helium was used as the carrier gas at 1.0 mL/min. The ion source was operated in the electron ionization (EI) mode at 70 eV, and a full scan mode in a range of m/z 50–750 was applied. Identification and quantification of lipid compounds were based on authentic standard compounds and their characteristic mass fragments, as well as published data in the literature (De Leeuw et al., 1995; Versteegh et al., 1997; Guan et al., 2013; Taube et al., 2013; Zhu et al., 2016; Mao et al., 2017).
3.
Results
3.1
Neutral lipids
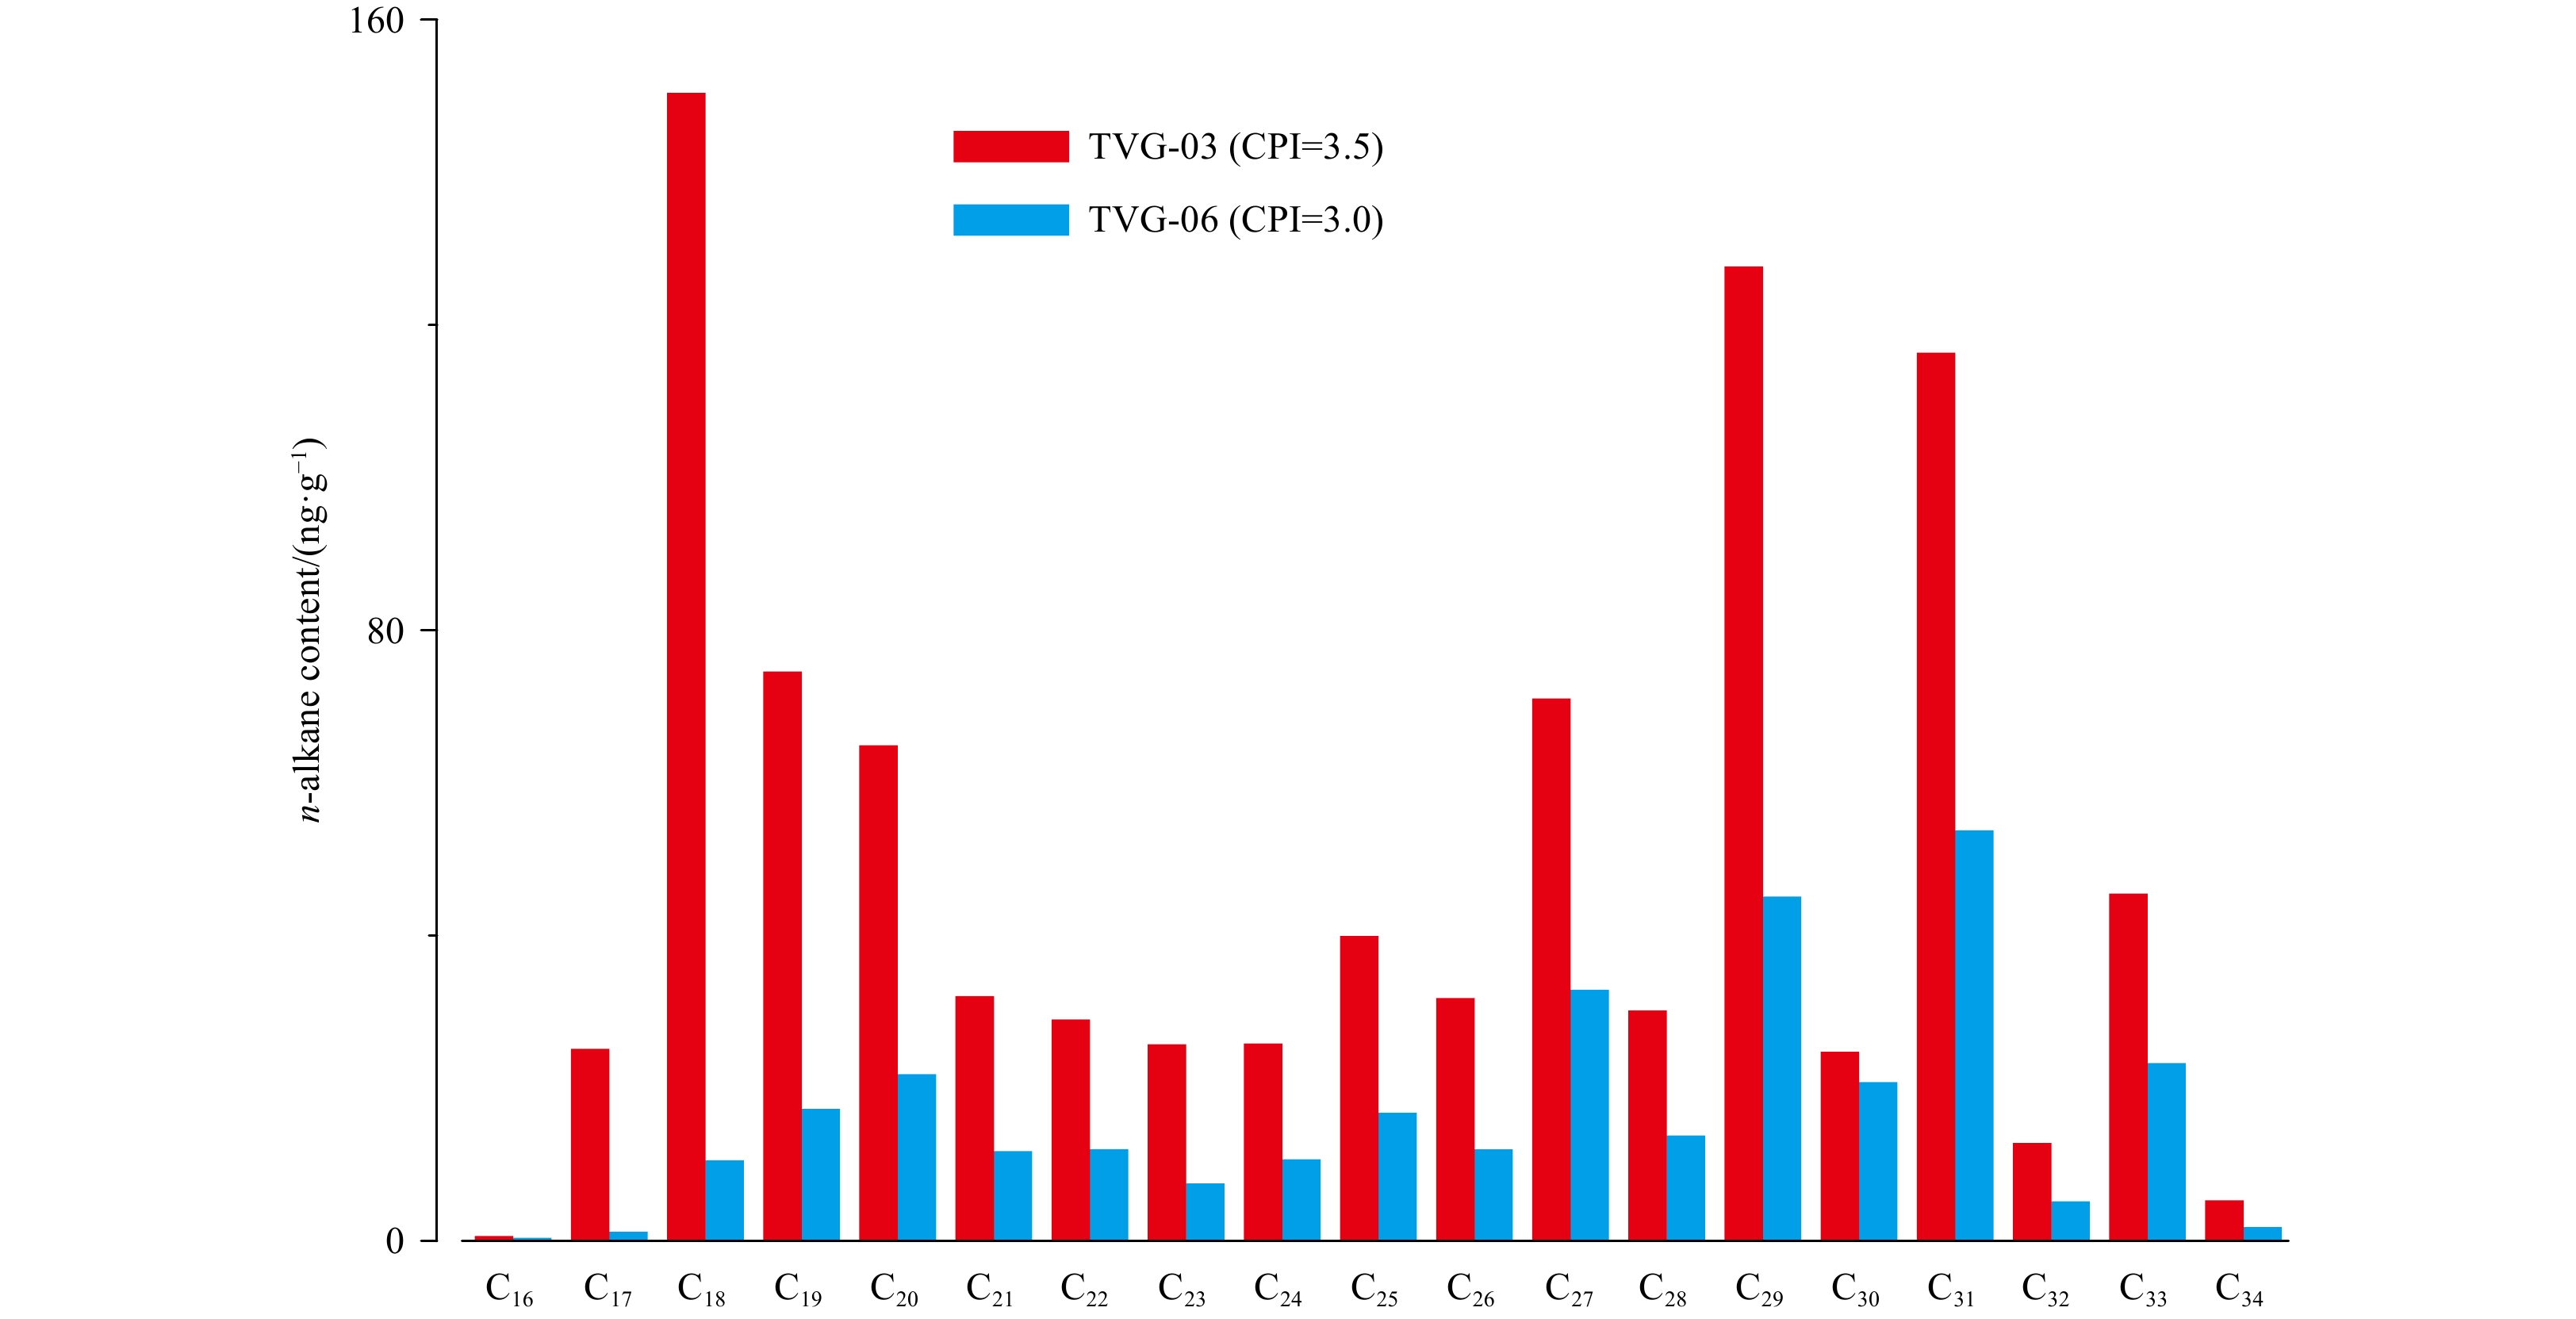
A series of alkanes, mainly including n-alkanes (C16–C34), isoprenoid alkanes (pristine and phytane, short as Pr and Ph, respectively), cyclopentyl alkanes (C16, C18 and C20) and 5,5-diethyl alkanes (odd carbon-numbered C19–C27), and a range of alcohols, mainly including n-alcohols (C14–C32), stanols (C27–C29), diols (C24, C26, C28, C30 and C32) and hopanols (C30–C33), were identified in the neutral fraction (Fig. 2). Substantially, the sample TVG-03 (1 575 ng/g dry sediment; as followed) contained remarkably more abundant alkane compounds than TVG-06 (362 ng/g) and the distribution of alkanes varied significantly between the two samples (Fig. 3; Tables 1 and 2). The C16–34n-alkanes (934 ng/g) were the major compounds with isoprenoid alkanes (551 ng/g) being the second most abundant components, followed by relative low abundances of C16–20 cyclopentyl alkanes (59 ng/g) and C19–27 5,5-diethyl alkanes (32 ng/g) in sample TVG-03 (Fig. 3, Table 1). Contrastively, C16–34n-alkanes (319 ng/g) were the solely dominant compounds, followed by C19–27 5,5-diethyl alkanes (18 ng/g) and C16–20 cyclopentyl alkanes (16 ng/g) with isoprenoid alkanes (10 ng/g) being the minimum components in sample TVG-06 (Fig. 3). In addtion, the n-alkanes showed a bimodal pattern with n-C18 alkane dominating short chain homologs and n-C29 alkane dominating long chain counterparts in sample TVG-03, whereas n-alkanes were predominated by long chain homologs and peaked at n-C31 alkane in sample TVG-06 (Fig. 4, Table 1).
Figure
2.
Partial total ion current trace of neutral fraction in TVG-03 (a) and -06 (b) surface sediments.
Figure
3.
Distribution of C16–34n-alkanes in TVG-03 and -06 surface sediments. CPI=0.5×[∑Odd(C25–C33)/∑Even(C24–C32)+∑Odd(C25–C33)/∑Even(C26–C34)] (Bray and Evans, 1961; Pan et al., 2018).
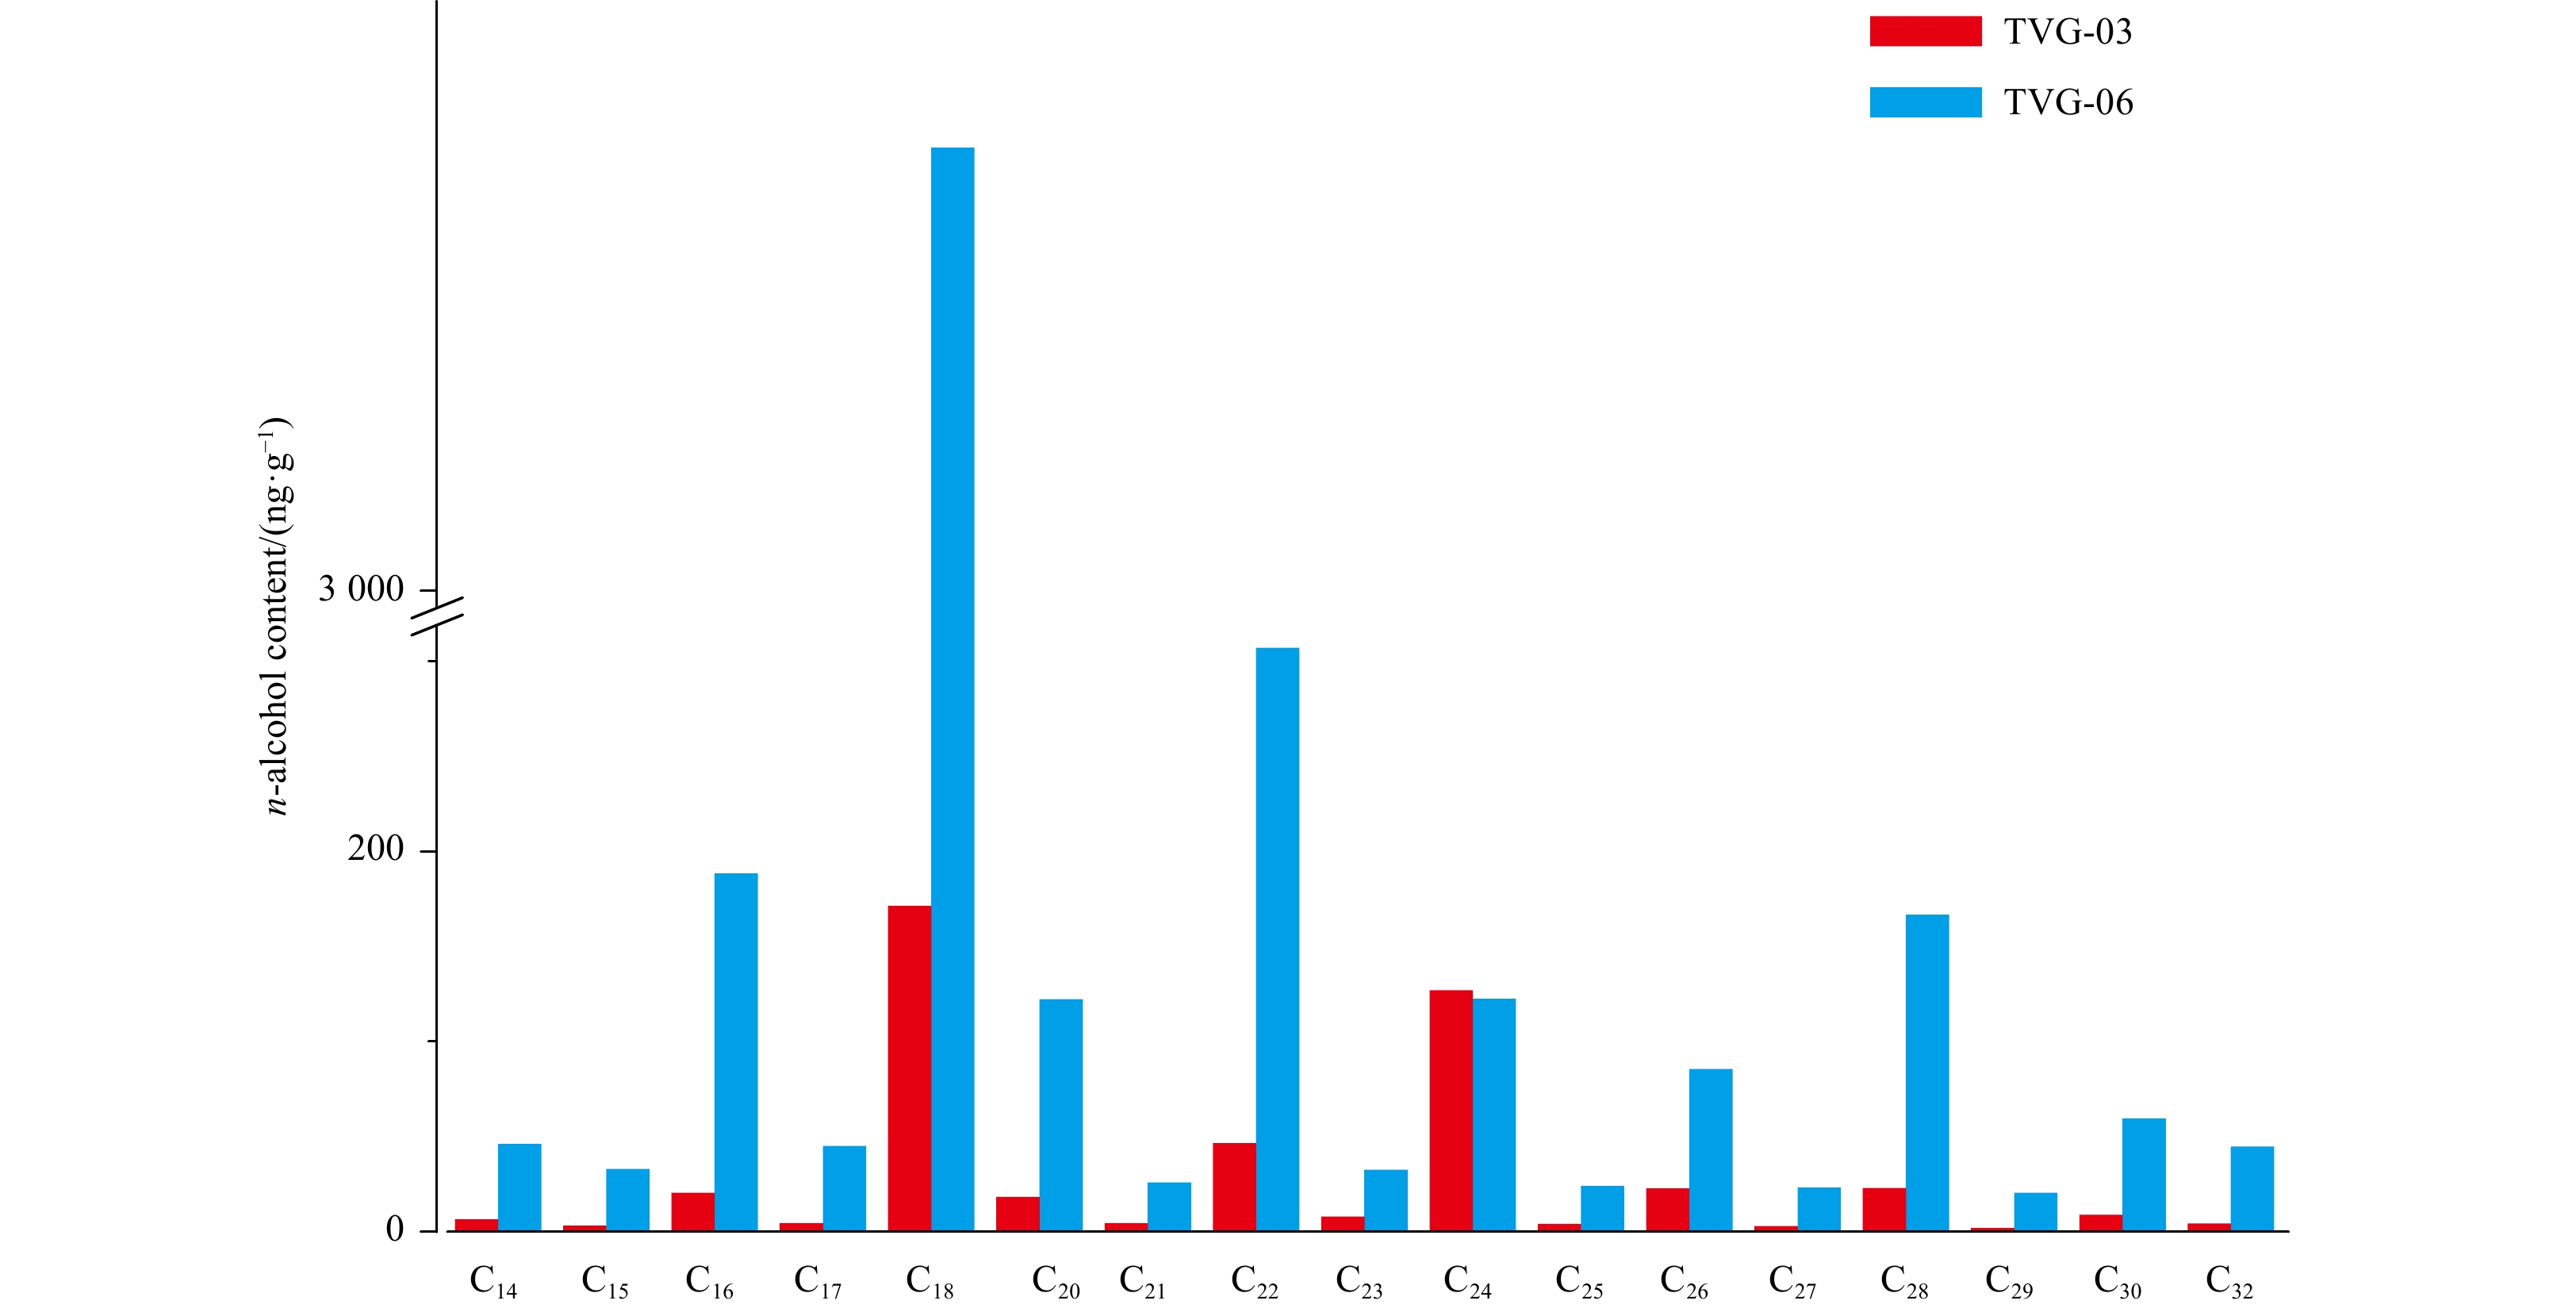
Sample TVG-06 (5173 ng/g) contained more alcohols than TVG-03 (675 ng/g). However, these compounds exhibited somewhat similar distributions for both sediment samples (Fig. 4, Table 2). The C14–32n-alcohols (481 ng/g and 4 364 ng/g for TVG-03 and -06, respectively; as followed) were the dominant compounds, followed by C24–32 diols (113 ng/g and 476 ng/g, respectively), C27–29 stanols (46 ng/g and 234 ng/g, respectively) and C30–33 hopanols (36 ng/g and 99 ng/g, respectively) (Fig. 4, Table 2). Moreover, the n-alcohols were predominated by short (i.e., C18) and middle (i.e., C22 or C24) chain homologs in the two sediments (Fig. 4).
3.2
FAs
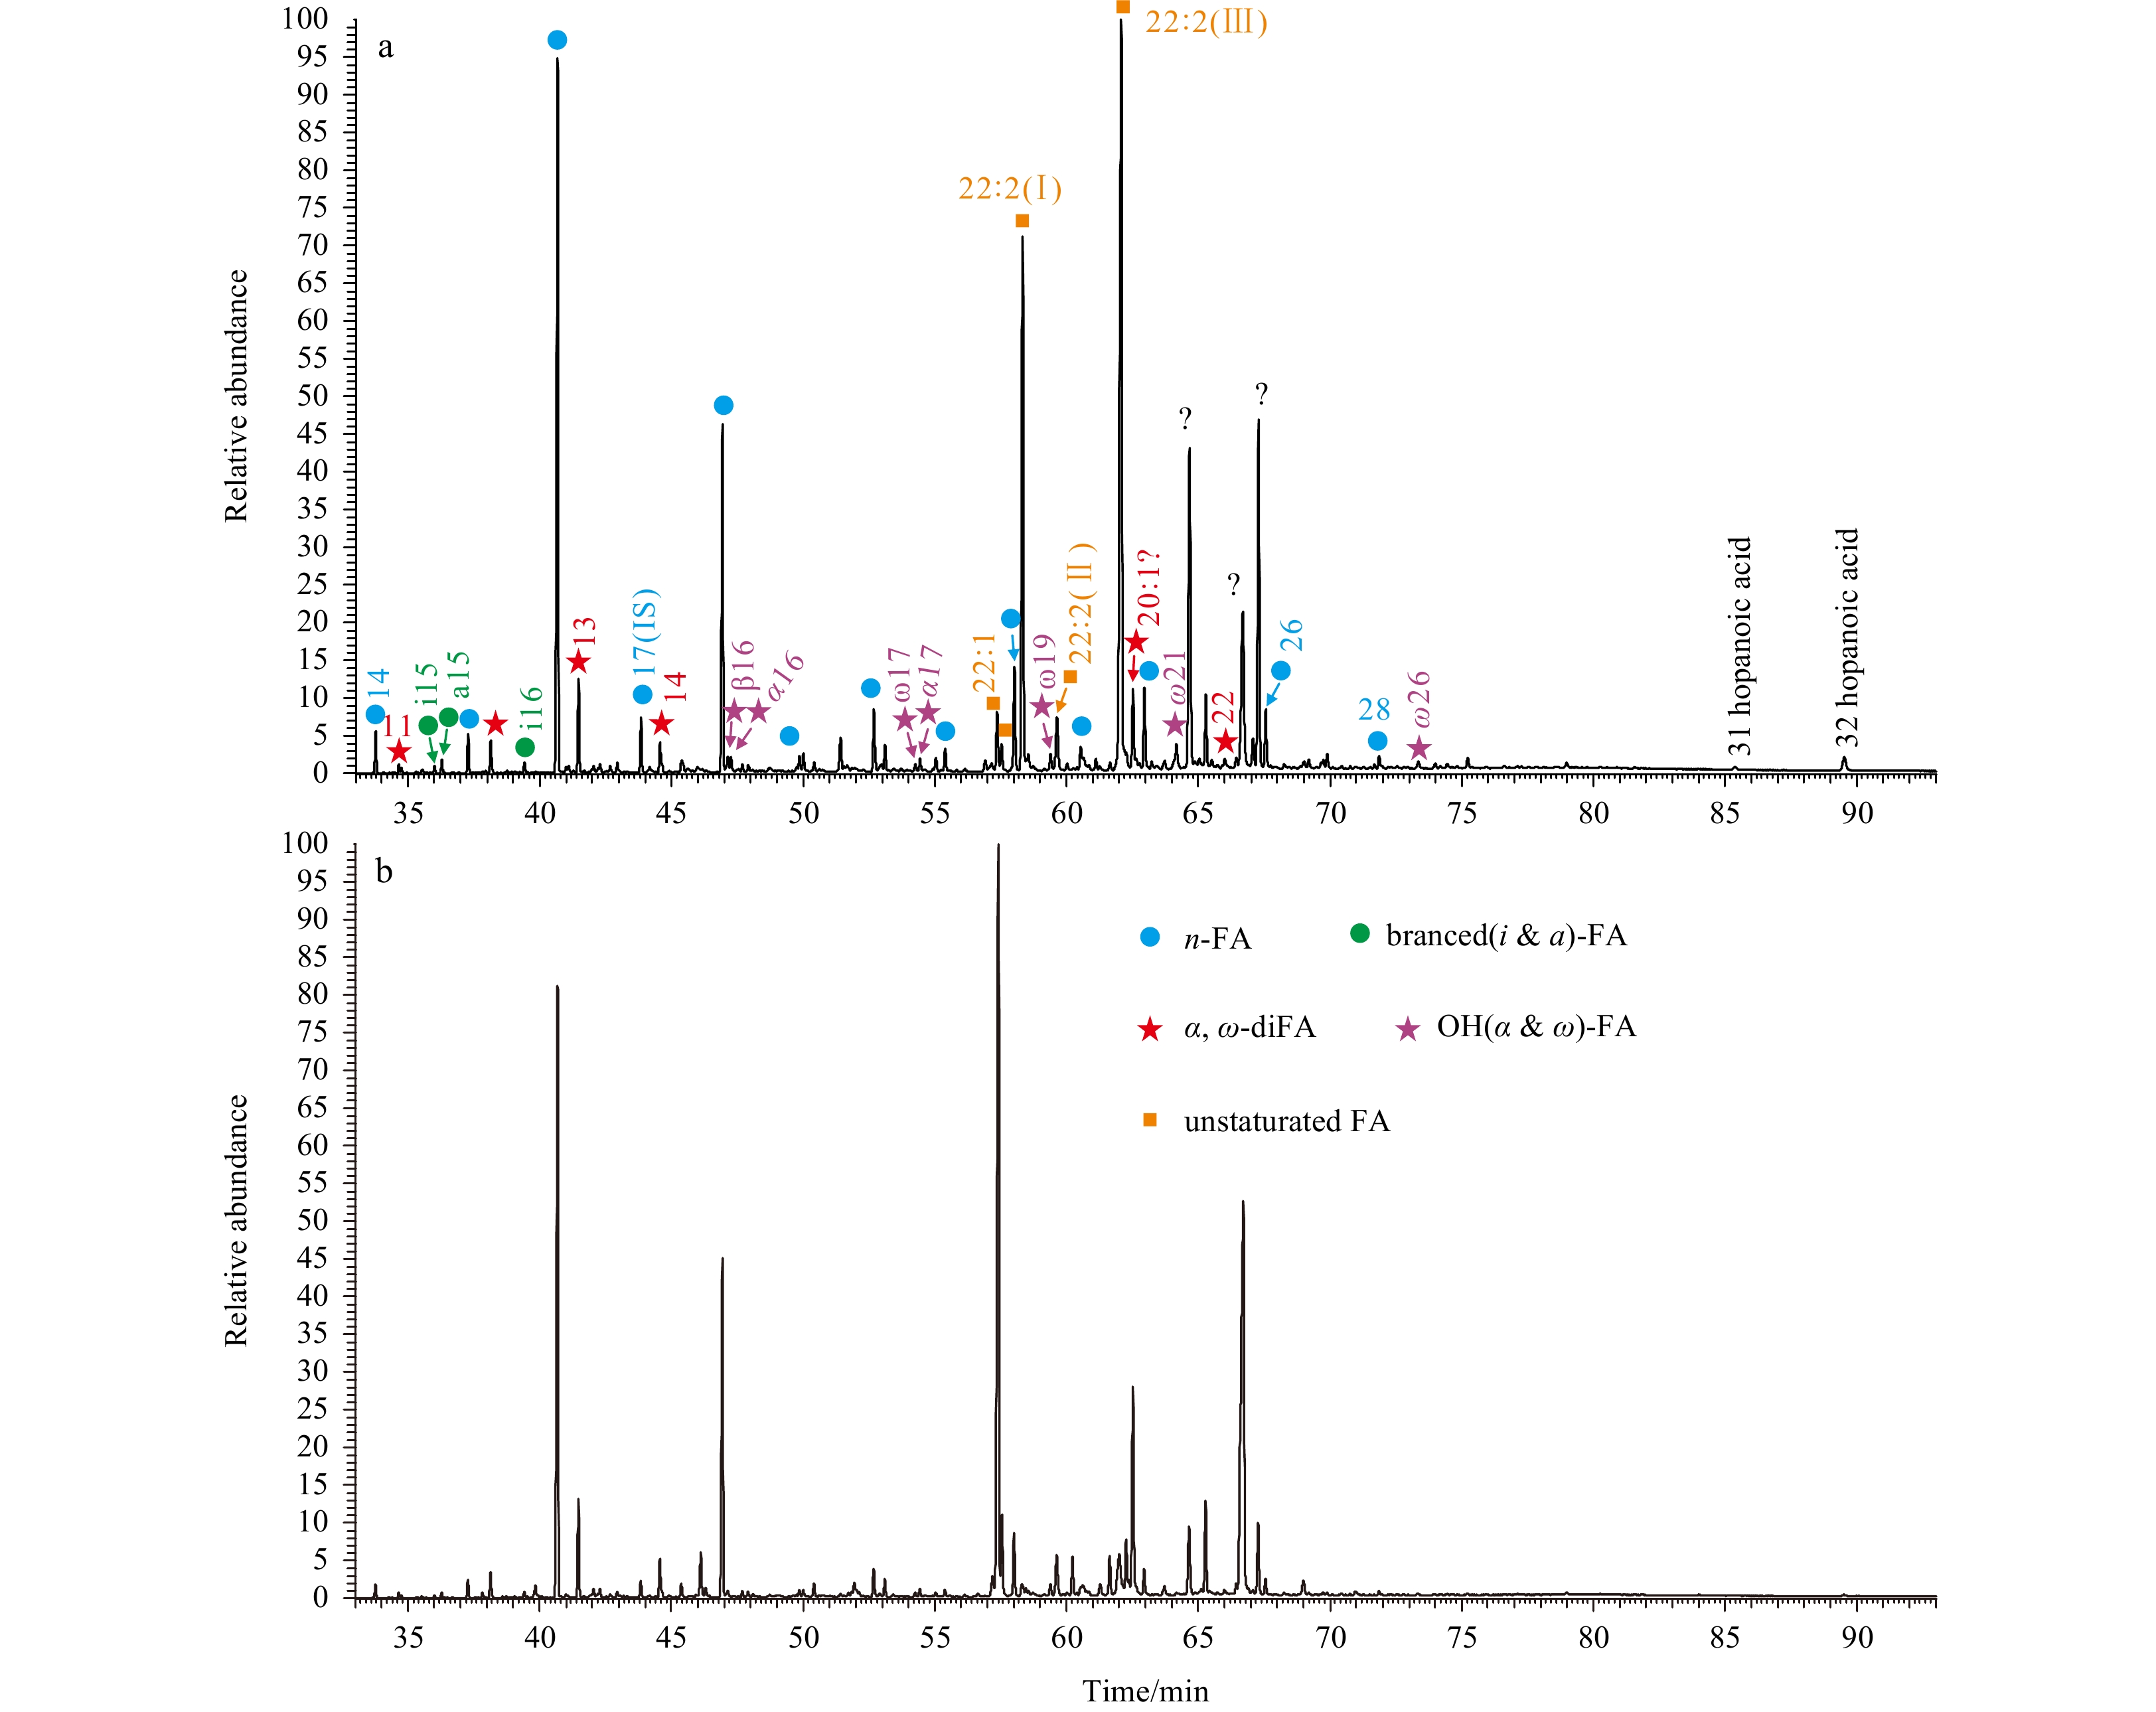
A great variaty of FAs, such as n-FAs, branched (i.e., iso- and anteiso-, short as i- and a-, resepctively) FAs, unsturated (i.e., mono- and poly-) FAs, α,ω-diacids, hydroxy (i.e., α- and β-) FAs and hopanoic acids were identified in the two sediments (Fig. 5). The FAs showed variable concentrations (1 466 ng/g and 2 017 ng/g for TVG-03 and -06, respectively; as followed), but displayed similar distributions for these two samples (Fig. 6, Table 3). The n-FAs were the predominating compounds (1 031 ng/g and 1 796 ng/g, respectively) followed by unsaturated FAs (310 ng/g and 150 ng/g, respectively), with other FAs, i.e., hydroxyl FAs (49 ng/g and 17 ng/g, respectively), branched FAs (31 ng/g and 30 ng/g, respectively), α,ω-diacids (42 ng/g and 24 ng/g, respectively) and hopanoic acids were minor components (Fig. 6, Table 3). In addition, the n-FAs were predominated by short (i.e., C16 and C18) chain homologs in the two sediments (Fig. 6).
Figure
5.
Partial total ion current trace of FA fractions in TVG-03 (a) and -06 (b) surface sediments.
4.1
Origin, transportation and preservation of sedimentary OM
The composition and distribution of lipid biomarkers showed prominently spatial variations (Figs 3, 4 and 6; Tables 1–3). It reflected different dynamic physical and biogeochemical processes, and origin (i.e., terrigenous and marine), transportation (i.e., aeolian and fluvial), and alternation (i.e., aerobic and anaerobic transformation) control the fate of OM in the studied sediments. The two samples contained three long chain (>C24) n-alkyl lipid classes with significantly variable concentration (Tables 1 and 2), i.e., more long chain n-alkanes in sample TVG-03, and more n-alcohols in sample TVG-06. The relatively or significantly low fractional abundances of terrestrial n-alkyl lipids suggested an insignificant (by n-alkanes) or minor (by n-alcohols and n-FAs) contribution of terrigenous OM to the sediments (Tables 1–3). This is caused by the long distance between the sampling sites and terrigenous sources (Fig. 1). The remoteness from any landmass could largely prevent fluvial transport of soil and riverine OM to sediments in the open ocean, as evidenced by the significantly low abundances of branched glycerol dialkyl glycerol tetraethers in previous studies (Fietz et al., 2013; Pan et al., 2016) and 1,15-C32 diol in these samples (≤1%, Table 2), respectively. Therefore, the relatively higher terrigenous OM input reconstructed by long chain n-alkyl lipids (Table 1) were more derived from terrestrial plants followed by aeolian transport over long distance, and it is similar to the Southwest Indian Ridge (Pan et al., 2018).
The higher abundances of short chain n-alkyl lipids, and branched (i- and a-), unsturated (mono- and poly-) and hydroxy (α-, β- and ω-) FAs, as well as hopanols and hopanoic acids (Tables 2 and 3) evidence a predominant contribution of bacterial source to sedimentary OM (Zelles, 1999; Fang et al., 2007; Tyagi et al., 2017; Guan et al., 2019). However, the composition of these bacterial biomarkers varied significantly. More short chain n-alkanes is in sample TVG-03, and more n-alcohols and n-FAs in sample TVG-06 (Figs 3, 4 and 6; Tables 1–3) which due to the large difference on bacterial community structures between these two sediments. The bacterial communities in sample TVG-06 were solely dominated by Proteobacteria, whereas Proteobacteria, Chloroflexi and Actinobacteria were predominant in sample TVG-03 (Xueping Chen, unpublished data). The dominance of Proteobacteria might be also responsible for the higher concentrations of C22:1ω9 FA (112 ng/g, Table 3) in sample TVG-06. Others, i.e., eukaryotes could also produce mono-unsaturated FAs (Cowie et al., 2009; Bühring et al., 2012). Moreover, a series of C22:2 FAs with unidentified double bonds occurred in both sediments (Fig. 5, Table 3), and showed significantly higher abundances in sample TVG-03. These FAs were derived from phototrophic eukaryotes (i.e., fungi), as these precursors could produce significant amounts of poly-unsaturated FAs (Fang et al., 2007; Bühring et al., 2012). Therefore, the abundant occurrence of C22:2 FAs (259 ng/g, Table 3) in sample TVG-03 suggest an important contribution of additional sources of eukaryotes other than prokaryotic bacteria to sedimentary OM.
The relative abundances of phytoplankton biomarkers, i.e., Ph in sample TVG-03 and middle chain n-alcohols in sample TVG-06 (Figs 3 and 4; Tables 1 and 2) indicated a considerable contribution of phytoplankton to sediments. The absence of other common phytoplankton biomarkers, i.e., diatom-produced Δ5- and Δ5,22-sterols with the occurrence of their corresponding Δ0- and Δ22-stanols (Table 2) suggested that phytoplankton-originated lipids might have experienced anaerobic transformation under anoxic environments (Wakeham, 1989). This was supported by the significantly low values of Pr/Ph (0.0–0.1), the absence of keto-ols (potential oxidation products of corresponding phytoplankton-produced diols; Ferreira et al., 2001) and the wide occurrence of 5,5-diethyl alkanes (Figs 2 and 3; Table 1), as these scenarios usually occurred in response to low redox potential (Ferreira et al., 2001; Kenig et al., 2003, 2005; Morgunova et al., 2012).
4.2
Other diagnostic biomarkers and implications
4.2.1
5,5-diethyl alkanes
The odd carbon-numbered 5,5-diethyl alkanes with carbon chain lengths between C19 and C27 were identified by a peak at C21 or C23 in the two sediments (Fig. 2, Table 1). The branched alkane series with exclusively odd carbon numbers have been discovered in various geological records, howerver, their biological sources remain uncertain. They are predominantly bacterial precursors, such as sulfide oxidizing bacteria (SOB) (Kenig et al., 2003, 2005; Simoneit et al., 2004). Here the occurrence of 5,5-diethyl alkanes corresponding with the absence of specific biomarkers (i.e., biphytane) from archea, as the case in Simoneit et al. (2004) suggeted their source organisms in relation to certain SOB, i.e., Sulfitobacter, as this SOB genus was predominant in sediments (Xueping Chen, unpublished data). Moreover, these compound series were an effective indicator to trace redox conditions in aquatic environments, as they were usually absent in oxygenated water columns but had high preservation potential related to anoxic environments (Kenig et al., 2003, 2005). The appearance of 5,5-diethyl alkanes was in high accordance with anoxic environments, as evidenced by significantly low values of Pr/Ph ratio and the absence of sterols and keto-ols, as discussed above. Future studies (i.e., core study) on the changes of 5,5-diethyl alkanes, intergated with other independent redox proxies, can apply to trace environmental changes in the geological past.
4.2.2
Diols (C28, C30 and C32)
A series of diols were identified with 1,15-C30 diol being the major diol (accounting for 78% and 88% of the total diols in sample TVG-03 and -06, respectively; as followed), followed by 1,14-diols (18% and 9%, respectively) and significantly low abundances of 1,13-diols and 1,15-C32 diol (Table 2). Several proxies have been defined based on their relative abundances, such as the LDI for annual mean sea surface temperature (SST) (Rampen et al., 2012), the diol index 1 and 2 for upwelling intensity or nutrient condition (Rampen et al., 2008; Willmott and Mysak, 2010) and the percentage of 1,15-C32 diol for riverine input (Lattaud et al., 2017). Here the feature of significantly low abundances of 1,15-C32 diol (≤1%; Table 2) strongly indicated a minor riverine contribution to the study area, and the influence of riverine diols on LDI-reconstructed SSTs could be largely ruled out (Lattaud et al., 2017; Rampen et al., 2012; Zhu et al., 2018, 2019). The LDI-reconstructed SSTs (26.3°C and 26.5°C in samples TVG-03 and -06, respectively; as followed) matched with local annual mean SSTs (about 26°C; Guo, 2015), suggesting that the LDI proxy is suitable for reconstruction of past annual mean SST in the study area. Moreover, values of diol index 2 (0.86 and 0.77, respectively) were significantly higher than diol index 1 (0.19 and 0.09, respectively). This distribution feature is similar to the values observed in other marine upwelling regions (Rampen et al., 2014; Zhu et al., 2018), suggesting diol index 2 as an effective proxy for upwelling intensity or nutrient condition over the region. However, further comprehensive investigation is required before this can be firmly established.
4.2.3
β-OH FAs
A series of β-OH FAs ranging from C12 to C18, including i-, a- and n- homologs were identified (Fig. 5). Despite of trace amounts, these compounds showed an even-over-odd predominance with n-C14 being the major component (Table 3). The short chain β-OH FAs are characteristic biomarkers of Gram-negative bacteria, which are ubiquitous in terrestrial and aquatic environments (Huguet et al., 2019; Wakeham et al., 2003; Wang et al., 2017). Several proxies have been obtained from their relative abundances, such as the RIAN index for soil pH, and the RAN15 and RAN17 indices for mean annual air temperature (Wang et al., 2017). These indicators have been applied to various terrestrial samples (Huguet et al., 2019; Wang et al., 2021); however, they have not been investigated and hence their accurate implications remain unclear in marine environments. Given the wide occurrence of β-OH FAs in marine sediments (Wakeham et al., 2003; this study), future works is needed to investigage their applicability to reconstruct certain marine environmental parameters, i.e., seawater pH and temperature, as applied in terrestrial environments.
4.3
Insignificant hydrothermal influence on lipid composition
The hydrothermal-influenced sediments can be clearly distinguished from background sediments (or normal pelagic sediments) by the presence of hydrothermal-thriving-microbes produced unique biomass and biomarker signatures. For instance, the isoprenoid biphytanes, typical biomarkers derived from diglycerol tetraether lipids in the membranes specifically of archaea (i.e., thermophilic archaea; Schouten, 1998) are discovered in hydrothermal sediments. These compounds are generally absent in the background samples from the Mid-Atlantic Ridge (Simoneit et al., 2004; Morgunova et al., 2012). Similarly, non-isoprenoidal DGDs, McGDs and archaeol, major membrane lipids of some thermophilic bacteria were detected in near-filed/hydrothermal deposits but not in far-field/normal marine sediments (Pancost et al., 2006; Bradley et al., 2009; Pan et al., 2016, 2018). Above diagnostic biomarkers were not detected in these two sediments (Figs 2 and 5), which suggest these sediment samples are largely normal pelagic sediments, in the absence of thermophilic archaea and bacteria (e.g., Aquificales; cf. Pan et al., 2018 and references therein) (Xueping Chen, unpublished data).
In addition to being distinguished from normal marine sediments by the presence of unique bacterial and archaeal biomarker signatures, hydrothermal sediments should also contain biomarkers that indicate the effect of thermal alteration. One widely accepted indicator is n-alkane CPI, with values <1.0 reflecting typical characteristics of thermal mature OM, and this indicator has been applied to studies in the Mid-Atlantic Ridge (Simoneit et al., 2004; Peng et al., 2011; Morgunova et al., 2012), the CIR (Peng et al., 2011) and the SWIR (Pan et al., 2018) to evaluate hydrothermal alteration on sedimentary OM. The odd-over-even predominance of long chain n-alkanes with significantly high CPI values (≥3.0; Fig. 3, Table 1), as well as the even-over-odd predominance of long chain n-alcohols and n-FAs (Figs 4 and 6) strongly reflected a typical feature of terrigenous OM input without thermal alteration (Eglinton and Hamilton, 1967; Volkman, 1986). Though hydrothermal alteration signatures could also be recorded by the more thermal stable hopanes (i.e., [17β,21α(H)] and [17α,21β(H)] forms) and steranes (Simoneit et al., 2004; Peng et al., 2011; Morgunova et al., 2012), these compounds with either biological or geological configuration were not detectable and thus derived proxies (i.e., [ββ/(αβ+ββ+βα)]) were not available to trace OM maturity in the present study.
In summary, the lipid composition and distribution of TVG-03 and TVG-06 were significantly different of in-field/hydrothermal sediments Indian Ocean ridge systems, such as the CIR (Peng et al., 2011) and the SWIR (Pan et al., 2018). This reflected that hydrothermal activity of Tianxiu Field has no influence on the sampling sites and there is no other venting site existed nearby.
5.
Conclusions
A series of lipids (alkane, alcohol and FA compounds) were investigated to evaluate the potential influence of hydrothermal activity on the fate of OM in sediments collected at TVG-03 (3.692°N, 63.819°E) and TVG-06 (2.653°N, 66.398°E), in the CR. Results show the terrigenous OM contributed little to both samples, as evidenced by the relatively low abundances of long chain n-alkyl lipids and 1,15-C32 diol. This is caused by the remoteness of sampling sites from any landmasses. The distributions of marine-originated biomarkers varied significantly between the two sediments, revealing a dominant input of bacteria with considerable phytoplankton to sample TVG-06, and a major contribution of bacteria with additional fungi and phytoplankton to sample TVG-03. Moreover, the anaerobic alternation on OM might have occurred, as suggested by several independent indicators of low redox potential. Comparison of the distributions of lipid biomarkers in the studied samples with that in typical hydrothermal sediments suggested that the hydrothermal inputs is insignificant, and Tianxiu Hydrothermal Field has no influence on the samples sites, no hydrothermal vent existed nearby neither.
Acknowledgements
We thank the expedition crew of the Chinese DY49th Cruise for their support and help during the cruises.
Blumenberg M, Seifert R, Petersen S, et al. 2007. Biosignatures present in a hydrothermal massive sulfide from the Mid-Atlantic Ridge. Geobiology, 5(4): 435–450. doi: 10.1111/j.1472-4669.2007.00126.x
[2]
Bradley A S, Fredricks H, Hinrichs K U, et al. 2009. Structural diversity of diether lipids in carbonate chimneys at the Lost City Hydrothermal Field. Organic Geochemistry, 40(12): 1169–1178. doi: 10.1016/j.orggeochem.2009.09.004
[3]
Bray E E, Evans E D. 1961. Distribution of n-paraffins as a clue to recognition of source beds. Geochimica et Cosmochimica Acta, 22(1): 2–15. doi: 10.1016/0016-7037(61)90069-2
[4]
Bühring S I, Schubotz F, Harms C, et al. 2012. Lipid signatures of acidophilic microbial communities in an extreme acidic environment-Río Tinto, Spain. Organic Geochemistry, 47: 66–77. doi: 10.1016/j.orggeochem.2012.03.010
[5]
Cai Yiyang, Han Xiqiu, Qiu Zhongyan, et al. 2020. Characteristics, distribution and implication of hydrothermal minerals in Tianxiu Hydrothermal Field, Carlsberg Ridge, Northwest Indian Ocean. Marine Geology & Quaternary Geology (in Chinese), 40(5): 36–45
[6]
Chen Yang. 2019. Characteristics and processes of alteration and element migration of abyssal peridotite at the Tianxiu Hydrothermal Field on the Carlsberg Ridge, Northwest Indian Ocean (in Chinese)[dissertation]. Hangzhou: Zhejiang University
[7]
Chen Yang, Han Xiqiu, Wang Yejian, et al. 2020. Precipitation of calcite veins in serpentinized harzburgite at Tianxiu Hydrothermal Field on carlsberg ridge (3.67°N), Northwest Indian Ocean: implications for fluid circulation. Journal of Earth Science, 31(1): 91–101. doi: 10.1007/s12583-020-0876-y
[8]
Cowie B R, Slater G F, Bernier L, et al. 2009. Carbon isotope fractionation in phospholipid fatty acid biomarkers of bacteria and fungi native to an acid mine drainage lake. Organic Geochemistry, 40(9): 956–962. doi: 10.1016/j.orggeochem.2009.06.004
[9]
De Leeuw J W, Rijpstra W I C, Nienhuis P H. 1995. Free and bound fatty acids and hydroxy fatty acids in the living and decomposing eelgrass Zostera marina L. Organic Geochemistry, 23(8): 721–728. doi: 10.1016/0146-6380(95)00062-J
[10]
Eglinton G, Hamilton R J. 1967. Leaf epicuticular waxes. Science, 156(3780): 1322–1335. doi: 10.1126/science.156.3780.1322
[11]
Elderfield H, Schultz A. 1996. Mid-ocean ridge hydrothermal fluxes and the chemical composition of the ocean. Annual Review of Earth and Planetary Sciences, 24: 191–224. doi: 10.1146/annurev.earth.24.1.191
[12]
Fang J S, Hasiotis S T, Das Gupta S, et al. 2007. Microbial biomass and community structure of a stromatolite from an acid mine drainage system as determined by lipid analysis. Chemical Geology, 243(1–2): 191–204. doi: 10.1016/j.chemgeo.2007.06.001
[13]
Ferreira A M, Miranda A, Caetano M, et al. 2001. Formation of mid-chain alkane keto-ols by post-depositional oxidation of mid-chain diols in Mediterranean sapropels. Organic Geochemistry, 32(2): 271–276. doi: 10.1016/S0146-6380(00)00181-9
[14]
Fietz S, Prahl F G, Moraleda N, et al. 2013. Eolian transport of glycerol dialkyl glycerol tetraethers (GDGTs) off northwest Africa. Organic Geochemistry, 64: 112–118. doi: 10.1016/j.orggeochem.2013.09.009
[15]
German C R, Klinkhammer G P, Edmond J M, et al. 1990. Hydrothermal scavenging of rare-earth elements in the ocean. Nature, 345(6275): 516–518. doi: 10.1038/345516a0
[16]
Guan Hongxiang, Chen Linying, Luo Min, et al. 2019. Composition and origin of lipid biomarkers in the surface sediments from the southern Challenger Deep, Mariana Trench. Geoscience Frontiers, 10(1): 351–360. doi: 10.1016/j.gsf.2018.01.004
[17]
Guan Hongxiang, Sun Yongge, Zhu Xiaowei, et al. 2013. Factors controlling the types of microbial consortia in cold-seep environments: a molecular and isotopic investigation of authigenic carbonates from the South China Sea. Chemical Geology, 354: 55–64. doi: 10.1016/j.chemgeo.2013.06.016
[18]
Guo Feiyan. 2015. Classfication of the SST Interannual Variability Major Modes of Tropical Indian Ocean and their Relations with ENSO (in Chinese)[dissertation]. Qingdao: Ocean University of China.
[19]
Huguet A, Coffinet S, Roussel A, et al. 2019. Evaluation of 3-hydroxy fatty acids as a pH and temperature proxy in soils from temperate and tropical altitudinal gradients. Organic Geochemistry, 129: 1–13. doi: 10.1016/j.orggeochem.2019.01.002
[20]
Jannasch H W, Mottl M J. 1985. Geomicrobiology of deep-sea hydrothermal vents. Science, 229(4715): 717–725. doi: 10.1126/science.229.4715.717
[21]
Jiang Zijing, Han Xiqiu, Wang Yejian, et al. 2015. Characteristics of hydrothermal anomalies in water bodies near Tianshui hydrothermal area of Karlsberg Ridge in the Northwest Indian Ocean. Acta Mineralogica Sinica (in Chinese), 35(S1): 765–766
[22]
Jiang Zijing, Han Xiqiu, Wang Yejian, et al. 2017. Characteristics of water chemistry and constituents of particles in the hydrothermal plume near 6°48'N, Carlsberg Ridge, Northwest Indian Ocean. Journal of Marine Sciences (in Chinese), 35(4): 34–43
[23]
Kenig F, Simons D J H, Crich D, et al. 2003. Branched aliphatic alkanes with quaternary substituted carbon atoms in modern and ancient geologic samples. Proceedings of the National Academy of Sciences of the United States of America, 100(22): 12554–12558. doi: 10.1073/pnas.1735581100
[24]
Kenig F, Simons D J H, Crich D, et al. 2005. Structure and distribution of branched aliphatic alkanes with quaternary carbon atoms in Cenomanian and Turonian black shales of Pasquia Hills (Saskatchewan, Canada). Organic Geochemistry, 36(1): 117–138. doi: 10.1016/j.orggeochem.2004.06.014
[25]
Lattaud J, Kim J H, De Jonge C, et al. 2017. The C32 alkane-1,15-diol as a tracer for riverine input in coastal seas. Geochimica et Cosmochimica Acta, 202: 146–158. doi: 10.1016/j.gca.2016.12.030
[26]
Li Jiwei, Zhou Huaiyang, Peng Xiaotong, et al. 2011. Abundance and distribution of fatty acids within the walls of an active deep-sea sulfide chimney. Journal of Sea Research, 65(3): 333–339. doi: 10.1016/j.seares.2011.01.005
[27]
Lou Yingzhong, Han Xiqiu, He Zhiguo, et al. 2020. Numerical modeling of hydrodynamic processes of deep-sea hydrothermal plumes: a case study on Daxi Hydrothermal Field, Carlsberg Ridge. Scientia Sinica Technologica (in Chinese), 50(2): 194–208. doi: 10.1360/SST-2019-0111
[28]
Mao Shengyi, Zhu Xiaowei, Wu Nengyou, et al. 2017. Alcohol compounds in Azolla imbricata and potential source implication for marine sediments. Science China Earth Sciences, 60(2): 348–359. doi: 10.1007/s11430-016-5177-6
[29]
McCollom T M, Seewald J S, German C R. 2015. Investigation of extractable organic compounds in deep-sea hydrothermal vent fluids along the Mid-Atlantic Ridge. Geochimica et Cosmochimica Acta, 156: 122–144. doi: 10.1016/j.gca.2015.02.022
[30]
Morgunova I P, Ivanov V N, Litvinenko I V, et al. 2012. Geochemistry of organic matter in bottom sediments of the Ashadze Hydrothermal Field. Oceanology, 52(3): 345–353. doi: 10.1134/S0001437012030083
[31]
Murton B J, Baker E T, Sands C M, et al. 2006. Detection of an unusually large hydrothermal event plume above the slow-spreading Carlsberg Ridge: NW Indian Ocean. Geophysical Research Letters, 33(10): L10608
[32]
Murton B J, Rona P A. 2015. Carlsberg Ridge and Mid-Atlantic Ridge: comparison of slow spreading centre analogues. Deep-Sea Research Part II: Topical Studies in Oceanography, 121: 71–84. doi: 10.1016/j.dsr2.2015.04.021
[33]
Pan Anyang, Yang Qunhui, Zhou Huaiyang, et al. 2016. A diagnostic GDGT signature for the impact of hydrothermal activity on surface deposits at the Southwest Indian Ridge. Organic Geochemistry, 99: 90–101. doi: 10.1016/j.orggeochem.2016.07.001
[34]
Pan Anyang, Yang Qunhui, Zhou Huaiyang, et al. 2018. Geochemical impacts of hydrothermal activity on surface deposits at the Southwest Indian Ridge. Deep-Sea Research Part I: Oceanographic Research Papers, 139: 1–13. doi: 10.1016/j.dsr.2018.05.009
[35]
Pancost R D, Pressley S, Coleman J M, et al. 2006. Composition and implications of diverse lipids in New Zealand Geothermal sinters. Geobiology, 4(2): 71–92. doi: 10.1111/j.1472-4669.2006.00069.x
[36]
Peng Xiaotong, Li Jiwei, Zhou Huaiyang, et al. 2011. Characteristics and source of inorganic and organic compounds in the sediments from two hydrothermal fields of the Central Indian and Mid-Atlantic Ridges. Journal of Asian Earth Sciences, 41(3): 355–368. doi: 10.1016/j.jseaes.2011.03.005
[37]
Popoola S O, Han Xiqiu, Wang Yejian, et al. 2019a. Geochemical investigations of Fe-Si-Mn oxyhydroxides deposits in wocan hydrothermal field on the slow-spreading carlsberg ridge, Indian Ocean: constraints on their types and origin. Minerals, 9(1): 19
[38]
Popoola S O, Han Xiqiu, Wang Yejian, et al. 2019b. Mineralogical and geochemical signatures of metalliferous sediments in wocan-1 and wocan-2 hydrothermal sites on the Carlsberg Ridge, Indian Ocean. Minerals, 9(1): 26. doi: 10.3390/min9010026
[39]
Qiu Zhongyan, Han Xiqiu, Li Mou, et al. 2021. The temporal variability of hydrothermal activity of Wocan Hydrothermal Field, Carlsberg Ridge, Northwest Indian Ocean. Ore Geology Reviews, 132: 103999. doi: 10.1016/j.oregeorev.2021.103999
[40]
Raju K A K. 2008. Recent cruise onboard R/V sonne to the Carlsberg Ridge and the Andaman Sea. Inter Ridge News, 17: 34–35
[41]
Rampen S W, Schouten S, Koning E, et al. 2008. A 90 kyr upwelling record from the northwestern Indian Ocean using a novel long-chain diol index. Earth and Planetary Science Letters, 276(1–2): 207–213. doi: 10.1016/j.jpgl.2008.09.022
[42]
Rampen S W, Willmott V, Kim J H, et al. 2012. Long chain 1,13- and 1,15-diols as a potential proxy for palaeotemperature reconstruction. Geochimica et Cosmochimica Acta, 84: 204–216. doi: 10.1016/j.gca.2012.01.024
[43]
Rampen S W, Willmott V, Kim J H, et al. 2014. Evaluation of long chain 1,14-alkyl diols in marine sediments as indicators for upwelling and temperature. Organic Geochemistry, 76: 39–47. doi: 10.1016/j.orggeochem.2014.07.012
[44]
Ray D, Mirza I H, Prakash L, et al. 2008. Water column geochemical anomalies associated with the remnants of a mega plume: a case study after CR-2003 hydrothermal event in Carlsberg Ridge, NW Indian Ocean. Current Science, 95: 355–360
[45]
Ray D, Raju K A K, Baker E T, et al. 2012. Hydrothermal plumes over the Carlsberg Ridge, Indian Ocean. Geochemistry, Geophysics, Geosystems, 13(1): Q01009
[46]
Resing J A, Sedwick P N, German C R, et al. 2015. Basin-scale transport of hydrothermal dissolved metals across the South Pacific Ocean. Nature, 523(7559): 200–203. doi: 10.1038/nature14577
[47]
Schouten S. 1998. Structural characterization, occurrence and fate of archaeal ether-bound acyclic and cyclic biphytanes and corresponding diols in sediments. Organic Geochemistry, 29(5–7): 1305–1319. doi: 10.1016/S0146-6380(98)00131-4
[48]
Simoneit B R T, Lein A Y, Peresypkin V I, et al. 2004. Composition and origin of hydrothermal petroleum and associated lipids in the sulfide deposits of the Rainbow field (Mid-Atlantic Ridge at 36°N). Geochimica et Cosmochimica Acta, 68(10): 2275–2294. doi: 10.1016/j.gca.2003.11.025
[49]
Tao Chunhui, Wu Guanghai, Deng Xianming, et al. 2013. New discovery of seafloor hydrothermal activity on the Indian Ocean Carlsberg Ridge and Southern North Atlantic Ridge-progress during the 26th Chinese COMRA cruise. Acta Oceanologica Sinica, 32(8): 85–88. doi: 10.1007/s13131-013-0345-x
[50]
Taube P S, Hansel F A, dos Santos Madureira L A, et al. 2013. Organic geochemical evaluation of organic acids to assess anthropogenic soil deposits of Central Amazon, Brazil. Organic Geochemistry, 58: 96–106. doi: 10.1016/j.orggeochem.2013.02.004
[51]
Tyagi P, Kawamura K, Kariya T, et al. 2017. Tracing atmospheric transport of soil microorganisms and higher plant waxes in the East Asian outflow to the North Pacific Rim by using hydroxy fatty acids: year-round observations at Gosan, Jeju Island. Journal of Geophysical Research: Atmospheres, 122(7): 4112–4131. doi: 10.1002/2016JD025496
[52]
Valsangkar A B, Borole D V, Shejwalkar A S, et al. 2009. Potential diagenetic and detrital sources for calcareous sediments from the Carlsberg Ridge, Indian Ocean. Current Science, 96(8): 1090–1099
[53]
Versteegh G J M, Bosch H J, De Leeuw J W. 1997. Potential palaeoenvironmental information of C24 to C36 mid-chain diols, keto-ols and mid-chain hydroxy fatty acids: a critical review. Organic Geochemistry, 27(1–2): 1–13. doi: 10.1016/S0146-6380(97)00063-6
[54]
Volkman J K. 1986. A review of sterol markers for marine and terrigenous organic matter. Organic Geochemistry, 9(2): 83–99. doi: 10.1016/0146-6380(86)90089-6
[55]
Wakeham S G. 1989. Reduction of stenols to stanols in particulate matter at oxic-anoxic boundaries in sea water. Nature, 342(6251): 787–790. doi: 10.1038/342787a0
[56]
Wakeham S G, Pease T K, Benner R. 2003. Hydroxy fatty acids in marine dissolved organic matter as indicators of bacterial membrane material. Organic Geochemistry, 34(6): 857–868. doi: 10.1016/S0146-6380(02)00189-4
[57]
Wang Yejian, Han Xiqiu, Petersen S, et al. 2017. Mineralogy and trace element geochemistry of sulfide minerals from the Wocan Hydrothermal Field on the slow-spreading Carlsberg Ridge, Indian Ocean. Ore Geology Reviews, 84: 1–19. doi: 10.1016/j.oregeorev.2016.12.020
[58]
Wang Yejian, Han Xiqiu, Zhou Yadong, et al. 2021. The Daxi Vent Field: an active mafic-hosted hydrothermal system at a non-transform offset on the slow-spreading Carlsberg Ridge, 6°48'N. Ore Geology Reviews, 129: 103888. doi: 10.1016/j.oregeorev.2020.103888
[59]
Willmott A J, Mysak L A. 2010. A simple steady-state coupled ice-ocean model, with application to the Greenland-Norwegian Sea. Journal of Physical Oceanography, 19(4): 501–518
[60]
Xie Shaobin, Wang Shasha, Li Dengfeng, et al. 2021. Sulfurovum indicum sp. nov., a novel hydrogen- and sulfur-oxidizing chemolithoautotroph isolated from a deep-sea hydrothermal plume in the northwestern Indian Ocean. International Journal of Systematic and Evolutionary Microbiology, 71(3): 004748
[61]
Zelles L. 1999. Fatty acid patterns of phospholipids and lipopolysaccharides in the characterisation of microbial communities in soil: a review. Biology and Fertility of Soils, 29(2): 111–129. doi: 10.1007/s003740050533
[62]
Zhou Yadong, Chen Chong, Sun Yanan, et al. 2019. Amphisamytha (Annelida: Ampharetidae) from Indian Ocean hydrothermal vents: biogeographic implications. Deep-Sea Research Part I: Oceanographic Research Papers, 154: 103148. doi: 10.1016/j.dsr.2019.103148
[63]
Zhu Xiaowei, Mao Shengyi, Wu Nengyou, et al. 2016. Detection and indication of 1,3,4-C27–29 triol in the sediment of northern South China Sea. Science China: Earth Sciences, 59(6): 1187–1194. doi: 10.1007/s11430-016-5270-3
[64]
Zhu Xiaowei, Mao Shengyi, Yongge Sun, et al. 2018. Organic molecular evidence of seafloor hydrocarbon seepage in sedimentary intervals down a core in the northern South China Sea. Journal of Asian Earth Sciences, 168: 155–162. doi: 10.1016/j.jseaes.2018.11.009
[65]
Zhu Xiaowei, Mao Shengyi, Yongge Sun, et al. 2019. Long chain diol index (LDI) as a potential measure to estimate annual mean sea surface temperature in the northern South China Sea. Estuarine. Coastal and Shelf Science, 221: 1–7. doi: 10.1016/j.ecss.2019.03.012
[66]
Zong Tong, Han Xiqiu, Liu Jiqiang, et al. 2019. H2O in basaltic glasses from the slow-spreading Carlsberg Ridge: implications for mantle source and magmatic processes. Lithos, 332–333: 274–286. doi: 10.1016/j.lithos.2019.01.022
[67]
Zong Tong, Han Xiqiu, Liu Jiqiang, et al. 2020. Fractional crystallization processes of magma beneath the Carlsberg Ridge (57°–65°E). Journal of Oceanology and Limnology, 38(1): 75–92. doi: 10.1007/s00343-019-8328-1
Figure 1. Geological location of sampling sites in the Carlsberg Ridge (CR). TVG-03 (3.692°N, 63.819°E) denotes near-filed/hydrothermal sediments (about 760 m away from Tianxiu Hydrothermal Field, 3.683°N, 63.833°E) and TVG-06 (2.653°N, 66.398°E) indicates far-filed sediments. Other Indian Ocean ridge systems include the Central Indian Ridge (CIR), the Southwest Indian Ridge (SWIR) and the Southeast Indian Ridge (SEIR).
Figure 2. Partial total ion current trace of neutral fraction in TVG-03 (a) and -06 (b) surface sediments.
Figure 3. Distribution of C16–34n-alkanes in TVG-03 and -06 surface sediments. CPI=0.5×[∑Odd(C25–C33)/∑Even(C24–C32)+∑Odd(C25–C33)/∑Even(C26–C34)] (Bray and Evans, 1961; Pan et al., 2018).
Figure 4. Distribution of C14–32n-alcohols in TVG-03 and -06 surface sediments.
Figure 5. Partial total ion current trace of FA fractions in TVG-03 (a) and -06 (b) surface sediments.
Figure 6. Distribution of C14–28n-FAs in TVG-03 and -06 surface sediments.


 DownLoad:


 DownLoad: