
Figure
1.
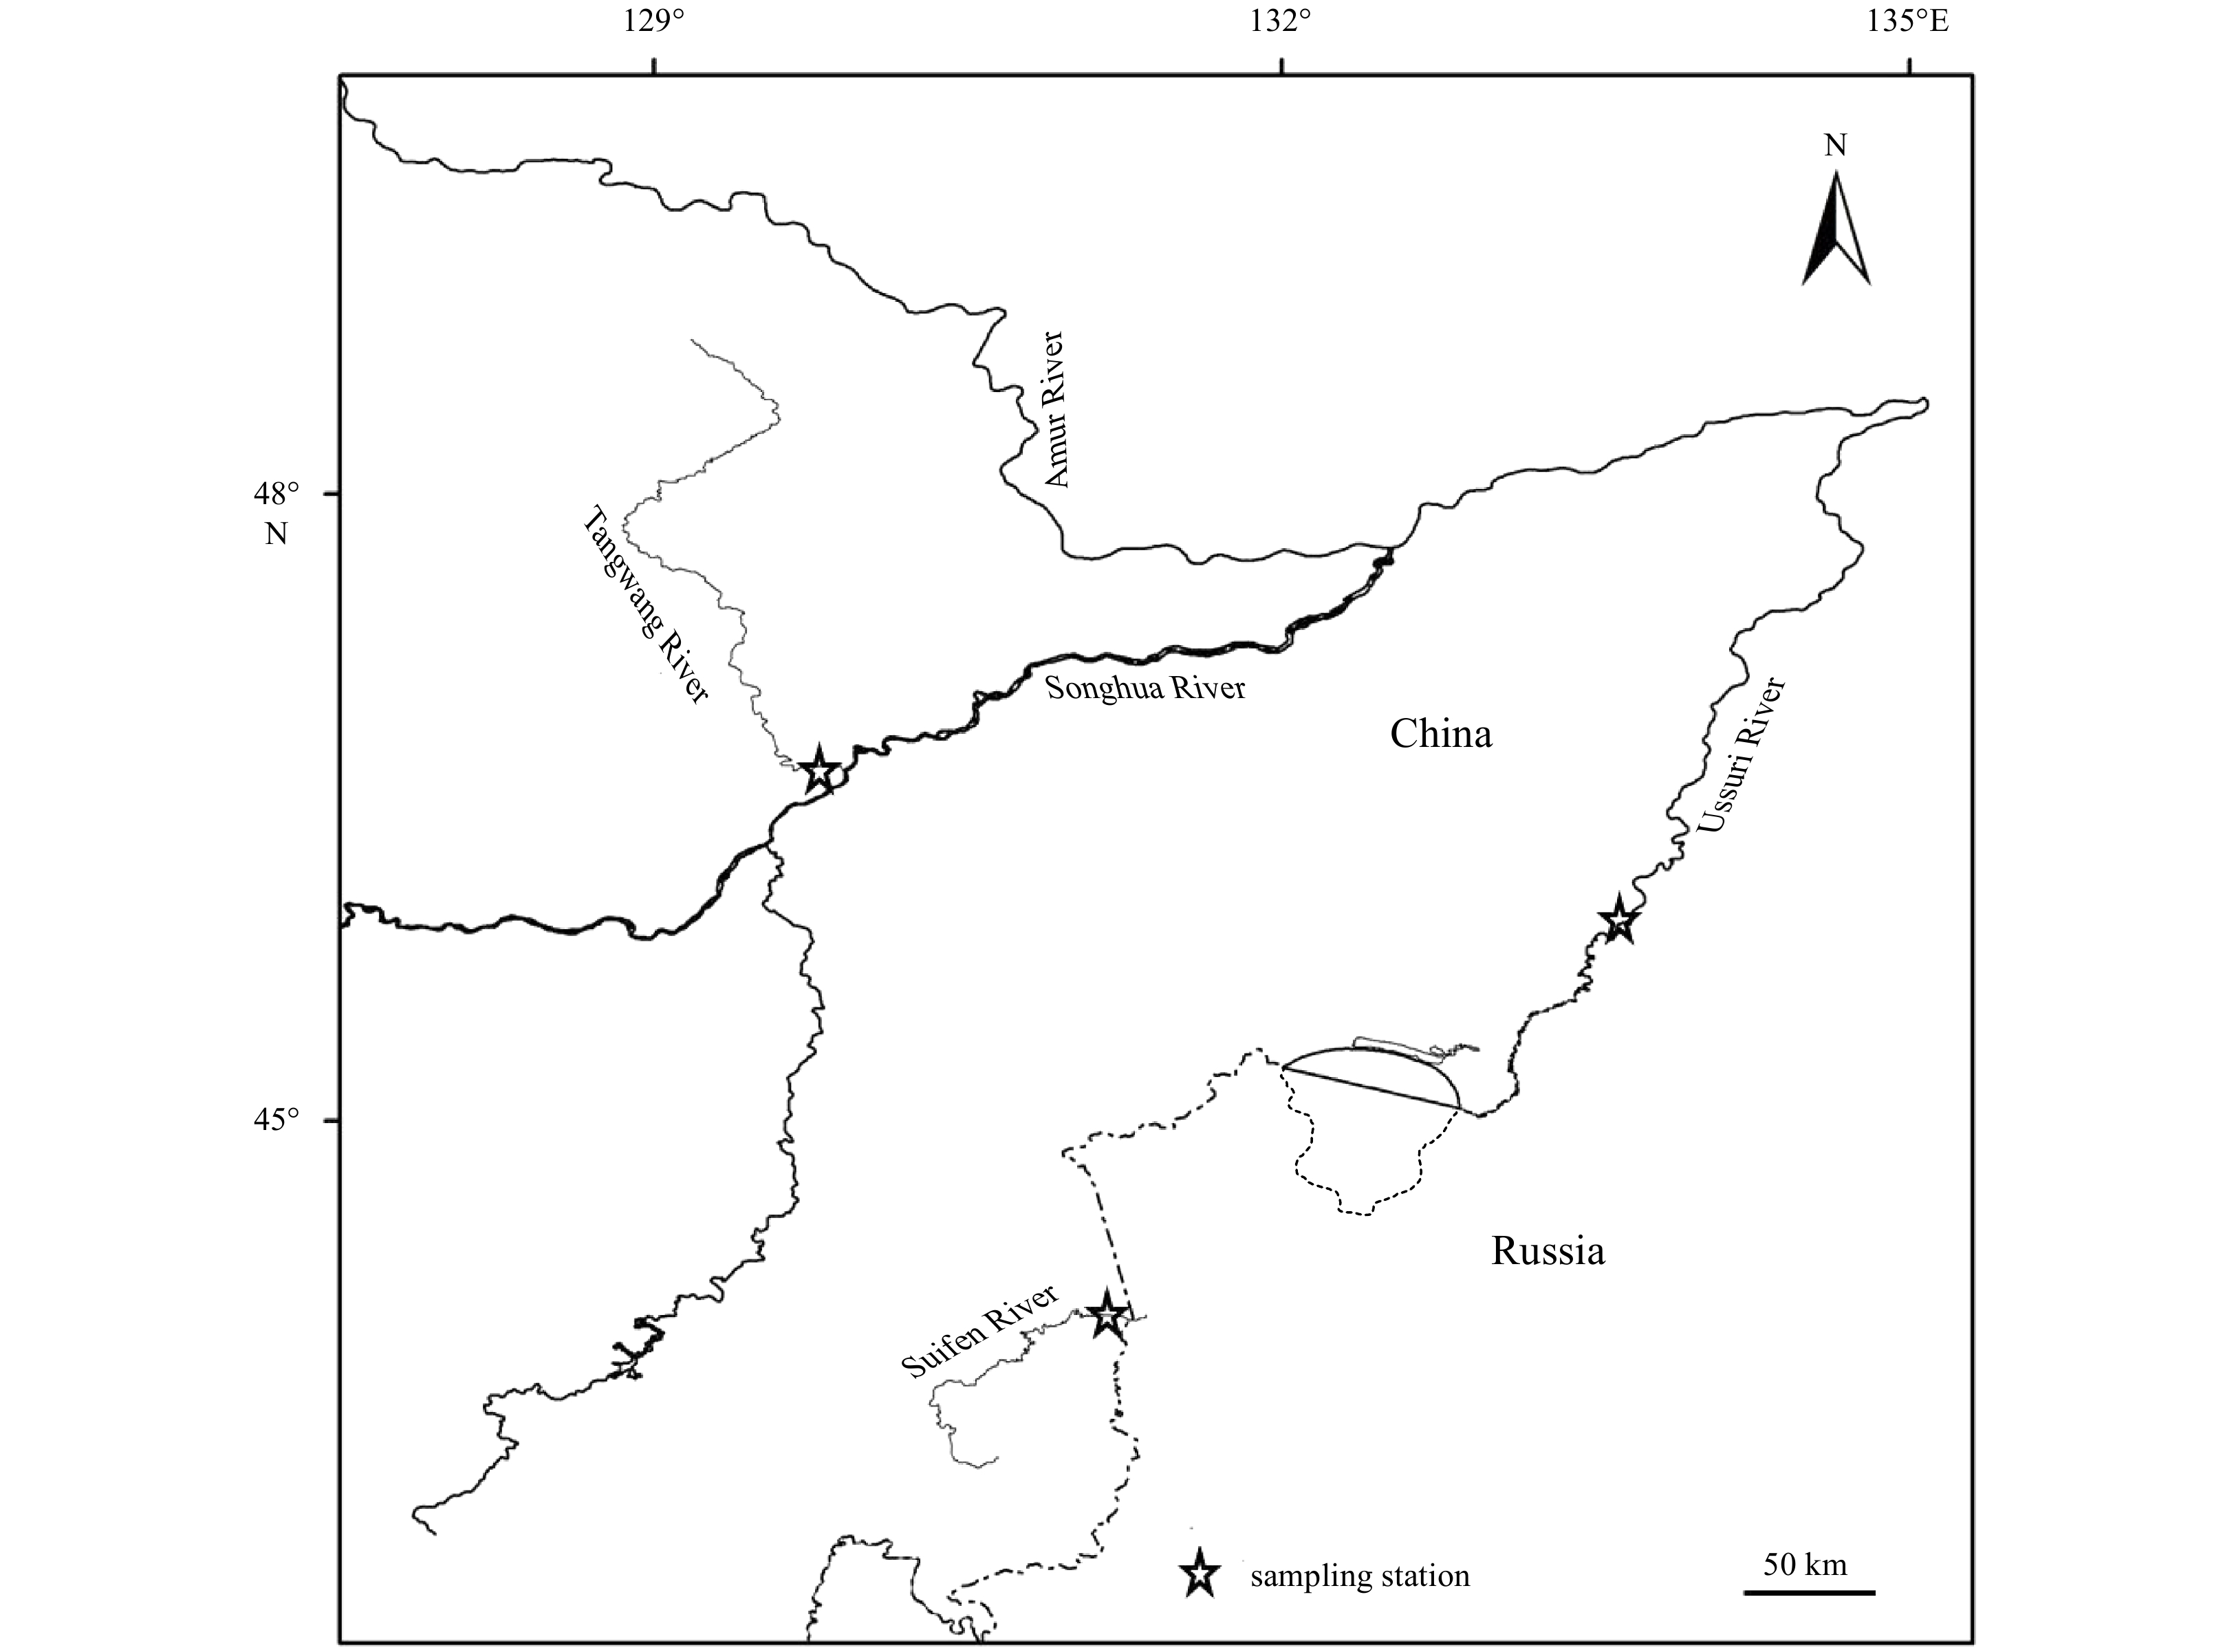
Sampling stations for chum salmon in Tangwang River, Ussuri River and Suifen River.
| Citation: | Li Gao, Yingbin Wang. Influences of environmental factors on the spawning stock-recruitment relationship of Portunus trituberculatus in the northern East China Sea[J]. Acta Oceanologica Sinica, 2021, 40(8): 145-159. doi: 10.1007/s13131-021-1801-7

|
Tangwang River is a cold-water river and a major downstream tributary of Songhua River, the largest tributary of the Amur River in the northeast of China. It inhabits many species of fish especially cold-water species, such as chum salmon (Oncorhynchus keta), Amur whitefish (Coregonus ussuriensis) and so on. Chum salmon belong to typical anadromous fish of which life history includes freshwater and marine life stages. Chum salmon were born in rivers, the juvenile fish will migrage to the sea soon after hatching and they live in the ocean until maturation and then go upstream to the river where they were born to reproduce. They die soon after breeding and reproduce only once in their life. At present, the habitat distribution of chum salmon in China has decreased significantly, and Tangwang River was once one of the important spawning rivers. Tangwang River once had several important spawning grounds of chum salmon before 1980s. However, the fishery resources have undergone serious depletion due to anthropogenic factors such as overfishing, habitat degradation and pollution (Liu, 2011; Yang et al., 2015). Especially, the chum salmon had not been seen for almost three decades. In order to restore the fish resources, enhancement release of chum salmon has been conducted since 2012. And it was found that a small number of chum salmon migrated to Tangwang River in autumn in recent years. In order to assess the effect of release, strontium (Sr) marking method was used to tag chum salmon released in 2016. Sr marking method is that marked and unmarked fish groups were distinguished based on the content of Sr in otolith which was adjusted by changing the Sr concentration of habitat water environment. Sr marking method is widely used in fish enhancement release and achieved many good results (Zhang et al., 2018; Si et al., 2019). Based on the microchemical analysis of otolith samples of chum salmon collectd in Tangwang River by electron probe microanalysis (EPMA). This study intended to reveal whether chum salmon released returned to Tangwang River and it can supply preliminary basic work for the assessment of enhancement release of chum salmon in Tangwang River.
Chum salmon enhancement release in Tangwang River has been conducted since 2012, and the released fishes were tagged by Sr marking method in 2016. The initial concentration of Sr ion in the incubator reached 30 mg/L by adding Sr chloride into hatching water every 12 h for 5 d during the germination of fertilized eggs so as to increase the Sr content of otoliths. The homing chum salmon were detected in Tangwang River, Ussuri River and Suifen River in 2018. A total of 12 specimens (ID: from C1 to C12; fork length ranged from 449 mm to 719 mm; body weight ranged from 1 098 g to 3 902 g) were collected by fishing, of which 4 samples (C1–C4) from Tangyuan section of Tangwang Rvier, other samples were comparative groups made up of 4 samples from Fuyuan section of the Amur River (C5–C8) and 4 samples from Dongning section of Suifen River (C9–C12) respectively (Fig. 1). Chum salmon samples were catched by drift net with the mesh size of 10 cm. Living samples were then sent to the enhancement release station as parent fishes for reproduction at once, after which the otolith samples were collected for further analysis.
The sagittal otoliths of the samples were extracted and cleaned in distilled water, and then dried. Each otolith was embedded in epoxy resin (Epofix, Struers, Ballerup, Denmark), mounted on a glass slide, cut and ground to expose the core on the sagittal plane using a grinding machine equipped with a diamond cup wheel (Discoplan-TS, Struers, Ballerup, Denmark). In order to obtain more exposed surfaces, the sections were further polished with 1 μm diamond paste on an automated polishing wheel (Planopol-35, Struers). Finally, the otoliths were sonicated in Milli-Q water and rinsed with deionized water and dried in an oven at room temperature. For EPMA measurements, all otoliths were fist given a carbon coating with a high vacuum evaporator. The Sr and Ca concentrations along a line drawn on a life-history transect were measured along a line down the longest axis of each otolith from the core to the edge using a wavelength dispersive X-ray electron microprobe (JXA-8900R, JEOL Ltd., Tokyo, Japan). Calcite (CaCO3) and strontianite (SrCO3) were used as standards for the calibration of the Sr and Ca concentrations. The accelerating voltage and beam current were 15 kV and 1.2×10⁻⁸ A, respectively. The electron beam was focused on a point 5 μm in diameter, with measurements spaced at 10 μm intervals. X-ray intensity maps of both elements were made of the representative otoliths of the samples using the microprobe in accordance with the results of life-history transects. The beam current was 0.5 μA, counting time was 30 ms, pixel size was 7 μm×7 μm, and the electron beam was focused on a point 5 μm in diameter. The other analytical conditions were consistent with those used for the life history transect analyses (Arai et al., 2003b).
The basic information of chum salmon samples can be seen in Table 1. For the Tangwang Rvier samples, the age of C1 and C4 were 3+ years and they were born in 2015 while C2, C3 were 2+ years and were born in 2016. The age range of other samples is 1+–5+ years. Sr/Ca ratios in otolith transects were high variable among all samples. One dramatic difference between individuals of C2, C3 and other samples was that the maximal Sr/Ca ratio near the otolith core of the former (21.55×1 000 and 20.87×1 000) were dramatically higher than those of the latter (<6×1 000). Except C2 and C3, the Sr/Ca ratio range of the samples is 1.22×1 000–11.55×1 000 which far below the high value area of C2 and C3. So C2 and C3 can be considered as the released population (marked population) based on the result that high value area of otolith stands for the marking area (Fig. 2).
| Samples | Sex | Body fork length/cm | Body weight/g | Age | Sampling river |
| C1 | Female | 65.5 | 2 859.5 | 3+ | Tangwang River |
| C2 | Female | 58.8 | 2 385.2 | 2+ | Tangwang River |
| C3 | Male | 48.9 | 1 019.7 | 2+ | Tangwang River |
| C4 | Female | 58.2 | 1 807.6 | 3+ | Tangwang River |
| C5 | Male | 55.1 | 1 703.7 | 2+ | Ussuri River |
| C6 | Female | 66.2 | 3 013.6 | 4+ | Ussuri River |
| C7 | Female | 69.8 | 3 902.5 | 4+ | Ussuri River |
| C8 | Male | 71.9 | 3 012.3 | 5+ | Ussuri River |
| C9 | Male | 46.3 | 1 205.9 | 1+ | Suifen River |
| C10 | Male | 44.9 | 1 098.2 | 1+ | Suifen River |
| C11 | Male | 49.2 | 1 322.5 | 2+ | Suifen River |
| C12 | Female | 54.9 | 1 761.6 | 2+ | Suifen River |
 DownLoad:
CSV
DownLoad:
CSV
X-ray intensity maps showed that the Sr varies remarkably among all the samples, although the Ca concentration was similar. For the comparative samples, it showed that the samples have yellowish circular region located at the core. A bluish (low Sr) annular region outside of the core, outer of the bluish region several yellowish and reddish bands can be found alternately (Fig. 3, unmarked sample). However, the reddish annular band which can be considered as the marking ring by Sr was found near the core in C2 and C3 (Fig. 3, marked sample). So it proved that C2 and C3 belonged to the marked released population in Tangwang River in 2016.


The elements in otolith are continuously deposited under the influence of the surrounding water environment, which can preserve the information of the surrounding environment. Therefore, otolith microchemistry is widely used in the study of fish life history (Kotake et al., 2003; Yang et al., 2006; Dou et al. 2012; Beamish et al., 2007). Otolith chemistry can also be used in fish marking to evaluate the effect of enhancement release (Kullmann et al., 2018). Sr element exists widely in nature and the Sr marking method is convenient, safe, and effective (Si et al., 2019; Wang et al., 2015).
Chum salmon belong to typical anadromous migratory species, and they were born and hatched in fresh water until migrating to the sea at the stage of juvenile. Because of the migratory characters, otolith chemistry was widely used in life history study (Arai et al., 2007; Kang et al., 2014; Christian et al., 2013). Because of the difference between the conditions of the fresh water and salt water, the content of Sr and the ratio of Sr/Ca in otolith showed the volatility changes. The values in seawater are generally higher than those in fresh water (Phillis et al., 2011). According to the previous studies, bluish area and the low Sr/Ca ratios region are consistent with a freshwater habitat, while the yellowish, reddish and high Sr/Ca ratios region to the brackish water or seawater in the analysis of EPMA (Arai et al., 2003a, 2003b; Goto and Arai, 2003). Sr in the core of otolith of chum salmon is mainly affected by the yolk sac which was influenced by ambient water during oogenesis (Kang et al., 2014). While Sr is mainly affected by the surrounding freshwater environment from the end of yolk sac absorption to the pre sea stage. So the concentration of Sr in the core region of the otolith of chum salmon is higher than that in its adjacent region. Furthermore physiological factor can also affect the otolith chemistry (Farrell and Campana, 1996). However, the Sr/Ca raito of chum salmon is usualilly smaller than 15×1 000 (1.22×1 000–11.55×1 000 in this study), and in fresh water stage (near the core of otolith) the ratio is much lower than that in salt water (Fig. 3). So the high Sr/Ca ratio of C2 and C3 were caused by Sr marking in the eye stage of fertilized eggs. So it can be proved that C2 and C3 are the tagged individuals released in Tangwang River in 2016. In this study, the marking of chum salmon otolith with the unsteady concentration of strontium ion and initial concentration of Sr ion in incubator is 30 mg/L. The peak value of Sr/Ca ratio is 20×1 000–22×1000 which much lower than the samples tagged by stead concentration (about 77×1 000) (Wang et al., 2015). However, marked and unmarked groups can also been distinguished significantly (Fig. 2).
A total of four chum salmon were collected in the Tangwang River in 2018, of which two of them were born in 2016 and were proved as the released individuals. The other two samples were born in 2015 and it is not known whether they belong to released groups because the chum salmon population released were not marked in 2015. In any case, it has also been shown that the enhancement release of chum salmon in Tangwang River has achieved substantial results, although the number of returned populations is not very large. This confirms the river connectivity in the lower reaches of the Tangwang River and that Tangwang River can be used as a breeding and releasing site of chum salmon to restore its historic salmon habitat and spawning grounds. This study provides a basic data for the population restoration of chum salmon.
We greatly appreciate assistance provided by the fisherman at the three sampling stations in obtaining specimens. We are also grateful to the anonymous reviewers for their valuable suggestions.
| [1] |
Anderson C I H, Rodhouse P G. 2001. Life cycles, oceanography and variability: ommastrephid squid in variable oceanographic environments. Fisheries Research, 54(1): 133–143. doi: 10.1016/s0165-7836(01)00378-2
|
| [2] |
Ariyama H, Secor D H. 2010. Effect of environmental factors, especially hypoxia and typhoons, on recruitment of the gazami crab Portunus trituberculatus in Osaka Bay, Japan. Fisheries Science, 76(2): 315–324. doi: 10.1007/s12562-009-0198-6
|
| [3] |
Arzul G, Gentien P, Crassous M P. 1994. A haemolytic test to assay toxins excreted by the marine dinoflagellate Gyrodinium cf. Aureolum. Water Research, 28(4): 961–965. doi: 10.1016/0043-1354(94)90105-8
|
| [4] |
Baylon J, Suzuki H. 2007. Effects of changes in salinity and temperature on survival and development of larvae and juveniles of the crucifix crab Charybdis feriatus (Crustacea: Decapoda: Portunidae). Aquaculture, 269(1–4): 390–401. doi: 10.1016/j.aquaculture.2007.03.024
|
| [5] |
Campbell R A. 2004. CPUE standardisation and the construction of indices of stock abundance in a spatially varying fishery using general linear models. Fisheries Research, 70(2–3): 209–227. doi: 10.1016/j.fishres.2004.08.026
|
| [6] |
Cao Jie, Feng Bo, Chen Xinjun. 2010. Optimizing stock-recruitment Ricker model for yellowfin tuna (Thunnus albacares) incorporated with average vertical sea temperature in the Indian Ocean. Transactions of Oceanology and Limnology, (1): 153–160
|
| [7] |
Chen D G. 2001. Detecting environmental regimes in fish stock-recruitment relationships by fuzzy logic. Canadian Journal of Fisheries and Aquatic Sciences, 58(11): 2139–2148. doi: 10.1139/f01-155
|
| [8] |
Chen Xiayue, Ren Yongkuan, Li Lianjun, et al. 2018. Effect of typhoon on the antioxidant system and Na+, K+-ATPase activity in Portunus trituberculatus. Journal of Marine Sciences, 36(3): 101–106
|
| [9] |
Costa M J, Costa J, de Almeida P R, et al. 1994. Do eel grass beds and salt marsh borders act as preferential nurseries and spawning grounds for fish? An example of the Mira estuary in Portugal. Ecological Engineering, 3(2): 187–195. doi: 10.1016/0925-8574(94)90045-0
|
| [10] |
Feng Bo, Chen Xinjun, Nishida T. 2010. Modeling on stock-recruitment relationship for Yellowfin Tuna (Thunnus albacares) in the Indian Ocean influenced by water temperature. Journal of Guangdong Ocean University, 30(3): 62–66
|
| [11] |
Flaherty K E, Landsberg J H. 2011. Effects of a persistent red tide (Karenia brevis) bloom on community structure and species-specific relative abundance of nekton in a Gulf of Mexico estuary. Estuaries and Coasts, 34(2): 417–439. doi: 10.1007/s12237-010-9350-x
|
| [12] |
Fu Dongyang, Luan Hong, Pan Delu, et al. 2016. Impact of two typhoons on the marine environment in the Yellow Sea and East China Sea. Chinese Journal of Oceanology and Limnology, 34(4): 871–884. doi: 10.1007/s00343-016-5049-6
|
| [13] |
Fu Xiumei, Zhang Mengqi, Liu Yang, et al. 2018. Protective exploitation of marine bioresources in China. Ocean & Coastal Management, 163: 192–204. doi: 10.1016/j.ocecoaman.2018.06.018
|
| [14] |
Fulford R S, Peterson M S, Wu W, et al. 2014. An ecological model of the habitat mosaic in estuarine nursery areas: Part II—Projecting effects of sea level rise on fish production. Ecological Modelling, 273: 96–108. doi: 10.1016/j.ecolmodel.2013.10.032
|
| [15] |
Galindo-Cortes G, De Anda-Montañez J A, Arreguín-Sánchez F, et al. 2010. How do environmental factors affect the stock–recruitment relationship? The case of the Pacific sardine (Sardinops sagax) of the northeastern Pacific Ocean. Fisheries Research, 102(1–2): 173–183. doi: 10.1016/j.fishres.2009.11.010
|
| [16] |
Giménez L. 2003. Potential effects of physiological plastic responses to salinity on population networks of the estuarine crab Chasmagnathus granulata . Helgoland Marine Research, 56(4): 265–273. doi: 10.1007/s10152-002-0127-x
|
| [17] |
Guan Weibing, Xuan Fujun. 2019. A research paradigm of climate impacting reproductive dynamics of fishery resources: A case study of Portunus trituberculatus population in the East China Sea. Modern Fisheries Information, 34(4): 279–285. doi: 10.13233/j.cnki.fishis.2019.04.007
|
| [18] |
Hall C J, Burns C W. 2003. Responses of crustacean zooplankton to seasonal and tidal salinity changes in the coastal Lake Waihola, New Zealand. New Zealand Journal of Marine and Freshwater Research, 37(1): 31–43. doi: 10.1080/00288330.2003.9517144
|
| [19] |
Harford W J, Grüss A, Schirripa M J, et al. 2018. Handle with care: establishing catch limits for fish stocks experiencing episodic natural mortality events. Fisheries Magazine, 43(10): 463–471. doi: 10.1002/fsh.10131
|
| [20] |
Hilborn R, Walters C J. 1992. Quantitative fisheries stock assessment: choice, dynamics and uncertainty. London, UK: Chapman & Hall
|
| [21] |
Ho C H, Yagi N, Tian Yongjun. 2020. An impact and adaptation assessment of changing coastal fishing grounds and fishery industry under global change. Mitigation and Adaptation Strategies for Global Change, 25(6): 1073–1102. doi: 10.1007/s11027-020-09922-5
|
| [22] |
Hobbs N T, Hilborn R. 2006. Alternatives to statistical hypothesis testing in ecology: a guide to self teaching. Ecological Applications, 16(1): 5–19. doi: 10.1890/04-0645
|
| [23] |
Jiao Min, Chen Xinjun, Gao Guoping. 2015. Research progress on the impact of climatic change on arctic fishery resources. Chinese Journal of Polar Research, 27(4): 454–462. doi: 10.13679/j.jdyj.2015.4.454
|
| [24] |
Johnson J B, Omland K S. 2004. Model selection in ecology and evolution. Trends in Ecology & Evolution, 19(2): 101–108. doi: 10.1016/j.tree.2003.10.013
|
| [25] |
Keyl F, Wolff M. 2008. Environmental variability and fisheries: what can models do?. Reviews in Fish Biology and Fisheries, 18(3): 273–299. doi: 10.1007/s11160-007-9075-5
|
| [26] |
Kim C, Lee Y, Park B U. 2001. Cook’s distance in local polynomial regression. Statistics & Probability Letters, 54(1): 33–40. doi: 10.1016/s0167-7152(01)00031-1
|
| [27] |
Kirkpatrick B, Fleming L E, Squicciarini D, et al. 2004. Literature review of Florida red tide: implications for human health effects. Harmful Algae, 3(2): 99–115. doi: 10.1016/j.hal.2003.08.005
|
| [28] |
Lin Qinqin, Chen Xinjun, Dai Libin. 2018. Comparative analysis of stock-recruitment model for Scomber japonicus in the Pacific based on environment factors. Marine Fisheries, 40(3): 279–286. doi: 10.13233/j.cnki.mar.fish.2018.03.003
|
| [29] |
Liu Shuang, Sun Jinsheng, Hurtado L A. 2013. Genetic differentiation of Portunus trituberculatus, the world’s largest crab fishery, among its three main fishing areas. Fisheries Research, 148: 38–46. doi: 10.1016/j.fishres.2013.08.003
|
| [30] |
Lou Xiulin, Huang Weigen, Mao Xianmou, et al. 2006. Satellite observation of a red tide in the East China Sea during 2005. In: Proceedings Volume 6406, Remote Sensing of the Marine Environment. Goa, India: SPIE, 6406, doi: 10.1117/12.693856
|
| [31] |
Lu Yunliang, Wang Fang, Zhao Zhuoying, et al. 2012. Effects of salinity on growth, molt and energy utilization of juvenile swimming crab Portunus trituberculatus. Fisheries Science, 13(4): 237–245. doi: 10.3724/sp.j.1118.2012.00237
|
| [32] |
Myers R A. 2002. Recruitment: understanding density-dependence in fish populations. In: Hart P J B, Reynolds J D, eds. Handbook of Fish Biology and Fisheries: Fish Biology. Malden, Maine: Blackwell Science Ltd., 123–148, doi: 10.1002/9780470693803.ch6
|
| [33] |
Myers R A, Hutchings J A, Barrowman N J. 1996. Hypotheses for the decline of cod in the North Atlantic. Marine Ecology Progress Series, 138: 293–308. doi: 10.3354/meps138293
|
| [34] |
Neely T, Campbell L. 2006. A modified assay to determine hemolytic toxin variability among Karenia clones isolated from the Gulf of Mexico. Harmful Algae, 5(5): 592–598. doi: 10.1016/j.hal.2005.11.006
|
| [35] |
Palacios D M, Bograd S J, Foley D G, et al. 2006. Oceanographic characteristics of biological hot spots in the North Pacific: a remote sensing perspective. Deep-Sea Research Part II:Topical Studies in Oceanography, 53(3–4): 250–269. doi: 10.1016/j.dsr2.2006.03.004
|
| [36] |
Paulay G. 1990. Effects of late Cenozoic sea-level fluctuations on the bivalve faunas of tropical oceanic islands. Paleobiology, 16(4): 415–434. doi: 10.1017/s0094837300010162
|
| [37] |
Pécuchet L, Nielsen J R, Christensen A. 2015. Impacts of the local environment on recruitment: a comparative study of North Sea and Baltic Sea fish stocks. ICES Journal of Marine Science, 72(5): 1323–1335. doi: 10.1093/icesjms/fsu220
|
| [38] |
Rashed-Un-Nabi M, Ee L S, Hoque M A, et al. 2010. Effects of red tide on physico-chemical properties of water and phytoplankton assemblage in Sepanggar Bay, Sabah, Malaysia. International Journal of Ecology & Enviromental Sciences, 36(4): 245–251
|
| [39] |
Romano N, Zeng Chaoshu. 2006. The effects of salinity on the survival, growth and haemolymph osmolality of early juvenile blue swimmer crabs, Portunus pelagicus. Aquaculture, 260(1–4): 151–162. doi: 10.1016/j.aquaculture.2006.06.019
|
| [40] |
Sakuramoto K. 2005. Does the Ricker or Beverton and Holt type of stock-recruitment relationship truly exist?. Fisheries Science, 71(3): 577–592. doi: 10.1111/j.1444-2906.2005.01002.x
|
| [41] |
Sakuramoto K. 2013. A recruitment forecasting model for the Pacific stock of the Japanese sardine (Sardinops melanostictus) that does not assume density-dependent effects . Agricultural Sciences, 4(6A): 1–8. doi: 10.4236/as.2013.46a001
|
| [42] |
Schaaf A. 1996. Sea level changes, continental shelf morphology, and global paleoecological constraints in the shallow benthic realm: a theoretical approach. Palaeogeography, Palaeoclimatology, Palaeoecology, 121(3–4): 259–271. doi: 10.1016/0031-0182(95)00085-2
|
| [43] |
Shentu Jikang, Xu Yongjian, Ding Zhangni. 2015. Effects of salinity on survival, feeding behavior and growth of the juvenile swimming crab, Portunus trituberculatus (Miers, 1876) . Chinese Journal of Oceanology and Limnology, 33(3): 679–684. doi: 10.1007/s00343-015-4218-3
|
| [44] |
Shih C L, Chen Y H, Hsu C C. 2014. Modeling the effect of environmental factors on the ricker stock-recruitment relationship for North Pacific albacore using generalized additive models. Terrestrial, Atmospheric and Oceanic Sciences Journal, 25(4): 581–590. doi: 10.3319/tao.2014.01.27.01(oc
|
| [45] |
Song Chao, Hou Junli, Zhao Feng, et al. 2017. Macrobenthos community structure and its relationship with environment factors in the offshore wind farm of the East China Sea Bridge in spring and autumn. Marine Fisheries, 39(1): 21–29. doi: 10.3969/j.issn.1004-2490.2017.01.003
|
| [46] |
Song Haitang, Yu Cungen, Xue Lijian. 2012. The East China Sea Economic Crustacean Fisheries Biology (in Chinese). Beijing: China Ocean Press
|
| [47] |
Sun Jie, Wang Yingbin, Wang Xiaogang. 2018. Effects of three major marine disasters on recruitment of swimming crab portunus trituberculatus in sea area of northern Zhejiang province. Fisheries Science, 37(6): 728–734. doi: 10.16378/j.cnki.1003-1111.2018.06.002
|
| [48] |
Teal J M. 1958. Distribution of fiddler crabs in Georgia salt marshes. Ecology, 39(2): 185–193. doi: 10.2307/1931862
|
| [49] |
Wang Zhaohui, Chen Jufang, Xu Ning, et al. 2001. Relationship between seasonal variations in Gymnodinium spp. population and environmental factors in Daya Bay, the South China Sea. Acta Ecologica Sinica, 21(11): 1825–1832
|
| [50] |
Wang Yanjun, Liu Qun, Ren Yiping. 2005. Comparision of AIC and BIC in the selection of stock-recruitment relationships. Periodical of Ocean University of China, 35(3): 397–403. doi: 10.16441/j.cnki.hdxb.2005.03.009
|
| [51] |
Wang Xuming, Wang Weiqi, Tong Chuan. 2016. A review on impact of typhoons and hurricanes on coastal wetland ecosystems. Acta Ecologica Sinica, 36(1): 23–29. doi: 10.1016/j.chnaes.2015.12.006
|
| [52] |
Wang Yingbin, Wang Xiaogang, Ye Ting, et al. 2017a. Spawner-recruit analysis of portunus (Portunus) Trituberculatus (Miers, 1876) in the case of stock enhancement implementation: a case study in Zhejiang Sea Area, China. Turkish Journal of Fisheries and Aquatic Sciences, 17(2): 293–299. doi: 10.4194/1303-2712-v17_2_08
|
| [53] |
Wang Yingbin, Ye Ting, Wang Xiaogang, et al. 2017b. Impact of main factors on the catch of Portunus trituberculatus in the northern East China Sea. Pakistan Journal of Zoology, 49(1): 13–17. doi: 10.17582/journal.pjz/2017.49.1.13.17
|
| [54] |
Whitehead J C, Poulter B, Dumas C F, et al. 2009. Measuring the economic effects of sea level rise on shore fishing. Mitigation and Adaptation Strategies for Global Change, 14(8): 777. doi: 10.1007/s11027-009-9198-1
|
| [55] |
Yan Wenchao. 2019. Study on the relationship between the catch fluctuation of Portunus trituberculatus and the human disturbance and environment factors in Zhejiang fishery (in Chinese) [dissertation]. Zhoushan: Zhejiang Ocean University
|
| [56] |
Ye Haijun, Tang Danlig, Pan Gang. 2014. The contribution of typhoon Megi on phytoplankton and fishery productivity in the South China Sea. Ecological Science, 33(4): 657–663. doi: 10.14108/j.cnki.1008-8873.2014.04.005
|
| [57] |
Yu Jie, Chen Guobao, Chen Zuozhi, et al. 2015. Theimpacts of typhoon "Kai-tak" on fishery in west Guangdong fishing ground. Marine Environmental Science, 34(3): 411–419. doi: 10.13634/j.cnki.mes.2015.03.016
|
| [58] |
Yu Cungen, Song Haitang, Yao Guangzhan, et al. 2003. Study on rational utilization of crab resources in the inshore waters of Zhejiang. Marine Fisheries, 25(3): 136–141. doi: 10.3969/j.issn.1004-2490.2003.03.008
|
| [59] |
Yuan Wei, Jin Xianshi, Shan Xiujuan. 2016. Population biology and relationship with environmental factors of swimming crab in the Changjiang River Estuary and adjacent waters. Fisheries Science, 35(2): 105–110. doi: 10.16378/j.cnki.1003-1111.2016.02.002
|
| [60] |
Zhan Bingyi. 1995. Fish Stock Assessment (in Chinese). Beijing: China Agriculture Press
|
| [61] |
Zhang Debo, Li Aiguo. 1992. The study of salinity and suitable salinity of the survival lower limit of Portunus trituberculatus zoea larva . Marine Science, 16(1): 8–10
|
| [62] |
Zhao X, Hamre J, Li F, et al. 2003. Recruitment, sustainable yield and possible ecological consequences of the sharp decline of the anchovy (Engraulis japonicus) stock in the Yellow Sea in the 1990s. Fisheries Oceanography, 12(4–5): 495–501. doi: 10.1046/j.1365-2419.2003.00262.x
|
| [63] |
Zheng Jie, Kruse G H. 2003. Stock-recruitment relationships for three major Alaskan crab stocks. Fisheries Research, 65(1–3): 103–121. doi: 10.1016/j.fishres.2003.09.010
|
| [64] |
Zheng Fang, Liu Qun, Wang Yanjun. 2008. Study of impacts of environmental factors on stock and recruitment relationship of the anchovy stock in the Yellow Sea. South China Fisheries Science, 4(2): 15–20. doi: 10.3969/j.issn.2095-0780.2008.02.003
|
| [65] |
Zhu Dadi, Lu Douding, Wang Yunfeng, et al. 2009. The low temperature characteristics in Zhejiang coastal region in the early spring of 2005 and its influence on harmful algae bloom occurrence of Prorocentrum donghaiense. Haiyang Xuebao, 31(6): 31–39. doi: 10.3321/j.issn:0253-4193.2009.06.004
|
| 1. | Peilun Li, Jiacheng Liu, Wanqiao Lu, et al. Age, growth, reproduction and mortality of Xenocypris argentea (Günther, 1868) in the lower reaches of the Tangwang River, China. PeerJ, 2024, 12: e16673. doi:10.7717/peerj.16673 | |
| 2. | Jilong Wang, Peilun Li, Wei Liu, et al. The Migratory Biology and Feeding Habits of Downstream-Migrating Juvenile Chum Salmon Oncorhynchus keta in the Amur River of Northeast China. Fishes, 2023, 8(9): 458. doi:10.3390/fishes8090458 | |
| 3. | Lingling Gu, Hui Zhang, Guangpeng Feng, et al. Evaluation of the Effectiveness of Marking Juvenile Takifugu obscurus Otoliths with Strontium. Fishes, 2022, 7(6): 371. doi:10.3390/fishes7060371 |

Figures(13) / Tables(5)

Supported by:
Beijing Renhe Information Technology Co. Ltd

Jilong Wang, Wei Liu, Peilun Li, Fujiang Tang, Wanqiao Lu, Jian Yang, Tao Jiang. Evidence of return of chum salmon released from Tangwang River by strontium marking method[J]. Acta Oceanologica Sinica, 2021, 40(8): 182-186. doi: 10.1007/s13131-021-1792-4

| Samples | Sex | Body fork length/cm | Body weight/g | Age | Sampling river |
| C1 | Female | 65.5 | 2 859.5 | 3+ | Tangwang River |
| C2 | Female | 58.8 | 2 385.2 | 2+ | Tangwang River |
| C3 | Male | 48.9 | 1 019.7 | 2+ | Tangwang River |
| C4 | Female | 58.2 | 1 807.6 | 3+ | Tangwang River |
| C5 | Male | 55.1 | 1 703.7 | 2+ | Ussuri River |
| C6 | Female | 66.2 | 3 013.6 | 4+ | Ussuri River |
| C7 | Female | 69.8 | 3 902.5 | 4+ | Ussuri River |
| C8 | Male | 71.9 | 3 012.3 | 5+ | Ussuri River |
| C9 | Male | 46.3 | 1 205.9 | 1+ | Suifen River |
| C10 | Male | 44.9 | 1 098.2 | 1+ | Suifen River |
| C11 | Male | 49.2 | 1 322.5 | 2+ | Suifen River |
| C12 | Female | 54.9 | 1 761.6 | 2+ | Suifen River |
DownLoad:
CSV
 DownLoad:


