Figure
1.
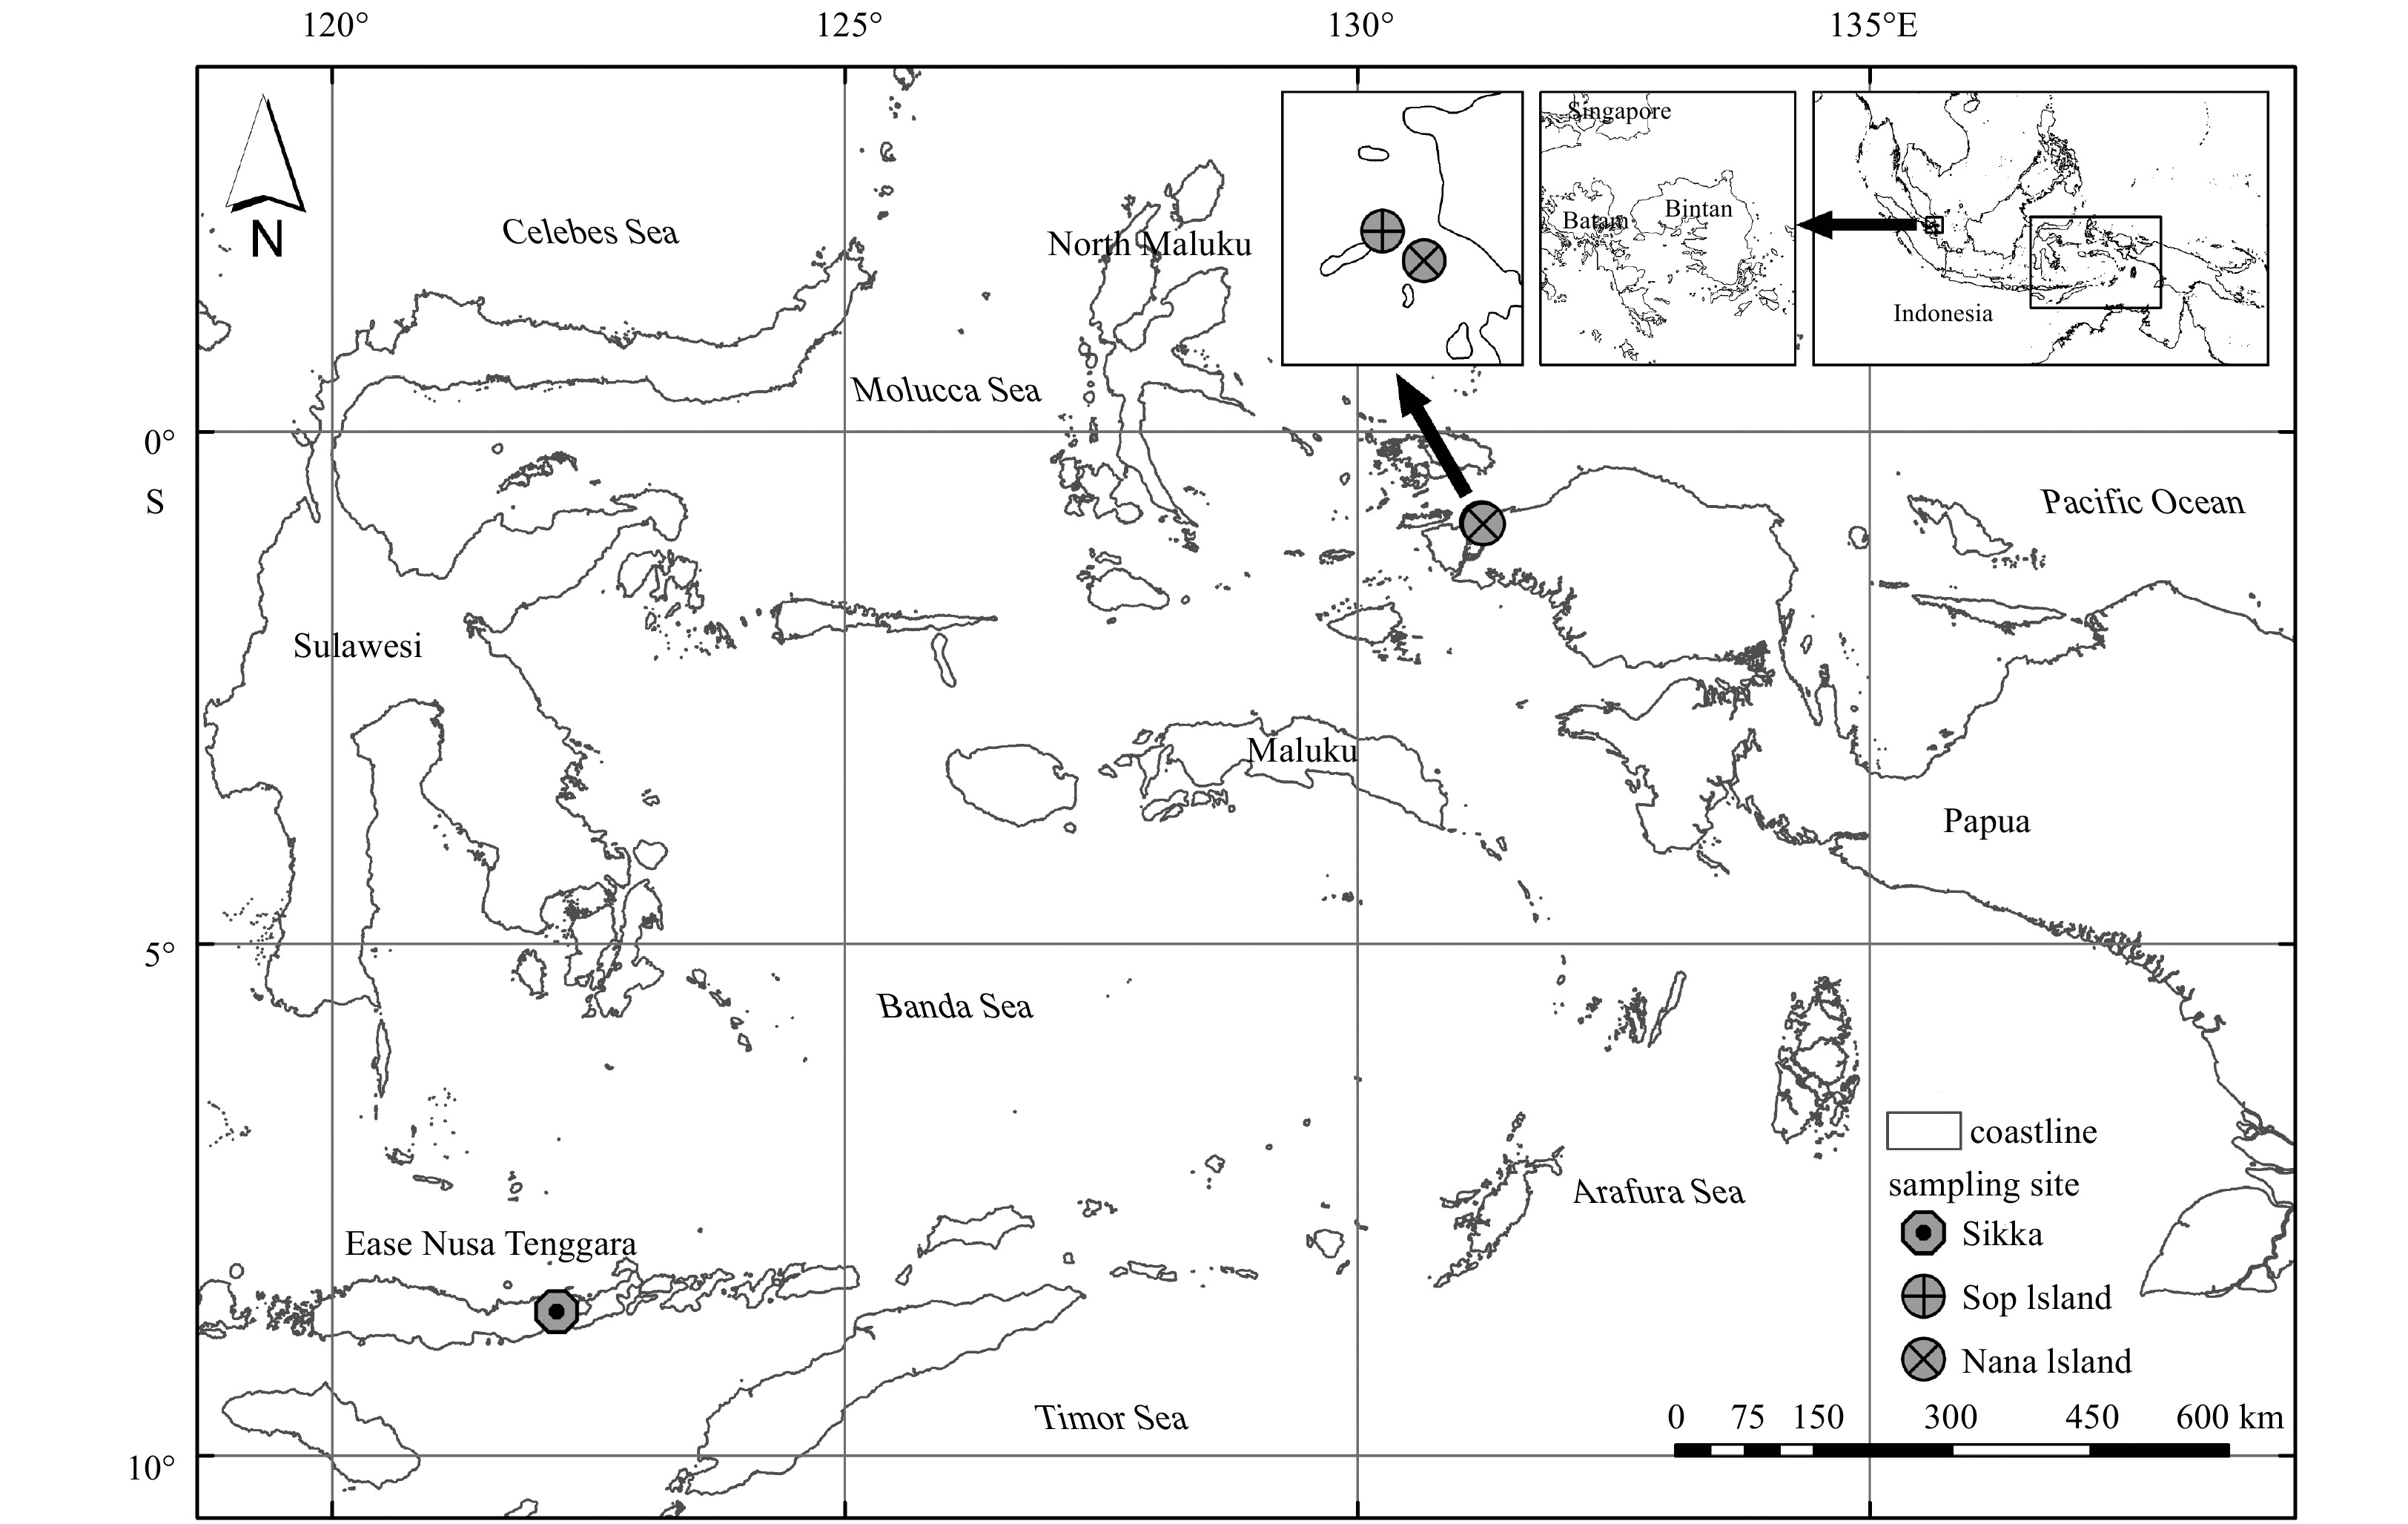
Study site at Maumere (Sikka, East Nusa Tenggara), Sop Island, and Nana Island (Sorong, West Papua).
| Citation: | A’an Johan Wahyudi, Karlina Triana, Afdal Afdal, Hanif Budi Prayitno, Edwards Taufiqurrahman, Hanny Meirinawati, Rachma Puspitasari, Lestari Lestari, Suci Lastrini. The decomposition rate of the organic carbon content of suspended particulate matter in the tropical seagrass meadows[J]. Acta Oceanologica Sinica, 2021, 40(8): 44-52. doi: 10.1007/s13131-021-1802-6

|
One of the marine ecosystems that reflected the carbon dynamic is seagrass meadows. The seagrass ecosystem has an integral part of global carbon cycles, especially for carbon sink, generating a surplus of organic carbon production (Duarte et al., 2013). A previous study reported that the standing stock and carbon sequestration of seagrass meadows in Indonesian waters reached ca. 276–1 005 kt (according to carbon) and 1.6–7.4 Mt/hm2 (according to carbon), respectively (Wahyudi et al., 2020). The seagrass ecosystem also considered as ecosystem with the dynamic flux of the suspended particulate matter (Wahyudi and Afdal, 2019).
Suspended particulate matter (SPM) makes an essential contribution to the global carbon cycle through vertical flux and sedimentation (carbon burial) in the marine ecosystem (Kennedy et al., 2010; Wahyudi et al., 2016). SPM is also an important diet source for suspension feeders (Anthony, 1999), creating another carbon pathway via the food web.
The high potential for carbon flux through the downward transport of SPM contributes significantly to the carbon budget of seagrass ecosystems (Wahyudi and Afdal, 2019). Previous findings have elucidated that the carbon cycle at the microscale of a seagrass ecosystem is not merely contributed by the dominant species of seagrass (Bouillon and Connolly, 2009; Duarte et al., 2013; Lavery et al., 2013); leaf litter (mangrove, seagrass, etc.), river input, and particulate matter may also make a significant contribution to the carbon budget of seagrass ecosystems (i.e. that closely situated close to mangrove ecosystem), in particular the contribution from SPM (Bouillon and Connolly, 2009).
SPM usually is composed of material from marine and terrigenous sources, including detritus, fecal pellets, planktonic organisms, etc. that are classified as either autochthonous or allochthonous in origin (Dalu et al., 2016; Wahyudi et al., 2016), depending on whether produced inside or outside the system of interest. Determination of the contribution of sources to SPM is usually conducted by analyzing the natural abundance of carbon and nitrogen stable isotopes (δ13C and δ15N), as reported by previous studies (Dalu et al., 2016; Wahyudi and Afdal, 2019). The natural abundance of stable isotopes of carbon and nitrogen (δ13C and δ15N) combined with the C/N ratio is used complementarily, since particulate matter is composed not only of carbon-derived materials, but also of other elements in both organic and inorganic forms (Andrews et al., 1998; Simon et al., 2002).
Microbial activities are likely to control the aggregation and disaggregation of particulate matter through decomposition and mineralization (Simon et al., 2002). It has been suggested more recently that SPM is also composed of microbial assemblages (including plankton, bacteria, and protozoans) (Simon et al., 2002; Dalu et al., 2016) and as a result of the high level of organic matter it contains, SPM will be a relevant diet source for microfauna and macrofauna (Gasparini et al., 1999; Mills et al., 2004; McTigue and Dunton, 2014). Because of its high potential content of organic carbon (Hedges et al., 2001; Middelburg and Herman, 2007), SPM is likely to be essential for carbon sequestration in sediment. Furthermore, bioavailable particulate matter derived primarily from phytoplankton is the dominant food supply for the food web (Sobczak et al., 2002).
Duarte et al. (2013) explained that only half of seagrass carbon net production is exported to and buried in sediment. SPM in seagrass ecosystems that may be composed of seagrass detritus should be a part of that downward flux; however, as mentioned by Wahyudi et al. (2016), there is uncertainty in the estimation of SPM compared to the potential capacity of carbon storage in seagrass sediment. Therefore, it is necessary to elucidate the fate of the SPM to understand the best estimation value of SPM contribution to carbon burial. The objective of this study is to measure the decomposition rate of SPM using an in situ incubation approach. The decomposition rate of SPM is a pivotal factor in predicting its fate after it has formed within the water column. Measuring SPM decomposition rate will be an initial step in understanding the role of microbial assemblages in the aggregation and disaggregation process.
Seagrass ecosystem SPM was collected from Sikka, East Nusa Tenggara (8°35′58.308″S, 122°11′27.528″E) in August 2017 and from Sorong, West Papua (Sop Island: 0°53′17.988″S, 131°12′36.972″E; and Nana Island: 0°54′9.972″S, 131°13′49.98″E) in April 2018 (Fig. 1). The seagrass extent at the Sikka study site was recorded as 283.39 hm2 and at the Sorong site i.e., Nana Island and Sop Island, as 0.037 hm2 and 0.084 hm2, respectively.
Observation of SPM flux was conducted in the study site seagrass meadows using the SPM trap method (Wahyudi et al., 2016). At Sikka study site, SPM traps were placed following a 2×6 matrix parallel to the shoreline with a distance of 100 m between each trap. The first row was aligned about 150 m from the shoreline. One trap unit consist of two tubes, so in total 24 tubes were deployed. Meanwhile, at the Sorong study site with narrower seagrass meadows fewer traps were deployed as adjustment following the seagrass extent.
After 24 h, the traps were retrieved from the field. The SPM trapped in the tubes were collected by filtration using pre-combusted (450°C, 6 h) Whatman glass fiber filter GF/F (d=25 mm). The filtered SPM samples (residue) were stored in a freezer at −20°C for further analysis (i.e., determination of organic carbon/Corg, nitrogen/Ntot, δ13C, δ15N, and C/N ratio by using elemental analyzer-isotope ratio mass spectrophotometer). The flux rate was measured following Wahyudi et al. (2016). The vertical flux of organic carbon was estimated using the following equation:
| $$ {\rm{Hourly}}\;{{\rm{C}}_{{\rm{flux}}}} = {\left( {{{\rm{C}}_{{\rm{org}}}}{{/t}}} \right)/\left( {ia \times {{10}^{ - 4}}} \right){\text{,}}} $$ | (1) |
where Cflux is organic carbon flux; Corg is organic carbon content of aggregates; t is trapping periods; ia is internal mouth area of the collection surface of a sediment trap in cm2.
The incubation station for the in situ decomposition rate experiment was located at Wailiti Station, Maumere, Sikka (8°35′58.308″S, 122°11′27.528″E). The experiment was conducted on August 2017 during the southeast monsoon season. The another set of SPM traps were deployed following a 2×6 matrix parallel to the shoreline. The in situ incubation was conducted a day after the SPM was collected using SPM traps. It was assumed that the SPM was collected with homogeneous conditions of SPM dynamics (production, turbidity, physical factors, etc.). After 24 h of collection, the tubes in the traps were sealed using plastic lids and left out in the field. Then, a destructive or non-continuous sub-sampling approach was used, i.e. five tubes per day were retrieved from the area on days 0 to 4 (total of 96 h). The tube content was filtered using pre-combusted (450°C, 6 h) Whatman glass fiber filter GF/F (d=25 mm). The filtered SPM samples (residue) were stored in a freezer at −20°C for further analysis (i.e., Corg, Ntot, δ13C, δ15N and C/N ratio). The decomposition rate was determined by analyzing the changes of the Corg and Ntot of the SPM that collected from different days of incubation. Four days incubation maybe not long enough for the SPM to decompose completely. However, the decomposition rate can be estimated from the changes in organic carbon and nitrogen concentration.
The SPM residue within the GF/F was acidified using concentrated HCl fumes for 3 min. This method was applied following Schlacher and Connolly (2014), Wahyudi et al. (2016), and Wahyudi and Afdal (2019). The acidified residue was placed in a vacuum desiccator for 24 h together with concentrated NaOH pellets to neutralize the acid. The residue was removed from the desiccator and oven-dried at 60°C. The dried SPM residue was packed using a tin capsule (Elemental Microanalysis D1104 10.5 mm×9 mm) following Wahyudi et al. (2019). Further analysis was conducted using an isotope ratio mass spectrometer (Thermo Delta plus XP coupled to a trace Gas Chromatography Ultra with a Combi PAL autosampler). The investigation was carried out at Iso-trace Research, University of Otago, New Zealand.
Stable isotope ratios of 13C/12C and 15N/14N are expressed as δ13C and δ15N, respectively. The isotopic ratios were normalized using standard gas Vienna Pee Dee Belemnite (VPDB) and atmospheric N2. Isotope ratio (R) calculation, given as per-million (‰) deviation from the standard value, where:
| $$ {{R}}{{\rm{ = }}^{{\rm{13}}}}{\rm{C}}{{\rm{/}}^{{\rm{12}}}}{\rm{C}}\;{\rm{or}}\;{{R}}{{\rm{ = }}^{{\rm{15}}}}{\rm{N}}{{\rm{/}}^{{\rm{14}}}}{\rm{N,}} $$ | (2) |
| $$ {\rm{\delta }}\left( {\rm{‰}} \right){\rm{ = }}\left[ {\left( {{{{R}}_{{\rm{sample}}}}{\rm{/}}{{{R}}_{{\rm{standard}}}}} \right)- 1} \right]{{ \times 1}}\;{\rm{000}}. $$ | (3) |
The isotopic and elemental values were determined using laboratory reference materials (USGS-40 and USGS-41), and control materials (Ethylene-diamine-tetra-acetic-acid/EDTA-OAS) were used to determine precision and accuracy. The experimental precision (based on standard deviation of replicates of (EDTA-OAS standard) was ≤0.13‰ for both carbon and nitrogen stable isotope.
The proportional contribution of the potential sources to SPM was determined using a hierarchal Bayesian mixing model analysis using MixSIAR (Stock and Semmens, 2016) following Wahyudi and Afdal (2019), except for Markov chain Monte Carlo (MCMC) using “very short” run, in order to obtain Gelman diagnostics of <1.05. Then, the isotopic signature (i.e., δ13C and δ15N) of the potential sources, and SPM were analyzed. The isotopic signature of the potential sources as used by Wahyudi and Afdal (2019) were analyzed in this present study, namely, periphyton, Chlorophyta, C3 and C4 plants (Liu et al., 2007a), soils, estuary SPM (eSPM), bay SPM (bSPM), river sediment, Enhalus acoroides (EA; both above and below ground), Thalassia hemprichii (TH), particulate organic matter (POM), and marine SPM (mSPM; several isotopic signatures by Kaiser et al. (2014) and Liu et al. (2007b)). MixSIAR generated the mixing model based on the all δ13C and δ15N data of the potential sources and SPM to determine the contribution of each potential composing source to the SPM. Determination of the end-member (terrigenous or marine-end member) followed Lamb et al. (2006), Gilhooly et al. (2008), Bao et al. (2013), and Martiny et al. (2014).
The carbon flux per day was calculated by multiplying carbon flux per hour with 24 h. The decomposition rate of SPM was estimated following the regression obtained from the changes of the Corg and Ntot of the SPM that collected from different days of incubation. The total decomposed SPM was calculated by using the following formula.
| $$ {{\rm{D}}_{{\rm{spm}}}}{\rm{ = }}{{\rm{D}}_{{\rm{rate}}}}\times{{\rm{C}}_{{\rm{flux}}}}{\rm{,}} $$ | (4) |
where Dspm is the total decomposed SPM in the study site, Drate is decomposition rate, and Cflux is the total downward carbon flux of the SPM.
Statistical analysis to determine the differences in the SPM isotopic profile and flux between the two locations, Sorong and Sikka, were performed using the Wilcoxon signed-rank test with a confidence level (Cl) of 95% using R version 3.6.2 (2019-12-12). Pearson correlation analysis was also performed to test the potential correlation among variables.
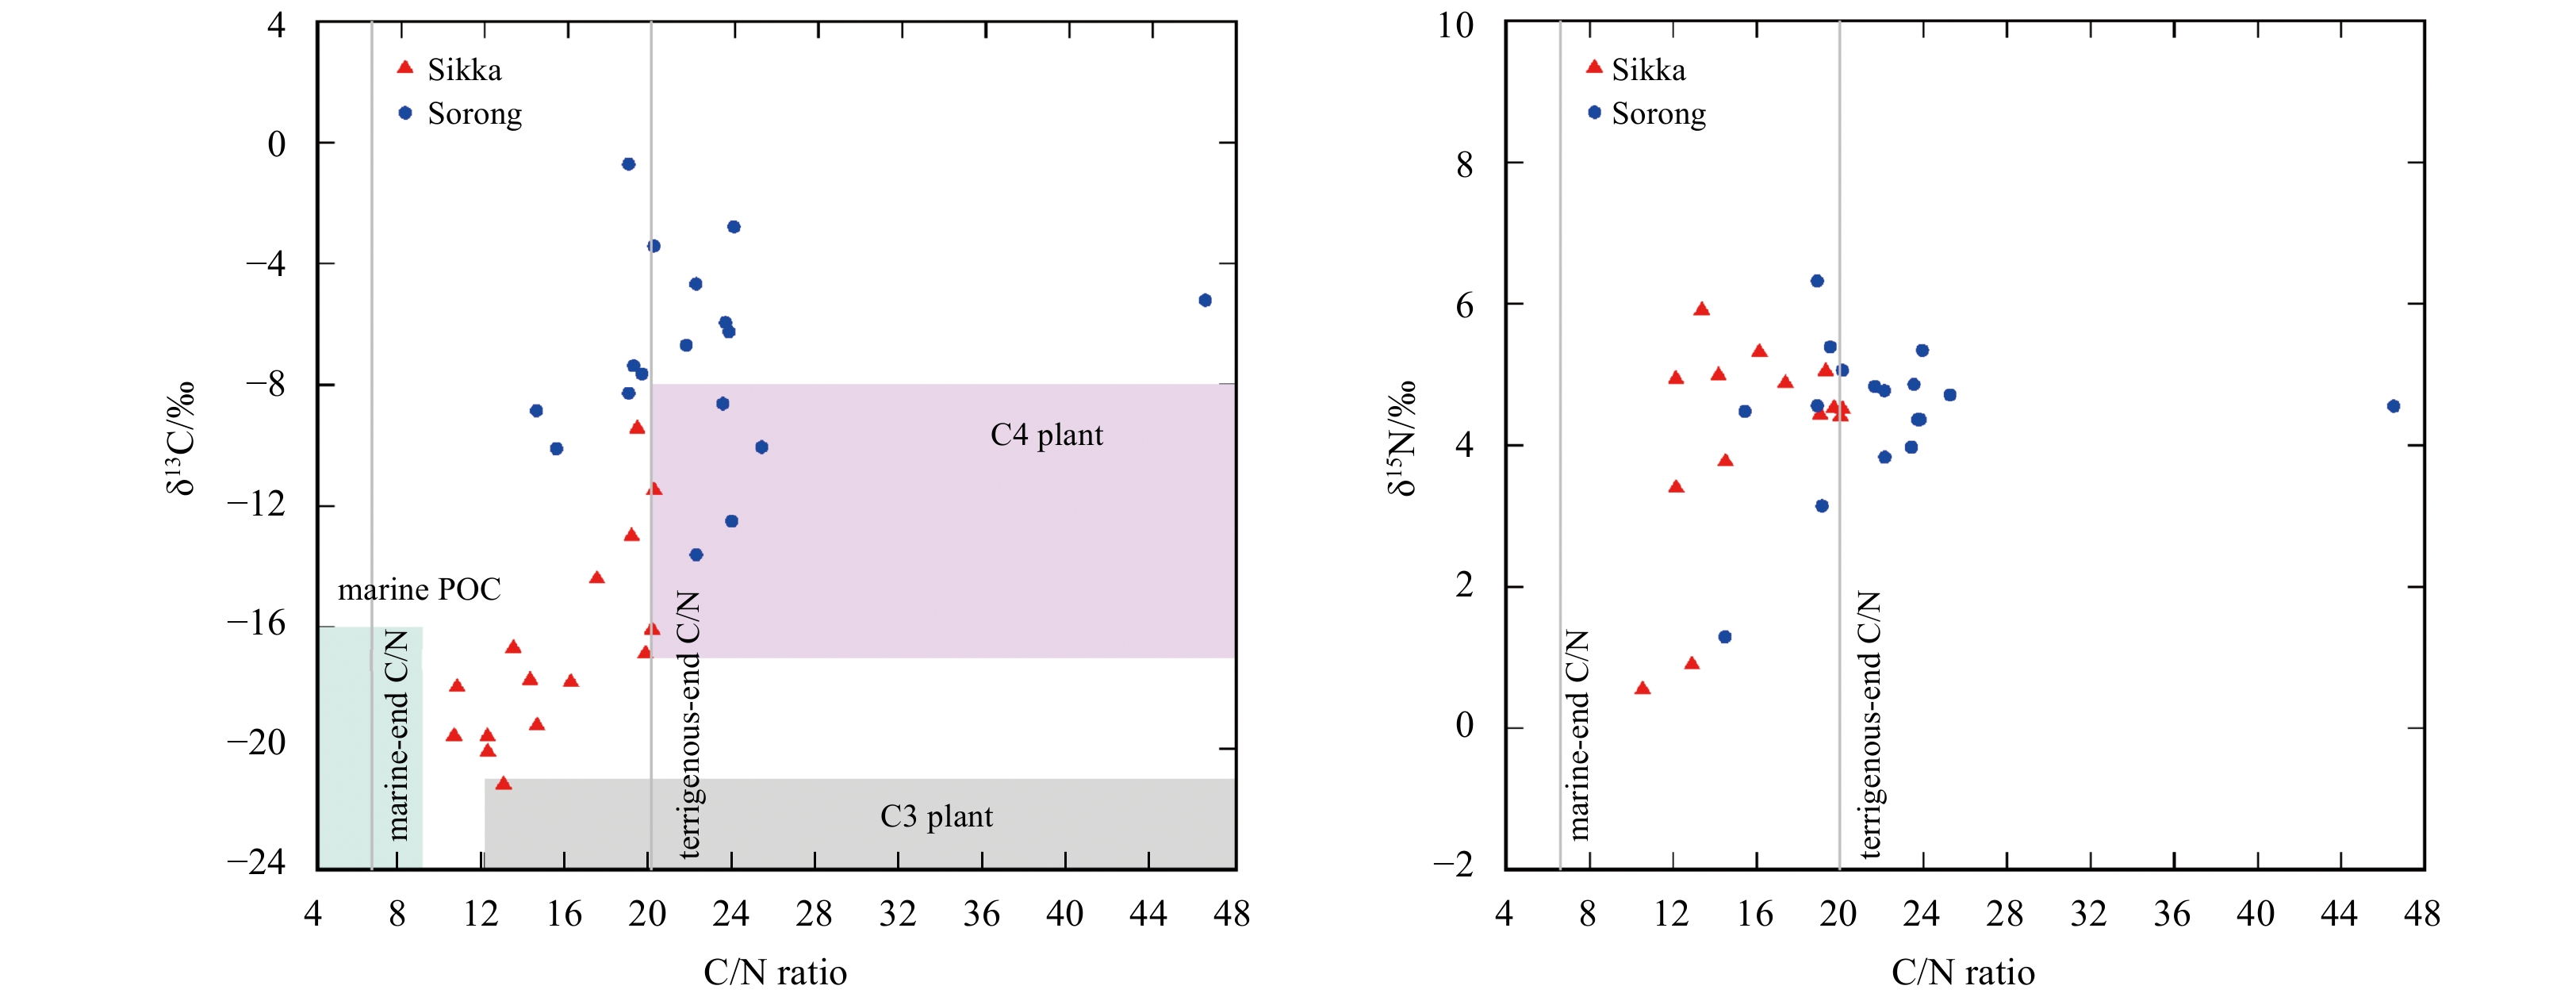
The C/N ratio of SPM from Sikka ranged from 10.53 to 20.11. Meanwhiles, the C/N ratio of SPM from Sorong ranged from 14.48 to 46.52. The range of δ13C and δ15N value of SPM from both study site is −22.12‰ to −0.71‰ and 0.54‰−6.32‰, respectively (Table 1, Fig. 2). Statistical analysis shows significant difference in the C/N ratio of SPM from Sorong and Sikka (Wilcoxon signed-rank test, p-value<0.01), with SPM from Sorong having nearly twice the C/N ratio of Sikka.
| Location | δ15N /‰ | δ13C /‰ | C:N ratio | Ntot flux /(µg·h−1)* | Corg flux /(µg·h−1)* | Ntot flux /(mg·m−2·h−1) (according to nitrogen) | Corg flux /(mg·m−2·h−1) (according to carbon) |
| Sikka | 4.10±1.56 | −16.76±3.36 | 15.47±3.53 | 2.96±0.72 | 38.48±10.10 | 4.80±1.17 | 62.52±16.41 |
| Sorong | 4.01±1.36 | −7.22±3.36 | 22.50±6.89 | 5.89±3.41 | 79.67±33.10 | 9.56±5.54 | 129.45±53.79 |
| Note: * Hourly flux of Corg and Ntot trapped in the SPM trap (mouth area: 6.154 4 cm2). | |||||||
 DownLoad:
CSV
DownLoad:
CSV

The downward flux of organic carbon from SPM to the seagrass bed sediment in Sorong is higher than in Sikka, with a rate of (129.45±53.79) mg/(m2·h) (according to carbon) compared with (62.52±16.41) mg/(m2·h) (according to carbon) (Table 1). Wilcoxon signed-rank test also confirms the significantly higher value of organic C and N flux in Sorong compared to Sikka (p-value<0.01, for Corg flux and Ntot flux, respectively).
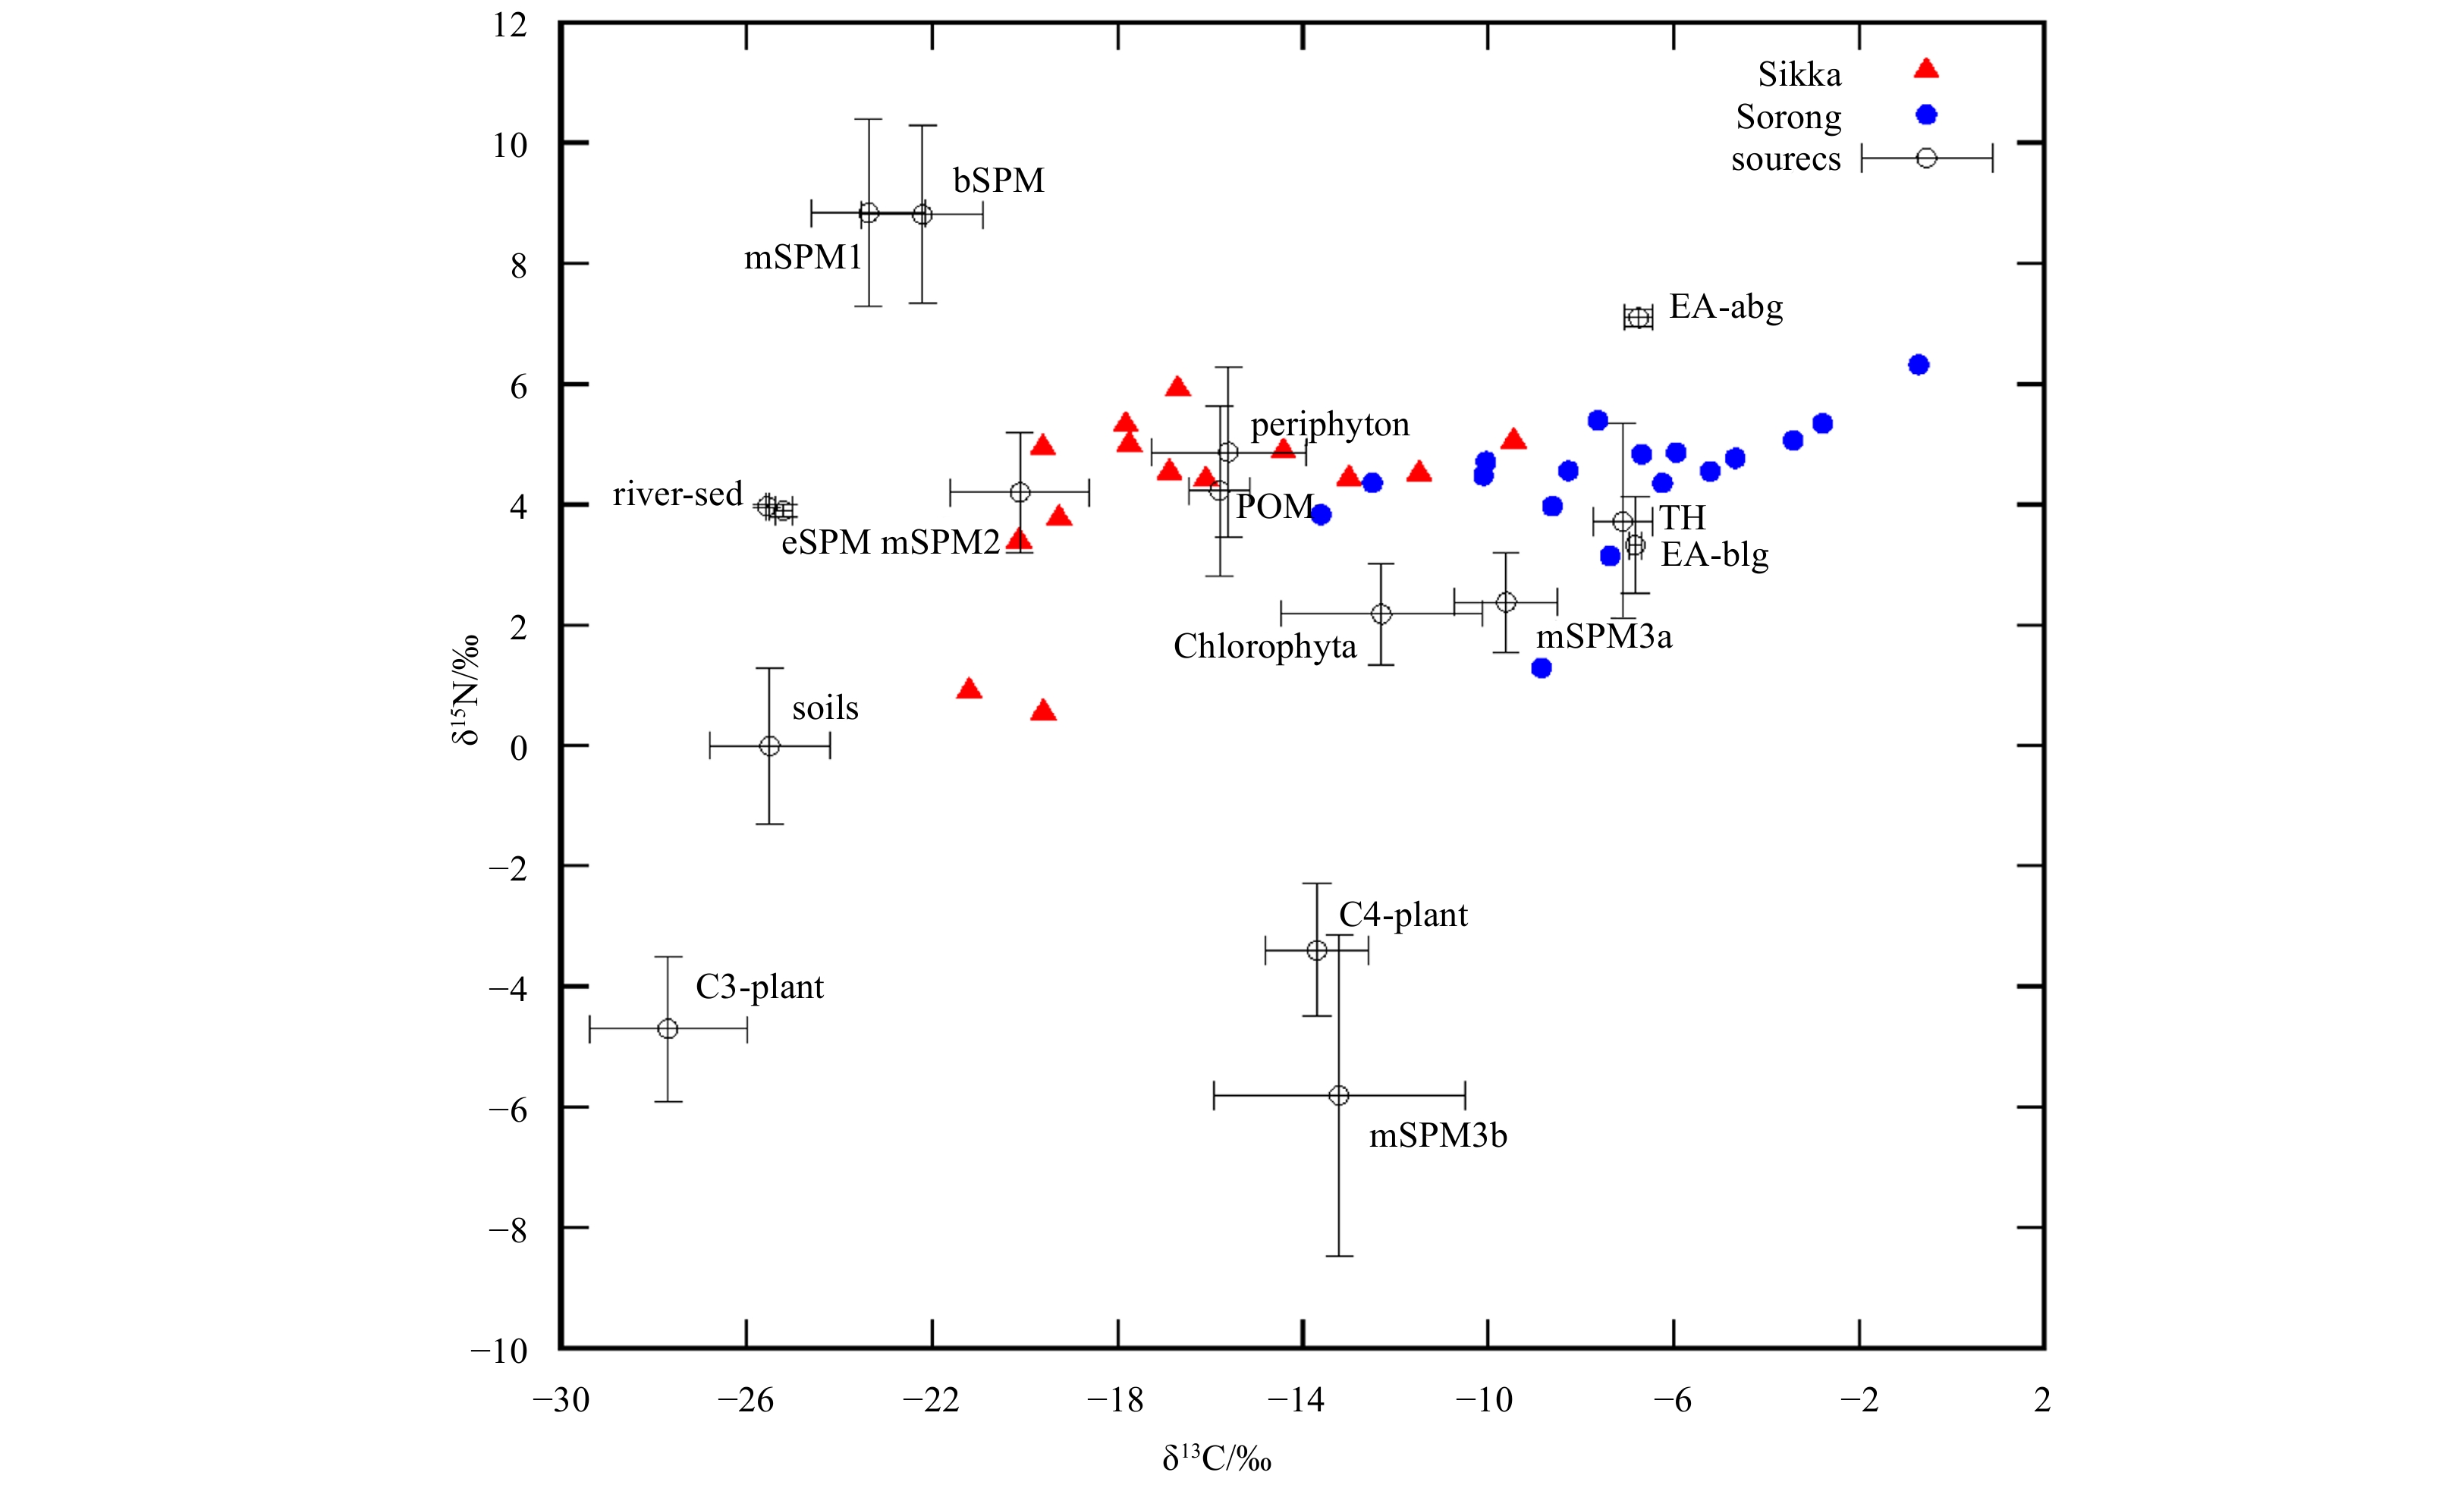
SPM from the Sorong seagrass ecosystem has heavier δ13C than SPM from Sikka (Fig. 3). The statistical analysis also shows significant differences (Wilcoxon signed-rank test; p-value<0.01, Cl 95%). However, the δ15N seems to be comparable between the two sites. Potential sources of SPM at both locations varied, including seagrass detritus (EA represents Enhalus acoroides and TH represents Thalassia hemprichii), Chlorophyta (green macroalgae), C4 and C3 plants, soil, particulate organic matter (POM) and periphyton (Fig. 3).

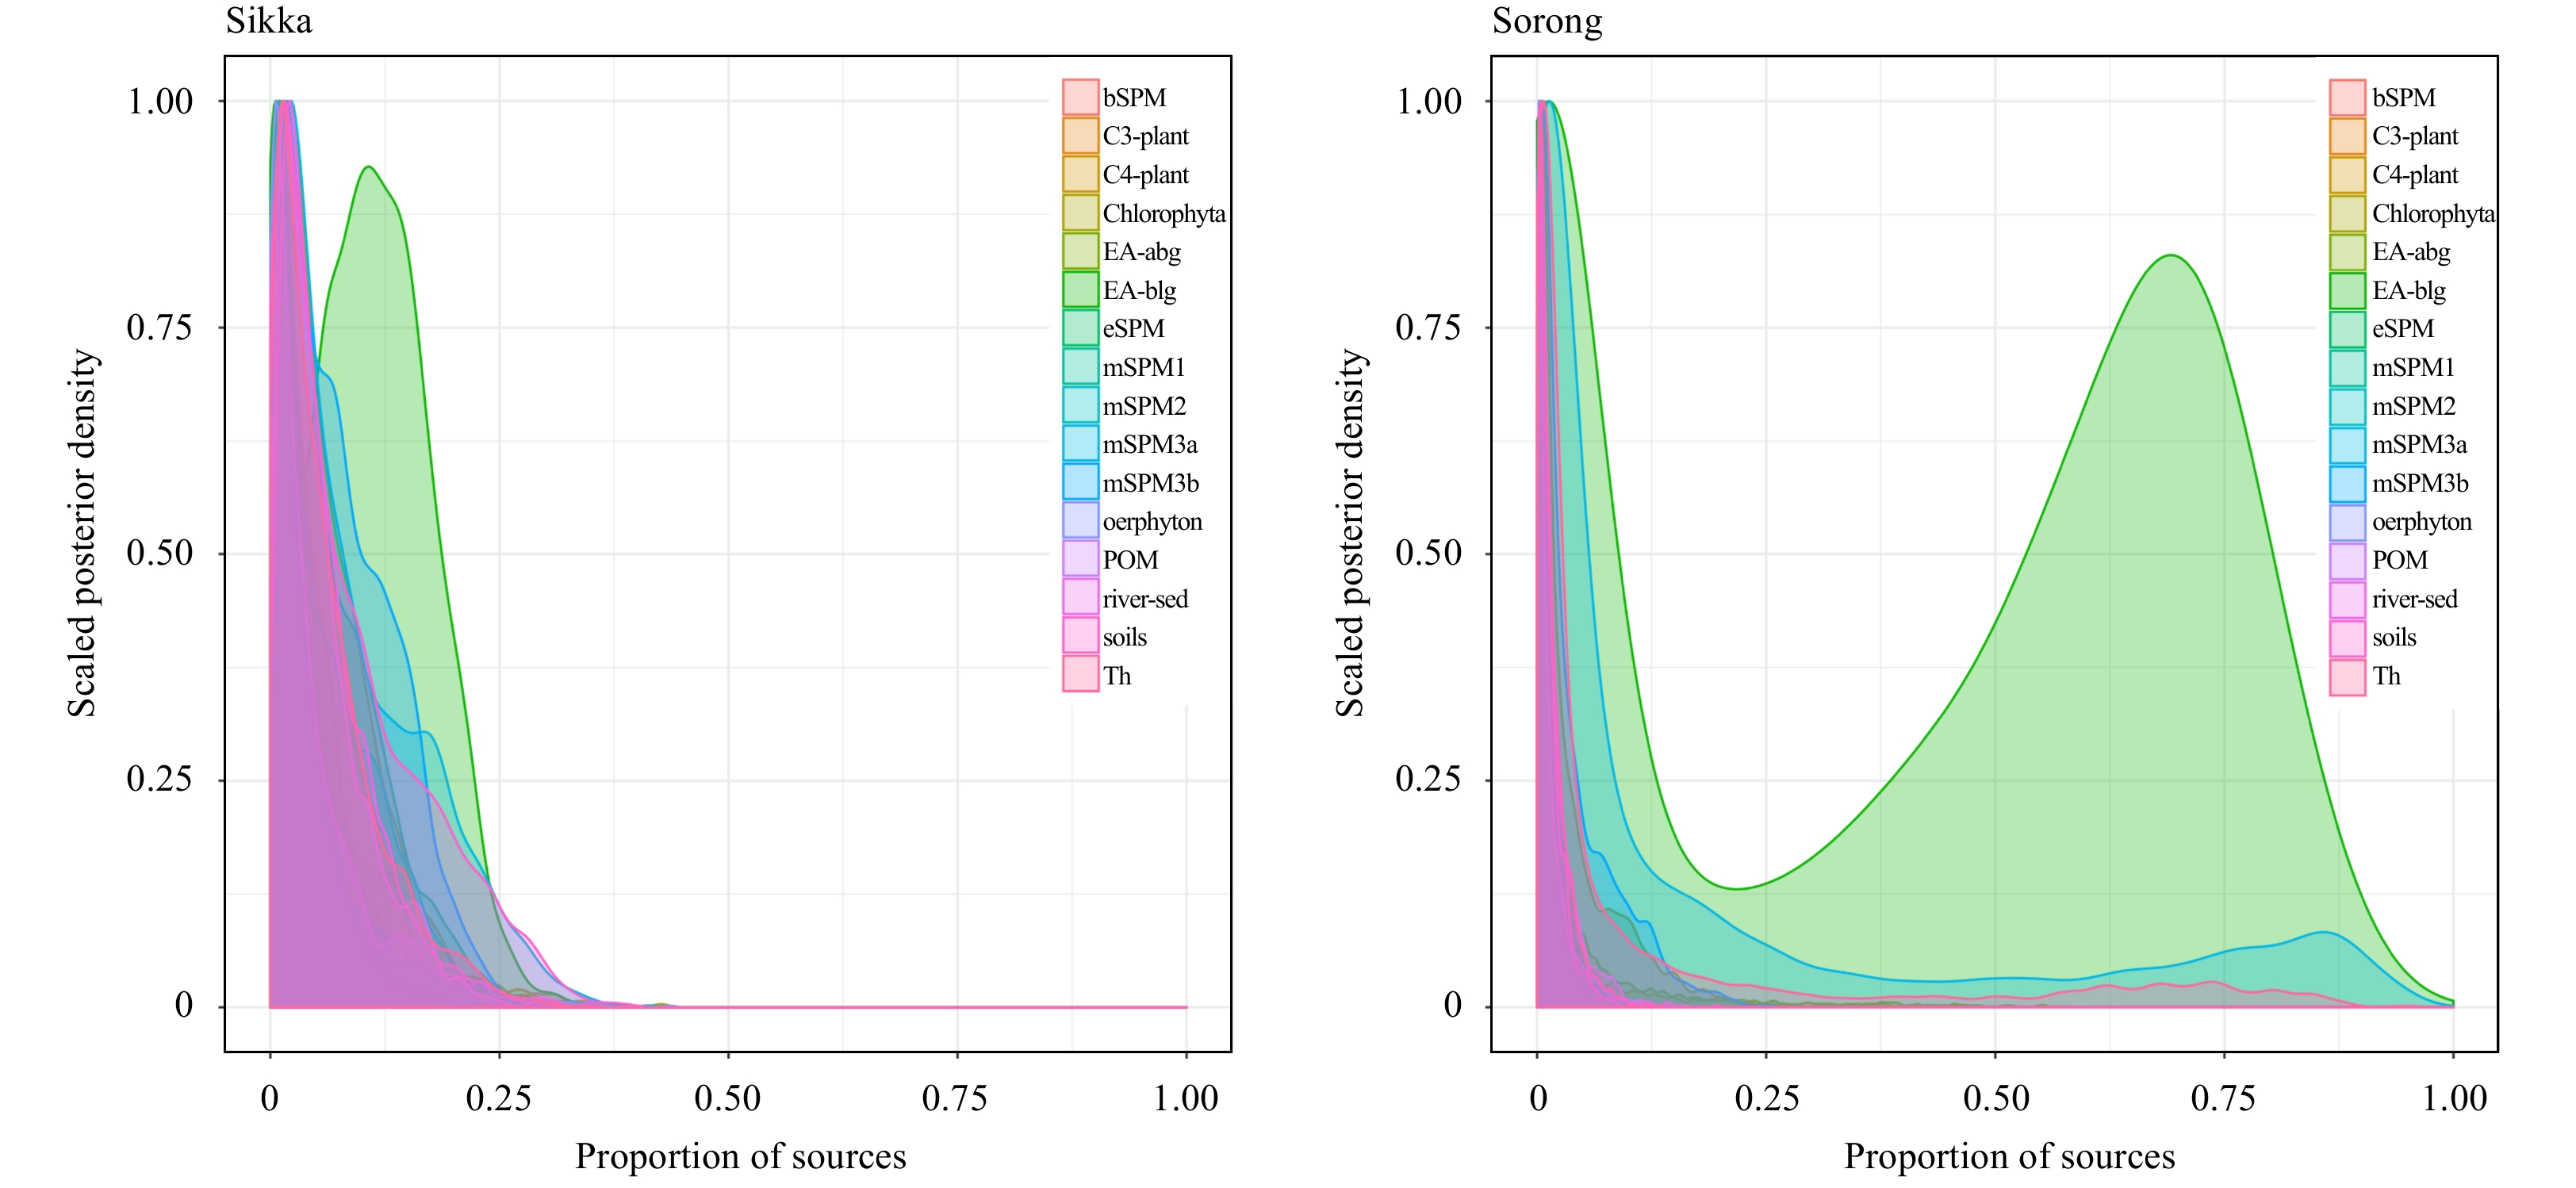
Bayesian mixing model results reveal the dominant contribution of E. acoroides (especially the below-ground part of the plant) to the SPM at both Sikka and Sorong (Fig. 4). The average contribution of E. acoroides (below ground/EA-Blg) detritus to SPM is 10% and 41% for Sikka and Sorong, respectively. The maximum contribution of EA-Blg for SPM in Sikka and Sorong is 15% and 69%, respectively.

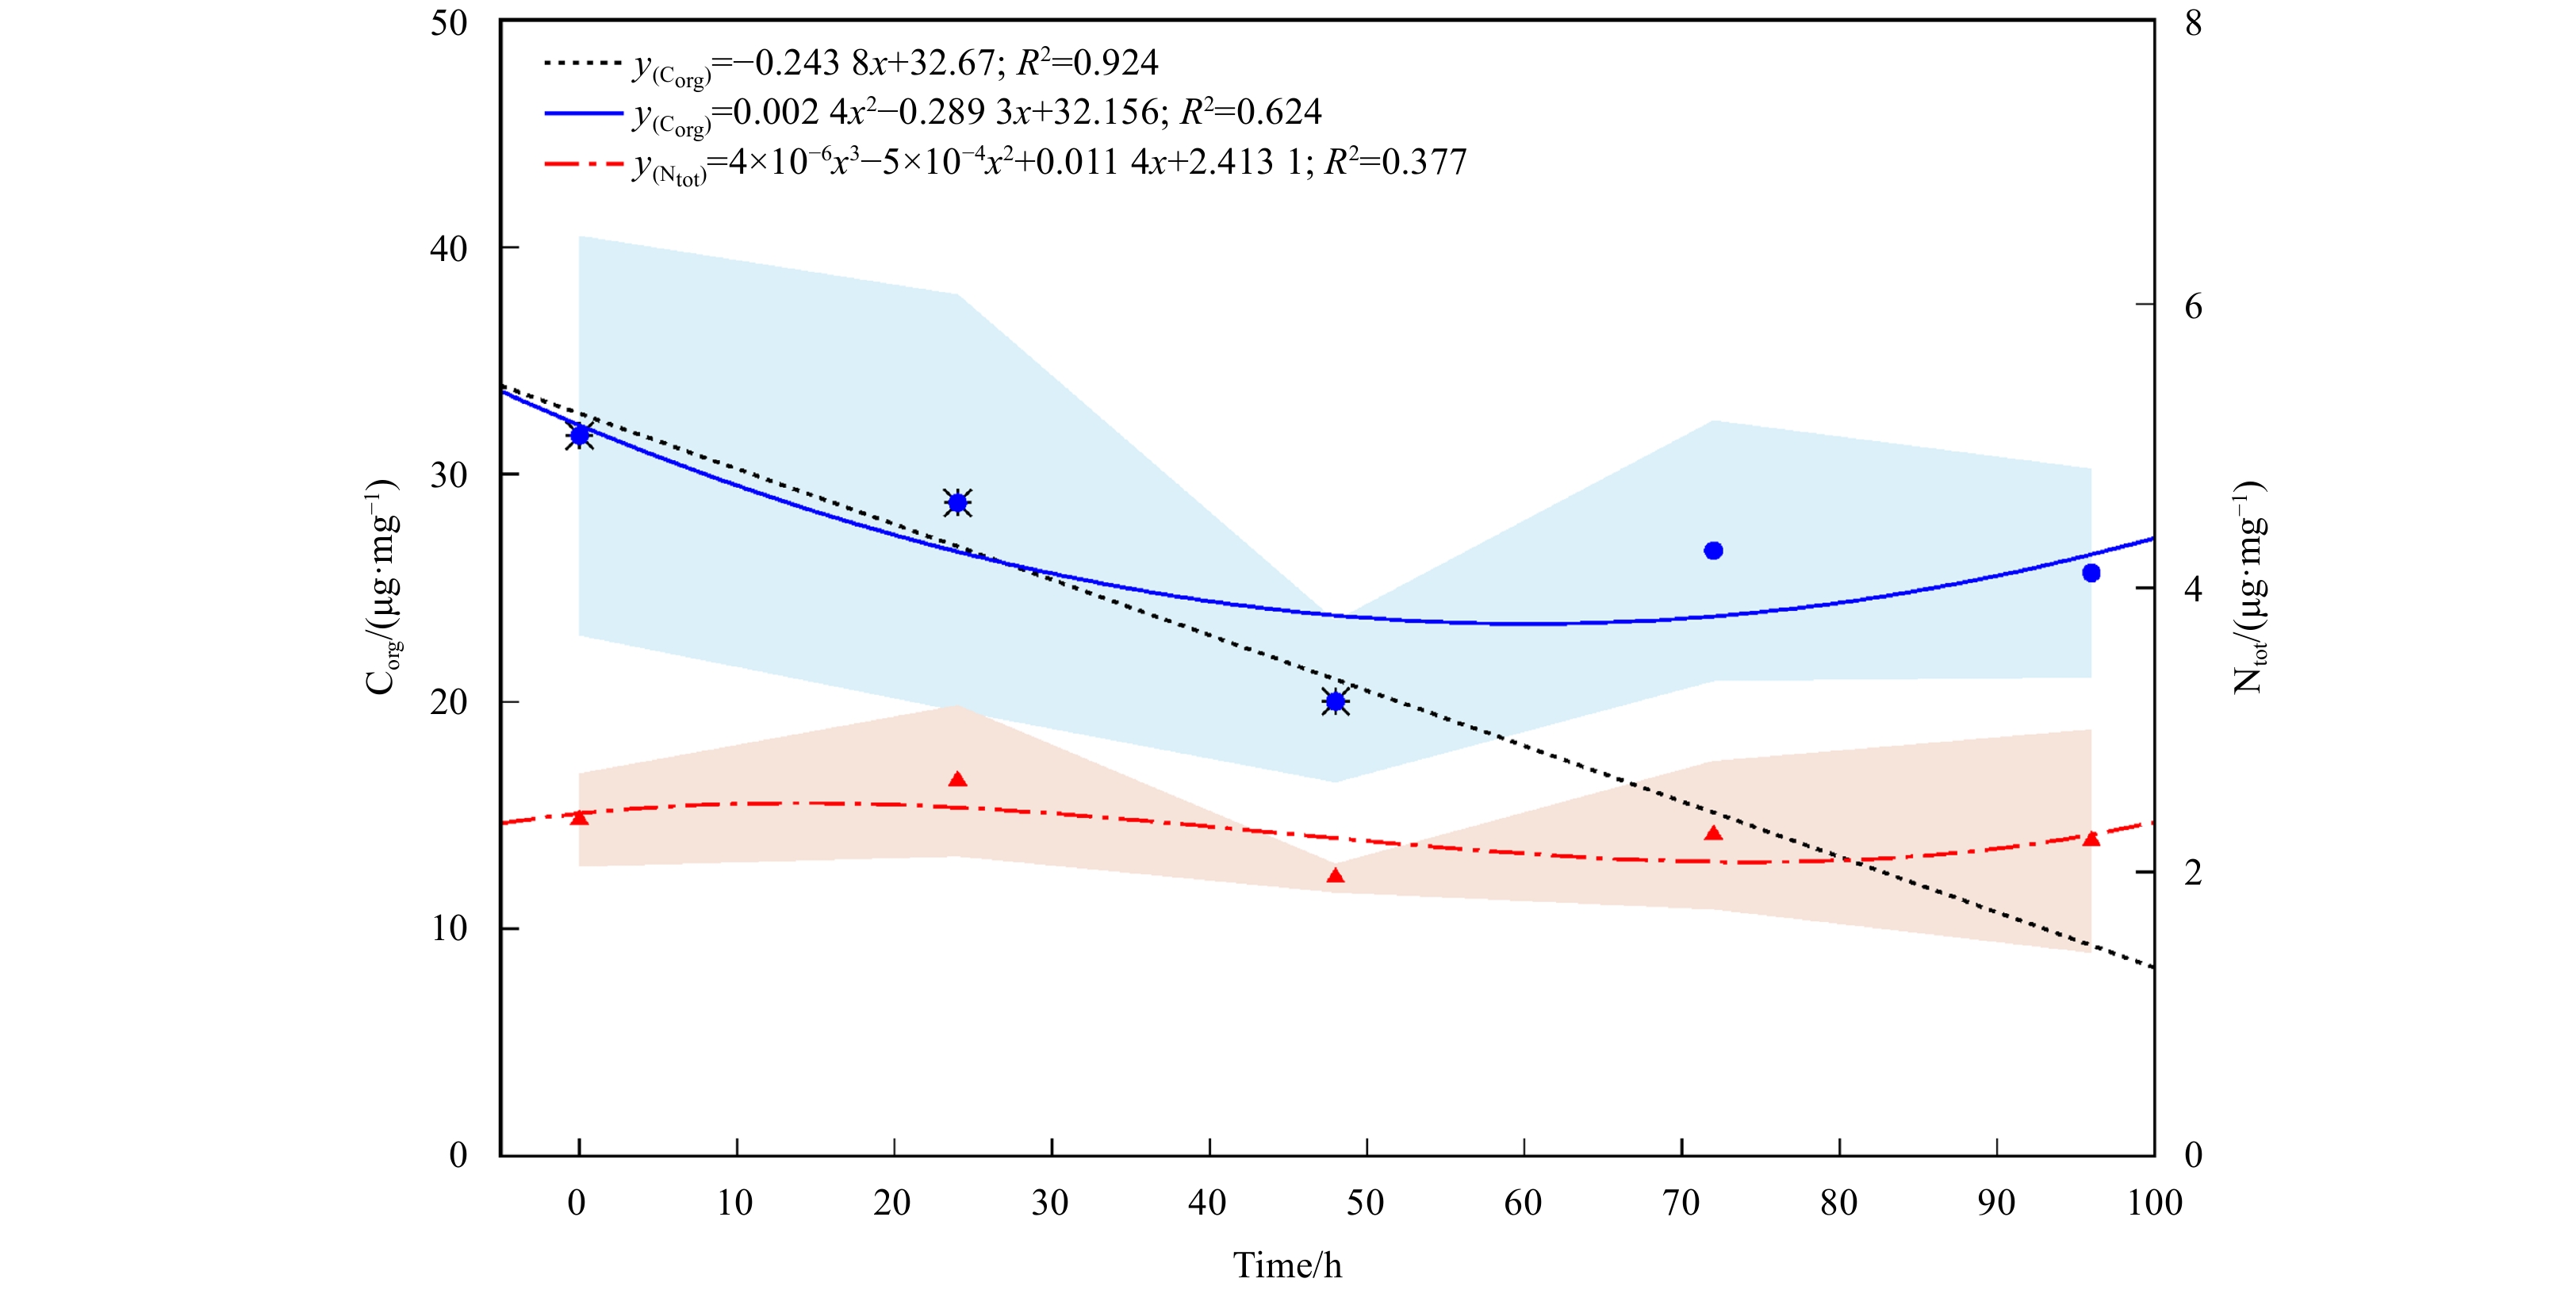
The decomposition rate of SPM in seagrass ecosystems follows polynomial regression (Fig. 5). Organic carbon of SPM decreases following polynomial regression order two, y=0.002 4x2−0.289 28x+32.156 (R2=0.62). Meanwhile, total nitrogen of SPM also decreases following polynomial regression order three: y=4×10−6x3−5×10−4x2+0.011 4x+2.413 1 (R2=0.38). During the first half of incubation (up to 48 h), the decrease in SPM organic carbon follows linear regression y=−0.243 8x+32.673 (R2=0.92). Using linear regression within the first 48 h, SPM organic carbon will decrease about 5.9 µg/(mg·d) (according to carbon), meanwhile using polynomial regression level two, the SPM organic carbon will decrease up to 26.6 µg/(mg·d) (according to carbon). In addition, the total nitrogen of SPM was estimated to decrease by up to 2.5 µg/(mg·d) (according to nitrogen).

Using the estimated decomposition rate (i.e. 5.9 µg/(mg·d) (according to carbon) to 26.6 µg/(mg·d) (according to carbon)), the decomposition of the SPM traveling downward can be determined. Given the SPM vertical flux at Sorong and Sikka of 3 107mg/(m2·d) and 1 500 mg/(m2·d) (according to carbon) (by converting the flux per hour on Table 1 to flux per day); the decomposed SPM of Sorong and Sikka can be estimated at 8.9–39.9 mg/(m2·d) (according to carbon), and 18.3–82.6 mg/(m2·d) (according to carbon), respectively. Thus, decomposed SPM can be between 0.6% and 2.7% of the total SPM flux.
Both parameters (C/N ratio and isotope value) show the tendency of autochthonous marine derived materials as SPM sources. According to the C/N ratio (criteria proposed by Gilhooly et al. (2008)), some of the SPM samples lie within the range of terrigenous end-members (i.e., C/N ratio around 20, especially in the SPM from the seagrass bed at Sorong (Table 1; Fig. 2). In contrast, SPM from the seagrass ecosystem at Sikka has a slight tendency to be marine-derived materials. However, Lamb et al. (2006) suggested that we cannot rely only on the C/N ratio. Marine algae and marine particulate organic matter have a C/N ratio ranged from 4 to 10, with δ13C value ranged from −25‰ to −16‰. Furthermore, Bao et al. (2013) reported the C/N ratio of seagrass (no specific species) is around 18.6. Touchette and Burkholder (2000) also reported that seagrasses had been regarded as C3 plants or C3-C4 intermediates.
The δ13C of Sorong’s seagrass bed being heavier than that of Sikka. The comparable δ15N found at both seagrass beds shows that the C/N ratio is more affected by carbon concentration. These findings are expected to occur in coastal ecosystems that are heavily affected by terrestrial input. The enrichment of δ15N (around 4.0‰) suggests the influence of anthropogenic nitrogen, a similar suggestion being provided by previous studies (Prasad and Ramanathan, 2009; Wahyudi and Afdal, 2019). These findings are the typical SPM profile for coastal areas. However, the actual composition of the SPM should be determined considering both the carbon and nitrogen isotopic profile.
Considering the classical enrichment of δ13C and δ15N (Post, 2002; Wahyudi et al., 2013), the C4 and C3 plant may have a low contribution to the SPM (Fig. 3), since the δ13C or the δ15N value is far lower than the SPM. The potential sources that previously reported by Wahyudi and Afdal (2019), i.e., SPM from a bay or estuaries (bSPM, eSPM, mSPM1) and riverine sediment may also have insignificant contributions (Fig. 3). Meanwhile, the other potential sources (i.e., Chlorophyta, periphyton, mSPM, E. acoroides, and T. hemprichii) are likely to have a significant proportional contribution.
The Bayesian mixing model (MixSIAR) shows the significant contribution of E. acoroides to the SPM bulk. This finding supports the indication by using the C/N ratio and δ13C parameter. Therefore, it shows that the SPM of both study sites is composed by marine-end materials, primarily by E. acoroides. Other seagrass species have δ13C values ranged from −15.5‰ to −5.6‰ (Andrews and Abel, 1979), which may contribute to the SPM bulk. Therefore, by combining the C/N ratio and isotopic signature, it may suggest that the SPM of Sikka and Sorong composed of autochthonous sources.
The present result is similar to the previous study in Selayar (Wahyudi and Afdal, 2019). The SPM of Selayar seagrass beds also consists of seagrass-derived materials, especially E. acoroides and T. hemprichii. Although, the SPM on seagrass ecosystem that may be disturbed by the anthropogenic activities (e.g., Bintan Island) may show different tendencies, i.e., the major contribution of C4 plant-derived materials (Wahyudi and Afdal, 2019).
It is expected that in seagrass ecosystems categorized as relatively undisturbed, SPM will be mainly composed of seagrass detritus (Wahyudi and Afdal, 2019). These findings suggest that SPM tends to be autochthonous, although the C/N ratio indicates the influence of terrigenous sources. A similar result was reported by Saavedra-Hortua et al. (2020) who found that SPM in seagrass ecosystems exhibited a high percentage of oceanic sources such as seagrass detritus and phytoplankton. However, terrestrial sources may contribute significantly as well. This SPM profile is typical for seagrass ecosystems, especially those that co-occur with other ecosystems, such as mangrove forest.
SPM at Sikka has lower vertical carbon and nitrogen flux than those at Sorong (Table 1). The geolocation of both sites may affect the SPM flux. The coastal waters at Sorong directly affected by the water mass and current from the Pacific Ocean, while the Sikka coastal area located at a bay of Sumbawa Island with water mass from Java Sea or Makassar Strait. The rainfall at Sumbawa relatively lower than that at West Papua (Sachoemar and Yanagi, 2001). This condition may affect the terrestrial inputs to the coastal ecosystem that make a lower SPM flux in Sikka compared to Sorong.
The SPM flux of the present study was also compared to the previous one i.e. at Bintan Island where the SPM rate recorded as 86–106 mg/(m2·h) (according to carbon) (Wahyudi et al., 2016). SPM at Sorong seems comparable to SPM at Bintan Island. The vertical nitrogen flux of Sikka and Sorong is also far lower than Bintan, at around 27–34 mg/(m2·h) (according to nitrogen) (Wahyudi et al., 2016). Bintan Island tends to have low water permeability and water storage capacity because of its rock and soil formation (Narulita et al., 2019) and these influence the water run-out that brings particulate matter to the coastal area. The soil condition of Bintan Island seems different to those in Sikka and Sorong, on which run-out tends to contribute to SPM sources.
The carbon vertical carbon flux of seagrass meadows of Sorong and Sikka is comparable to those in Vietnam and Philippines. Previous study by Kennedy et al. (2004) reported the organic carbon vertical flux of seagrass meadows of Vietnam and Philippines around (32±3) mmol/(m2·d) to 700 mmol/(m2·d). This value equal to 16.01 mg/(m2·h) (according to carbon) to 350.31 mg/(m2·h) (according to carbon), that comparable to carbon vertical flux on Sikka or Sorong. Comparing to those reported by Kennedy et al. (2004), vertical carbon flux of Sorong’s SPM is categorized moderate value (129.45±53.79) mg/(m2·h) (according to carbon).
Considering the seagrass extent of Sikka (283.39 hm2), the potential vertical carbon flux of SPM can be estimated as up to 4.25 tons C per day. Meanwhile, considering the seagrass area at the Sorong study site (Nana Island and Sop Island, recorded as 0.037 hm2 and 0.084 hm2, respectively), the downward carbon flux can be estimated as 1.16–2.60 kg (according to carbon) per day. Since the SPM of seagrass ecosystem of both area composed primarily by seagrass detritus, the present study shows the flux that become potential for carbon burial. As mentioned previously by Holmer and Olsen (2002), that up to 36% of the remineralized seagrass detritus will be distributed to the whole ecosystem or the adjacent area.
Given the confirmed seagrass extent of Indonesia of about 293 464 hm2 (Sjafrie et al., 2018), and using the minimums of 62.52 mg/(m2·h) (according to carbon) and 129.45 mg/(m2·h) (according to carbon), respectively, the total SPM flux downward to the floor of seagrass beds can be expected to be between 183.47 t/h (according to carbon) and 379.89 t/h (according to carbon). These values can be used to estimate the carbon flux depending on the period of submersion for each area. Given the carbon flux value contributed by SPM, it shows the importance of the contribution of SPM to carbon burial in seagrass beds.
However, the dynamics of SPM distribution and flux depend on many factors. Physical properties of SPM such as particle size and settling velocity may affect the fluxes (Fettweis and Baeye, 2015). Seasonal variation of SPM concentration, as well as physical oceanographic factors, may affect distribution and flux (Fernandes et al., 2009; Fettweis and Baeye, 2015). Moreover, active resuspension/deposition due to turbulent mixing may affect SPM flux (Zhang et al., 2007). Considering these kinds of factors, estimation of the SPM contribution to large-scale carbon burial requires collection of several in situ observation data sets that represent different sites.
Because of the likely percentage of decomposed SPM, i.e. a maximum of 2.7%, an insignificant amount of SPM decomposition may be expected. However, failure to estimate this decomposition will lead to overestimation of SPM flux and potential carbon burial. For instance, if carbon burial through SPM downward flux in Indonesia is estimated at between 183.47 t/h (according to carbon) and 379.89 t/h (according to carbon), about 4.95–10.26 t/h (according to carbon) would be decomposed, leaving a maximum of 369.63 t/h (according to carbon).
The decomposition rate of SPM as estimated between 5.9 µg/(mg·d) (according to carbon) and 26.6 µg/(mg·d) (according to carbon) may suggest an insignificant value. A similar study of particulate organic matter (POM) by Seiki et al. (1991) suggested that the labile fraction (i.e. 70%–80%) was completely decomposed within 40 d at 20°C. Meanwhile, 20%–30% of POM (i.e. the refractory fraction) would remain or be only partly decomposed. Therefore, it can be expected that a little part SPM of seagrass meadows may be composed of the refractory fraction. The slight tendency of SPM to be composed of terrigenous end-members is relevant since terrigenous sources show a significant contribution to the refractory particles (Volkman et al., 2008). However, this present study suggest the main contributor of the SPM is autochthonous (i.e. E. acoroides detritus). Rates of seagrass decomposition (usually <1% of dry wt per day) are generally low compared with other vascular macrophyte sources of detritus (Harrison, 1989). Thus, the low decomposition rate of SPM as estimated in the study site may be caused by the main composition of the SPM. However, the short incubation time may also affect the decomposition rate estimates.
The total nitrogen decomposition value of the SPM with an insignificant rate (R2=0.377 2) shows the dynamic aggregation–disaggregation process of SPM. Furthermore, there is a possibility that after 48 h, the SPM organic carbon and nitrogen may increase although never reaching the starting value of organic matter. There are several possibilities regarding the increase of the organic matter value after 48 h of incubation, such as being contributed to by the increase of microbes, the remineralization process, and fixation of transparent exopolymer particles (TEP). Particulate matter decomposition shows a non-linear decrease of organic matter reflecting the role of bacterial assemblages during downward flux (Karl et al., 1988). Furthermore, extracellular discharges of polysaccharides and proteins from the bacteria may occur into particulate transparent exopolymer particles (p-TEP) in the water column (Bar-Zeev et al., 2009; Dehwah et al., 2019).
However, another reason for SPM decomposition rate not exhibiting linear correlation may be underestimation or overestimation. Although the SPM was incubated in a closed system within the tube and placed in the field with temperature and salinity matching actual conditions, several aspects are likely to be uncontrollable, including the microbe community dynamic and dissolved matter production. In order to elucidate this condition, it is suggested that future research should compare and overlay the decomposition rate of SPM with the forming of dissolved materials (i.e. dissolved organic matter) and TEP within the water column. Furthermore, microbiology analysis may be performed e.g., microbe cell counting following the potential change of SPM over time.
Some weakness of in situ SPM incubation may have caused discrepancies that occurred in the present study. Since a micro-scaled closed system was used in which SPM was put into tubes with plastic lids. Saturated organic matter might have occurred during the 96-h incubation period since there was no seawater exchange. For further research, it is suggested that water-permeable membrane lids be used that could ensure the physical condition (temperature, salinity, pH) of the seawater inside and outside the tube is homogenous. The other weakness is the destructive or non-continuous sub-sampling approach, i.e. different tubes for each sub-sampling. This non-continuous approach is appropriate but should use more replication to ensure statistically robust data.
Although the present study is still far from complete as a result of the weaknesses explained above, enabling estimation of decomposition rate may lead to more exact carbon burial estimation in seagrass ecosystems as contributed by SPM. Further study may be conducted using a different approach and/or by adding sampling sites that may represent a wider-scale spatial area.
The present research suggests several findings on SPM dynamics in seagrass ecosystems. Carbon deposition at the bottom of the seagrass ecosystem is partly contributed to by downward flux of SPM. The profile of SPM in the seagrass ecosystems of Sorong and Sikka shows an autochthonous tendency with the primary composition of marine-end materials. The decomposition process of SPM within the water column may contribute to the total carbon budget exported to the bottom of the seagrass ecosystem. The decomposition rate was estimated at 5.9 µg/(mg·d) (according to carbon) to 26.6 µg/(mg·d) (according to carbon). Considering the total downward flux of SPM in the study site, the maximum decomposed SPM at Sorong and Sikka was estimated at 39.9 mg/(m2·d) (according to carbon) and 82.6 mg/(m2·d) (according to carbon), respectively. Therefore, the decomposed SPM is 0.6%–2.7% of the total SPM flux. This proportion indicating the little amount of the decomposed SPM compared to the total flux. This SPM decomposition may lead to the overestimation of carbon burial, even though the decomposition value may be negligible. Further study can be conducted using a technically adjusted approach.
We thank the LIPI’s Priority Research Program (COREMAP-CTI) for funding field sampling during the 2017 and 2018 fiscal year. AJW (as the primary contributor) designed, led the study, managed the isotope analysis, and wrote the first draft of the manuscript; KT performed the statistical analysis, provided the study site map, proofread and edited the manuscript; AJW, AA, HBP, and HM conducted field sampling; SL and ET conducted laboratory analysis. All authors provided works of literature, conducted manuscript proofreading, and approved the final version of the manuscript.
| [1] |
Andrews T J, Abel K M. 1979. Photosynthetic carbon metabolism in seagrasses 14C-labeling evidence for the C3 pathway. Plant Physiology, 63(4): 650–656. doi: 10.1104/pp.63.4.650
|
| [2] |
Andrews J E, Greenaway A M, Dennis P F. 1998. Combined carbon isotope and C/N ratios as indicators of source and fate of organic matter in a poorly flushed, tropical estuary: Hunts Bay, Kingston Harbour, Jamaica. Estuarine, Coastal and Shelf Science, 46(5): 743–756. doi: 10.1006/ecss.1997.0305
|
| [3] |
Anthony K R N. 1999. Coral suspension feeding on fine particulate matter. Journal of Experimental Marine Biology and Ecology, 232(1): 85–106. doi: 10.1016/S0022-0981(98)00099-9
|
| [4] |
Bao Hongyan, Wu Ying, Tian Lixin, et al. 2013. Sources and distributions of terrigenous organic matter in a mangrove fringed small tropical estuary in South China. Acta Oceanologica Sinica, 32(4): 18–26. doi: 10.1007/s13131-013-0295-3
|
| [5] |
Bar-Zeev E, Berman-Frank I, Stambler N, et al. 2009. Transparent exopolymer particles (TEP) link phytoplankton and bacterial production in the Gulf of Aqaba. Aquatic Microbial Ecology, 56(2–3): 217–225. doi: 10.3354/ame01322
|
| [6] |
Bouillon S, Connolly R M. 2009. Carbon exchange among tropical coastal ecosystems. In: Nagelkerken I, ed. Ecological Connectivity among Tropical Coastal Ecosystems. Dordrecht, the Netherlands: Springer, 45–70, doi: 10.1007/978-90-481-2406-0_3
|
| [7] |
Dalu T, Richoux N B, Froneman P W. 2016. Nature and source of suspended particulate matter and detritus along an austral temperate river–estuary continuum, assessed using stable isotope analysis. Hydrobiologia, 767(1): 95–110. doi: 10.1007/s10750-015-2480-1
|
| [8] |
Dehwah A H A, Anderson D M, Li Sheng, et al. 2019. Transparent exopolymer particle binding of organic and inorganic particles in the Red Sea: implications for downward transport of biogenic materials. Biogeosciences Discussions, 1–40. doi: 10.5194/bg-2019-59
|
| [9] |
Duarte C M, Kennedy H, Marbà N, et al. 2013. Assessing the capacity of seagrass meadows for carbon burial: current limitations and future strategies. Ocean & Coastal Management, 83: 32–38. doi: 10.1016/j.ocecoaman.2011.09.001
|
| [10] |
Fernandes L, Bhosle N B, Matondkar S G P, et al. 2009. Seasonal and spatial distribution of particulate organic matter in the Bay of Bengal. Journal of Marine Systems, 77(1–2): 137–147. doi: 10.1016/j.jmarsys.2008.12.002
|
| [11] |
Fettweis M, Baeye M. 2015. Seasonal variation in concentration, size, and settling velocity of muddy marine flocs in the benthic boundary layer. Journal of Geophysical Research: Oceans, 120(8): 5648–5667. doi: 10.1002/2014JC010644
|
| [12] |
Gasparini S, Castel J, Irigoien X. 1999. Impact of suspended particulate matter on egg production of the estuarine copepod, Eurytemora affinis. Journal of Marine Systems, 22(2–3): 195–205. doi: 10.1016/S0924-7963(99)00041-X
|
| [13] |
Gilhooly III W P, Macko S A, Flemings P B. 2008. Data report: isotope compositions of sedimentary organic carbon and total nitrogen from Brazos-Trinity Basin IV (Sites U1319 and U1320) and Ursa Basin (Sites U1322 and U1324), deepwater Gulf of Mexico. In: Flemings P B, Behrmann J H, John C M, et al, eds. Proceedings of the International Ocean Discovery Program. College Station, TX, USA: Integrated Ocean Drilling Program Management International, Inc., doi: 10.2204/iodp.proc.308.208.2008
|
| [14] |
Harrison P G. 1989. Detrital processing in seagrass systems: a review of factors affecting decay rates, remineralization and detritivory. Aquatic Botany, 35(3–4): 263–288. doi: 10.1016/0304-3770(89)90002-8
|
| [15] |
Hedges J I, Baldock J A, Gélinas Y, et al. 2001. Evidence for non-selective preservation of organic matter in sinking marine particles. Nature, 409(6822): 801–804. doi: 10.1038/35057247
|
| [16] |
Holmer M, Olsen A B. 2002. Role of decomposition of mangrove and seagrass detritus in sediment carbon and nitrogen cycling in a tropical mangrove forest. Marine Ecology Progress Series, 230: 87–101
|
| [17] |
Kaiser D, Unger D, Qiu Guanglong. 2014. Particulate organic matter dynamics in coastal systems of the northern Beibu Gulf. Continental Shelf Research, 82: 99–118. doi: 10.1016/j.csr.2014.04.006
|
| [18] |
Karl D M, Knauer G A, Martin J H. 1988. Downward flux of particulate organic matter in the ocean: a particle decomposition paradox. Nature, 332(6163): 438–441. doi: 10.1038/332438a0
|
| [19] |
Kennedy H, Beggins J, Duarte C M, et al. 2010. Seagrass sediments as a global carbon sink: isotopic constraints. Global Biogeochemical Cycles, 24(4): GB4026. doi: 10.1029/2010GB003848
|
| [20] |
Kennedy H, Gacia E, Kennedy D P, et al. 2004. Organic carbon sources to SE Asian coastal sediments. Estuarine, Coastal and Shelf Science, 60(1): 59–68. doi: 10.1016/j.ecss.2003.11.019
|
| [21] |
Lamb A L, Wilson G P, Leng M J. 2006. A review of coastal palaeoclimate and relative sea-level reconstructions using δ13C and C/N ratios in organic material. Earth-Science Reviews, 75(1–4): 29–57. doi: 10.1016/j.earscirev.2005.10.003
|
| [22] |
Lavery P S, McMahon K, Weyers J, et al. 2013. Release of dissolved organic carbon from seagrass wrack and its implications for trophic connectivity. Marine Ecology Progress Series, 494: 121–133. doi: 10.3354/meps10554
|
| [23] |
Liu K K, Kao S J, Hu H C, et al. 2007a. Carbon isotopic composition of suspended and sinking particulate organic matter in the northern South China Sea—from production to deposition. Deep-Sea Research Part II: Topical Studies in Oceanography, 54(14–15): 1504–1527. doi: 10.1016/j.dsr2.2007.05.010
|
| [24] |
Liu K K, Kao S J, Wen L S, et al. 2007b. Carbon and nitrogen isotopic compositions of particulate organic matter and biogeochemical processes in the eutrophic Danshuei Estuary in northern Taiwan. Science of the Total Environment, 382(1): 103–120. doi: 10.1016/j.scitotenv.2007.04.019
|
| [25] |
Martiny A C, Vrugt J A, Lomas M W. 2014. Concentrations and ratios of particulate organic carbon, nitrogen, and phosphorus in the global ocean. Scientific Data, 1: 140048. doi: 10.1038/sdata.2014.48
|
| [26] |
McTigue N D, Dunton K H. 2014. Trophodynamics and organic matter assimilation pathways in the northeast Chukchi Sea, Alaska. Deep-Sea Research Part II: Topical Studies in Oceanography, 102: 84–96. doi: 10.1016/j.dsr2.2013.07.016
|
| [27] |
Middelburg J J, Herman P M J. 2007. Organic matter processing in tidal estuaries. Marine Chemistry, 106(1–2): 127–147. doi: 10.1016/j.marchem.2006.02.007
|
| [28] |
Mills M M, Lipschultz F, Sebens K P. 2004. Particulate matter ingestion and associated nitrogen uptake by four species of scleractinian corals. Coral Reefs, 23(3): 311–323. doi: 10.1007/s00338-004-0380-3
|
| [29] |
Narulita I, Rahayu R, Kusratmoko E, et al. 2019. Ancaman kekeringan meteorologis di pulau Kecil tropis akibat pengaruh El-Nino Dan Indian Ocean dipole (IOD) positif, studi kasus: Pulau Bintan. Jurnal Lingkungan dan Bencana Geologi, 10(3): 127–138. doi: 10.34126/JLBG.V10I3.252
|
| [30] |
Post D M. 2002. Using stable isotopes to estimate trophic position: models, methods, and assumptions. Ecology, 83(3): 703–718. doi: 10.1890/0012-9658(2002)083[0703:USITET]2.0.CO;2
|
| [31] |
Prasad M B K, Ramanathan A L. 2009. Organic matter characterization in a tropical estuarine-mangrove ecosystem of India: preliminary assessment by using stable isotopes and lignin phenols. Estuarine, Coastal and Shelf Science, 84(4): 617–624. doi: 10.1016/j.ecss.2009.07.029
|
| [32] |
Saavedra-Hortua D A, Friess D A, Zimmer M, et al. 2020. Sources of particulate organic matter across mangrove forests and adjacent ecosystems in different geomorphic settings. Wetlands, 40(5): 1047–1059. doi: 10.1007/s13157-019-01261-9
|
| [33] |
Sachoemar S I, Yanagi T. 2001. Seasonal variation of the oceanic condition along the southern coastal area of Java to Sumbawa, Indonesia. La mer, 39(3): 141–154
|
| [34] |
Schlacher T A, Connolly R M. 2014. Effects of acid treatment on carbon and nitrogen stable isotope ratios in ecological samples: a review and synthesis. Methods in Ecology and Evolution, 5(6): 541–550. doi: 10.1111/2041-210X.12183
|
| [35] |
Seiki T, Date E, Izawa H. 1991. Decomposition characteristics of particulate organic matter in Hiroshima Bay. Journal of the Oceanographical Society of Japan, 47(5): 207–220. doi: 10.1007/BF02310036
|
| [36] |
Simon M, Grossart H P, Schweitzer B, Ploug H. 2002. Microbial ecology of organic aggregates in aquatic ecosystems. Aquatic Microbial Ecology, 28(2): 175–211. doi: 10.3354/ame028175
|
| [37] |
Sjafrie N D M, Hernawan U E, Rahmawati S, et al. 2018. Status of the seagrass meadows in Indonesia 2018. Jakarta, Indonesia: Indonesian Institute of Sciences, https://marxiv.org/juk4h/[2020-1-20]
|
| [38] |
Sobczak W V, Cloern J E, Jassby A D, et al. 2002. Bioavailability of organic matter in a highly disturbed Estuary: the role of detrital and algal resources. Proceedings of the National Academy of Sciences of the United States of America, 99(12): 8101–8105. doi: 10.1073/pnas.122614399
|
| [39] |
Stock B, Semmens B. 2016. MixSIAR GUI user manual. Version 3.1, doi: 10.5281/zenodo.47719
|
| [40] |
Touchette B W, Burkholder J M. 2000. Overview of the physiological ecology of carbon metabolism in seagrasses. Journal of Experimental Marine Biology and Ecology, 250(1–2): 169–205. doi: 10.1016/S0022-0981(00)00196-9
|
| [41] |
Volkman J K, Revill A T, Holdsworth D G, et al. 2008. Organic matter sources in an enclosed coastal inlet assessed using lipid biomarkers and stable isotopes. Organic Geochemistry, 39(6): 689–710. doi: 10.1016/j.orggeochem.2008.02.014
|
| [42] |
Wahyudi A J, Afdal A. 2019. The origin of the suspended particulate matter in the seagrass meadow of tropical waters, an evidence of the stable isotope signatures. Acta Oceanologica Sinica, 38(1): 136–143. doi: 10.1007/s13131-019-1380-z
|
| [43] |
Wahyudi A J, Meirinawati H, Prayitno H B, et al. 2019. The material origin of the particulate organic matter (POM) in the Eastern Indonesian waters. AIP Conference Proceedings, 2175(1): 020047. doi: 10.1063/1.5134611
|
| [44] |
Wahyudi A J, Rahmawati S, Irawan A, et al. 2020. Assessing carbon stock and sequestration of the tropical seagrass meadows in Indonesia. Ocean Science Journal, 55(1): 85–97. doi: 10.1007/s12601-020-0003-0
|
| [45] |
Wahyudi A J, Rahmawati S, Prayudha B, et al. 2016. Vertical carbon flux of marine snow in Enhalus acoroides-dominated seagrass meadows. Regional Studies in Marine Science, 5: 27–34. doi: 10.1016/j.rsma.2016.01.003
|
| [46] |
Wahyudi A J, Wada S, Aoki M, et al. 2013. Stable isotope signature and pigment biomarker evidence of the diet sources of Gaetice depressus (Crustacea: Eubrachyura: Varunidae) in a boulder shore ecosystem. Plankton and Benthos Research, 8(2): 55–67. doi: 10.3800/pbr.8.55
|
| [47] |
Zhang J, Wu Yadian, Jennerjahn T C, et al. 2007. Distribution of organic matter in the Changjiang (Yangtze River) Estuary and their stable carbon and nitrogen isotopic ratios: implications for source discrimination and sedimentary dynamics. Marine Chemistry, 106(1–2): 111–126. doi: 10.1016/j.marchem.2007.02.003
|
| 1. | Muhammad Halim, Milica Stankovic, Anchana Prathep. A preliminary study of carbon dioxide and methane emissions from patchy tropical seagrass meadows in Thailand. PeerJ, 2024, 12: e18087. doi:10.7717/peerj.18087 | |
| 2. | A J Wahyudi. Potential of Organic Carbon Pool in the Ocean: Approaches for Naturally and Artificially Capturing and Retaining Carbon. IOP Conference Series: Earth and Environmental Science, 2024, 1350(1): 012021. doi:10.1088/1755-1315/1350/1/012021 | |
| 3. | A’an Johan Wahyudi, Suratno, Rachma Puspitasari, et al. Enrichment potential of carbon and metals through biogeochemical pools of particulate matter and organisms of the coastal and continental margin. Regional Studies in Marine Science, 2023, 67: 103215. doi:10.1016/j.rsma.2023.103215 |

Figures(5) / Tables(1)

Supported by:
Beijing Renhe Information Technology Co. Ltd

A’an Johan Wahyudi, Karlina Triana, Afdal Afdal, Hanif Budi Prayitno, Edwards Taufiqurrahman, Hanny Meirinawati, Rachma Puspitasari, Lestari Lestari, Suci Lastrini. The decomposition rate of the organic carbon content of suspended particulate matter in the tropical seagrass meadows[J]. Acta Oceanologica Sinica, 2021, 40(8): 44-52. doi: 10.1007/s13131-021-1802-6

| Location | δ15N /‰ | δ13C /‰ | C:N ratio | Ntot flux /(µg·h−1)* | Corg flux /(µg·h−1)* | Ntot flux /(mg·m−2·h−1) (according to nitrogen) | Corg flux /(mg·m−2·h−1) (according to carbon) |
| Sikka | 4.10±1.56 | −16.76±3.36 | 15.47±3.53 | 2.96±0.72 | 38.48±10.10 | 4.80±1.17 | 62.52±16.41 |
| Sorong | 4.01±1.36 | −7.22±3.36 | 22.50±6.89 | 5.89±3.41 | 79.67±33.10 | 9.56±5.54 | 129.45±53.79 |
| Note: * Hourly flux of Corg and Ntot trapped in the SPM trap (mouth area: 6.154 4 cm2). | |||||||
DownLoad:
CSV
 DownLoad: