Fahui Gong, Qixing Ji, Guihao Li, Kedong Yin, Jun Gong. Diversity and distribution of bacterioplankton in the coastal upwelling waters off Hainan Island, China[J]. Acta Oceanologica Sinica, 2022, 41(3): 76-85. doi: 10.1007/s13131-021-1807-1
Citation:
Fahui Gong, Qixing Ji, Guihao Li, Kedong Yin, Jun Gong. Diversity and distribution of bacterioplankton in the coastal upwelling waters off Hainan Island, China[J]. Acta Oceanologica Sinica, 2022, 41(3): 76-85. doi: 10.1007/s13131-021-1807-1
Fahui Gong, Qixing Ji, Guihao Li, Kedong Yin, Jun Gong. Diversity and distribution of bacterioplankton in the coastal upwelling waters off Hainan Island, China[J]. Acta Oceanologica Sinica, 2022, 41(3): 76-85. doi: 10.1007/s13131-021-1807-1
Citation:
Fahui Gong, Qixing Ji, Guihao Li, Kedong Yin, Jun Gong. Diversity and distribution of bacterioplankton in the coastal upwelling waters off Hainan Island, China[J]. Acta Oceanologica Sinica, 2022, 41(3): 76-85. doi: 10.1007/s13131-021-1807-1
School of Marine Sciences, Sun Yat-Sen University, Zhuhai 519082, China
2.
Key Laboratory of Marine Resources and Coastal Engineering in Guangdong Province, Guangzhou 510006, China
3.
Southern Marine Science and Engineering Guangdong Laboratory (Zhuhai), Zhuhai 519080, China
Funds:
The Fundamental Research Funds for the Central Universities under contract No. 18lgzd07; the Key Research Program of Frontier Science, CAS under contract No. QYZDB-SSW-DQC013-1; the National Natural Science Foundation of China under contract No. 41976128.
The diversity, community composition and 16S rRNA gene abundance of bacterioplankton along a transect across an upwelling area off the eastern coast of Hainan Island (the Qiongdong upwelling) were investigated in August of 2016 using high throughput sequencing and quantitative PCR assay of 16S rRNA genes. Compared with the offshore stations, the inner-shelf stations had higher bacterial gene abundance (up to 3 fold) and operational taxonomic unit richness, a result of the influence of upwelled and fresher waters. Overall, a majority of the reads were affiliated with Gammaproteobacteria (11%–74%) and Alphaproteobacteria (14%–43%). The structure of the bacterial community was significantly affected by salinity, dissolved oxygen, ${\rm{NO}}_3^-$ and ${\rm{NH}}_4^+ $, which also defined the physicochemical features of the upwelled waters. Horizontally, the relative abundances and gene abundances of Rhodobacteraceae, SAR86, Cyanobacteria and Bacteroidetes in eutrophic zone decreased from the inner to outer shelves and slope, whereas Alteromonas, Vibrio and Oceanospirillaceae exhibited an opposite trend. This study stresses the riverine influence on the oceanographic condition and spatial variability of bacterioplankton diversity and distribution in the Qiongdong upwelling.
Coastal upwelling is regulated by Ekman dynamics, where equatorward winds transport surface water offshore bringing cold and nutrient-rich water masses from deep layers to the surface, resulting in high primary productivity and biomass accumulation (Gregoracci et al., 2015; Sommer et al., 2002). Ongoing global warming may enhance the temperature gradients from land to sea, strengthening the winds that cause upwelling and changing the spatial heterogeneity of coastal upwelling. As a result, upwelling intensity and duration may increase (Bakun, 1990). This hypothesis suggests that the spatiotemporal distribution of planktonic bacteria may be changed. Because cyanobacteria are major contributors to phytoplankton biomass and production in the open ocean, the biogeochemical cycling of major elements in the global ocean ecosystem will likely be affected (Azam et al., 1994; Brown et al., 1999; Fuhrman et al., 2015; Poulton et al., 2006).
The abundance, biomass and community composition of bacterioplankton show high variability in the coastal upwelling zones of different geographic locations. For example, analysis of 16S rRNA gene clone libraries indicated that the surface of the upwelling system off the coast of Spain was dominated by Roseobacteria (nearly 30%–70% of total bacterial abundance), Bacteroidetes (5%–30%) and some Gammaproteobacteria groups such as SAR86 (Alonso-Gutiérrez et al., 2009). In the Benguela upwelling system, Bacteroidetes and Gammaproteobacteria dominated, whereas SAR11 was nearly absent during the upwelling season (Bergen et al., 2015). In the Costa Rica upwelling dome, Synechococcus accounted for an average of 25% (ranging from 9% to 50%) of total phytoplankton production measured by flow cytometry, microscopy and pigments analyses (Stukel et al., 2013). It has also been determined that upwelling affects the deep chlorophyll maximum (DCM) layer and its microbial community composition (Gao et al., 2018). Most of these studies focused on a limited number of stations or the relative abundance of bacterioplankton. The study of taxonomic composition and collection of quantitative information of spatial variability for entire bacterioplankton communities in coastal upwelling areas is still in its early stages.
The seasonal upwelling system along the eastern Hainan shelf has a strong influence on shelf microbial communities (Jing et al., 2009). In this coastal system, major upwelling events occur from May to September, while downwelling conditions predominate in winter (Su et al., 2011). The shallow stations at the eastern Hainan shelf are also affected by the westward Guangdong coastal current consisting of a large volume of freshwater from the Zhujiang River Estuary, which lowers the sea surface salinity of the study area (Chen et al., 2019). Further offshore, the oligotrophic central South China Sea is connected to the Pacific Ocean by the Luzon Strait between Taiwan Island and the Philippines (Yin et al., 2001). To assess the influence of upwelling and less-saline water masses on the abundance and community composition of both bacterial and eukaryotic microbes in the water column, in August 2016, we sampled along a transect from highly eutrophic waters influenced by coastal upwelling to oligotrophic waters off the coast of Hainan Island. A recent study (Gong et al. 2020) characterized phytoplankton size structure and spatial variations in diversity and community composition of pico-nanoeukaryotes. Our study attempts to understand the driving forces and mechanisms that shape the spatial patterns of bacteria in the coastal upwelling system by addressing three main questions: (1) what were the dominant bacterial groups in the upwelling waters; (2) how did the species richness, community composition and structure of the bacterioplankton in euphotic zone change horizontally from the upwelling-influenced inshore stations to the offshore oligotrophic waters; and (3) how were the gene abundances of whole bacterioplankton and major lineages distributed along the transect?
2.
Materials and methods
2.1
Sample collection and water column hydrography
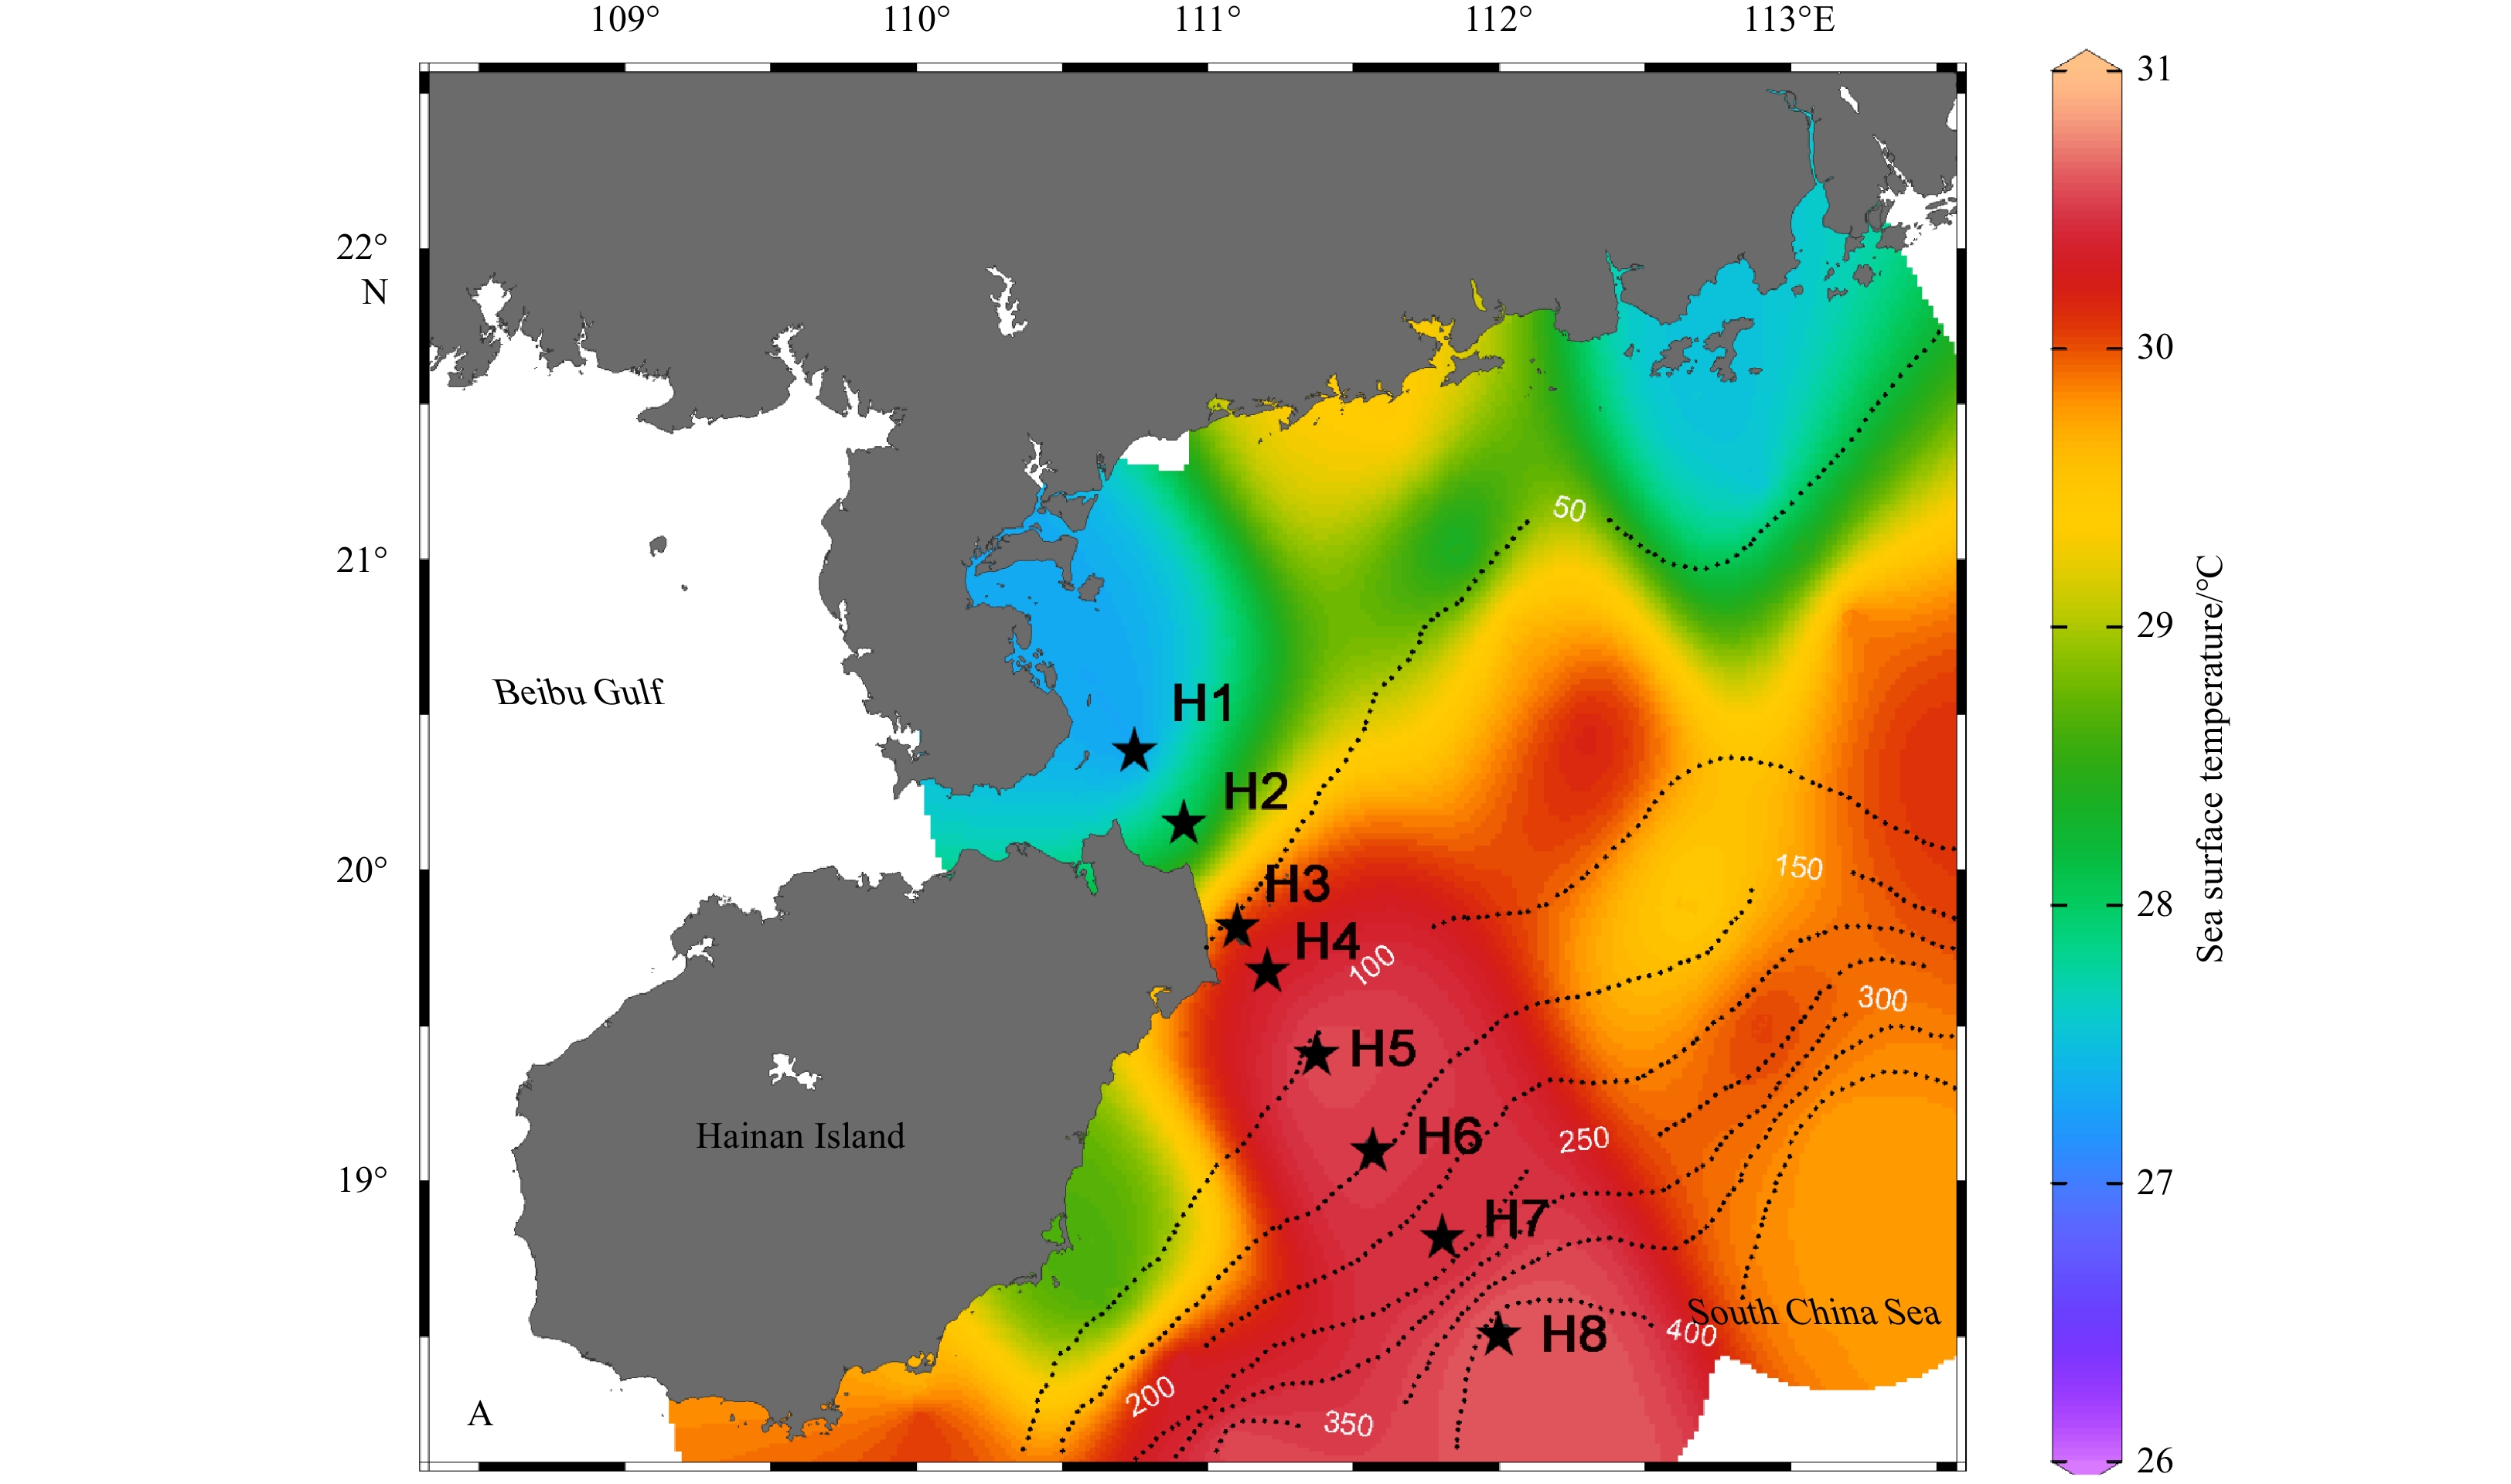
The study area is the Qiongdong upwelling zone, which is located in the northwest part of the South China Sea off the east coast of Hainan Island, China. A total of eight stations (Stations H1 to H8) along a cross-shelf transect (Transect H) were sampled on August 9 and 10, 2016 (Fig. 1). The water depths at the stations ranged from 13 m to 456 m, spanning the inner shelf [Stations H1 (at depths of 1 m and 8 m), H2 (2 m, 8 m, 14 m and 22 m) and H3 (2 m, 8 m, 14 m and 20 m)], middle shelf [Stations H4 (2 m, 10 m, 30 m, and 50 m) and H5 (2 m, 30 m, 60 m, and 80 m)], outer shelf [Station H6 (2 m, 30 m, 70 m, and 100 m)] and the continental slope [Stations H7 (2 m, 30 m, 70 m, and 150 m) and H8 (2 m, 30 m, 70 m, and 200 m)]. Water samples were collected using Niskin bottles mounted on a rosette that was equipped with a conductivity-temperature-depth (CTD) package (SBE911, Seabird Electronics, USA). Water column hydrography was characterized using nine variables [temperature, salinity, chlorophyll a (Chl a), dissolved oxygen (DO), nitrate, nitrite, ammonium, phosphate and silicate] previously described by Gong et al. (2020). Temperature, salinity, turbidity, Chl a and DO were measured by sensors equipped with the CTD package. Concentrations of dissolved inorganic nitrogen (DIN), including ammonium (${\rm{NH}}_4^+ $), nitrite (${\rm{NO}}_2^- $), and nitrate (${\rm{NO}}_3^- $), dissolved active phosphate (${\rm{PO}}_4^{3-} $) and silicate (${\rm{SiO}}_4^{2-} $), were measured with a nutrient auto-analyzer (Technicon AA3, Bran-Lubbe, Germany), following standard spectrophotometric methods (Hansen and Koroleff, 1999). The sampling depths are given in Table S1.
Figure
1.
Sampling stations (H1–H8) along Transect H, east coast of Hainan Island, northern South China Sea. The sea surface temperature at H1 and H2 was approximately 27°C, about 3°C to 3.5°C lower than offshore. Stations H1–H3 on the inner shelf were primarily influenced by upwelling and the fresher water mass from the Guangdong coastal current. The water column was distinctly stratified, with a well-defined DCM layer extending from the middle shelf (Stations H4 and H5) to the outer shelf (Station H6) and slope (Stations H7 and H8). The dotted lines indicate the isobaths. The color scale refers to sea surface temperature.
Two-liter seawater samples for molecular analysis were collected from each station along Transect H and were immediately filtered through 0.22 µm pore size polycarbonate filters (Millipore, USA). The filters were then immediately placed into sterile cryovials and stored in liquid nitrogen onboard until subsequent DNA extraction. Total environmental DNA from the filters was extracted and purified using the FastDNA Spin Kit (MP Biomedical, USA) according to the manufacturer’s instructions.
The samples were analyzed for prokaryotic molecular analyses using the V4 regions of the 16S rRNA gene, which were amplified using the universal bacterial primers 515f and 806r (Walters et al., 2016). The PCR products from triplicate reactions of each sample were pooled together and sequenced on the MiSeq System (Illumina, USA) provided commercially (Novogene, China). Raw sequences were processed using quality control, denoising and discarding. Chimera and singletons were picked using QIIME version 1.9.1 (Kuczynski et al., 2011) and Mothur version 1.34.4 (Schloss et al., 2009). The clean sequences were clustered, aligned and classified against the SILVA database. Operational taxonomic units (OTUs) were clustered at a sequence similarity of 97%. The abundances of the resulting OTUs were normalized using the relative proportions of individual OTU reads from all sample reads. The nucleotide sequences have been deposited in the GenBank database under the accession number PRJNA639019.
Quantitative amplification of the 16S rRNA gene was performed using universal primer sets 341F-517R (Singleton et al., 2005) in three replicates of 20 μL reaction mixtures containing SYBR green master mix (Fermentas, USA). The reaction mixture contained 0.4 μL RoxDyeII, 0.4 μL of each primer, 10 μL of SYBR green and 1 μL diluted gDNA extract, and was diluted with double-distilled water to a final volume of 20 μL. The thermo program was performed with an initial denaturation step at 95°C for 7 min, followed by 40 cycles of denaturation at 95°C for 30 s, annealing at 57°C for 30 s and extension at 72°C for 30 s. We calibrated the standard curves for the target gene and the internal control using plasmid containing the 16S rRNA gene from Escherichia coli and the internal control plasmid. To calculate the 16S rRNA copy numbers for all major bacterial taxa, the relative abundances of each taxon analyzed by NGS pipeline were multiplied by the total 16S rRNA gene copy number of each sample obtained by quantitative PCR.
2.3
Statistical analysis
We rarefied all sequences at the number of 50 000 to assess α diversity estimators (OTU richness, Simpson, Shannon and Chao1 indices). We conducted redundancy analysis (RDA) using CANOCO version 4 (ter Braak and Smilauer, 2002) to explore correlations between the community structure of bacteria and the measured environmental factors. Non-metric multidimensional scaling (NMDS) was performed based on Bray–Curtis similarities to examine the variations in community composition. An analysis of similarity (ANOSIM) was conducted with 1 000 permutations using PRIMER version 5.0 (Primer-E, UK). A spearman’s rank correlation was performed to quantify the associations between $\alpha $ diversity estimators, 16S rRNA copy number of a specific taxon and environmental factors. Graphic interpolations were produced by the DIVA gridding algorithm with the software Ocean Data View version 4.7.6 (Brown, 1998).
3.
Results
3.1
Spatial variability in upper ocean biogeochemistry
The physicochemical and biological characteristics of the study area have been described in detail in Gong et al. (2020). The vertical profiles of the physical and chemical variables across Stations H1–H8 exhibited characteristics typical of summertime upwelling off the east coast of Hainan Island. This was particularly true at the inner-shelf Stations H1, H2 and H3, where the sea surface temperature was around 27°C, 3°C to 3.5°C lower than offshore (Fig. 1). In general, nutrient-replete conditions persisted at the surface waters (upper 20 m) of the inner-shelf during the sampling period with DIN concentrations ranging from 0.60 μmol/L to 11.65 μmol/L, ${\rm{PO}}_4^{3-} $ concentrations ranging from 0.14 μmol/L to 0.58 μmol/L, and ${\rm{SiO}}_4^{2-} $ concentrations ranging from 11.4 μmol/L to 22.8 μmol/L. Oligotrophic conditions were observed further offshore (Stations H4 to H8). The concentrations of DIN and ${\rm{PO}}_4^{3-} $ in the upper 20 m were <2.47 μmol/L and <0.12 μmol/L. The inner-shelf waters had higher turbidity (1.7–2.2 Nephelometric Turbidity Unit) than the offshore upper-layer waters.
3.2
Alpha diversity and community composition
A total of 34 bacterial phyla were detected from 2 584 861 high-quality sequences of 16S rRNA genes. The OTU richness of total bacterioplankton showed a large amount of variation spatially (977–2405), with high levels observed in the inner-shelf waters and at subsurface layers offshore (Fig. 2a). Statistically, the bacterial OTU richness was significantly higher in the inner-shelf waters (1566±115) than in the offshore (1314±46; p=0.023; Fig. 2b). Other $\alpha $ diversity estimators exhibited similar spatial patterns (Table S1).
Figure
2.
Spatial variations in bacterial OTU richness (a) and 16S rRNA gene abundance (c) along Transect H between the inner shelf (open box) and offshore stations (grey box) (b); the relative abundance of major bacterial taxa in the bacterioplankton community from Stations H1 to H8 (d). The sampling depths were annotated in the sample ID.
A majority of reads were affiliated with Gammaproteobacteria (relative abundance: 11%–74%) and Alphaproteobacteria (14%–43%) (Fig. 2d). The relative abundance of Cyanobacteria varied greatly, ranging from 0.5% to 53%. Actinobacteria (2.5%–16%), Bacteroidetes (1.7%–13%) and Deferribacteres (1.6%–5.5%) were less abundant. Betaproteobacteria (0.1%–4%), Deltaproteobacteria (1.1%–3.8%), Epsilonproteobacteria (0–0.7%), Chloroflexi (0.1%–0.6%) and others were relatively minor components of the communities (Fig. 2d).
The NMDS plot showed that the community composition of bacterioplankton in the upwelling-influenced inner-shelf stations (H1, H2 and H3) was very different from the composition at other stations (Fig. 3a). This conclusion was statistically supported by ANOSIM (r = 0.53, p<0.01; Table 1). Specifically, the community composition in inner-shelf waters was statistically distinct from the composition in the middle shelf (r=0.18; p=0.05) and the outer shelf and slope (r=0.19; p=0.03). When only the surface waters were considered, the decrease in bacterial community similarity from the inner shelf to middle shelf to outer shelf and slope was even more significant (r=0.72, p<0.01; Table 1). The RDA analysis showed that only 12.65% of the variance in community composition was explained by the environmental factors measured in this study, among which the most significant were salinity, DO, ${\rm{NO}}_3^- $ and ${\rm{NH}}_4^+ $ (Fig. 3b).
Table
1.
ANOSIM statistical testing the spatial differences in community structure of bacteria across the Qiongdong upwelling
Spatial comparison
R
p
Upwelling (inner shelf) vs. non-upwelling zone (from middle shelf to slope)
0.53
0.00
Shelf zonation of all-depth samples (global test)
0.24
0.01
Inner shelf vs. Middle shelf
0.18
0.05
Middle shelf vs. Outer shelf + Slope
−0.04
0.63
Inner shelf vs. Outer shelf + Slope
0.19
0.03
Shelf zonation of the surface water (global test)
0.16
0.04
Inner shelf vs. Middle shelf
0.49
0.00
Middle shelf vs. Outer shelf + Slope
0.02
0.16
Inner shelf vs. Outer shelf + Slope
0.72
0.00
Vertical comparison at non-upwelling stations (global test)
0.23
0.00
Surface vs. DCM layer
0.46
0.00
Note: Significant p-values (< 0.05) are highlighted in bold.
Figure
3.
The NMDS plot (a) showing that the community structure of bacterial community differentiated on a cross-shelf scale and the redundancy analysis (RDA) showing that DO, nitrate, salinity and ammonium were the most significant environmental variables influencing the spatial organization of the bacterial community along the transect (b).
To explore how the bacterial community structure changed horizontally in the eutrophic zone (which included all depth layers at H1–H3 and from the surface to the DCM layers at H4–H8), we compared the relative abundances of major bacterial groups in the inner shelf, middle shelf and outer shelf+slope regions (Fig. 4; Table 2). The largest regional differences were seen with Gammaproteobacteria, which made up a significantly higher proportion of the community in the outer-shelf and slope regions (40%±3%) than in the inner-shelf (26%±2%). The relative abundances of gammaproteobacterial Alteromonas, Oceanospirillaceae and Vibrio in the outer shelf and slope were double or nearly triple the abundances in the inner shelf (Fig. 4). One exception was SAR86, which was significantly higher in relative abundance in the inner-shelf waters (8%±0.7%) than in other regions (lower than 6.3%±0.8%; Table 2).
Figure
4.
Vertical profiles of the 16S rRNA gene abundance of major bacterial groups along Transect H off eastern Hainan Island. Note that Stations H1 to H3 were strongly influenced by upwelled water as well as the fresher water from the Guangdong coastal current.
Table
2.
Shifts in relative proportion of gene abundance of 16S rRNA reads (×104 copies/mL) (mean±SE) of major bacterial lineages within the euphotic waters of inner, middle, outer shelves and slope
Taxon
Relative proportion/%
16S rRNA gene abundance
Inner (n=10)
Middle (n=8)
Outer+slope (n=9)
Inner (n=10)
Middle (n=8)
Outer+slope (n=9)
Total bacteria
−
−
−
49.45±5.00a
31.85±3.78b
43.01±2.77ab
Alphaproteobacteria
28.58±1.77
29.33±3.08
29.30±1.69
12.47±1.64
11.236±3.20
13.33±1.62
Rhodobacteraceae
8.01±0.57
6.57±0.61
6.70±0.63
3.65±0.56
2.68±0.84
3.09±0.49
Rhodospirillaceae
4.04±0.37
3.40±0.49
3.44±0.36
1.77±0.26
1.44±0.47
1.52±0.21
SAR116
4.08±0.73
3.63±1.05
2.61±0.48
1.78±0.44
1.86±0.97
1.28±0.29
SAR11
7.93±0.76
8.85±1.10
9.41±1.05
4.15±0.56
3.83±0.79
4.96±0.75
Betaproteobacteria
0.10±0.36
0.68±0.23
0.56±0.17
0.41±0.14
0.25±0.09
0.29±0.10
Thiobacillus
0.06±0.08a
0.1±0.02b
0.08±0.03b
0.14±0.05a
0.05±0.02b
0.03±0.02b
Deltaproteobacteria
3.47±0.74a
1.65±0.14b
2.25±0.20ab
1.70±0.52a
0.60±0.14b
0.98±0.11ab
Bdellovibrionales
1.91±0.78a
0.47±0.06b
1.00±0.12ab
0.94±0.49
0.18±0.04
0.44±0.04
SAR324
0.47±0.12a
0.45±0.08a
0.15±0.03b
0.25±0.08a
0.18±0.06ab
0.06±0.01b
Gammaproteobacteria
26.21±2.07b
34.34±6.84ab
40.29±3.05a
11.31±1.63
12.23±3.06
16.75±1.76
Alteromonas
4.51±1.07b
4.82±1.56b
16.10±2.66a
1.83±0.47b
1.84±0.62b
7.39±1.42a
SAR86
8.45±0.73a
5.74±0.75b
6.29±0.79ab
3.60±0.45
2.42±0.78
2.91±0.43
Oceanospirillaceae
3.12±0.53ab
1.58±0.25b
5.21±0.85a
1.49±0.38ab
0.57±0.11b
2.22±0.44a
Vibrio
0.70±0.07b
0.53±0.12b
1.56±0.31a
0.32±0.06ab
0.20±0.05b
0.63±0.12a
Actinobacteria
9.87±1.05
7.51±1.46
8.48±1.08
4.39±0.69
2.763±0.84
3.98±0.61
Actinomarina
8.36±0.87a
4.62±0.56b
6.10±1.15ab
3.79±0.61
2.054±0.80
2.92±0.59
Bacteroidetes
6.01±1.01
3.93±0.58
4.29±0.49
2.57±0.45a
1.41±0.36b
1.99±0.25ab
Cyanobacteria
13.45±3.41b
27.49±7.44a
5.67±1.18b
7.14±2.87ab
9.97±3.58a
2.46±0.47b
Prochlorococcus
5.81±1.24b
20.05±6.34a
3.45±0.85b
3.02±1.06b
5.93±1.50a
1.41±0.19b
Synechococcus
8.55±2.28a
7.39±2.58a
2.18±0.57b
4.08±1.84a
4.02±2.67a
1.04±0.32b
Deferribacteres
3.45±0.38
2.74±0.28
3.33±0.27
1.58±0.26
0.93±0.13
1.41±0.17
SAR406
3.41±0.36
2.50±0.27
3.29±0.27
1.53±0.25a
0.88±0.15b
1.39±0.17ab
Verrucomicrobia
1.01±0.21a
0.48±0.06b
0.68±0.17ab
0.49±0.14a
0.16±0.03b
0.31±0.07ab
Chlamydiae
0.02±0.01a
0.01±0.00b
0.01±0.00b
0.01±0.00a
0.00±0.00b
0.00±0.00b
Chloroflexi
0.19±0.06
0.11±0.02
0.13±0.02
0.09±0.02a
0.04±0.00b
0.04±0.01ab
Deinococcus-Thermus
0.32±0.13
0.09±0.04
1.52±1.03
0.12±0.06a
0.03±0.01c
0.82±0.55b
Firmicutes
0.89±0.59a
1.80±1.46a
0.21±0.04b
0.35±0.22a
0.59±0.47a
0.09±0.02b
Gemmatimonadetes
0.07±0.02a
0.02±0.00b
0.05±0.01ab
0.04±0.01a
0.01±0.00b
0.01±0.01ab
Nitrospirae
0.02±0.01a
0.00±0.00b
0.01±0.00ab
0.01±0.00a
0.00±0.00b
0.00±0.00ab
Planctomycetes
1.24±0.31a
0.56±0.11b
0.61±0.11b
0.56±0.18
0.26±0.11
0.27±0.05
Tenericutes
0.14±0.06a
0.06±0.02ab
0.03±0.02b
0.06±0.02a
0.03±0.01ab
0.01±0.00b
Note: Number in boldface are significant, p<0.05; a and b on the same row bearing different superscripts are significantly different (p<0.05); − represents no data.
Unlike Gammaproteobacteria, Cyanobacteria peaked in middle-shelf waters (relative proportion of 27%±7% in middle-shelf waters while <(14%±4%) in other regions; Table 2). This pattern was driven by Prochlorococcus, whose relative abundance was three to six times higher in the middle shelf. Unlike Prochlorococcus, Synechococcus’ distribution in eutrophic waters was characterized by higher abundances in both inner and middle shelves. Many other bacterial taxa had higher relative abundances in the inner-shelf waters including actinobacterial Actinomarina, deltaproteobacterial Bdellovibrionales and SAR324, Planctomycetes, Verrucomicrobia, Chlamydiae, Gemmatimonadetes, Tenericutes and Nitrospirae (Table 2).
The 16S rRNA gene abundances (absolute gene abundances) of the major bacterial taxa from all sampling depths were highly heterogeneous across the transect profile (Fig. 4). The gene abundance of SAR11 was generally higher in surface waters and particularly high throughout the water column at Station H7. It peaked with 9.0×10⁴ copies/mL at 150 m, a depth beneath the DCM layer (Fig. 4a). Similar patterns were observed for the gene abundances of alphaproteobacterial Rhodobacteraceae and gammaproteobacterial SAR86, which were generally abundant (around 4×10⁴ copies/mL) in surface waters at Stations H1–H3 with two hotspots at Stations H4 and H7 (up to 7×10⁴ copies/mL or 8×10⁴ copies/mL; Figs 4b, c). However, the gammaproteobacterial Alteromonas, Oceanospirillaceae and Vibrio were highly abundant in the surface at Station H7 (Figs 4d–f). Prochlorococcus was abundant in inshore surface waters and highly abundant throughout the water column at two middle-shelf stations (H4 and H5). It peaked at a depth of 30 m, reaching 1.0×10⁵ copies/mL (Fig. 4g). In contrast, Synechococcus was abundant in inshore surface layers but always rare below 20 m (Fig. 4h). The gene abundances of Deltaproteobacterial SAR324, Bacteriodetes, Gemmatimonadetes and Chloroflexi generally decreased from inshore to offshore (Figs 4i–l). Moderate abundances of these taxa were also detected in bottom waters of Station H4 (Fig. 4i), in the DCM layer at Station H7 (Fig. 4j) and in the layer beneath DCM (Figs 4k, l).
The regional distributional patterns of taxon-specific absolute gene abundances in the euphotic zone were largely consistent with those of the relative abundances, but there were exceptions (Table 2). For example, the rRNA gene abundances of Gammaproteobacteria, Actinomarina, SAR86, Bdellovibrionales and Planctomycetes were not significantly different among the inner shelf, middle shelf and outer shelf+slope regions (p>0.05), although their regional differences in relative abundance were significant. Conversely, Bacteroidetes, SAR406, Chloroflexi, Deinococcus-Thermus had significantly higher gene abundance in inner-shelf waters, but their relative abundances were not significantly different among the three regions of the transect (Table 2).
3.3
Correlations of bacterial diversity and gene abundance with environmental variables
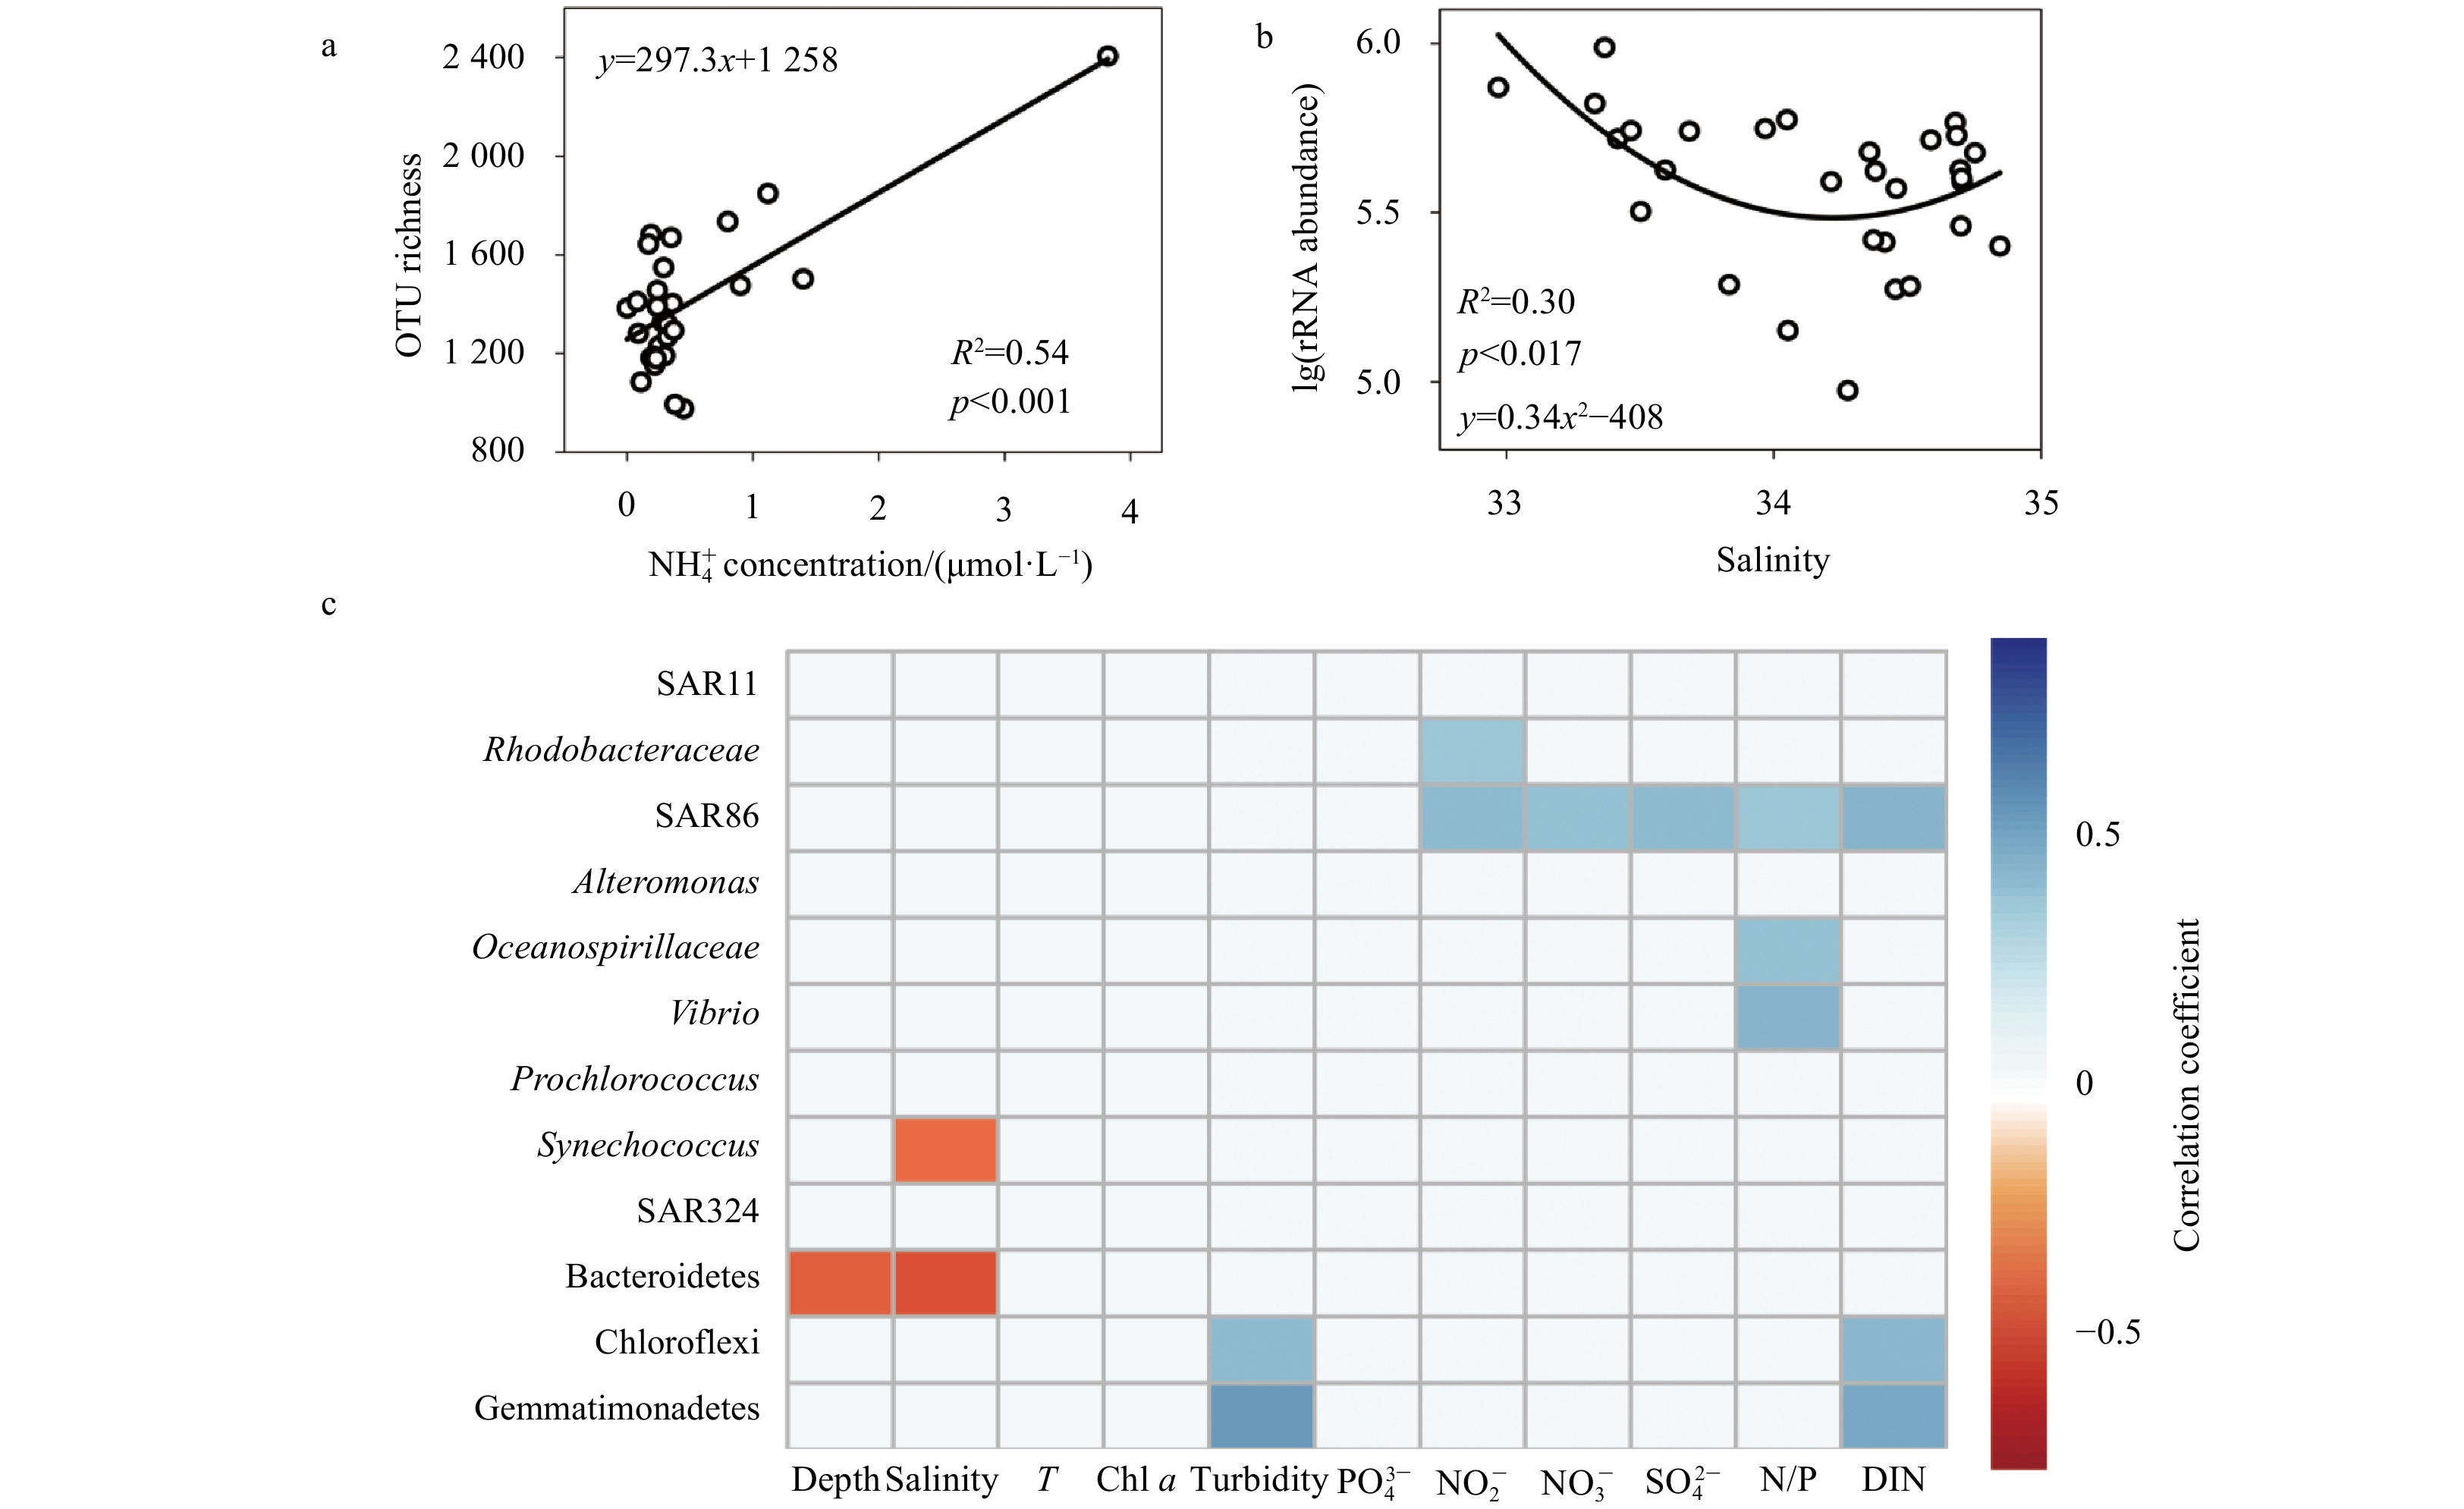
The OTU richness and 16S rRNA gene abundance of bacterioplankton were fit with environmental variables using both linear and non-linear models. There was a linear positive relationship between OTU richness and ${\rm{NH}}_4^+ $ (R2=0.54, p<0.001; Fig. 5a) with a coefficient much higher than that of any other environmental variable (R2<0.15) measured in this study. The 16S rRNA gene abundance of bacterioplankton had a U-shaped relationship with salinity (R2=0.30, p<0.05). The gene abundance decreased and then increased with salinity, reaching a minimum value at the intermediate salinity of approximate 34 (Fig. 5b).
Figure
5.
Semi-log plots showing the most significant regressions between bacterial OTU richness and ${\rm{NH}}_4^+ $ concentration (a) and between rRNA gene abundance and salinity (b). The values of the correlation coefficients between the rRNA gene abundances of major taxa and environmental factors are indicated according to the color bar (c). T represents temperature. Non-significant correlations (p>0.05) were left blank.
Correlations between taxon-specific 16S rRNA gene abundance and environmental variables along Transect H were also tested (Fig. 5c). The gene abundance of Rhodobacteraceae was significantly positively correlated with ${\rm{NO}}_2^- $ (ρ=0.36, p<0.05). DIN was highly correlated with SAR86 (ρ=0.42, p<0.05), Chloroflexi (ρ=0.41, p<0.05) and Gemmatimonadetes (ρ=0.48, p<0.05). The latter two groups were also abundant in more turbid waters. Both Oceanospirillaceae (ρ=0.37, p<0.05) and Vibrio were positively correlated with the N:P concentration ratio (ρ=0.43, p<0.05). The rRNA gene abundances of Synechococcus (ρ=−0.42, p<0.05) and Bacteroidetes (ρ=−0.50, p<0.05) were negatively correlated with salinity. Although Alteromonas, SAR11 and Prochlorococcus were relatively abundant in the bacterioplankton, we found no significant correlations between their gene abundances and any of the measured environmental variables (p>0.05; Fig. 5c).
4.
Discussion
It is well known that upwelling brings cold and nutrient-rich waters from the bottom to the surface, promoting the productivity and biomass of phytoplankton in inshore euphotic zones. The surface Ekman layer exports phytoplankton-derived labile dissolved organic carbon (DOC) to the adjacent ocean (Álvarez-Salgado et al., 2001), which may affect the spatial distribution of microbial organisms. This horizontal distributional pattern of small eukaryotes has been confirmed by our recent study in the Qiongdong upwelling (Gong et al., 2020). In a pattern similar to the small eukaryotes, the diversity and community composition of bacterioplankton also exhibited spatial shifts during the summertime survey of this upwelling system.
As expected, we observed a higher OTU richness in inner-shelf water than in other regions (Fig. 2b), indicating a positive effect on bacterioplankton diversity, particularly for heterotrophic bacteria in the Qiongdong upwelling system. As expected, the inner-shelf water was strongly affected by upwelling, with higher levels of Chl a, ${\rm{NO}}_3^- $, ${\rm{NO}}_2^- $, ${\rm{PO}}_4^{3-} $, ${\rm{SiO}}_4^{2-} $, and DIN than offshore waters (Gong et al., 2020). It is therefore reasonable to conclude that the increased DOC released by a higher amount of phytoplankton contributed to the higher diversity of heterotrophic bacteria, which make the best use of bioavailable DOC. However, our correlation and regression analysis indicated that ${\rm{NH}}_4^+ $, but not Chl a, was the most significant environmental variable in fitting bacterial OTU richness (Fig. 5a). A possible explanation is the remineralization of organic matter in turbid sediment re-suspension or phytoplankton debris. This explanation is partly supported by the records from a 20 m depth layer at Station H3 (Fig. 2a), where bacterial OTU richness, Chl a and ${\rm{NH}}_4^+ $ were high and turbidity, was moderate (Gong et al., 2020). In addition, the spatial distribution of ${\rm{NH}}_4^+ $ was patchy and did not appear to be correlated with other environmental variables we measured, except for a weak association with turbidity (R=−0.17, p<0.05). The vertical migration of zooplankton may contribute to the distribution of ammonium through the downward movement of particulate organic material produced by secretion and defecation (Darnis et al., 2017). This process probably promotes bacterial activity, diversity and distribution in the water column, but this subject needs further investigation.
We found there was a significant U-shaped relationship between the rRNA gene abundance of bacterioplankton and salinity along Transect H (Fig. 5b), indicating an ecological effect of fresh water flowing into the upwelling zone. The higher gene abundance could be attributed mainly to Bacteroidetes and Synechococcus, which had much higher gene abundances in less saline waters (Fig. 5c). The bacteria of the Bacteroidetes cluster constitute the most abundant bacterial group in coastal waters (Cottrell and Kirchman, 2000). They are often observed during phytoplankton blooms (Pinhassi et al., 2004) as well as in upwelling systems (Bergen et al., 2015). This group was thought to play a key role in the degradation of particulate organic matter in the ocean (Kirchman, 2002). Fresh water from the Guangdong coastal current and local summertime precipitation may carry plant-derived particulate organic matter into the upwelling zone off Hainan Island, thus promoting the growth and abundance of Bacteroidetes. Nevertheless, the negative correlation between salinity and the gene abundance of Synechococcus along the Qiongdong upwelling transect was not expected, because many studies have found a high cell abundance of this genus at high salinities (Wang et al., 2011; Xia et al., 2017). The high abundance of Synechococcus in the low-salinity surface waters could coincide with some other variables not measured in this study, such as the concentration of dissolved iron, which is a limiting factor for Cyanobacteria and is found at high levels in less saline estuarine waters (Bundy et al., 2015).
Our taxon-specific calculation of rRNA gene abundance using the HTS-qPCR method demonstrated that the gene abundance of both Synechococcus and Prochlorococcus was higher in inshore surface waters than offshore, which is largely consistent with our cytometric data of cell abundance (Gong et al., 2020) as well as with previous reports on this region (Wu et al., 2014) and other upwelling regions (Barbosa et al., 2001; Bergen et al., 2015; Cuevas et al., 2004).
There were considerable horizontal shifts in the 16S rRNA gene abundance of the heterotrophic bacteria taxonomic groups in the euphotic zone across the inner, middle and outer shelves and slope. The abundance of SAR11 was relatively lower in the inner-shelf waters (Table 2), consistent with the observations from Iberian Peninsula coastal upwelling waters (Alonso-Gutiérrez et al., 2009) and from the English Channel (Mary et al., 2006). This is because SAR11 are better adapted to the oligotrophic conditions characteristic of open waters (Rappé et al., 2002). In contrast, Rhodobacteraceae seemed to be better adapted to nutrient-rich conditions. The 16S rRNA gene of Rhodobacteraceae members was more abundant in the inner shelf. Similar to the findings of this study, Rhodobacteraceae dominated the bacterioplankton community (30%–70%) in the coastal upwelling system of Northwest Spain (Alonso-Gutiérrez et al., 2009). This group is commonly observed in close association with eukaryotic phytoplankton (Alonso-Gutiérrez et al., 2009; Prokic et al., 1998) and can have both mutualistic and antagonistic relationships with their hosts (Amin et al., 2015; Seyedsayamdost et al., 2011). Furthermore, Luo and Moran (2014) indicated that these organisms can use multiple organic substrates and are well adapted to a dynamic environment such as Monterey Bay, California.
The three gammaproteobacterial groups (Alteromonas, Oceanospirillaceae and SAR86) are usually well represented in marine waters, but their spatial distribution is poorly understood. Our data showed that the relative abundance and 16S rRNA copy numbers of Alteromonas and Oceanospirillaceae were higher in the surface layers of the offshore stations (Stations H6 to H8, outer and slope) than of the inner shelf stations. This finding is contrary to previous reports showing that these two taxa were presented in particularly high abundances in upwelling waters (Sun et al., 2020). One probable explanation is that some oligotrophic OTU types were included during molecular analyses of these two taxa (Satomi and Fujii, 2014). The SAR86 had higher 16S rRNA gene copy numbers (up to 5×10⁴ copies/mL) at upwelling-influenced stations as well as at DCM depths at offshore stations (Fig. 4c). This finding is consistent with a previous study in the Benguela upwelling system (Bergen et al., 2015). Although our study found that the SAR86 group had several sub-clades adapted to both eutrophic and oligotrophic conditions (Suzuki et al., 2001; Treusch et al., 2009), our correlation analysis suggests that eutrophic conditions (high availabilities of ${\rm{NO}}_3^- $ and ${\rm{SiO}}_4^{2-} $) favor the growth and survival of SAR86 members (Fig. 5c).
The deltaproteobacterial group (dominated by the SAR324 clade), Chloroflexi and phylum Gemmatimonadetes are found almost exclusively in deep waters (Signori et al., 2014), marine sediments (Durbin and Teske, 2011), shallow mangrove sediments (Gomes et al., 2008) and wastewater (Liu et al., 2001). In terms of read proportion or 16S rRNA gene abundance, these taxa were most abundant in the euphotic zone at the inner shelf stations (Table 2). It is likely that the upwelled deep water transported these taxa to the euphotic zone, suggesting that their relative abundance or 16S rRNA gene abundance could be used as an indicator for the intensity or spatial influence of upwelling.
Acknowledgements
We thank the Sun Yat-Sen University for organizing the cruises and assisting with the sampling.
Alonso-Gutiérrez J, Lekunberri I, Teira E, et al. 2009. Bacterioplankton composition of the coastal upwelling system of “Ría de Vigo”, NW Spain. FEMS Microbiology Ecology, 70(3): 493–505. doi: 10.1111/j.1574-6941.2009.00766.x
[2]
Álvarez-Salgado X A, Gago J, et al. 2001. Net ecosystem production of dissolved organic carbon in a coastal upwelling system: the Ría de Vigo, Iberian margin of the North Atlantic. Limnology and Oceanography, 46(1): 135–146
[3]
Amin S A, Hmelo L R, van Tol H M, et al. 2015. Interaction and signalling between a cosmopolitan phytoplankton and associated bacteria. Nature, 522(7554): 98–101. doi: 10.1038/nature14488
[4]
Azam F, Smith D C, Steward G F, et al. 1994. Bacteria-organic matter coupling and its significance for oceanic carbon cycling. Microbial Ecology, 28(2): 167–179. doi: 10.1007/BF00166806
[5]
Bakun A. 1990. Global climate change and intensification of coastal ocean upwelling. Science, 247(4939): 198–201. doi: 10.1126/science.247.4939.198
[6]
Barbosa A B, Galvão H M, Mendes P A, et al. 2001. Short-term variability of heterotrophic bacterioplankton during upwelling off the NW Iberian margin. Progress in Oceanography, 51(2–4): 339–359
[7]
Bergen B, Herlemann D P R, Jürgens K. 2015. Zonation of bacterioplankton communities along aging upwelled water in the northern Benguela upwelling. Frontiers in Microbiology, 6: 621
[8]
Brown M. 1998. Ocean data view 4.0. Oceanography, 11(2): 19–21. doi: 10.5670/oceanog.1998.04
[9]
Brown S L, Landry M R, Barber R T, et al. 1999. Picophytoplankton dynamics and production in the Arabian Sea during the 1995 Southwest Monsoon. Deep-Sea Research Part II: Topical Studies in Oceanography, 46(8–9): 1745–1768
[10]
Bundy R M, Abdulla H A N, Hatcher P G, et al. 2015. Iron-binding ligands and humic substances in the San Francisco Bay estuary and estuarine-influenced shelf regions of coastal California. Marine Chemistry, 173(13): 183–194
[11]
Chen Bo, Xu Zhixin, Ya Hanzheng, et al. 2019. Impact of the water input from the eastern Qiongzhou Strait to the Beibu Gulf on Guangxi coastal circulation. Acta Oceanologica Sinica, 38(9): 1–11. doi: 10.1007/s13131-019-1472-2
[12]
Cottrell M T, Kirchman D L. 2000. Natural assemblages of marine proteobacteria and members of the Cytophaga-Flavobacter cluster consuming low- and high-molecular-weight dissolved organic matter. Applied & Environmental Microbiology, 66(4): 1692–1697
[13]
Cuevas L A, Daneri G, Jacob B, et al. 2004. Microbial abundance and activity in the seasonal upwelling area off Concepción (~36°S), central Chile: a comparison of upwelling and non-upwelling conditions. Deep-Sea Research Part II: Topical Studies in Oceanography, 51(20–21): 2427–2440
[14]
Darnis G, Hobbs L, Geoffroy M, et al. 2017. From polar night to midnight sun: Diel vertical migration, metabolism and biogeochemical role of zooplankton in a high Arctic fjord (Kongsfjorden, Svalbard). Limnology and Oceanography, 62(4): 1586–1605. doi: 10.1002/lno.10519
[15]
Durbin A M, Teske A. 2011. Microbial diversity and stratification of South Pacific abyssal marine sediments. Environmental Microbiology, 13(12): 3219–3234. doi: 10.1111/j.1462-2920.2011.02544.x
[16]
Fuhrman J A, Cram J A, Needham D M. 2015. Marine microbial community dynamics and their ecological interpretation. Nature Reviews Microbiology, 13(3): 133–146. doi: 10.1038/nrmicro3417
[17]
Gao Chunlei, Fu Mingzhu, Song Hongjun, et al. 2018. Phytoplankton pigment pattern in the subsurface chlorophyll maximum in the South Java coastal upwelling system, Indonesia. Acta Oceanologica Sinica, 37(12): 97–106. doi: 10.1007/s13131-018-1342-x
[18]
Gomes N C M, Borges L R, Paranhos R, et al. 2008. Exploring the diversity of bacterial communities in sediments of urban mangrove forests. FEMS Microbiology Ecology, 66(1): 96–109. doi: 10.1111/j.1574-6941.2008.00519.x
[19]
Gong Fahui, Li Guihao, Wang Yaping, et al. 2020. Spatial shifts in size structure, phylogenetic diversity, community composition and abundance of small eukaryotic plankton in a coastal upwelling area of the northern South China Sea. Journal of Plankton Research, 42(6): 650–667
[20]
Gregoracci G B, Soares A C D S, Miranda M D, et al. 2015. Insights into the microbial and viral dynamics of a coastal downwelling-upwelling transition. PLoS ONE, 10(9): e0137090. doi: 10.1371/journal.pone.0137090
[21]
Hansen H P, Koroleff F. 1999. Determination of nutrients. In: Grashoff K, Kremling K, Ehrhard M, eds. Methods of Seawater Analysis. 3rd ed. Weinheim: Wiley-VCH, 149–228
[22]
Jing Zhiyou, Qi Yiquan, Hua Zulin, et al. 2009. Numerical study on the summer upwelling system in the northern continental shelf of the South China Sea. Continental Shelf Research, 29(2): 467–478. doi: 10.1016/j.csr.2008.11.008
[23]
Kirchman D L. 2002. The ecology of Cytophaga-Flavobacteria in aquatic environments. FEMS Microbiology Ecology, 39(2): 91–100
[24]
Kuczynski J, Stombaugh J, Walters W A, et al. 2011. Using QIIME to analyze 16S rRNA gene sequences from microbial communities. Current Protocols in Bioinformatics, 36(1): 10.7.1–10.7.20
[25]
Liu W T, Nielsen A T, Wu J H, et al. 2001. In situ identification of polyphosphate- and polyhydroxyalkanoate-accumulating traits for microbial populations in a biological phosphorus removal process. Environmental Microbiology, 3(2): 110–122. doi: 10.1046/j.1462-2920.2001.00164.x
[26]
Luo Haiwei, Moran M A. 2014. Evolutionary ecology of the marine Roseobacter clade. Microbiology and Molecular Biology Reviews, 78(4): 573–587. doi: 10.1128/MMBR.00020-14
[27]
Mary I, Cummings D G, Biegala I C, et al. 2006. Seasonal dynamics of bacterioplankton community structure at a coastal station in the western English Channel. Aquatic Microbial Ecology, 42(2): 119–126
[28]
Pinhassi J, Sala M M, Havskum H, et al. 2004. Changes in bacterioplankton composition under different phytoplankton regimens. Applied and Environmental Microbiology, 70(11): 6753–6766. doi: 10.1128/AEM.70.11.6753-6766.2004
[29]
Poulton A J, Holligan P M, Hickman A, et al. 2006. Phytoplankton carbon fixation, chlorophyll-biomass and diagnostic pigments in the Atlantic Ocean. Deep-Sea Research Part II: Topical Studies in Oceanography, 53(14–16): 1593–1610
[30]
Prokic I, Brümmer F, Brigge T, et al. 1998. Bacteria of the genus Roseobacter associated with the toxic dinoflagellate Prorocentrum lima. Protist, 149(4): 347–357. doi: 10.1016/S1434-4610(98)70041-0
[31]
Rappé M S, Connon S A, Vergin K L, et al. 2002. Cultivation of the ubiquitous SAR11 marine bacterioplankton clade. Nature, 418(6898): 630–633. doi: 10.1038/nature00917
[32]
Satomi M, Fujii T. 2014. The family Oceanospirillaceae. In: Rosenberg E, DeLong E F, Lory S, et al., eds. The Prokaryotes: Gammaproteobacteria. Berlin, Heidelberg: Springer, 491–527
[33]
Schloss P D, Westcott S L, Ryabin T, et al. 2009. Introducing mothur: open-source, platform-independent, community-supported software for describing and comparing microbial communities. Applied and Environmental Microbiology, 75(23): 7537–7541. doi: 10.1128/AEM.01541-09
[34]
Seyedsayamdost M R, Carr G, Kolter R, et al. 2011. Roseobacticides: small molecule modulators of an algal-bacterial symbiosis. Journal of the American Chemical Society, 133(45): 18343–18349. doi: 10.1021/ja207172s
[35]
Signori C N, Thomas F, Enrich-Prast A, et al. 2014. Microbial diversity and community structure across environmental gradients in Bransfield Strait, western Antarctic Peninsula. Frontiers in Microbiology, 5: 647
[36]
Singleton D R, Powell S N, Sangaiah R, et al. 2005. Stable-isotope probing of bacteria capable of degrading salicylate, naphthalene, or phenanthrene in a bioreactor treating contaminated soil. Applied and Environmental Microbiology, 71(3): 1202–1209. doi: 10.1128/AEM.71.3.1202-1209.2005
[37]
Sommer U, Stibor H, Katechakis A, et al. 2002. Pelagic food web configurations at different levels of nutrient richness and their implications for the ratio fish production: primary production. Hydrobiologia, 484(1–3): 11–20
[38]
Stukel M R, Décima M, Selph K E, et al. 2013. The role of Synechococcus in vertical flux in the Costa Rica upwelling dome. Progress in Oceanography, 112–113: 49–59
[39]
Su Jian, Wang Jun, Pohlmann T, et al. 2011. The influence of meteorological variation on the upwelling system off eastern Hainan during summer 2007–2008. Ocean Dynamics, 61(6): 717–730. doi: 10.1007/s10236-011-0404-9
[40]
Sun Fulin, Wu Meilin, Wang Youshao, et al. 2020. Diversity and potential function of bacterial communities in different upwelling systems. Estuarine, Coastal and Shelf Science, 237: 106698
[41]
Suzuki M T, Béjà O, Taylor L T, et al. 2001. Phylogenetic analysis of ribosomal RNA operons from uncultivated coastal marine bacterioplankton. Environmental Microbiology, 3(5): 323–331. doi: 10.1046/j.1462-2920.2001.00198.x
[42]
ter Braak C J F, Smilauer P. 2002. CANOCO Reference Manual and CanoDraw for Windows User's Guide: Software for Canonical Community Ordination (version 4.5). Ithaca, USA: Agricultural Science and Technology Information
[43]
Treusch A H, Vergin K L, Finlay L A, et al. 2009. Seasonality and vertical structure of microbial communities in an ocean gyre. The ISME Journal, 3(10): 1148–1163. doi: 10.1038/ismej.2009.60
[44]
Walters W, Hyde E R, Berg-Lyons D, et al. 2016. Improved bacterial 16S rRNA gene (V4 and V4–5) and fungal internal transcribed spacer marker gene primers for microbial community surveys. mSystems, 1(1): e00009–15
[45]
Wang Kui, Wommack K E, Chen Feng. 2011. Abundance and distribution of Synechococcus spp. and Cyanophages in the Chesapeake Bay. Applied and Environmental Microbiology, 77(21): 7459–7468. doi: 10.1128/AEM.00267-11
[46]
Wu Meilin, Wang Youshao, Wang Dongxiao, et al. 2014. Effects of coastal upwelling on picophytoplankton distribution off the coast of Zhanjiang in South China Sea. Oceanological and Hydrobiological Studies, 43(3): 283–291. doi: 10.2478/s13545-014-0143-x
[47]
Xia Xiaomin, Guo Wang, Tan Shangjin, et al. 2017. Synechococcus assemblages across the salinity gradient in a salt wedge estuary. Frontiers in Microbiology, 8: 1254. doi: 10.3389/fmicb.2017.01254
[48]
Yin Kedong, Qian Peiyuan, Wu M C S, et al. 2001. Shift from P to N limitation of phytoplankton growth across the Pearl River estuarine plume during summer. Marine Ecology Progress Series, 221: 17–28. doi: 10.3354/meps221017
Jasna Vijayan, Parvathi Ammini, Angia Sriram Pradeep Ram, et al. Microbial distribution in Mudbank regions off Alappuzha, South-West coast of India. Environmental Monitoring and Assessment, 2024, 196(11) doi:10.1007/s10661-024-13176-y
2.
Fahui Gong, Yafeng Zhang, Wei Xie, et al. Response of microbial community of surface and deep chlorophyll maximum to nutrients and light in South China Sea. Frontiers in Marine Science, 2023, 10 doi:10.3389/fmars.2023.1122765
3.
Yue Shi, Qianwen Shao, Linjie Zhang, et al. The effect of southwest monsoon on the meso-scale biogeographic patterns of the bacteria in the northeast of South China Sea. BIO Web of Conferences, 2023, 59: 01021. doi:10.1051/bioconf/20235901021
4.
Jun Da, Yilong Xi, Yunshan Cheng, et al. The Effects of Intraguild Predation on Phytoplankton Assemblage Composition and Diversity: A Mesocosm Experiment. Biology, 2023, 12(4): 578. doi:10.3390/biology12040578
Fahui Gong, Qixing Ji, Guihao Li, Kedong Yin, Jun Gong. Diversity and distribution of bacterioplankton in the coastal upwelling waters off Hainan Island, China[J]. Acta Oceanologica Sinica, 2022, 41(3): 76-85. doi: 10.1007/s13131-021-1807-1
Fahui Gong, Qixing Ji, Guihao Li, Kedong Yin, Jun Gong. Diversity and distribution of bacterioplankton in the coastal upwelling waters off Hainan Island, China[J]. Acta Oceanologica Sinica, 2022, 41(3): 76-85. doi: 10.1007/s13131-021-1807-1
Table
2.
Shifts in relative proportion of gene abundance of 16S rRNA reads (×104 copies/mL) (mean±SE) of major bacterial lineages within the euphotic waters of inner, middle, outer shelves and slope
Taxon
Relative proportion/%
16S rRNA gene abundance
Inner (n=10)
Middle (n=8)
Outer+slope (n=9)
Inner (n=10)
Middle (n=8)
Outer+slope (n=9)
Total bacteria
−
−
−
49.45±5.00a
31.85±3.78b
43.01±2.77ab
Alphaproteobacteria
28.58±1.77
29.33±3.08
29.30±1.69
12.47±1.64
11.236±3.20
13.33±1.62
Rhodobacteraceae
8.01±0.57
6.57±0.61
6.70±0.63
3.65±0.56
2.68±0.84
3.09±0.49
Rhodospirillaceae
4.04±0.37
3.40±0.49
3.44±0.36
1.77±0.26
1.44±0.47
1.52±0.21
SAR116
4.08±0.73
3.63±1.05
2.61±0.48
1.78±0.44
1.86±0.97
1.28±0.29
SAR11
7.93±0.76
8.85±1.10
9.41±1.05
4.15±0.56
3.83±0.79
4.96±0.75
Betaproteobacteria
0.10±0.36
0.68±0.23
0.56±0.17
0.41±0.14
0.25±0.09
0.29±0.10
Thiobacillus
0.06±0.08a
0.1±0.02b
0.08±0.03b
0.14±0.05a
0.05±0.02b
0.03±0.02b
Deltaproteobacteria
3.47±0.74a
1.65±0.14b
2.25±0.20ab
1.70±0.52a
0.60±0.14b
0.98±0.11ab
Bdellovibrionales
1.91±0.78a
0.47±0.06b
1.00±0.12ab
0.94±0.49
0.18±0.04
0.44±0.04
SAR324
0.47±0.12a
0.45±0.08a
0.15±0.03b
0.25±0.08a
0.18±0.06ab
0.06±0.01b
Gammaproteobacteria
26.21±2.07b
34.34±6.84ab
40.29±3.05a
11.31±1.63
12.23±3.06
16.75±1.76
Alteromonas
4.51±1.07b
4.82±1.56b
16.10±2.66a
1.83±0.47b
1.84±0.62b
7.39±1.42a
SAR86
8.45±0.73a
5.74±0.75b
6.29±0.79ab
3.60±0.45
2.42±0.78
2.91±0.43
Oceanospirillaceae
3.12±0.53ab
1.58±0.25b
5.21±0.85a
1.49±0.38ab
0.57±0.11b
2.22±0.44a
Vibrio
0.70±0.07b
0.53±0.12b
1.56±0.31a
0.32±0.06ab
0.20±0.05b
0.63±0.12a
Actinobacteria
9.87±1.05
7.51±1.46
8.48±1.08
4.39±0.69
2.763±0.84
3.98±0.61
Actinomarina
8.36±0.87a
4.62±0.56b
6.10±1.15ab
3.79±0.61
2.054±0.80
2.92±0.59
Bacteroidetes
6.01±1.01
3.93±0.58
4.29±0.49
2.57±0.45a
1.41±0.36b
1.99±0.25ab
Cyanobacteria
13.45±3.41b
27.49±7.44a
5.67±1.18b
7.14±2.87ab
9.97±3.58a
2.46±0.47b
Prochlorococcus
5.81±1.24b
20.05±6.34a
3.45±0.85b
3.02±1.06b
5.93±1.50a
1.41±0.19b
Synechococcus
8.55±2.28a
7.39±2.58a
2.18±0.57b
4.08±1.84a
4.02±2.67a
1.04±0.32b
Deferribacteres
3.45±0.38
2.74±0.28
3.33±0.27
1.58±0.26
0.93±0.13
1.41±0.17
SAR406
3.41±0.36
2.50±0.27
3.29±0.27
1.53±0.25a
0.88±0.15b
1.39±0.17ab
Verrucomicrobia
1.01±0.21a
0.48±0.06b
0.68±0.17ab
0.49±0.14a
0.16±0.03b
0.31±0.07ab
Chlamydiae
0.02±0.01a
0.01±0.00b
0.01±0.00b
0.01±0.00a
0.00±0.00b
0.00±0.00b
Chloroflexi
0.19±0.06
0.11±0.02
0.13±0.02
0.09±0.02a
0.04±0.00b
0.04±0.01ab
Deinococcus-Thermus
0.32±0.13
0.09±0.04
1.52±1.03
0.12±0.06a
0.03±0.01c
0.82±0.55b
Firmicutes
0.89±0.59a
1.80±1.46a
0.21±0.04b
0.35±0.22a
0.59±0.47a
0.09±0.02b
Gemmatimonadetes
0.07±0.02a
0.02±0.00b
0.05±0.01ab
0.04±0.01a
0.01±0.00b
0.01±0.01ab
Nitrospirae
0.02±0.01a
0.00±0.00b
0.01±0.00ab
0.01±0.00a
0.00±0.00b
0.00±0.00ab
Planctomycetes
1.24±0.31a
0.56±0.11b
0.61±0.11b
0.56±0.18
0.26±0.11
0.27±0.05
Tenericutes
0.14±0.06a
0.06±0.02ab
0.03±0.02b
0.06±0.02a
0.03±0.01ab
0.01±0.00b
Note: Number in boldface are significant, p<0.05; a and b on the same row bearing different superscripts are significantly different (p<0.05); − represents no data.
Figure 1. Sampling stations (H1–H8) along Transect H, east coast of Hainan Island, northern South China Sea. The sea surface temperature at H1 and H2 was approximately 27°C, about 3°C to 3.5°C lower than offshore. Stations H1–H3 on the inner shelf were primarily influenced by upwelling and the fresher water mass from the Guangdong coastal current. The water column was distinctly stratified, with a well-defined DCM layer extending from the middle shelf (Stations H4 and H5) to the outer shelf (Station H6) and slope (Stations H7 and H8). The dotted lines indicate the isobaths. The color scale refers to sea surface temperature.
Figure 2. Spatial variations in bacterial OTU richness (a) and 16S rRNA gene abundance (c) along Transect H between the inner shelf (open box) and offshore stations (grey box) (b); the relative abundance of major bacterial taxa in the bacterioplankton community from Stations H1 to H8 (d). The sampling depths were annotated in the sample ID.
Figure 3. The NMDS plot (a) showing that the community structure of bacterial community differentiated on a cross-shelf scale and the redundancy analysis (RDA) showing that DO, nitrate, salinity and ammonium were the most significant environmental variables influencing the spatial organization of the bacterial community along the transect (b).
Figure 4. Vertical profiles of the 16S rRNA gene abundance of major bacterial groups along Transect H off eastern Hainan Island. Note that Stations H1 to H3 were strongly influenced by upwelled water as well as the fresher water from the Guangdong coastal current.
Figure 5. Semi-log plots showing the most significant regressions between bacterial OTU richness and ${\rm{NH}}_4^+ $ concentration (a) and between rRNA gene abundance and salinity (b). The values of the correlation coefficients between the rRNA gene abundances of major taxa and environmental factors are indicated according to the color bar (c). T represents temperature. Non-significant correlations (p>0.05) were left blank.


 DownLoad:


 DownLoad:


 DownLoad: