Junbao Huang, Zhilin Sun, Dongfeng Xie. Morphological evolution of a large sand bar in the Qiantang River Estuary of China since the 1960s[J]. Acta Oceanologica Sinica, 2022, 41(2): 156-165. doi: 10.1007/s13131-021-1817-z
Citation:
Junbao Huang, Zhilin Sun, Dongfeng Xie. Morphological evolution of a large sand bar in the Qiantang River Estuary of China since the 1960s[J]. Acta Oceanologica Sinica, 2022, 41(2): 156-165. doi: 10.1007/s13131-021-1817-z
Junbao Huang, Zhilin Sun, Dongfeng Xie. Morphological evolution of a large sand bar in the Qiantang River Estuary of China since the 1960s[J]. Acta Oceanologica Sinica, 2022, 41(2): 156-165. doi: 10.1007/s13131-021-1817-z
Citation:
Junbao Huang, Zhilin Sun, Dongfeng Xie. Morphological evolution of a large sand bar in the Qiantang River Estuary of China since the 1960s[J]. Acta Oceanologica Sinica, 2022, 41(2): 156-165. doi: 10.1007/s13131-021-1817-z
Ocean College, Zhejiang University, Zhoushan 316021, China
2.
Zhejiang Institute of Hydraulics and Estuary, Hangzhou 310020, China
3.
College of Civil Engineering and Architecture, Zhejiang University, Hangzhou 310058, China
Funds:
The National Natural Science Foundation of China under contract Nos 41676085 and 42176170; the Zhejiang Provincial Hydraulic Science and Technology Planning Project under contract No. RB2033; the Zhejiang Provincial Natural Science Foundation of China under contract No. LY16D060004.
A large sand bar develops in the inner Qiantang River Estuary, China. It is a unique sedimentary system, elongating landwards by about 130 km. Based on long-term series of bathymetric data in each April, July, and November since the 1960s, this study investigated the morphological behavior of this bar under natural conditions and the influence of a large-scale river narrowing project (LRNP) implemented in the last decades. The results show that three timescales, namely the seasonal, interannual and decadal timescales, can be distinguished for the sand bar evolution. The first two are related to the seasonal and interannual variations of river discharge. During high discharge seasons or years, erosion took place at the upper reach and sedimentation at the lower reach. Consequently, the bar apex shifted seaward. The opposite development took place during low discharge seasons or years. The decadal timescale is related to LRNP. Due to the implementation of LRNP, the upper reach has experienced apparent erosion and currently a new equilibrium state has been reached; whereas the lower reach has been accumulated seriously and the accumulation still continues. Nonlinear relationships for how the bar apex location and elevation depend on the river discharge over various stages of LRNP have been established. Compared with the earlier stage of LRNP, the bar apex at present has shifted seaward by about 12 km and lowered by about 1 m. The sand bar movement has significant feedback on the hydrographic conditions along the estuary and has practical implications for coastal management.
An estuary is located at the coastal zone where river meets the sea (Dyer, 1997). Estuaries are of high economic values, providing accesses to water transportation and recreational activities. They are also of profound ecological values, hosting various species of wildlife like birds, fishes, benthos, etc., and play an important role on the global carbon cycle (Carter et al, 1994; Trenhaile, 1997). On the other hand, many estuaries are influenced by anthropogenic activities, such as embankment, dam construction and sand excavation. Especially during the last one or two centuries, such human interventions often have had more significant effects on the morphological development than those due to natural forces (Gao and Wang, 2008; Yang et al., 2011; Wang et al., 2015, 2020). From the coastal management point of view, it is of major practical significances to study morphological evolution of estuaries, in particular under increasing anthropogenic pressure.
The Qiantang River Estuary is one of the largest macro-tidal estuaries on the East China Sea coast, next to south of the Changjiang River Estuary (Fig. 1). The most remarkable morphological feature of the estuary is the presence of a large subaqueous sand bar. It is a unique Holocene sedimentary system, elongating by about 130 km upstream from the middle Hangzhou Bay (Gao, 2013; Gao and Collins, 2014). Earlier field surveys revealed that sediment of the large sand bar mainly comes from the adjacent Changjiang River Estuary (Chen et al., 1990; Chien et al. 1964). Sedimentary facies analyses based on sediment cores showed that the thickness of the Holocene sedimentary layer of the sand bar area can be up to 100 m (Lin et al., 2005; Zhang et al., 2014; Fan et al., 2015). Recent morphodynamic modeling revealed that the sand bar formation is mainly due to significant landward sediment transport caused by the strong convergence of the estuary and the macro-tides from the seaside (Yu et al., 2012; Xie et al., 2017a). However, few bathymetric data have been reported, in particular on the seasonal and interannual morphological developments of the sand bar.
Figure
1.
Location of the Qiantang River Estuary (a), and the transverse-averaged longitudinal profile of the large bar (b). In the panel a, the dashed box denotes the area of the large bar and the black cross-sections denote those surveyed by ZSIEC. The panel b is after Xie et al. (2017a).
Worldwide, land reclamation has been common practice in many estuaries. Reclamation induces changes of hydrodynamics, associated sediment transport and subsequently morphological evolutions. Because of the large covering area of an estuary, effects of most estuarine projects are local (He et al., 2011; Luan et al., 2016; Zhang et al., 2020). Since the 1960s, a large-scale river narrowing project (LRNP) has been implemented in the Qiantang River Estuary for the aims of estuary regulation and land expansion (Fig. 2). Consequently, the planform of the estuary has been changed significantly. This provides an opportunity to detect the influence of estuary planform on the large sand bar evolution. In recent years, several studies have focused on the morphological responses of the Hangzhou Bay (the downstream reach of the Qiantang River Estuary) to the LRNP (Dai et al., 2014; Liu and Wu, 2015; Liu et al., 2017). Especially, the sedimentation rate in the inner Hangzhou Bay has been enhanced from 2.4 cm/a to 13.4 cm/a in recent years (Xie et al., 2017b). So far, our understanding on the morphological response of the reach from Zhakou to Ganpu, known as the estuarine reach (Chen et al., 1990; Han et al., 2003), to the LRNP is still limited.
Figure
2.
The large-scale river narrowing project of the Qiantang River Estuary since the 1960s.
The objectives of this study are to delineate the seasonal, interannual and decadal morphological evolution of the large sand bar in the Qiantang River Estuary, based on long-term series of bathymetric data of the Zhakou−Ganpu reach since the 1960s. The Zhakou−Ganpu reach is the main part of the large sand bar (Fig. 1) and the morphological development in this reach is controlled by the combination of river flow and tides. Specific aims are: (1) to investigate the morphological behavior of the large sand bar in seasonal and interannual timescales under natural conditions; (2) to detect the morphological response of the sand bar to the LRNP; and (3) to explore the potential forces for morphological adjustment and its practical implications for coastal management.
2.
Study area
The Qiantang River Estuary is a 282 km long funnel-shaped estuary. The width of the estuary decreases from 98.5 km at the mouth (Nanhui−Zhenhai Transect) to less than 1 km at the upstream end (Fuyang Transect) (Fig. 1a). The estuarine reach is controlled by both river discharge and tidal flow, showing extremely active morphological evolution. Downstream Zhapu in the middle Hangzhou Bay is a subaqueous plain, with bed elevation around −10 m (with respect to the National Height Datum 1985, the same below). A large sand bar is developed upstream Zhapu and elongates by about 130 km. The bed level begins to rise gradually from Zhapu, reaches the highest (the bar apex) of above 0 m (Han et al., 2003; Xie et al., 2017a) at the Qibao−Cangqian reach, and then falls landward to below −20 m at Fuyang (Fig. 1b).
The annually averaged tidal range at the north side of Hangzhou Bay mouth is 3.21 m. It increases gradually landwards due to the estuary convergence, and reaches the maximum of 5.62 m at Ganpu (Pan and Han, 2017). Upstream Ganpu the large sand bar results in water depth decrease, such that tidal wave is severely deformed and eventually evolves into the world-famous Qiantang Bore. Flood duration shortens from 5.4 h at Ganpu to about 1.5 h at Zhakou, and ebb duration prolongs from 6.9 h to 10.9 h.
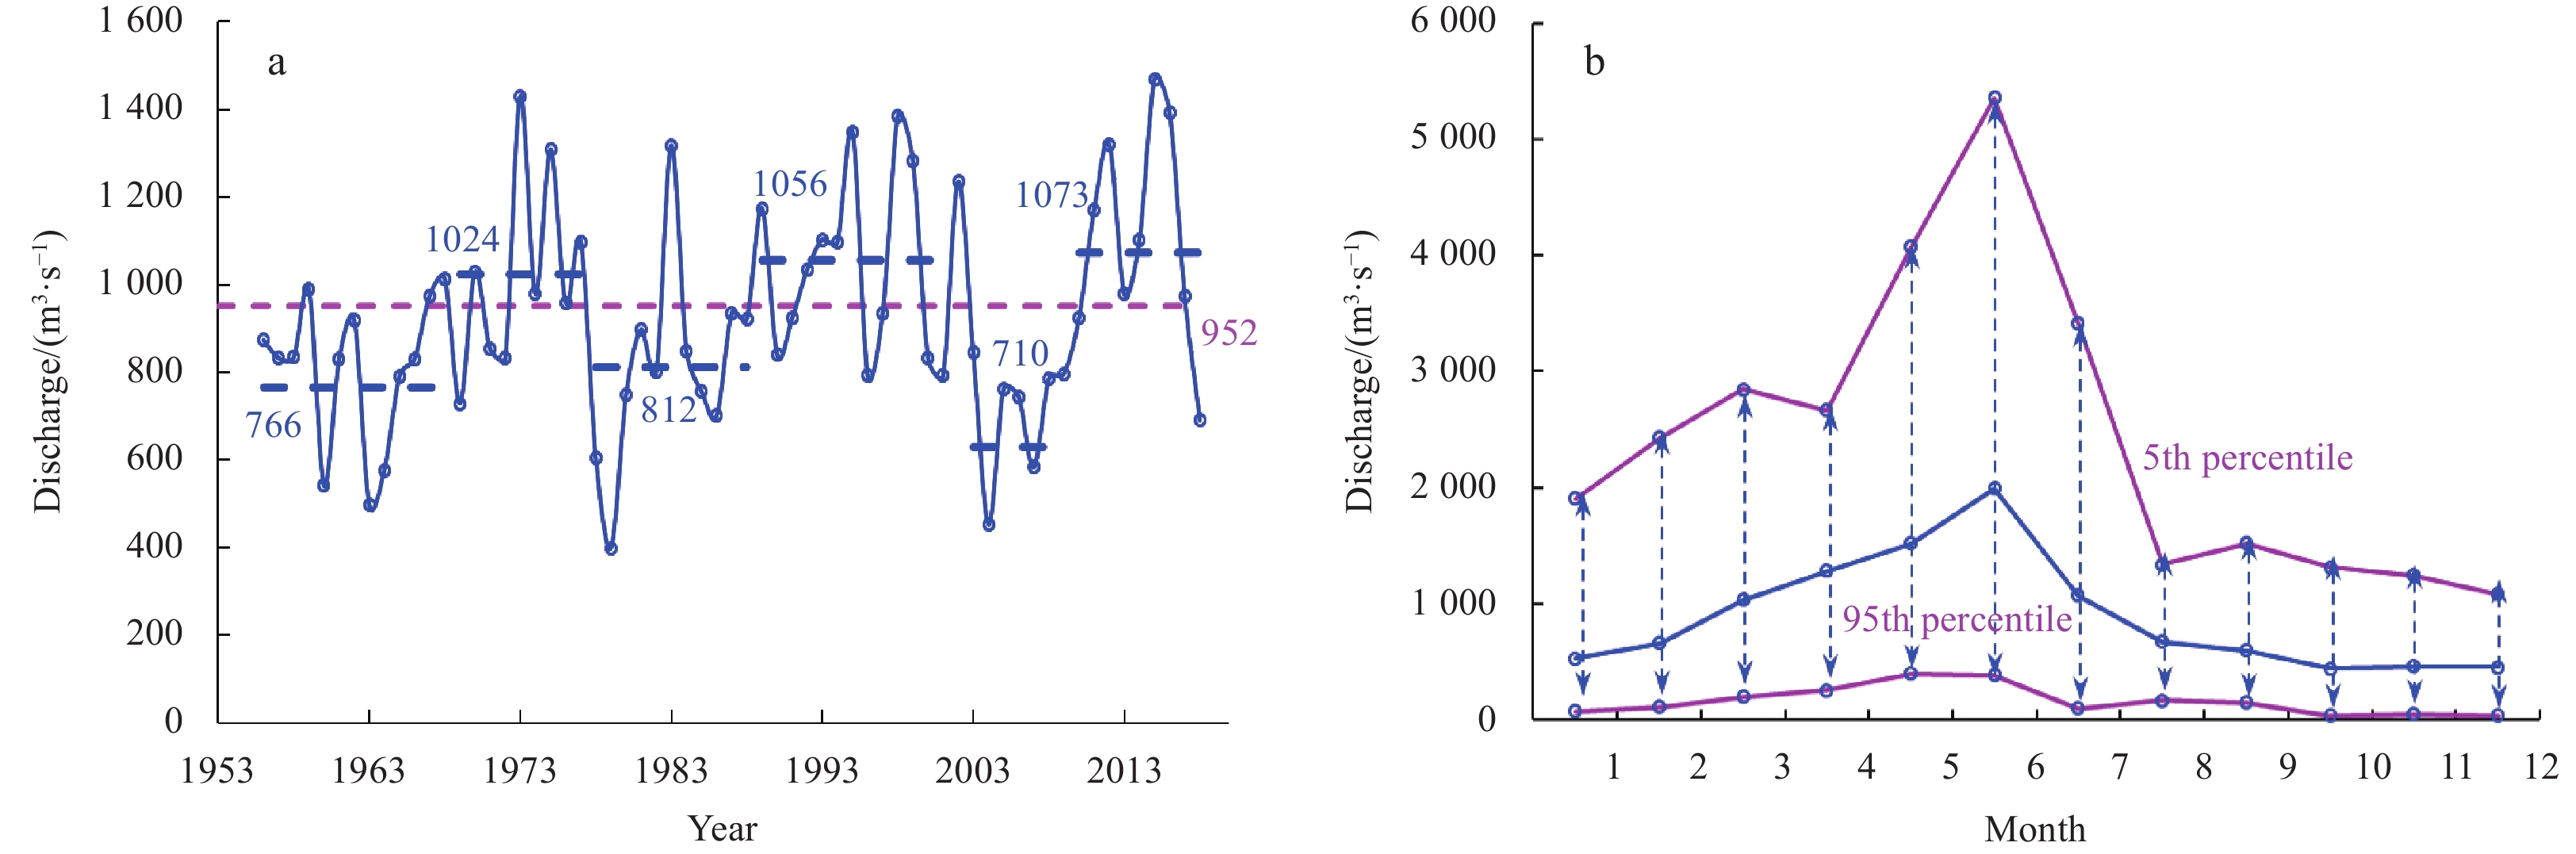
The annually averaged discharge of the Qiantang River is 952 m3/s (Han et al., 2003). The monthly averaged discharges vary between 319 m3/s and 1 705 m3/s (Fig. 3). The runoff mainly occurs in the rainy season (between April and July), accounting for 55%−60% of the year. Furthermore, it is characterized by the alternate wet and dry years on the interannual timescales, with the period around 20 years (Zeng et al., 2010). The sediment load from the Qiantang River is around 8×10⁶ t/a and the suspended sediment concentration is normally less than 0.1 kg/m3 under normal river conditions (Chen et al., 2006). Sediment in the estuary is mainly from the adjacent Changjiang River Estuary. The huge sediment load from the Changjiang River, used to be around 4.5×10⁸ t/a, is diffused southerly and enters the Qiantang River Estuary under the influences of tidal currents and wind waves (Su and Wang, 1989; Chen et al., 1990). The sediment in the estuary is mainly composed of fine silt and clay, with the median grain size generally between 0.02 mm and 0.04 mm (Chen et al., 1990).
Figure
3.
Annually averaged discharge (a) and month (b) river discharges of the Qiantang River over 1956–2018. The dashed pink line in the panel a denotes the multi-yearly averaged discharge and the dashed blue lines denote the averaged discharge over the alternate wet and dry years.
The Qiantang River Estuary is wide and shallow, and the fine sediments are highly mobile under the swift river flow and tidal currents. The bed level changes rapidly and the thalweg used to swing frequently (Chien et al., 1964; Chen et al., 1990; Zeng et al., 2010), with extremely adverse effects on flood defense, drainage as well as protection and utilization of estuary resources. Since the 1960s, the LRNP has been gradually implemented, mainly by embanking at the middle and high tidal flats along the south bank (Li and Dai, 1986; Han et al., 2003; Pan et al., 2010). So far more than 1 000 km2 land has been reclaimed (Fig. 2). The coastal banks between Zhakou and Yanguan reaches (hereafter defined as the upper reach) were fixed after the narrowing during 1968–1985. The regulation of the Yanguan−Ganpu reach (hereafter defined as the lower reach) was basically completed by 2000. After 2000, only some local reclamation along the southern bank of the Hangzhou Bay has been carried out.
3.
Data and methods
The topography of the estuarine reach between Zhakou and Ganpu has been measured by Zhejiang Surveying Institute of Estuary and Coast in each April (before the rainy season), July (after the rainy season), and November (after autumn) since the 1960s (Han et al., 2003). During each bathymetrical survey, the bed elevation along 50 cross-sections, with an average distance of 1–2 km between them, was observed using an Odom Hydrotrac echo-sounder and a global positional system by Trimble (Fig. 1). The errors of elevation and horizontal positioning are within 0.1 m and 1 m, respectively. After each bathymetrical measurement the transverse-averaged elevations for each cross-section and volumes under local annually averaged low water level have been calculated by ZSIEC. The former is a function of cross-sectional area and width, and the latter is a function of cross-sectional area and distance between neighboring cross-sections.
The transverse-averaged elevations in the estuarine reach from 1964 to 2018 have been collected from ZSIEC. This dataset provides a basis for analyzing the short-term and long-term morphological behavior of the large sand bar. In addition, the original bathymetric data in 1967, 1976, 1987, 1997, 2010 and 2017 (roughly with an interval of ten years) was collected to obtain an overview of the morphological evolution of the estuarine reach. The annually averaged discharges of these six years were all around 900 m3/s (Fig. 3a). The morphology of the estuarine reach is sensitive to the variations of river discharge (Han et al., 2003; Xie et al., 2018). The selection of these six years allows a comparison under comparable hydrodynamic conditions. The elevations before 2000 were with respect to the theoretically lowest tidal datum at Wusong. Since 2001, the bed elevations have been with respect to the Chinese National 1985 Datum. In this study the topographic data is uniformly converted into the 1985 Datum.
Topographic data are analyzed for the continuous dry and wet years, as well as dry and wet seasons, in order to determine the seasonal and interannual morphological variations of the large sand bar. In particular, the location and elevation of the bar apex are important indicators of the large sand bar morphology (Chien et al., 1964; Chen et al., 1990). The temporal and spatial variations of the bar apex are analyzed over various stages of the LRNP. In addition, the years of 2004 and 2012 are chosen to be typical dry and wet years, respectively. The annually averaged discharges of the two years were the maximum and minimum since 1980, respectively (Fig. 3). The annually averaged discharges were 454 m3/s in 2004 and 1 470 m3/s in 2012, about respectively 0.5 and 1.5 times of the long-term discharge of the Qiantang River.
In January 2017 a hydrographic survey was carried out at three hydrographic stations along the Ganpu Transect (Fig. 1a), measuring tidal levels, water depth, current velocity of 6 vertical layers, namely the surface, 0.2 H, 0.4 H, 0.6 H, 0.8 H and near the bottom (H denotes the water depth). The measurements covered a spring-neap tide cycle. The tidal prisms over each tide were determined by using water depth and depth-averaged current velocity. Meanwhile, the tidal prisms along the same transect in January, 1977 were collected from Pan and Han (2017). The field work in 1977 was carried out during spring and intermediate tides. For the comparison between tidal prisms in 1977 and 2017, the relationships between tidal prisms and tidal ranges at the Luchaogang tidal gauging station at the mouth are analyzed.
4.
Results
4.1
The seasonal and interannual morphological changes of the large sand bar
Figure 4a illustrates the seasonal variations of the transverse-averaged longitudinal profiles of the large sand bar in 2012. From April to July, the bed in the upper reach was eroded by 0.98 m, while in the lower reach it was accumulated by 0.42 m. From July to November the bed evolution was opposite, namely accumulation occurred in the upper reach and erosion occurred in the lower reach. The location of the bar apex in the three months was 41.7 km, 43.5 km and 40.2 km from Zhakou, respectively, and the elevation was 1.42 m, 0.41 m and 1.73 m, respectively. It is clear that the bar apex was lowered and moved seaward during the high discharge season and then gradually recovered in the following months. Since this study compares the sand bar evolution using the transverse-averaged bed elevation, the presented bed level changes are smaller in magnitude than the local bed level changes which can be up to 5 m in several months (Han et al., 2003; Xie et al., 2018). Moreover, both the front slope (from Ganpu to the apex) and adverse slope (from the apex to Zhakou) of the large sand bar were flatter in July than in April and November. The front and adverse slopes in the three months were 0.99×10⁻⁴, 0.67×10⁻⁴, 1.11×10⁻⁴ and 0.55×10⁻⁴, 0.44×10⁻⁴, 0.76×10⁻⁴, respectively.
Figure
4.
The seasonal variations of the longitudinal profile of the large bar in 2012 (a), and the comparison of the longitudinal profile of the large bar in April of 2004 and 2012 (b).
For an analysis of interannual morphological changes the bathymetries in April or November are more suitable, because the bathymetry in July is generally influenced by high river discharge in the rainy season, especially by episodic flood events (Han et al., 2003; Xie et al., 2018). Figure 4b shows the longitudinal profiles in April of 2012 and 2004. The bed elevation over the upper reach in 2004 was 1.10 m higher than in 2012, whereas the elevation over the lower reach was 0.46 m lowered. The bar apex in 2004 and 2012 was 30.3 km and 41.7 km from Zhakou, respectively, and the bed elevation at the apex was 2.56 m and 1.54 m, respectively, indicating that the apex shifted seaward by 11.4 km and lowered by 1.02 m from 2004 to 2012. Meanwhile, the front and adverse slopes of the sand bar in 2012 were flatter than in 2004, with the slopes decreased by 0.18×10⁻⁴ and 0.28×10⁻⁴, respectively.
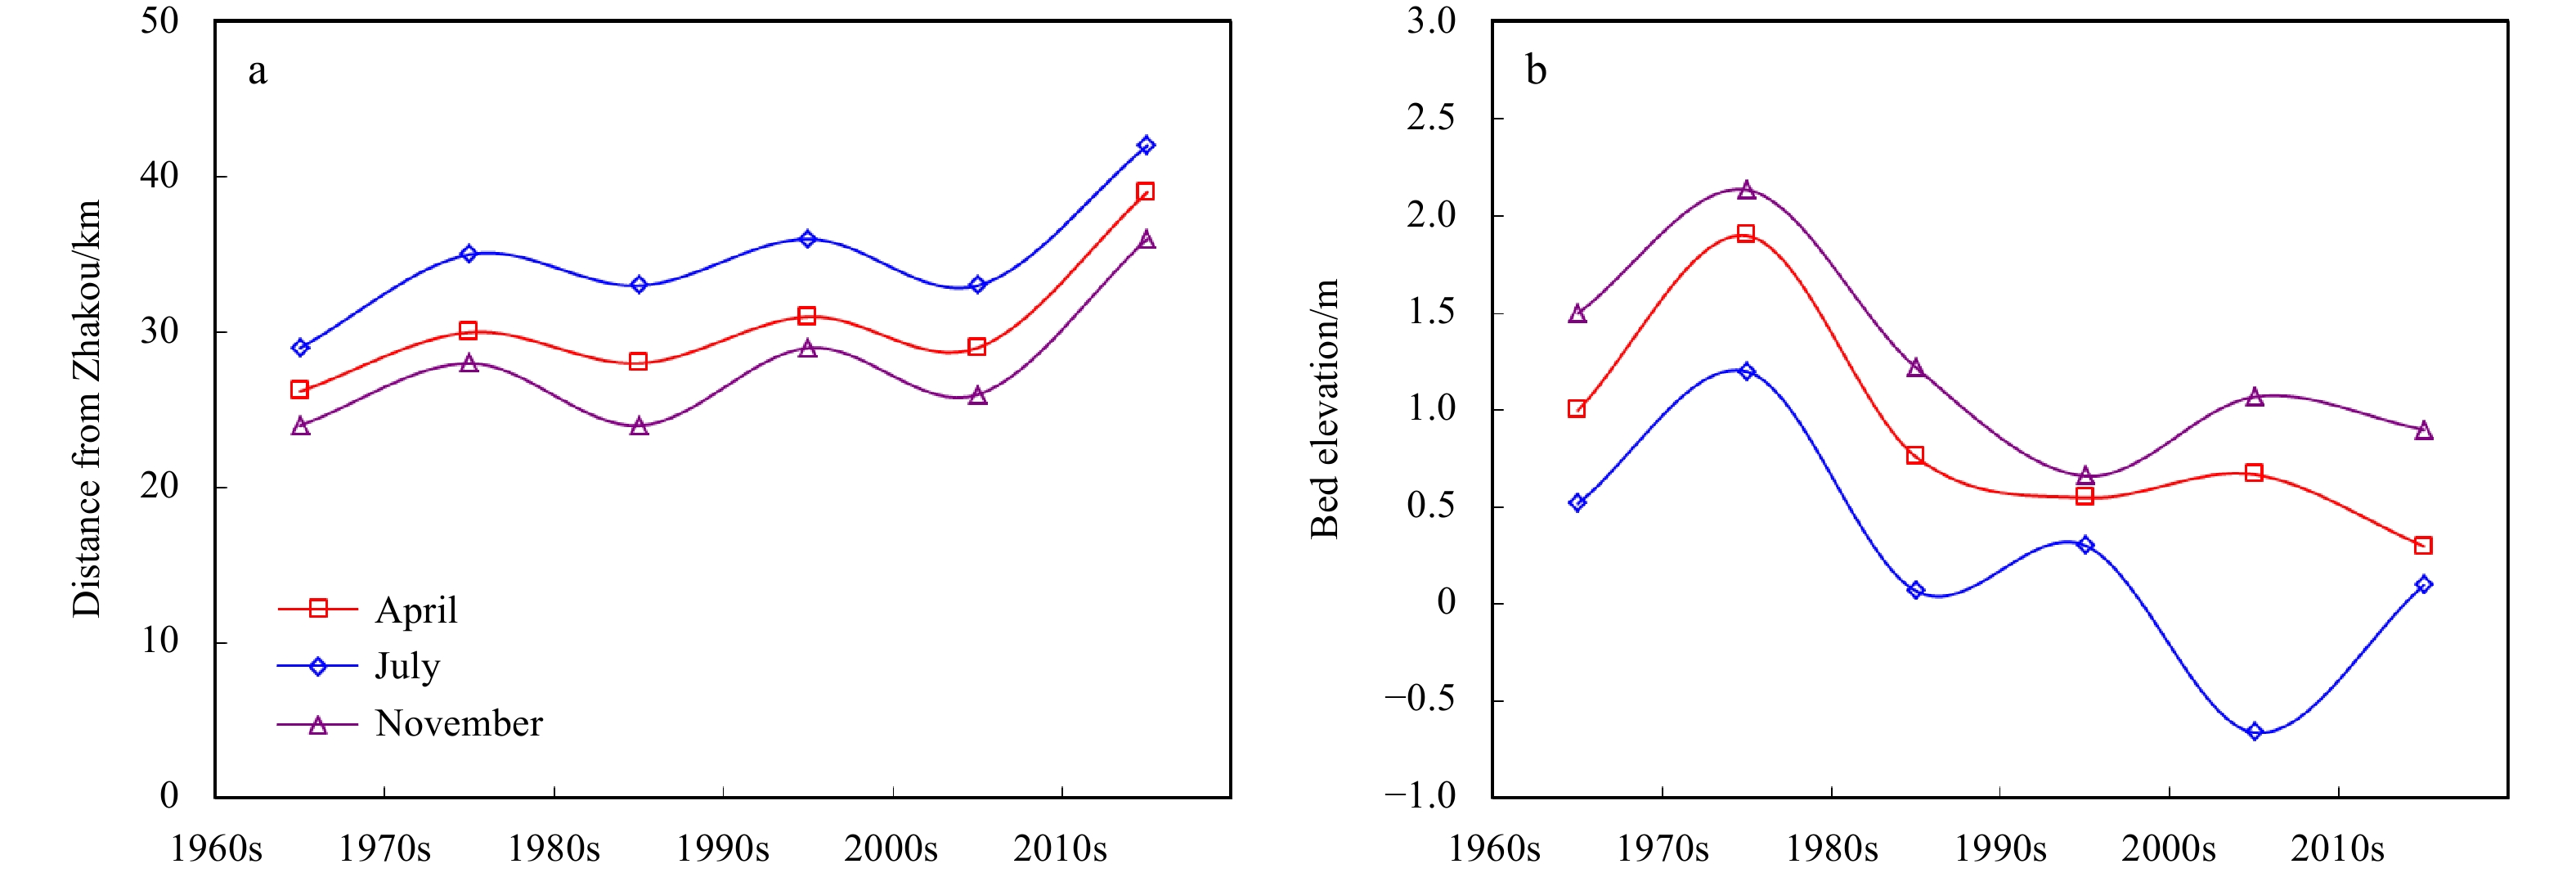
Figure 5 shows the variations of the location and elevation of the bar apex basd on data in each April, July and November since the 1960s. The distance from Zhakou of the apex was smallest in November and largest in July. The average distances in April, July, and November were 29.4 km, 34.7 km, and 27.2 km, respectively, and the elevation is highest in November, and lowest in July. In terms of the alternate wet and dry years, both the location and the elevation fluctuated with the variations of the river discharge. The location was more landwards in the dry years than in the wet years. Meanwhile, the bar apex was relatively lower in the wet years than in the dry years. The magnitude of changes during the years varied between 0.1 m and 1.1 m.
Figure
5.
Decadal variations of the position and bed elevation of the bar apex.
4.2
Decadal morphological changes of the large sand bar
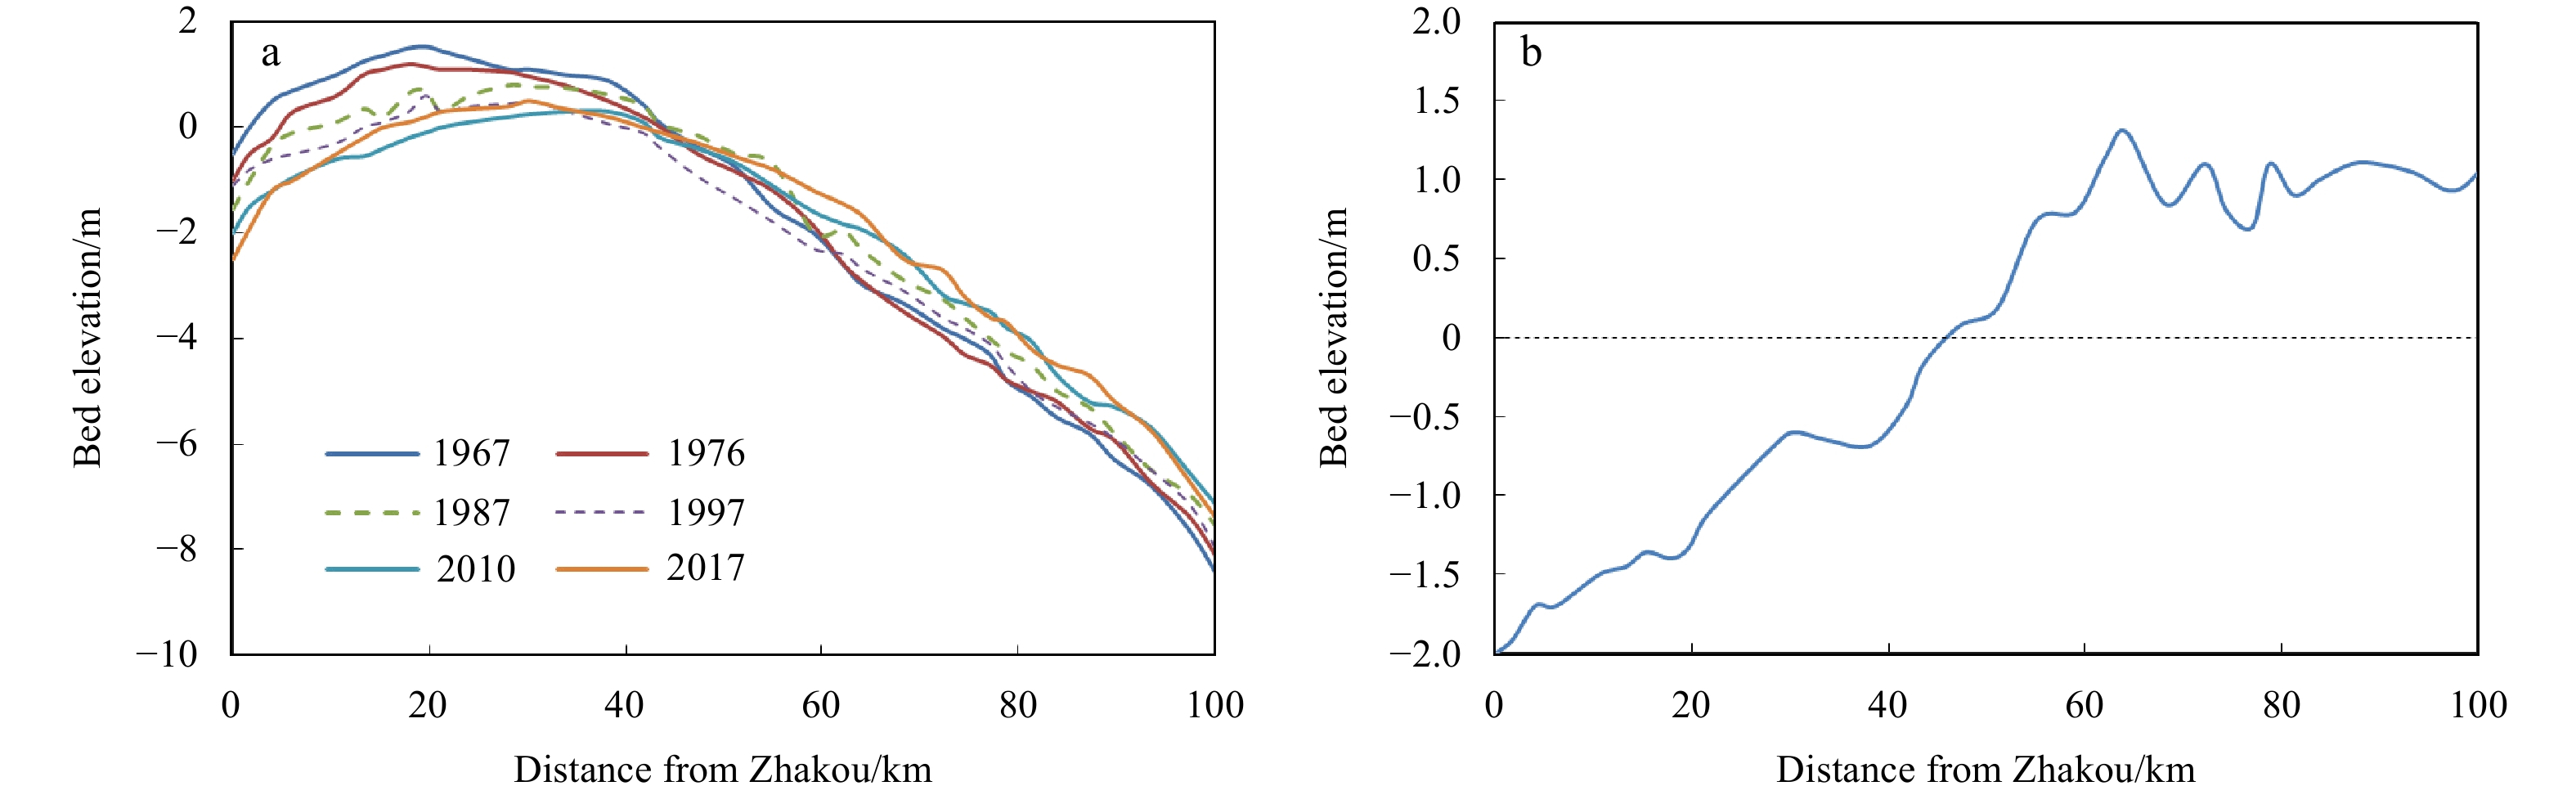
Figure 6 shows the bathymetries of the estuarine reach measured in April of the six years, i.e., 1967, 1976, 1987, 1997, 2010 and 2017. In the earlier stage, the estuary was flanked by extensive tidal flats, in particular along the southern bank. With the gradual implementation of the LRNP, most of the flats were reclaimed. The main channel was generally located at the concave bank due to centrifugal force. Overall, the bed level was higher between Qibao and Yanguan whereas that in the reaches upstream Qibao and downstream Yanguan are lower. The sand bar evolution can be more easily detected using the laterally averaged bed level data (Fig. 7). It is apparent that the bar apex in 1967 and 1976 were more landwards and then moved seaward in the later periods. For example, the locations of the bar apex in 1967 and 2017 were 17.9 km and 30.3 km from Zhakou, respectively, and the corresponding elevations of the apex were 1.53 m and 0.45 m. With the movement of the bar apex, the upper reach has been eroded and the lower reach has been accumulated. Between 1967 and 2017, the bed erosion and accumulation in the upper and lower reaches were −1.16 m and 0.89 m, respectively. In addition, the front and adverse slopes have been decreased from 1.31×10⁻⁴ to 1.04×10⁻⁴ and from 0.99×10⁻⁴ to 0.86×10⁻⁴, respectively.
Figure
6.
Bathymetry charts of the estuarine reach in April of 1967, 1976, 1987, 1997, 2010 and 2017.
As shown in Fig. 5, all data in April, July and November over the last six decades show that the bar apex has shifted seaward and lowered to a certain extent. In April the bar apex of the six decades was 26.2 km, 30.1 km, 28.0 km, 31.3 km, 25.5 km and 39.4 km from Zhakou, respectively, and the elevations was 1.21 m, 1.93 m, 0.84 m, 0.57 m, 0.73 m and 0.36 m, respectively. Thus, the bar apex has shifted seaward by 13.2 km and lowered by 0.95 m in the last decades.
Based on data before the beginning of the LRNP, it was found that the location of the bar apex correlates well with the variations of the river discharge (Chen et al., 1990). Figure 8 shows the relationships between the April bar apex location and elevation and the river discharge from last December to April in the period between 1964 and 2018. The data are divided according to three stages of the LRNP: the earlier stage between 1964 and 1980, the middle stage between 1981 and 2000 and the later stage between 2001 and 2018. The distance between the apex and Zhakou in the three stages shows positive logarithmic relationships with the river discharge, consistent with the observation by Chen et al. (1990), whereas the apex elevations show negative logarithmic relationships with the river discharge. On the other hand, it is clear that such relationships have change. Under the annually averaged river discharge of 952 m3/s, the distances of the earlier and later stages are 29.3 km and 41.2 km, respectively, and the elevations are 0.41 m and −0.56 m, respectively. Compared with earlier stage, the bar apex has thus shifted seaward by about 11.9 km, and the elevation has been lowered by about 0.97 m.
Figure
8.
Relationship between the bar apex location (a), bed elevation (b) and river discharge during the earlier, middle and later stages of the LRNP. The lines denote the fitted functions.
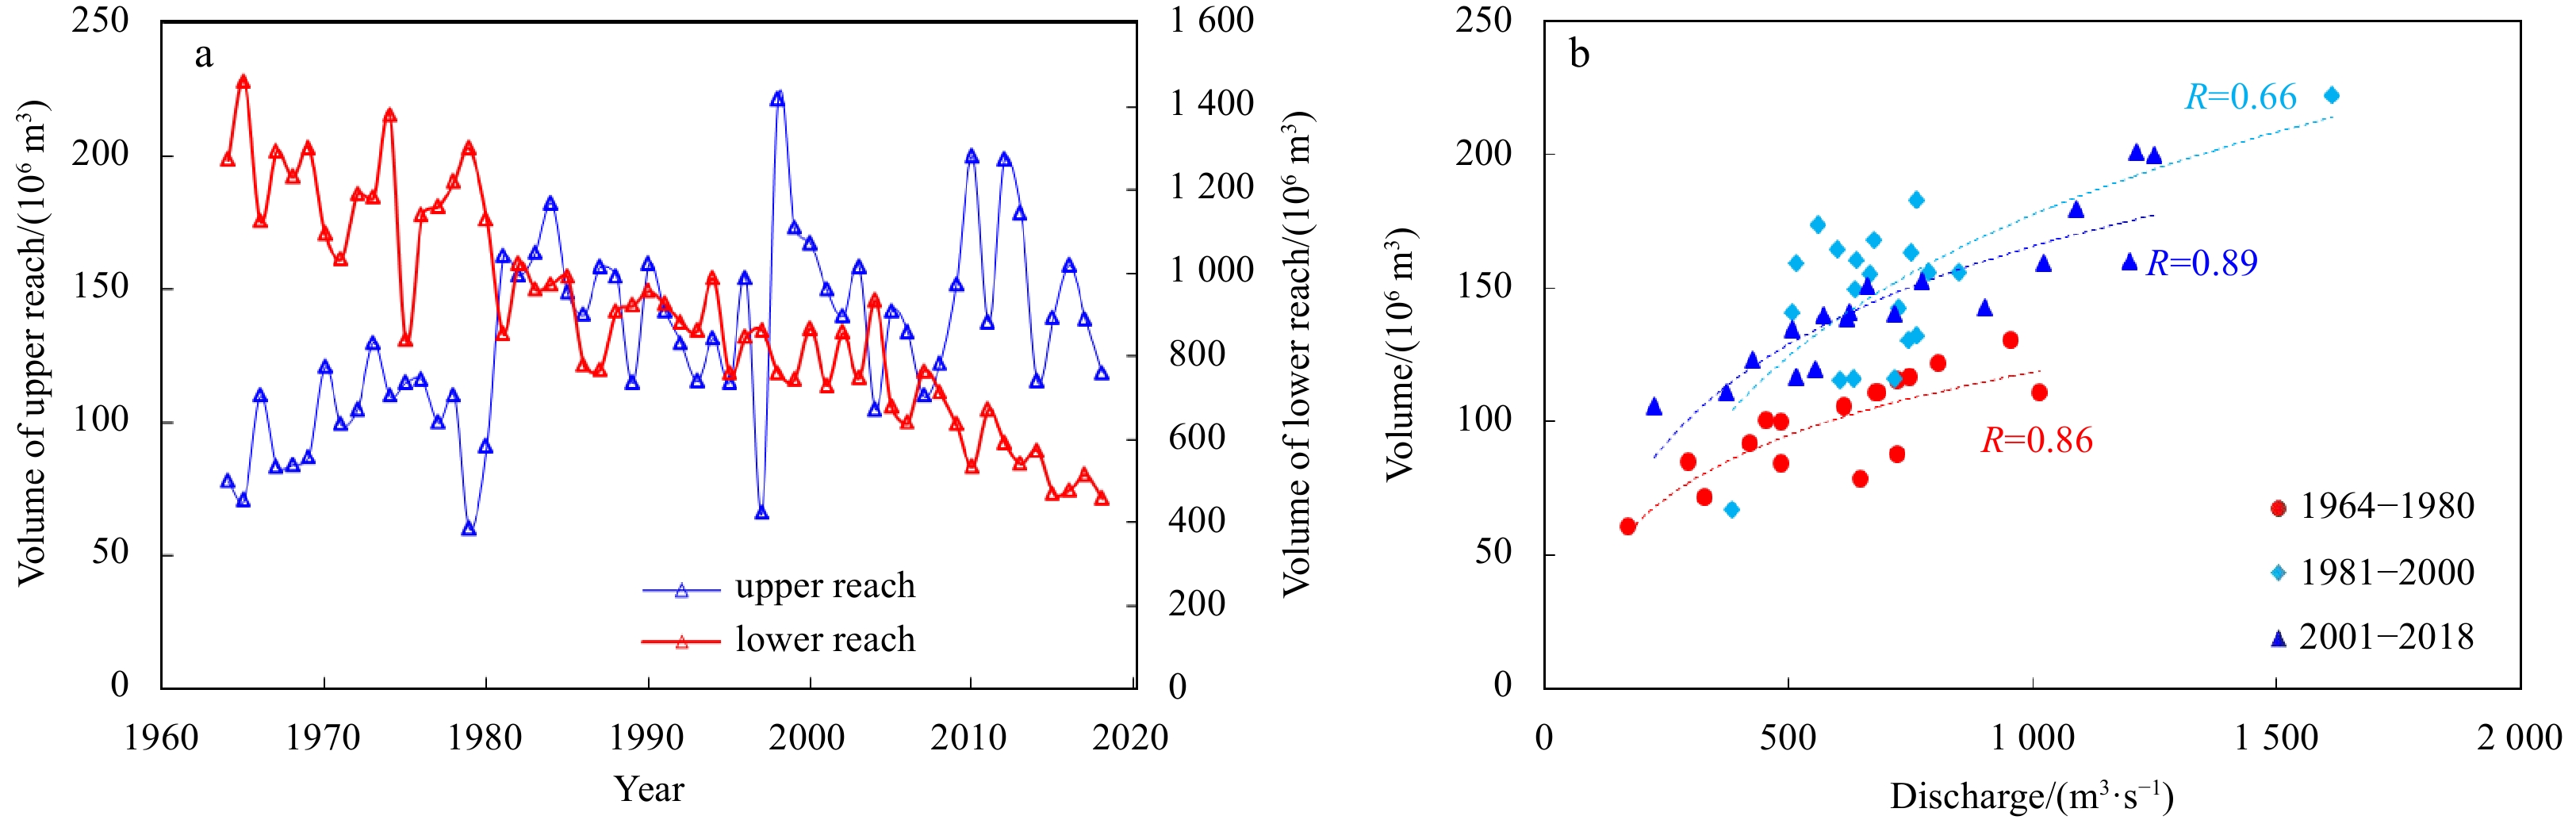
Figure 9 shows the time series of the volumes of the upper and lower reaches under local annually averaged low water levels. The volume of the upper reach has been enlarged by 140.5×10⁶ m3. Because the embankment by LRNP occurred at the middle and high flats (Li and Dai, 1986), the direct influence of the embankment on the calculated volume was limited. Thus, the volume increases indicate that the upper reach experienced significant bed erosion. The volume correlates well with the mean river discharge during last December to April in the two stages before 1980 and after 2001 (Fig. 9b), indicating that the morphological evolutions in the two periods mainly depend on the variation of the river discharge. This relationship for the period 1981–2000 is less clear, probably due to the disturbance caused by the gradual implementation of the LRNP. Contrarily, the volume of the lower reach has decreased gradually from 1 271.5×10⁶ m3 to 556.1×10⁶ m3. The amount of sediment accumulation since the 1960s is 715.4×10⁶ m3, more than half of the volume in the 1960s. Sediment accumulation in this reach is still going on.
Figure
9.
Time series of the volumes under local annually averaged low water level of the upper and lower reaches in April (a), and the relationship of the volume of the upper reach with the river discharge between December and next April during the earlier, middle and later stages of the LRNP (b).
It is well known that the morphological evolution of an estuary is controlled by the interactions between hydrodynamics, sediment transport and bed level change (Hibma et al., 2004; Xie et al., 2010; Gao and Collins, 2014). Under natural conditions, most estuaries in the Asian region have reached their morphodynamic equilibrium state. However, human activities can strongly disturb the systems and force them into a non-equilibrium state (Gao, 2006). In the earlier stage, despite the apparent seasonal and interannual bed level changes, the Qiantang River Estuary was under its equilibrium over an enough long timescale (Chien et al., 1964). With the implementation of the LRNP, such equilibrium was broken, and the system adjusted to adapt to the new hydrodynamic conditions. The lower reach of the large sand bar has experienced significant sediment accumulation in the last decades (Figs 6–8), consistent with conclusions from previous studies that reclamation usually causes accumulation in estuaries (van der Spek, 1997; Wang et al., 2002; Pye and Blott, 2014). However, apparent erosion has occurred in the upper reach. This can be attributed to the role of river discharge. The LRNP decreased the cross-sectional area in the upper reach, and correspondingly the river discharge per unit width has been increased.
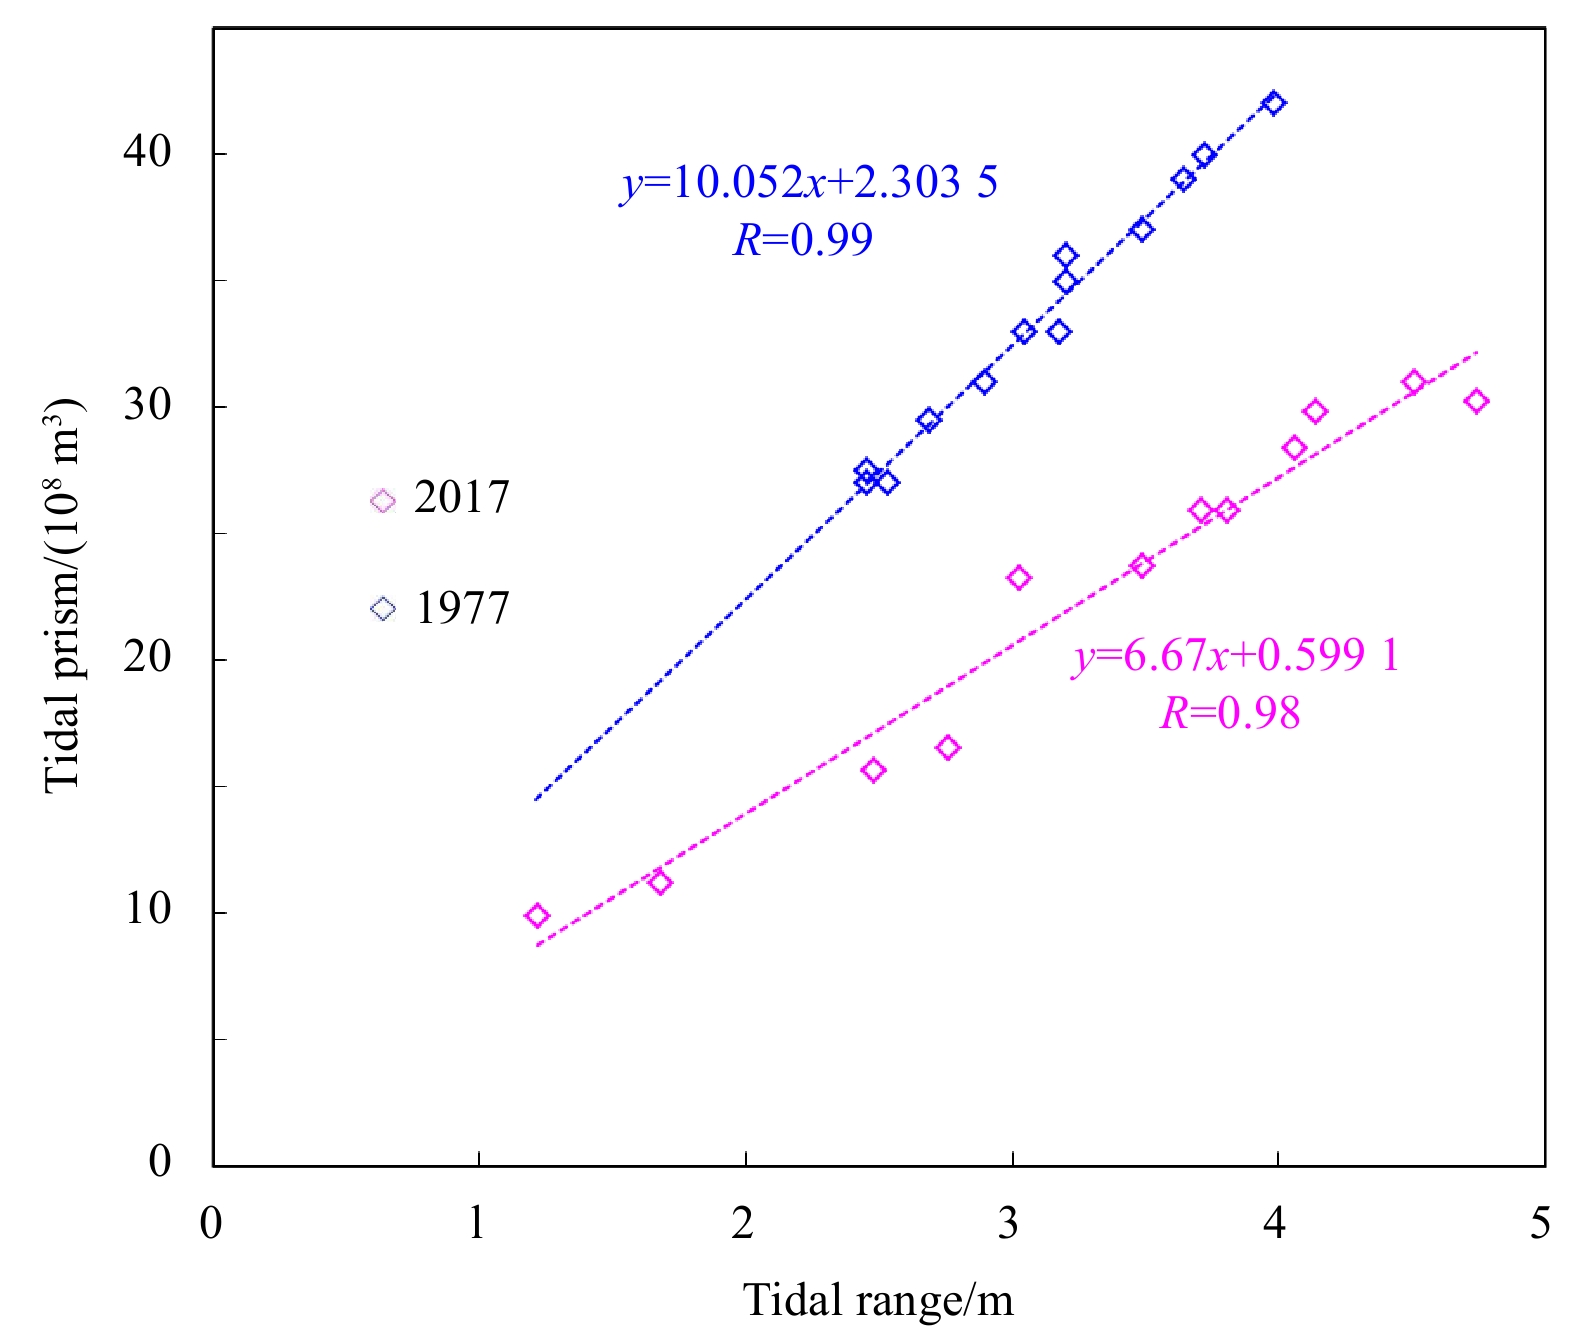
The seaward movement of the sand bar can also be explained by the classic theory of the relative strength of river discharge to tidal prism (Chien et al., 1964). Figure 10 shows both the tidal prisms through the Ganpu Transect in 1977 and 2017 correlate well with tidal range at the estuary mouth. The tidal prism demonstrates clearly a decreasing trend. For example, under the annually averaged tidal range of 3.21 m (Pan and Han, 2017), the tidal prisms in the two years are 20.8×10⁸ m3 to 33.4×10⁸ m3, respectively, indicating a decrease of 37.7%. Given the river discharge have not shown trending change in the last decades (Fig. 3), the decreased tidal prism has resulted in an increase of the relative strength of river discharge to tidal flow. As a result, the large sand bar has shifted seaward accordingly.
Figure
10.
The relationships between tidal prisms at the Ganpu Transect and the corresponding tidal ranges at the Luchaogang gauging station.
Using several charts in the Hangzhou Bay, Xie et al. (2017b) found the accumulation rate in the inner Hangzhou Bay has been increased from 2.4 cm/a during 1959–2003 to 13.4 cm/a during 2010–2014, faster than the average accumulation rate of 1.5 cm/a in the Hangzhou Bay during 1887–1987 (Xue, 1995). Because the inner Hangzhou Bay can be seen as the tail of the large sand bar, the accelerating accumulation of the sand bar tail is consistent with the seaward movement of the large sand bar.
Besides the estuary planform, sediment supply is another possible factor controlling the bar development. The Qiantang River Estuary is one of the sinks of the Changjiang River sediment. In recent years, sediment load of the Changjiang River has been decreasing sharply from more than 4.5×10⁸ t/a to less than 1.5×10⁸ t/a, especially since the construction of the Three Gorges Dam in 2003 (Gao and Wang, 2008; Yang et al., 2011; Milliman and Farnsworth, 2011; Dai and Liu, 2013). As a result, the accretion rate of the mouth bars in the Changjiang River Estuary has been slowed down and even changed to erosion (Yang et al., 2011; Dai et al., 2016; Zhang et al., 2020). However, due to compensation by the eroding muddy area of the outer Changjiang River Estuary and Hangzhou Bay, the influence of the sediment decrease from the Changjiang River Estuary on the sediment supply to the Qiantang River Estuary is insignificant (Dai et al., 2014; Xie et al., 2017b). It can be concluded that the morphological adjustment of the large sand bar in the Qiantang River Estuary in the last six decades is mainly related to the LRNP.
5.2
Timescales of the sand bar evolution
Based on the results from this study, three timescales of the sand bar evolution can be distinguished. The first two timescales are related to the seasonal and interannual variations of the river discharge and the third is in the order of decades and related to the LRNP. In the seasonal and interannual cycles, the alternation of the high and low discharges causes extremely fast morphological changes in the sand bar area (Figs 4 and 5). During high discharge period, bed erosion and accumulation occur in the upper and lower reaches, respectively, and vice versa during the low discharge period. Meanwhile, the estuarine reach of the Qiantang River Estuary is characterized by the world-famous tidal bore. The tidal bore generally moves at a speed of 20–30 km/h, and the flow velocity can be up to 6 m/s (Pan et al., 2007; Pan and Huang, 2010; Xie and Pan, 2013). The extremely strong currents can induce strong sediment resuspension and transport (Han et al., 2003; Pan and Huang, 2010; Fan et al., 2014). Usually the strongest tidal bore occurs around Yanguan and gradually weakens landwards. Under normal discharge condition, the cumulative sediment transport through the Yanguan Transect in a spring-neap tidal cycle can be 20×106 t. The high sediment transport capacity of the bore promotes the rapid recovery of bed, which explained the fast morphological changes (Xie et al., 2018).
Although reclamations can be implemented concurrently, the morphological responses of estuaries have often been observed to be slow (Wang et al., 2015). Moreover, the timescale of estuarine morphodynamics is related to the spatial scale of the estuary geometry (De Vriend et al., 1993; Wang et al., 2002). The impact of coastline change on the sand bar development is long-term. With the gradual implementation of the LRNP, the large sand bar shows a seaward movement trend. The timescale for the upper reach to reach its new equilibrium state is relatively short, being around 20 years (Figs 6 and 8). Currently the morphological adjustment in the lower reach still continues. A longer time is needed to reach its new equilibrium state due to the larger width and depth.
5.3
Practical implications
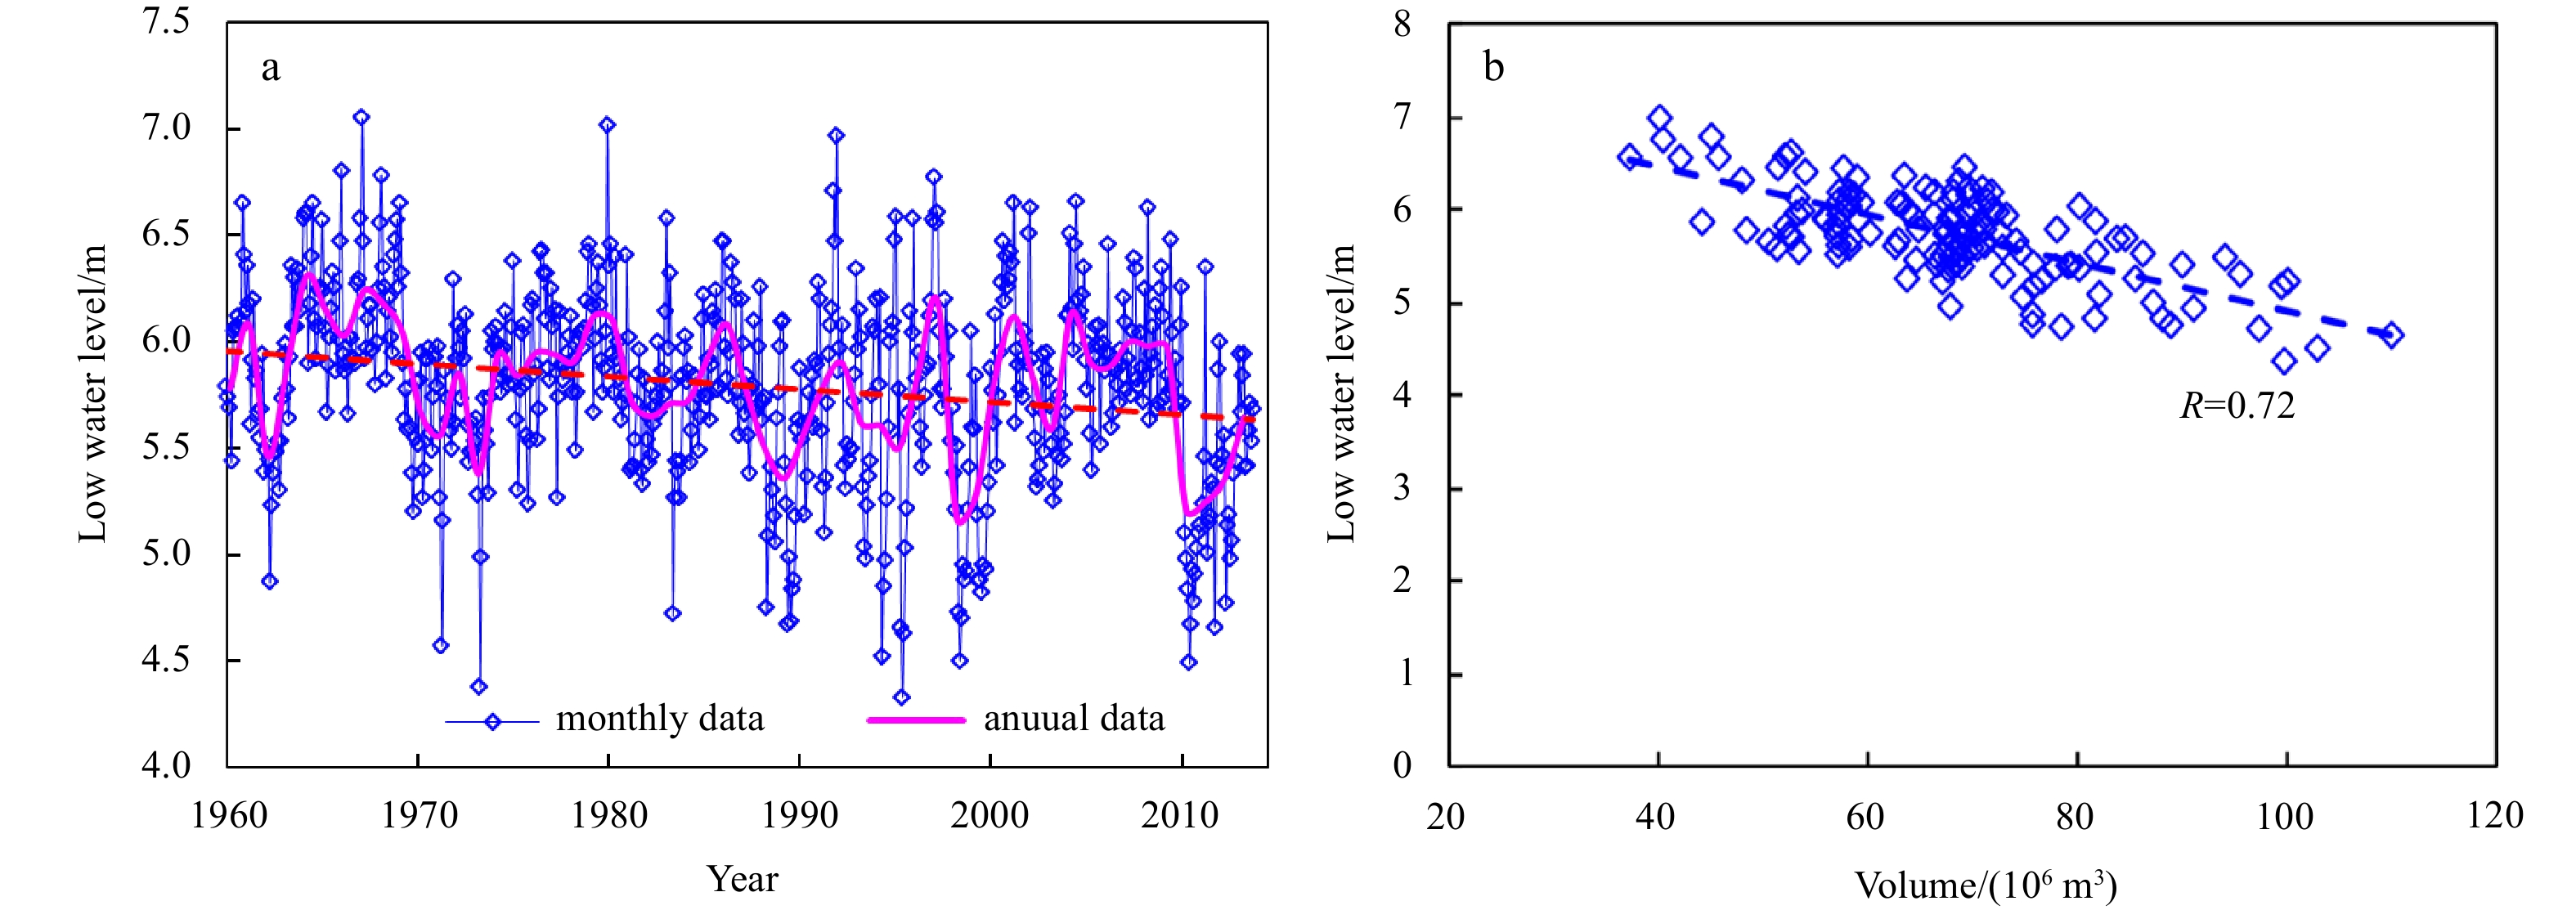
The Qiantang River Estuary is surrounded by one of the most developed area of China. Morphological evolution of the large sand bar has multifaceted social and economic implications. Several studies have attempted to analyze the influences of the LRNP on hydrographical characteristics of the estuary. High water levels along the estuary have risen by 0.43–0.49 m due to the reflection of banks on the tidal wave, increasing the risks of flood due to storm surge (Lu et al., 2008; You et al., 2010). The LRNP can also decrease the influence of tidal flow and the intensity of saltwater intrusion (Shi et al., 2015). Results in this study indicate that profound morphological adjustments have occurred in the last decades. The seaward movement of the large sand bar has enlarged the volume in the upper reach (Fig. 8a) and subsequently lowered the local low water level. For instance, the monthly low water level at Zhakou in last six decades has shown a lowering trend since the 1960s, in addition to the seasonal and interannual fluctuations (Fig. 11a). The low water level correlates well with the volume of the Zhakou−Qibao reach (Fig. 11b). The erosion in the upper reach can also lower the high water levels during river flood events, relieving the increasing pressure of flood defense caused by the LRNP to a certain extent.
Figure
11.
Time series of the monthly low water level at Zhakou (a), and relationship between monthly low water levels and the volume over the Zhakou−Qibao reach (b).
The Qiantang Bore is an important tourist spot of China, attracting numerous bore watchers from ancient times on. Besides the funnel-shaped planform of the estuary which concentrates the tidal energy, the large sand bar is another necessary condition for the bore formation (Han et al., 2003; Pan et al., 2007; Lin, 2008). In turn, with the seaward movement of the sand bar, the tidal bore formation and propagation has been changed correspondingly. In 1980s, the formation place of the Qiantang Bore is about 12 km downstream of Caoe where the bore used to be undular bore (Lin, 2008). In recent years, it has been frequently observed that the bore height there can be up to 1 m. Other possible influences of the sand bar movement include those on saltwater intrusion, formation of the maximum turbidity zone, etc. Almost all of these aspects involving tidal dynamics in the estuarine reach of the estuary depend to a large extent upon the large sand bar evolution.
6.
Conclusions
In this study, short-term and long-term morphological behavior of the large sand bar in the Qiantang River Estuary has been investigated, based on a big dataset of the bathymetry since the 1960s. The results show that three timescales, namely seasonal, interannual and decadal timescales, can be distinguished for the sand bar evolution. The first two are related to the variations of river discharge and the third is related to the LRNP. During high discharge seasons or years, erosion takes place at the upper reach of the sand bar and sedimentation at the lower reach. The bar apex shifts seaward consequently. The opposite development takes place during low discharge seasons or years. Due to the implementation of the LRNP, the upper reach has experienced apparent erosion and currently a new morphological equilibrium has been reached; whereas the lower reach has been accumulated seriously and the accumulation still continues. The bar apex location and elevation correlate with the river discharge, although the correlations in different stages of the LRNP are different. The bar apex has shifted seaward by about 12 km and its elevation has lowered by about 1 m since the 1960s. Both of the front and adverse slopes of the sand bar have been decrease. The seaward movement of the sand bar is caused by the increase of the relative strength of river discharge to tidal prism. Due to the overwhelming scale of the large sand bar, its movement has significant feedback on the hydrographic conditions along the estuary.
Carter B, Carter R W G, Woodroffe C D. 1994. Coastal Evolution: Late Quaternary Shoreline Morphodynamics. Cambridge, UK: Cambridge University Press
[2]
Chen Senmei, Han Zengcui, Hu Guojian. 2006. Impact of human activities on the river reach in the Qiantang Estuary. Journal of Sediment Research, (4): 61–67
[3]
Chen Jiyu, Liu Cangzi, Zhang Chongle, et al. 1990. Geomorphological development and sedimentation in Qiantang Estuary and Hangzhou Bay. Journal of Coastal Research, 6(3): 559–572
[4]
Chien N, Sie H S, Chow C T, et al. 1964. The fluvial processes of the big sand bar inside the Chien Tang Chiang Estuary. Acta Geographica Sinica, 30(2): 124–142
[5]
Dai Zhijun, Fagherazzi S, Mei Xuefei, et al. 2016. Linking the infilling of the North Branch in the Changjiang (Yangtze) Estuary to anthropogenic activities from 1958 to 2013. Marine Geology, 379: 1–12. doi: 10.1016/j.margeo.2016.05.006
[6]
Dai Zhijun, Liu J T. 2013. Impacts of large dams on downstream fluvial sedimentation: an example of the Three Gorges Dam (TGD) on the Changjiang (Yangtze River). Journal of Hydrology, 480: 10–18. doi: 10.1016/j.jhydrol.2012.12.003
[7]
Dai Zhijun, Liu J T, Xie Hualiang, et al. 2014. Sedimentation in the outer Hangzhou Bay, China: the influence of Changjiang sediment load. Journal of Coastal Research, 30(6): 1218–1225. doi: 10.2112/JCOASTRES-D-12-00164.1
[8]
De Vriend H J, Capobianco M, Chesher T, et al. 1993. Approaches to long-term modelling of coastal morphology: a review. Coastal Engineering, 21(1–3): 225–269,
[9]
Dyer K R. 1997. Estuaries: A Physical Introduction. 2nd ed. Chichester, UK: Wiley
[10]
Fan Daidu, Shang Shuai, Cai Guofu, et al. 2015. Distinction and grain-size characteristics of intertidal heterolithic deposits in the middle Qiantang Estuary (East China Sea). Geo-Marine Letters, 35(3): 161–174. doi: 10.1007/s00367-015-0398-2
[11]
Fan Daidu, Tu Junbiao, Shang Shuai, et al. 2014. Characteristics of tidal-bore deposits and facies associations in the Qiantang Estuary, China. Marine Geology, 348: 1–14. doi: 10.1016/j.margeo.2013.11.012
[12]
Gao Shu. 2006. Catchment-coast interactions of the Asian region: APN recent research topics. Advances in Earth Science, 21(7): 680–686
[13]
Gao Shu. 2013. Holocene shelf-coastal sedimentary systems associated with the Changjiang River: an overview. Acta Oceanologica Sinica, 32(12): 4–12. doi: 10.1007/s13131-013-0390-5
[14]
Gao Shu, Collins M B. 2014. Holocene sedimentary systems on continental shelves. Marine Geology, 352: 268–294. doi: 10.1016/j.margeo.2014.03.021
[15]
Gao Shu, Wang Yaping. 2008. Changes in material fluxes from the Changjiang River and their implications on the adjoining continental shelf ecosystem. Continental Shelf Research, 28(12): 1490–1500. doi: 10.1016/j.csr.2007.02.010
[16]
Han Zengcui, Dai Zeheng, Li Guangbing, et al. 2003. Regulation and Exploitation of Qiantang Estuary. Beijing: China Water Power Press, 554
[17]
He Yufang, Cheng Heqin, Chen Jiyu. 2011. Morphological evolution of mouth bars of the Yangtze Estuarine Waterways in the last 100 years. Acta Geographica Sinica, 66(3): 305–312
[18]
Hibma A, Stive M J F, Wang Z B. 2004. Estuarine morphodynamics. Coastal Engineering, 51(8–9): 765–778,
[19]
Li Guangbing, Dai Zeheng. 1986. Fluvial processes and reclamation of the Qiantang Estuary. International Journal of Sediment Research, 1(1): 56–66
[20]
Lin Bingyao. 2008. Characters of Qiantang Bore. Beijing: China Ocean Press, 212
[21]
Lin Chunming, Zhuo Hongchun, Gao Shu. 2005. Sedimentary facies and evolution in the Qiantang River incised valley, eastern China. Marine Geology, 219(4): 235–259. doi: 10.1016/j.margeo.2005.06.009
[22]
Liu Guangsheng, Wu Xiuguang. 2015. Study on dynamics geomorphology evolution of Huibieyang zone in recent ten years. Journal of Sediment Research, (3): 42–48
[23]
Liu Yifei, Xia Xiaoming, Chen Shenliang, et al. 2017. Morphological evolution of Jinshan Trough in Hangzhou Bay (China) from 1960 to 2011. Estuarine, Coastal and Shelf Science, 198: 367–377,
[24]
Lu Haiyan, Pan Cunhong, Lu Xiangxing, et al. 2008. Numerical simulations of the third Haining reclamation project effect on the tidal bore in the Qiantang River. Chinese Journal of Hydrodynamics, 23(5): 484–491
[25]
Luan Hualong, Ding Pingxing, Wang Zhengbing, et al. 2016. Decadal morphological evolution of the Yangtze Estuary in response to river input changes and estuarine engineering projects. Geomorphology, 265: 12–23. doi: 10.1016/j.geomorph.2016.04.022
[26]
Milliman J D, Farnsworth K L. 2011. River Discharge to the Coastal Ocean: A Global Synthesis. Cambridge, UK: Cambridge University Press
[27]
Pan Cunhong, Han Zengcui. 2017. Research on Conservation and Regulation of Qiantang Estuary. Beijing: China Water Power Press, 416
[28]
Pan Cunhong, Huang Wenrui. 2010. Numerical modeling of suspended sediment transport affected by tidal bore in Qiantang Estuary. Journal of Coastal Research, 26(6): 1123–1132. doi: 10.2112/JCOASTRES-D-09-00024.1
[29]
Pan Cunhong, Lin Bingyao, Mao Xianzhong. 2007. Case study: numerical modeling of the tidal bore on the Qiantang River, China. Journal of Hydraulic Engineering, 133(2): 130–138. doi: 10.1061/(ASCE)0733-9429(2007)133:2(130
[30]
Pan Cunhong, Shi Yingbiao, You Aiju. 2010. Regulation of Qiantang Estuary and its health. China Water, (14): 13–15, 29
[31]
Pye K, Blott S J. 2014. The geomorphology of UK estuaries: the role of geological controls, antecedent conditions and human activities. Estuarine, Coastal and Shelf Science, 150: 196–214,
[32]
Shi Yingbiao, Li Ruohua, Yao Kaihua. 2015. 1-D movable bed numerical forecast model of salinity of the Qiantang River estuarine reach and its application (in Chinese). Advances in Water Science, 26(2): 212–220
[33]
Su Jilan, Wang Kangshan. 1989. Changjiang River plume and suspended sediment transport in Hangzhou Bay. Continental Shelf Research, 9(1): 93–111. doi: 10.1016/0278-4343(89)90085-X
[34]
Trenhaile A S. 1997. Coastal Dynamics and Landforms. Oxford, UK: Clarendon Press
[35]
van der Spek A J F. 1997. Tidal asymmetry and long-term evolution of Holocene tidal basins in The Netherlands: simulation of palaeo-tides in the Schelde estuary. Marine Geology, 141(1–4): 71–90,
[36]
Wang Zhengbing, Jeuken M C J L, Gerritsen H, et al. 2002. Morphology and asymmetry of the vertical tide in the Westerschelde estuary. Continental Shelf Research, 22(17): 2599–2609. doi: 10.1016/S0278-4343(02)00134-6
[37]
Wang Zhengbing, Van Maren D S, Ding Pingxing, et al. 2015. Human impacts on morphodynamic thresholds in estuarine systems. Continental Shelf Research, 111: 174–183. doi: 10.1016/j.csr.2015.08.009
[38]
Wang Aijun, Ye Xiang, Lin Zhenkun, et al. 2020. Response of sedimentation processes in the Minjiang River subaqueous delta to anthropogenic activities in the river basin. Estuarine, Coastal and Shelf Science, 232: 106484,
[39]
Xie Dongfeng, Gao Shu, Pan Cunhong. 2010. Process-based modeling of morphodynamics of a tidal inlet system. Acta Oceanologica Sinica, 29(6): 51–61. doi: 10.1007/s13131-010-0076-1
[40]
Xie Dongfeng, Gao Shu, Wang Zhengbing, et al. 2017a. Morphodynamic modeling of a large inside sandbar and its dextral morphology in a convergent estuary: Qiantang Estuary, China. Journal of Geophysical Research: Earth Surface, 122(8): 1553–1572. doi: 10.1002/2017JF004293
[41]
Xie Dongfeng, Pan Cunhong. 2013. A preliminary study of the turbulence features of the tidal bore in the Qiantang River, China. Journal of Hydrodynamics, 25(6): 903–911. doi: 10.1016/S1001-6058(13)60439-4
[42]
Xie Dongfeng, Pan Cunhong, Gao Shu, et al. 2018. Morphodynamics of the Qiantang Estuary, China: controls of river flood events and tidal bores. Marine Geology, 406: 27–33. doi: 10.1016/j.margeo.2018.09.003
[43]
Xie Dongfeng, Pan Cunhong, Wu Xiuguang, et al. 2017b. Local human activities overwhelm decreased sediment supply from the Changjiang River: continued rapid accumulation in the Hangzhou Bay-Qiantang Estuary system. Marine Geology, 392: 66–77. doi: 10.1016/j.margeo.2017.08.013
[44]
Xue Hongchao. 1995. Deposition character of Changjiang Estuary in the past 100 years. In: 17th Symposium on Coastal Engineering. Beijing: Chinese Ocean Engineering Society Harbour Engineer Committee
[45]
Yang Shilun, Milliman J D, Li Peng, et al. 2011. 50, 000 dams later: erosion of the Yangtze River and its delta. Global and Planetary Change, 75(1–2): 14–20,
[46]
You Aiju, Han Zengcui, He Ruoying. 2010. Characteristics and effecting factors of the tidal level in the Qiantangjiang River Estuary under changing environment. Journal of Marine Sciences, 28(1): 18–25
[47]
Yu Qian, Wang Yunwei, Gao Shu, et al. 2012. Modeling the formation of a sand bar within a large funnel-shaped, tide-dominated estuary: Qiantangjiang Estuary, China. Marine Geology, 299–302: 63–76,
[48]
Zeng Jian, Sun Zhilin, Pan Cunhong, et al. 2010. Long-periodic feature of runoff and its effect on riverbed in Qiantang Estuary. Journal of Zhejiang University: Engineering Science (in Chinese), 44(8): 1584–1588
[49]
Zhang Xiaodong, Fan Daidu, Yang Zuosheng, et al. 2020. Sustained growth of river-mouth bars in the vulnerable Changjiang Delta. Journal of Hydrology, 590: 125450. doi: 10.1016/j.jhydrol.2020.125450
[50]
Zhang Xia, Lin Chunming, Dalrymple R W, et al. 2014. Facies architecture and depositional model of a macrotidal incised-valley succession (Qiantang River Estuary, eastern China), and differences from other macrotidal systems. Geological Society of America Bulletin, 126(3–4): 499–522,
Zheng Rong, Hu Chunhong, Sun Zhilin, et al. Numerical investigation for the influence of suspended sediment on salinity distribution in the Qiantang Estuary, China. Frontiers in Marine Science, 2024, 11 doi:10.3389/fmars.2024.1445776
2.
Wei Li, Yiming Zhang, Peng Hu, et al. Evolutions of hydrodynamics and sediment transport pattern in the Qiantang Estuary (China) in response to multidecadal embankment constructions. Estuarine, Coastal and Shelf Science, 2024, 309: 108965. doi:10.1016/j.ecss.2024.108965
3.
Wang Qiushun, Pan Cunhong, Chen Fuyuan. Study on the Tidal Bore Energy along the Qiantang River Estuary, China. Water Resources, 2024, 51(1): 27. doi:10.1134/S0097807823601188
4.
Dongzi Pan, Ying Li. Long-Term Impacts of Runoff and Coastal Reclamation on Tidal Bore Variations in the Qiantang River Estuary, China. Journal of Marine Science and Engineering, 2024, 12(11): 1983. doi:10.3390/jmse12111983
5.
Chaonan Guo, Chengjun Sun, Guipeng Yang, et al. Vertical variations of dissolved carbohydrates in the North Yap Trench. Journal of Oceanology and Limnology, 2020, 38(3): 606. doi:10.1007/s00343-020-9018-8
6.
Shimin Yang, Xiaoshou Liu. Characteristics of phytoplankton assemblages in the southern Yellow Sea, China. Marine Pollution Bulletin, 2018, 135: 562. doi:10.1016/j.marpolbul.2018.07.062
7.
Han Su, Rujun Yang, Aibin Zhang, et al. Characteristics of trace metals and phosphorus in seawaters offshore the Yangtze River. Marine Pollution Bulletin, 2017, 124(2): 1020. doi:10.1016/j.marpolbul.2017.01.022
8.
Mingzhu Fu, Zongling Wang, Xinming Pu, et al. Response of phytoplankton community to nutrient enrichment in the subsurface chlorophyll maximum in Yellow Sea Cold Water Mass. Acta Ecologica Sinica, 2016, 36(1): 39. doi:10.1016/j.chnaes.2015.09.007
9.
Agus Maryono, Alifia Darmayanti, Azmina Syahida Basyarudin, et al. Proceedings of the 3rd International Conference on Smart and Innovative Agriculture (ICoSIA 2022). Advances in Biological Sciences Research, doi:10.2991/978-94-6463-122-7_22
10.
Agus Maryono, Alifia Darmayanti, Pratama Tirza Surya Sembada. Proceedings of the International Conference On Multidisciplinary Studies (ICOMSI 2022). Advances in Social Science, Education and Humanities Research, doi:10.2991/978-2-38476-072-5_25
Junbao Huang, Zhilin Sun, Dongfeng Xie. Morphological evolution of a large sand bar in the Qiantang River Estuary of China since the 1960s[J]. Acta Oceanologica Sinica, 2022, 41(2): 156-165. doi: 10.1007/s13131-021-1817-z
Junbao Huang, Zhilin Sun, Dongfeng Xie. Morphological evolution of a large sand bar in the Qiantang River Estuary of China since the 1960s[J]. Acta Oceanologica Sinica, 2022, 41(2): 156-165. doi: 10.1007/s13131-021-1817-z
Figure 1. Location of the Qiantang River Estuary (a), and the transverse-averaged longitudinal profile of the large bar (b). In the panel a, the dashed box denotes the area of the large bar and the black cross-sections denote those surveyed by ZSIEC. The panel b is after Xie et al. (2017a).
Figure 2. The large-scale river narrowing project of the Qiantang River Estuary since the 1960s.
Figure 3. Annually averaged discharge (a) and month (b) river discharges of the Qiantang River over 1956–2018. The dashed pink line in the panel a denotes the multi-yearly averaged discharge and the dashed blue lines denote the averaged discharge over the alternate wet and dry years.
Figure 4. The seasonal variations of the longitudinal profile of the large bar in 2012 (a), and the comparison of the longitudinal profile of the large bar in April of 2004 and 2012 (b).
Figure 5. Decadal variations of the position and bed elevation of the bar apex.
Figure 6. Bathymetry charts of the estuarine reach in April of 1967, 1976, 1987, 1997, 2010 and 2017.
Figure 7. The longitudinal profiles of the large bar in April of the six years in Fig. 6 (a), and the bed level change between 1967 and 2017 (b).
Figure 8. Relationship between the bar apex location (a), bed elevation (b) and river discharge during the earlier, middle and later stages of the LRNP. The lines denote the fitted functions.
Figure 9. Time series of the volumes under local annually averaged low water level of the upper and lower reaches in April (a), and the relationship of the volume of the upper reach with the river discharge between December and next April during the earlier, middle and later stages of the LRNP (b).
Figure 10. The relationships between tidal prisms at the Ganpu Transect and the corresponding tidal ranges at the Luchaogang gauging station.
Figure 11. Time series of the monthly low water level at Zhakou (a), and relationship between monthly low water levels and the volume over the Zhakou−Qibao reach (b).


 DownLoad:


 DownLoad: