Jing Li, Lin Mu, Linhao Zhong. Frequent central Pacific La Niña events may accelerate Arctic warming since the 1980s[J]. Acta Oceanologica Sinica, 2021, 40(11): 62-69. doi: 10.1007/s13131-021/1843-x
Citation:
Peitao Wang, Zhiyuan Ren, Lining Sun, Jingming Hou, Zongchen Wang, Ye Yuan, Fujiang Yu. Observations and modelling of the travel time delay and leading negative phase of the 16 September 2015 Illapel, Chile tsunami[J]. Acta Oceanologica Sinica, 2021, 40(11): 11-30. doi: 10.1007/s13131-021-1830-2
Key Laboratory of Marine Hazards Forecasting, National Marine Environmental Forecasting Center, Ministry of Natural Resources, Beijing 100081, China
Funds:
The National Key Research and Development Program of China under contract Nos 2018YFC1407000 and 2016YFC1401500; the National Natural Science Foundation of China under contract Nos 41806045 and 51579090.
The systematic discrepancies in both tsunami arrival time and leading negative phase (LNP) were identified for the recent transoceanic tsunami on 16 September 2015 in Illapel, Chile by examining the wave characteristics from the tsunami records at 21 Deep-ocean Assessment and Reporting of Tsunami (DART) sites and 29 coastal tide gauge stations. The results revealed systematic travel time delay of as much as 22 min (approximately 1.7% of the total travel time) relative to the simulated long waves from the 2015 Chilean tsunami. The delay discrepancy was found to increase with travel time. It was difficult to identify the LNP from the near-shore observation system due to the strong background noise, but the initial negative phase feature became more obvious as the tsunami propagated away from the source area in the deep ocean. We determined that the LNP for the Chilean tsunami had an average duration of 33 min, which was close to the dominant period of the tsunami source. Most of the amplitude ratios to the first elevation phase were approximately 40%, with the largest equivalent to the first positive phase amplitude. We performed numerical analyses by applying the corrected long wave model, which accounted for the effects of seawater density stratification due to compressibility, self-attraction and loading (SAL) of the earth, and wave dispersion compared with observed tsunami waveforms. We attempted to accurately calculate the arrival time and LNP, and to understand how much of a role the physical mechanism played in the discrepancies for the moderate transoceanic tsunami event. The mainly focus of the study is to quantitatively evaluate the contribution of each secondary physical effect to the systematic discrepancies using the corrected shallow water model. Taking all of these effects into consideration, our results demonstrated good agreement between the observed and simulated waveforms. We can conclude that the corrected shallow water model can reduce the tsunami propagation speed and reproduce the LNP, which is observed for tsunamis that have propagated over long distances frequently. The travel time delay between the observed and corrected simulated waveforms is reduced to <8 min and the amplitude discrepancy between them was also markedly diminished. The incorporated effects amounted to approximately 78% of the travel time delay correction, with seawater density stratification, SAL, and Boussinesq dispersion contributing approximately 39%, 21%, and 18%, respectively. The simulated results showed that the elastic loading and Boussinesq dispersion not only affected travel time but also changed the simulated waveforms for this event. In contrast, the seawater stratification only reduced the tsunami speed, whereas the earth’s elasticity loading was responsible for LNP due to the depression of the seafloor surrounding additional tsunami loading at far-field stations. This study revealed that the traditional shallow water model has inherent defects in estimating tsunami arrival, and the leading negative phase of a tsunami is a typical recognizable feature of a moderately strong transoceanic tsunami. These results also support previous theory and can help to explain the observed discrepancies.
Considering these positive feedbacks, the Arctic warming or cooling can be triggered by the circulation disturbance, which can be originated from the tropical forcing through atmospheric teleconnections, particular the forcing from the El Niño and Southern Oscillation (ENSO) (Neelin et al., 1998; Lee, 2012; Hu et al., 2016; Timmermann et al., 2018). As a dominant source of global interannual climate variability, ENSO can induce interannual fluctuations in Arctic climate (Bjerknes, 1969; Wyrtki, 1975; Schopf and Suarez, 1988; Jin, 1997). ENSO-associated tropical sea surface temperature anomalies (SSTAs) and latent heat fluxes can excite poleward-propagating atmospheric Rossby waves, then regulate the Arctic climate (Hoskins and Karoly, 1981; Sardeshmukh and Hoskins, 1988; Lee and Yoo, 2014). Previous studies have reported that the El Niño usually coincides with anomalous cooling over the East Siberian Sea, while La Niña often coincides with anomalous warming of the Kara Sea during boreal winter (Lee, 2012).
However, considering the changes in ENSO diversity, these linkages between ENSO and Arctic climate are not stable. In particular, the so-called central Pacific (CP) El Niño events have prevailed since the 1980s, which stimulates a lot of research to be devoted to the changes and impacts of the ENSO diversity (Larkin and Harrison, 2005; Ashok et al., 2007; Zhang et al., 2015, 2019). At present, few studies focus on the relationship between ENSO and Arctic climate from the perspective of ENSO diversity. Recently, two studies have investigated the different impacts of the CP and eastern Pacific (EP) events on the Arctic climate during boreal summer and boreal winter. Hu et al. (2016) indicated that compared to the EP El Niño, the CP El Niño events have an opposite effect on the Arctic, which can inhibit the Arctic warming and sea-ice melting in summer. Li et al. (2019) investigated the different responses of Arctic surface air temperature to EP and CP ENSO types during boreal winter, and they found the EP ENSO events are accompanied by SAT responses over the Barents-Kara seas in February, while the CP events coincide with significant responses over the northeastern Canada and Greenland. And they also concluded that these impacts are largely of opposite sign for ENSO warm and cold phases.
The ENSO flavors are usually monitored by the sea surface temperature anomaly (SSTA) spatial patterns. Our previous studies have indicated that more than only CP and EP ENSO events, ten SSTA spatial patterns are obtained by a novel method, which combines the empirical orthogonal function (EOF) analysis and K-means clustering algorithm (Li et al., 2021). The changes of the warm and cold ENSO events are asymmetrical. And the changes in La Niña seems more distinct. Hence a question arises: Are there any changes of the impacts from the changing La Niña flavors?
To address the question, we identify the ENSO types based on our previous result. Section 2 provides the introduction of the datasets and methods. The changes in ENSO diversity are described in Section 3. The impacts of different La Niña events on the Arctic climate and the underlying mechanisms are investigated in Section 4. Finally, conclusions and discussions are highlighted.
2.
Data and methods
The present study uses monthly sea surface temperature (SSTs) from the Met Office Hadley Centre's sea ice and sea surface temperature (SST) data set version 1 (HadISST1) with a 1°×1° grid (Rayner, 2003) and the National Oceanic and Atmospheric Administration (NOAA) interpolated outgoing longwave radiation (OLR) dataset (Liebmann and Smith, 1996). The OLR available since 1979 represents tropical convection. The atmospheric components are taken from the National Centers for Environmental Prediction/National Center for Atmospheric Research (NCEP/NCAR) reanalysis products (Kalnay et al., 1996). These variables are available from 1948 to the present, with a 2.5°×2.5° horizontal resolution. In addition, a simple dry model named the linear baroclinic model (LBM) was used in our present study to examine the influence of the SSTAs-related convection on the Arctic climate. The LBM employed in this study is a time-dependent model based on primitive equations. The model had a resolution of T42 in the horizontal direction and 20 sigma levels in the vertical direction. More details can be found in Watanabe and Jin (2003).
3.
Changes in ENSO diversity
The ENSO diversity is made up of a rich variety of SSTA patterns among ENSO events. The recent accumulated CP El Niño events have been regarded as a possible harbinger of changes in ENSO due to global warming (Yeh et al., 2009). With the widespread attention to the different ENSO types, several methods have been proposed to identify the SSTA patterns. Besides the CP and EP ENSO events, much more ENSO types are identified via the details of the SSTAs spatial distribution (Ashok et al., 2012; Cai et al., 2014, 2015; Capotondi et al., 2015).
Inspired by these studies, we have proposed a novel method combining the EOF analysis and the K-means clustering method to identify the tropical SSTA flavors. The SSTA fields of all months are reasonably grouped into 10 categories (Li et al., 2021), and the cluster result can be found in Fig. S1. Since the ENSO events usually peak during the boreal winter, we combine the SSTA fields of each category during December, January, and February to illustrate the changes in ENSO diversity.
The composited SSTA spatial patterns during boreal winter are nearly consistent with our previous work (Li et al., 2021). Among the ten categories, three La Niña-like SSTA patterns (cluster 4, cluster 6, and cluster 7) and three El Niño-like patterns (cluster 2, cluster 5, and cluster 9) are contained (Fig. 1). Our current study is mainly focused on these three La Niña type events. Cluster 4 shows a basin-wide cooling spatial pattern, cluster 6 represents the canonical La Niña, and cluster 7 exhibits a typical central Pacific La Niña event. The last two types of La Niña events have a cooling center near the dateline, and the extreme La Niña events usually belong to cluster 6.
Figure
1.
Composited sea surface temperature anomaly (SSTA) spatial distribution for ten clusters in boreal winter month (December, January and February) during 1950−2016, where the dots indicate 95% significance.
Then to depict the changes of the ENSO diversity clearly, the occurrence frequency differences for different ENSO events are compared before and after 1980 (Fig. 2). Before 1980, the basin-wide cooling event (cluster 4) acts as the dominant cold event with the highest frequency. After 1980, the frequency for this dominant cold event has dropped to a low level. In contrast, the frequencies for the other two kinds of La Niña events with central Pacific cooling have increased, which also supports the westward air-sea interaction center under global warming. Therefore, we will check the different impacts on Arctic climate due to the La Niña type changing.
Figure
2.
The percentage of occurrence frequency (months) of ten clusters respectively in winter (December, January, and February) during 1950−1979 (blue bars) and 1980−2016 (red bars).
4.
Opposite impacts of different La Niña events on Arctic SAT
The ENSO events usually influence the interannual Arctic climate via the poleward-propagating atmospheric Rossby waves (Lee and Yoo, 2014). Therefore, the La Niña-related atmospheric waves are first examined to confirm the physical linkage between ENSO and the Arctic climate.
These three La Niña types all exhibit significant extratropical Rossby wave propagation pathways. The large-scale circulation anomalies (200 hPa geopotential height and wave activity flux) for the three type events are shown in Fig. 3. For the basin-wide cooling events (cluster 4), significant negative height anomalies are evident mainly over the tropics and northern Canada (Fig. 3a). The canonical La Niña events (cluster 6) excite a similar teleconnection pattern (Fig. 3b). Around the Arctic region, significant negative height anomalies extend from the Beaufort Sea to Greenland. In contrast to these two La Niña types, the recent frequent CP La Niña events (cluster 7) triggered positive height anomalies around the Arctic from the Barents-Kara seas to Greenland (Fig. 3c).
Figure
3.
Composited 200 hPa geopotential height anomalies (shading) and the wave activity flux anomalies (black vectors, unit: W/m2) for the events of cluster 4 (a), cluster 6 (b) and cluster 7 (c), respectively, and the dots indicate 95% significance.
Consistent with the opposite anomalous geophysical height anomalies over the Arctic, the low-level temperature anomalies for the recent frequent CP La Niña events (cluster 7) are also opposed to those of the canonical and basin-wide cooling La Niña events (Fig. 4). Both the canonical La Niña events and the basin-wide cooling La Niña events seem to induce anomalous cooling from the Beaufort Sea to Greenland (Figs 4a and b), while the CP La Niña events seem to induce anomalous warming over northern Canada and southern Greenland (Fig. 4c). Since the areas from the Beaufort Sea to Greenland are the key regions for Arctic warming (e.g., Screen and Simmonds, 2010), it seems that in contrast to previous La Niña events, the recent frequent CP cold ENSO events may warm northern Canada and Greenland accelerating Arctic warming.
Figure
4.
Composited temperature anomalies at 925 hPa for the events of cluster 4 (a), cluster 6 (b) and cluster 7 (c), respectively, and the dots indicate 95% significance.
The canonical La Niña-related atmospheric teleconnections are nearly consistent with those of the basin-wide cooling events, and the canonical La Niña events also occur frequently since the 1980s. Considering the limitation of the OLR dataset, the canonical La Niña events and the frequent CP La Niña events are compared to illustrate the changes for the impacts on Arctic climate. Since the tropical ENSO-related convections act as the energy source driving the atmospheric circulation, the changes in these La Niña-related SSTA spatial patterns may change the convection distribution over the tropical Pacific basin, then can trigger different atmospheric teleconnections inducing different Arctic responses.
The convection distributions and the low-level circulation for the canonical La Niña events and the CP La Niña events are compared in Fig. 5. A dipole convection pattern in the tropics and strengthened Walker Circulation can be found in both La Niña events, with enhanced convection over the western Pacific and suppressed convection over the eastern Pacific. The enhanced convection distributions over the western Pacific show significant differences for these two La Niña types. The enhanced convections for the canonical La Niña events over the western Pacific are nearly symmetrical about the equator (Fig. 5a), however, the CP La Niña-related enhanced convections are over the north of the equator (Fig. 5b). A typical Matsuno-Gill response can be found for the canonical La Niña events (Fig. 5a), and the related teleconnections to the extratropics are triggered by the enhanced tropical convection, inducing large-scale subsidence within an anticyclone over the northeast Pacific near the Aleutian Islands with positive 850 hPa height anomalies (Fig. 5c). Within the subtropical anticyclones, anomalous upper tropospheric convergence is the most important source of Rossby wave forcing and these waves can eventually propagate to the mid-latitudes and high latitudes (Brands, 2017). On the other hand, the northward enhanced deep convections for the CP La Niña events over the western Pacific induce a basin-wide anticyclone over the North Pacific, which tilts from southwest to northeast (Fig. 5b). The anticyclone related positive 850 hPa height anomalies even extends to Greenland with a negative center over the northeast Asia. In contrast to the induced cooling around the north of Canada by the canonical La Niña events (Fig. 4b), significant warming extends from the Beaufort Sea to Greenland for the frequent CP La Niña events (Fig. 4c), which is related with the positive 850 hPa height anomalies (Fig. 5d). Considering the influences of topography, the composition for the height anomalies at 850 hPa is not statistically significant. However, the compositions at the up levels (Fig. 3c) have passed the significance test, indicating a significant equivalent barotropic feature. The positive height anomalies are corresponding to the surface warming as a result of subsidence.
Figure
5.
Composited outgoing longwave radiation (OLR) anomalies (shading; the dots indicate 95% significance) and anomalous wind at 850 hPa (vector) for the events of cluster 6 (a) and cluster 7 (b), respectively; and composited 850 hPa geopotential height anomalies for cluster 6 (c) and cluster 7 (d), respectively.
Based on the above analysis, we speculated that the northward deep convections over the western Pacific may change the impacts on the Arctic, particularly from the Beaufort Sea to Greenland. To confirm our hypothesis, two sensitive numerical experiments by the linear baroclinic model (LBM) are carried. Since the convection mainly drives the atmospheric circulation through the diabatic heating, the different elliptical areas of additional heating are added for the sensitive experiments according to the convection distributions of the ENSO events (Fig. S2). In this study, the sensitive numerical experiment is set up according to the convection distributions for the canonical La Niña events and CP La Niña events, respectively (Fig. 6) by changing the location of the sensible heating center (Fig. S2). Results from the experiments support the effectiveness of the northward convections for the CP La Niña events (Fig. 6b). The heating over the north of the equator induces positive 850 hPa height anomalies over the north of Canada, which is opposite to the results induced by the symmetric heating about the equator. Considering the local positive feedbacks over the Arctic, the canonical La Niña events could trigger the north of Canada cooling, while the CP La Niña events can warm northern Canada and part of Greenland through the meridional movement of the convection center.
Figure
6.
Geopotential height anomalies at 850 hPa resulted from heat forcing sensitive experiments that are set according to Figs 4b and c, respectively.
Considering the great impacts of the Arctic amplification, the Arctic climate has received increasing attention under global warming. Meanwhile, ENSO events exhibit considerable diversity in their frequency, location, intensity, and meridional scale. However, few studies investigate the linkage between ENSO and Arctic climate from the perspective of ENSO diversity. The recent studies have investigated the different impacts on Arctic climate of the CP and EP ENSO events and concluded that these impacts are largely of opposite sign for ENSO warm and cold phases. Following our previous results, the changes for the warm and clod ENSO events show significant asymmetrical features, particularly the La Niña events. Therefore, the impacts on the Arctic climate by the changing La Niña types are investigated.
Compared to the past frequent basin-wide cooling La Niña events, since the 1980s the cooling center for the La Niña event has strengthened and moved westward along with the increasing frequency for the canonical and CP La Niña events. The impacts of the recent frequent CP La Niña events induce significant warming from the Beaufort Sea to Greenland, which is opposite to those of the basin-wide cooling and canonical La Niña events and is in favor of the Arctic warming.
In contrast to the other La Niña types, the deep convection centers for the CP La Niña events are located over the north of the equator instead of nearly symmetrical about the equator. The changes in the meridional movement of the ENSO-related convection center cause variations in atmospheric teleconnections inducing different responses in the Arctic via local positive feedbacks, such as the ice-albedo feedback (Budyko, 1969; Sellers, 1969; Hall, 2004; Ogi and Wallace, 2012; Stroeve et al., 2012), water vapor-cloud cover feedbacks (Francis and Hunter, 2006; Abbot and Tziperman, 2008; Kay et al., 2008; Screen and Simmonds, 2010; Ghatak and Miller, 2013) and the local lapse rate feedback (Pithan and Mauritsen, 2014; Stuecker et al., 2018). The observed Arctic responses are also supported by the numerical experiments. The changes in ENSO diversity are suggested to be regulated by changes in the tropical Pacific mean state under global warming. Our results suggest that besides the direct impacts from the greenhouse gas, the changes in La Niña type may also accelerate the Arctic warming.
Abdolali A, Kadri U, Kirby J T. 2019. Effect of water compressibility, sea-floor elasticity, and field gravitational potential on tsunami phase speed. Scientific Reports, 9(1): 16874. doi: 10.1038/s41598-019-52475-0
[2]
Abdolali A, Kirby J T. 2017. Role of compressibility on tsunami propagation. Journal of Geophysical Research: Oceans, 122(12): 9780–9794. doi: 10.1002/2017JC013054
[3]
Allgeyer S, Cummins P. 2014. Numerical tsunami simulation including elastic loading and seawater density stratification. Geophysical Research Letters, 41(7): 2368–2375. doi: 10.1002/2014GL059348
[4]
An Chao, Liu P L F. 2016. Analytical solutions for estimating tsunami propagation speeds. Coastal Engineering, 117: 44–56. doi: 10.1016/j.coastaleng.2016.07.006
[5]
Aránguiz R, González G, González J, et al. 2016. The 16 September 2015 Chile tsunami from the post-tsunami survey and numerical modeling perspectives. Pure and Applied Geophysics, 173(2): 333–348. doi: 10.1007/s00024-015-1225-4
[6]
Baba T, Allgeyer S, Hossen J, et al. 2017. Accurate numerical simulation of the far-field tsunami caused by the 2011 Tohoku earthquake, including the effects of Boussinesq dispersion, seawater density stratification, elastic loading, and gravitational potential change. Ocean Modelling, 111: 46–54. doi: 10.1016/j.ocemod.2017.01.002
[7]
Baba T, Ando K, Matsuoka D, et al. 2016. Large-scale, high-speed tsunami prediction for the great Nankai Trough earthquake on the K computer. The International Journal of High Performance Computing Applications, 30(1): 71–84. doi: 10.1177/1094342015584090
[8]
Baba T, Cummins P R, Thio H K, et al. 2009. Validation and joint inversion of teleseismic waveforms for earthquake source models using deep ocean bottom pressure records: A case study of the 2006 Kuril megathrust earthquake. Pure and Applied Geophysics, 166(1-2): 55–76. doi: 10.1007/s00024-008-0438-1
[9]
Baba T, Takahashi N, Kaneda Y, et al. 2015. Parallel implementation of dispersive tsunami wave modeling with a nesting algorithm for the 2011 Tohoku tsunami. Pure and Applied Geophysics, 172(12): 3455–3472. doi: 10.1007/s00024-015-1049-2
[10]
Barazangi M, Isacks B L. 1976. Spatial distribution of earthquakes and subduction of the Nazca plate beneath South America. Geology, 4(11): 686–692. doi: 10.1130/0091-7613(1976)4<686:SDOEAS>2.0.CO;2
[11]
Berger M J, George D L, Leveque R J, et al. 2011. The GeoClaw software for depth-averaged flows with adaptive refinement. Advances in Water Resources, 34(9): 1195–1206. doi: 10.1016/j.advwatres.2011.02.016
[12]
Contreras-López M, Winckler, P, Sepúlveda I, et al. 2016. Field survey of the 2015 Chile tsunami with emphasis on coastal wetland and conservation areas. Pure and Applied Geophysics, 173(2): 349–367. doi: 10.1007/s00024-015-1235-2
[13]
DeMets C, Gordon R G, Argus D F, et al. 1994. Effect of recent revisions to the geomagnetic reversal time scale on estimates of current plate motions. Geophysical Research Letters, 21(20): 2191–2194. doi: 10.1029/94GL02118
[14]
Eblé M C, Mungov G T, Rabinovich A B. 2015. On the leading negative phase of major 2010-2014 tsunamis. Pure and Applied Geophysics, 172(12): 3493–3508. doi: 10.1007/s00024-015-1127-5
[15]
Heidarzadeh M, Murotani S, Satake K, et al. 2016. Source model of the 16 September 2015 Illapel, Chile, Mw8.4 earthquake based on teleseismic and tsunami data. Geophysical Research Letters, 43(2): 643–650. doi: 10.1002/2015GL067297
[16]
Heidarzadeh M, Satake K. 2013. Waveform and spectral analyses of the 2011 Japan tsunami records on tide gauge and DART stations across the Pacific Ocean. Pure and Applied Geophysics, 170(6−8): 1275–1293. doi: 10.1007/s00024-012-0558-5
[17]
Heidarzadeh M, Satake K. 2014. The El Salvador and Philippines tsunamis of August 2012: insights from sea level data analysis and numerical modeling. Pure and Applied Geophysics, 171(12): 3437–3455. doi: 10.1007/s00024-014-0790-2
[18]
Heidarzadeh M, Satake K, Murotani S, et al. 2015. Deep-water characteristics of the trans-Pacific tsunami from the 1 April 2014 Mw8.2 Iquique, Chile earthquake. Pure and Applied Geophysics, 172(3−4): 719–730. doi: 10.1007/s00024-014-0983-8
[19]
Heidarzadeh M, Satake K, Takagawa T, et al. 2018. A comparative study of far-field tsunami amplitudes and ocean-wide propagation properties: insight from major trans-Pacific tsunamis of 2010−2015. Geophysical Journal International, 215(1): 22–36. doi: 10.1093/gji/ggy265
[20]
Ho T C, Satake K, Watada S. 2017. Improved phase corrections for transoceanic tsunami data in spatial and temporal source estimation: application to the 2011 Tohoku earthquake. Journal of Geophysical Research: Solid Earth, 122(12): 10155–10175. doi: 10.1002/2017JB015070
[21]
Inazu D, Saito T. 2013. Simulation of distant tsunami propagation with a radial loading deformation effect. Earth Planets Space, 65(8): 835–842. doi: 10.5047/eps.2013.03.010
[22]
Jakeman J D, Nielsen O M, Putten K V, et al. 2010. Towards spatially distributed quantitative assessment of tsunami inundation models. Ocean Dynamics, 60(5): 1115–1138. doi: 10.1007/s10236-010-0312-4
[23]
Ji Chen, Wald D J, Helmberger D V. 2002. Source description of the 1999 hector mine, California, earthquake, part I: wavelet domain inversion theory and resolution analysis. Bulletin of the Seismological Society of America, 92(4): 1192–1207. doi: 10.1785/0120000916
[24]
Kajiura K. 1963. The leading wave of a tsunami. Bulletin of the Earthquake Research Institute, University of Tokyo, 41(3): 535–571
[25]
Kato T, Terada Y, Nishimura H, et al. 2011. Tsunami records due to the 2010 Chile Earthquake observed by GPS buoys established along the Pacific coast of Japan. Earth, Planets and Space, 63(6): e5–e8. doi: 10.5047/eps.2011.05.001
[26]
Kirby J T, Shi Fengyan, Tehranirad B, et al. 2013. Dispersive tsunami waves in the ocean: model equations and sensitivity to dispersion and Coriolis effects. Ocean Modelling, 62: 39–55. doi: 10.1016/j.ocemod.2012.11.009
[27]
Li Bo, Ghosh A. 2016. Imaging rupture process of the 2015 Mw 8.3 Illapel earthquake using the US seismic array. Pure and Applied Geophysics, 173(7): 2245–2255. doi: 10.1007/s00024-016-1323-y
[28]
Lu W F, Jiang Y W, Lin J. 2013. Modeling propagation of 2011 Honshu tsunami. Engineering Applications of Computational Fluid Mechanics, 7(4): 507–518. doi: 10.1080/19942060.2013.11015489
[29]
Okada Y. 1985. Surface deformation due to shear and tensile faults in a half-space. Bulletin of the Seismological Society of America, 75(4): 1135–1154. doi: 10.1785/BSSA0750041135
[30]
Poupardin P, Heinrich P, Hébert H, et al. 2018. Traveltime delay relative to the maximum energy of the wave train for dispersive tsunamis propagating across the Pacific Ocean: the case of 2010 and 2015 Chilean Tsunamis. Geophysical Journal International, 214(3): 1538–1555. doi: 10.1093/gji/ggy200
[31]
Prastowo T, Cholifah L, Madlazim. 2018. Analysis of travel time delay for large tsunamis across the pacific and Indian Oceans. Science of Tsunami Hazards, 37(4): 195–212
[32]
Rabinovich A B, Candella R N, Thomson R E. 2013a. The open ocean energy decay of three recent trans-Pacific tsunamis. Geophysical Research Letters, 40(12): 3157–3162. doi: 10.1002/grl.50625
[33]
Rabinovich A B, Thomson R E. 2007. The 26 December 2004 Sumatra tsunami: analysis of tide gauge data from the World Ocean Part 1. Indian Ocean and South Africa. Pure and Applied Geophysics, 164(2): 261–308. doi: 10.1007/s00024-006-0164-5
[34]
Rabinovich A B, Thomson R E, Fine I V. 2013b. The 2010 Chilean tsunami off the west coast of Canada and the northwest coast of the United States. Pure and Applied Geophysics, 170(9-10): 1529–1565. doi: 10.1007/s00024-012-0541-1
[35]
Rabinovich A B, Titov V V, Moore C W, et al. 2017. The 2004 Sumatra tsunami in the southeastern Pacific Ocean: New global insight from observations and modeling. Journal of Geophysical Research: Oceans, 122(10): 7992–8019. doi: 10.1002/2017JC013078
[36]
Rabinovich A B, Woodworth P L, Titov V V. 2011. Deep-sea observations and modeling of the 2004 Sumatra tsunami in Drake Passage. Geophysical Research Letters, 38(16): L16604. doi: 10.1029/2011GL048305
[37]
Roberts S G, Nielsen O M, Gray D, et al. 2015. ANUGA User Manual, Release 2.0. Symonston: Geoscience Australia, https://www.researchgate.net/publication/318511561_ANUGA_User_Manual_Release_20 [2015-05-19/2020-10-01]
[38]
Roberts S G, Nielsen O M, Jakeman J. 2008. Simulation of tsunami and flash floods. In: Bock H G, Kostina E, Phu H X, et al., eds. Modeling, Simulation and Optimization of Complex Processes. Berlin, Heidelberg: Springer, doi: 10.1007/978-3-540-79409-7_35
[39]
Röbke B R, Vött A. 2017. The tsunami phenomenon. Progress in Oceanography, 159: 296–322. doi: 10.1016/j.pocean.2017.09.003
[40]
Satake K, Heidarzadeh M. 2017. A review of source models of the 2015 Illapel, Chile earthquake and insights from tsunami data. Pure and Applied Geophysics, 174(1): 1–9. doi: 10.1007/s00024-016-1450-5
[41]
Shan Di, Wang Peitao, Ren Zhiyuan, et al. 2017. Application and evaluation of the 16 September 2015 Illapel, Chile Mw8.3 earthquake finite fault rupture model from numerical simulation. Haiyang Xuebao (in Chinese), 39(11): 49–60. doi: 10.3969/j.issn.0253-4193.2017.11.005
[42]
Tang Liujuan, Titov V V, Moore C, et al. 2016. Real-time assessment of the 16 September 2015 Chile tsunami and implications for near-Field forecast. Pure and Applied Geophysics, 173(2): 369–387. doi: 10.1007/s00024-015-1226-3
[43]
Titov V V, Synolakis C E. 1998. Numerical modeling of tidal wave runup. Journal of Waterway, Port, Coastal, and Ocean Engineering, 124(4): 157–171. doi: 10.1061/(ASCE)0733-950X(1998)124:4(157)
[44]
Tsai V C, Ampuero J P, Kanamori H, et al. 2013. Estimating the effect of earth elasticity and variable water density on tsunami speeds. Geophysical Research Letters, 40(3): 492–496. doi: 10.1002/grl.50147
[45]
Vigny C, Rudloff A, Ruegg J C, et al. 2009. Upper plate deformation measured by GPS in the Coquimbo Gap, Chile. Physics of the Earth and Planetary Interiors, 175(1−2): 86–95. doi: 10.1016/j.pepi.2008.02.013
[46]
Wang Dailin. 2015. An ocean depth-correction method for reducing model errors in tsunami travel time: application to the 2010 Chile and 2011 Tohoku tsunamis. Science of Tsunami Hazards, 34(1): 1–22
[47]
Wang Dailin, Becker N C, Walsh D, et al. 2012. Real-time forecasting of the April 11, 2012 Sumatra tsunami. Geophysical Research Letters, 39(19): L19601. doi: 10.1029/2012GL053081
[48]
Wang Xiaoming, Liu P L F. 2011. An explicit finite difference model for simulating weakly nonlinear and weakly dispersive waves over slowly varying water depth. Coastal Engineering, 58(2): 173–183. doi: 10.1016/j.coastaleng.2010.09.008
[49]
Wang Peitao, Yu Fujiang, Yuan Ye, et al. 2016. Effects of finite fault rupture models of submarine earthquakes on numerical forecasting of near-field tsunami. Chinese Journal Of Geophysics (in Chinese), 59(3): 1030–1045. doi: 10.6038/cjg20160324
[50]
Watada S. 2013. Tsunami speed variations in density-stratified compressible global oceans. Geophysical Research Letters, 40(15): 4001–4006. doi: 10.1002/grl.50785
[51]
Watada S, Kusumoto S, Satake K. 2014. Traveltime delay and initial phase reversal of distant tsunamis coupled with the self-gravitating elastic earth. Journal of Geophysical Research: Solid Earth, 119(5): 4287–4310. doi: 10.1002/2013JB010841
[52]
Wei Yong, Bernard E N, Tang Liujuan, et al. 2008. Real-time experimental forecast of the Peruvian tsunami of August 2007 for U.S. Coastlines. Geophysical Research Letters, 35(4): L04609. doi: 10.1029/2007GL032250
[53]
Wessel P, Smith W H F. 1998. New, improved version of generic mapping tools released. Eos, Transactions American Geophysical Union, 79(47): 579. doi: 10.1029/98EO00426
[54]
Yamazaki Y, Cheung K F, Kowalik Z. 2011. Depth-integrated, non-hydrostatic model with grid-nesting for tsunami generation, propagation, and run-up. International Journal for Numerical Methods in Fluids, 67(12): 2081–2107. doi: 10.1002/fld.2485
[55]
Yamazaki Y, Cheung K F, Lay T. 2013. Modeling of the 2011 Tohoku near-field tsunami from finite-fault inversion of seismic waves. Bulletin of the Seismological Society of America, 103(2B): 1444–1455. doi: 10.1785/0120120103
[56]
Ye Lingling, Lay T, Kanamori H, et al. 2016. Rapidly estimated seismic source parameters for the 16 September 2015 Illapel, Chile Mw8.3 earthquake. Pure and Applied Geophysics, 173(2): 321–332. doi: 10.1007/s00024-015-1202-y
[57]
Zaytsev O, Rabinovich A B, Thomson R E. 2016. A comparative analysis of coastal and open-ocean records of the great Chilean tsunamis of 2010, 2014 and 2015 off the coast of Mexico. Pure and Applied Geophysics, 173(12): 4139–4178. doi: 10.1007/s00024-016-1407-8
[58]
Zaytsev O, Rabinovich A B, Thomson R E. 2017. The 2011 Tohoku tsunami on the coast of Mexico: A case study. Pure and Applied Geophysics, 174(8): 2961–2986. doi: 10.1007/s00024-017-1593-z
A E Volvach, L P Kogan, L N Volvach, et al. The effect of topological similarity of magnetic field dependencies before a strong earthquake accompanied by a tsunami. Journal of Earth System Science, 2025, 134(2) doi:10.1007/s12040-025-02529-x
2.
Jian-Guo Li, Peitao Wang. Global tsunami modelling on a spherical multiple-cell grid. Ocean Modelling, 2024, 192: 102461. doi:10.1016/j.ocemod.2024.102461
3.
Peitao Wang, Wei Lu, Yuchen Wang, et al. Multi-scale free oscillations and resonances over the continental shelf of the East China Sea from the 2011 Tohoku-Oki tsunami. Ocean Modelling, 2024, 188: 102304. doi:10.1016/j.ocemod.2023.102304
4.
Shingo Watada. Progress and application of the synthesis of trans-oceanic tsunamis. Progress in Earth and Planetary Science, 2023, 10(1) doi:10.1186/s40645-023-00555-1
5.
Peitao Wang, Lining Sun, Lianda Zhao. An efficient method to improve travel time delays of transoceanic tsunamis based on depth-correction scheme. Ocean Dynamics, 2022, 72(7): 477. doi:10.1007/s10236-022-01514-y
6.
Jingming Hou, Wei Lu, Tingting Fan, et al. Tsunami hazard and mitigation analysis for bathing beaches in China based on numerical simulations. Acta Oceanologica Sinica, 2022, 41(12): 27. doi:10.1007/s13131-022-2027-z
Jing Li, Lin Mu, Linhao Zhong. Frequent central Pacific La Niña events may accelerate Arctic warming since the 1980s[J]. Acta Oceanologica Sinica, 2021, 40(11): 62-69. doi: 10.1007/s13131-021/1843-x
Jing Li, Lin Mu, Linhao Zhong. Frequent central Pacific La Niña events may accelerate Arctic warming since the 1980s[J]. Acta Oceanologica Sinica, 2021, 40(11): 62-69. doi: 10.1007/s13131-021/1843-x
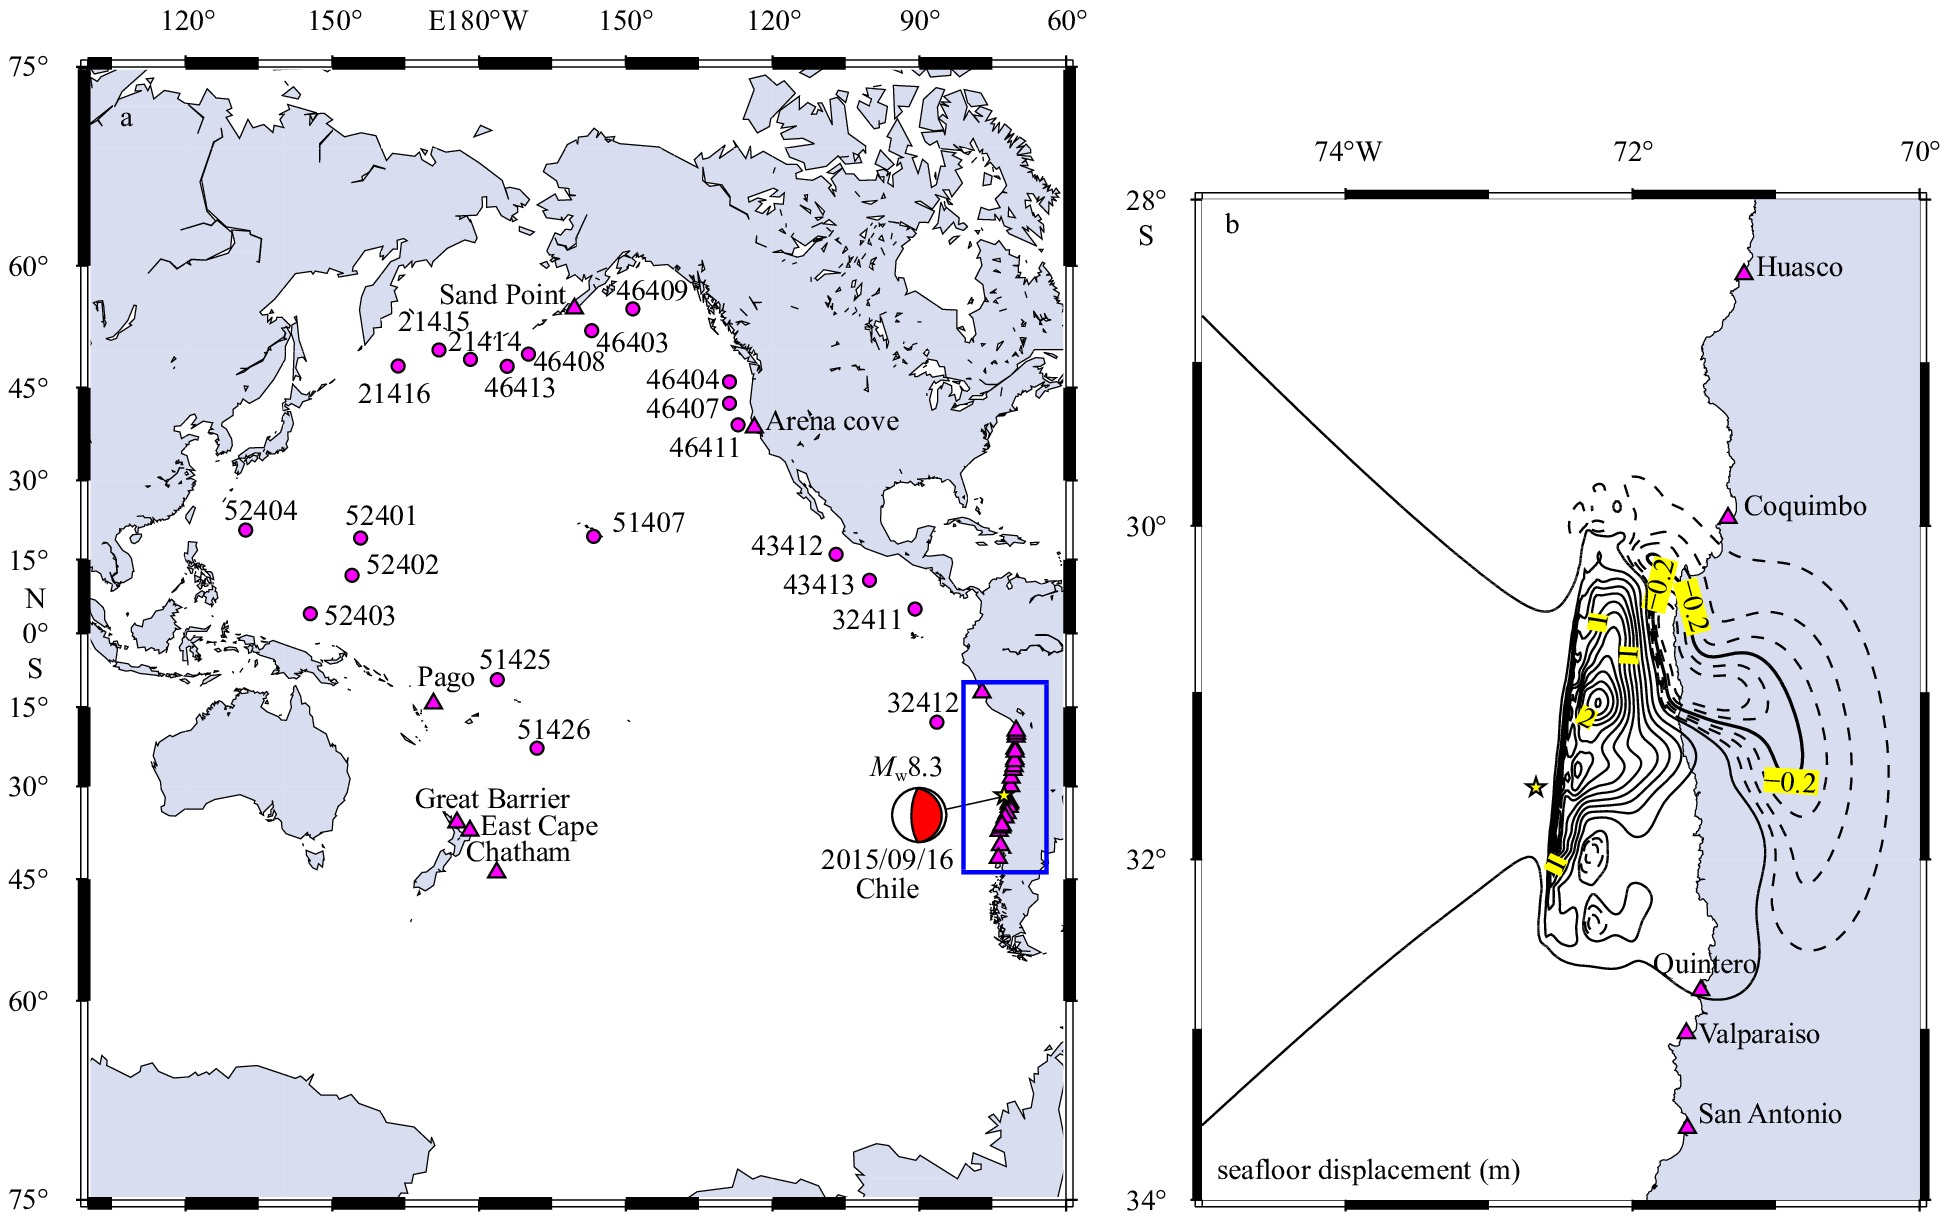
Figure 1. General map of calculation region showing the locations of 50 selected observatories used in this study and the distribution of seafloor vertical deformation generated by the 2015 Mw 8.3 Illapel earthquake. a. Yellow star represents the epicenter. Solid circles and triangles indicate the locations of DART stations and tide gauges respectively. Detailed information of near-field tide gauges in the rectangular box was listed in Table 1. b. The seafloor vertical displacement was based on US Geological Survey finite fault source model. Black solid lines show the uplift contours with 0.2-m intervals while dashed lines show subsidence contours with 0.05-m intervals.
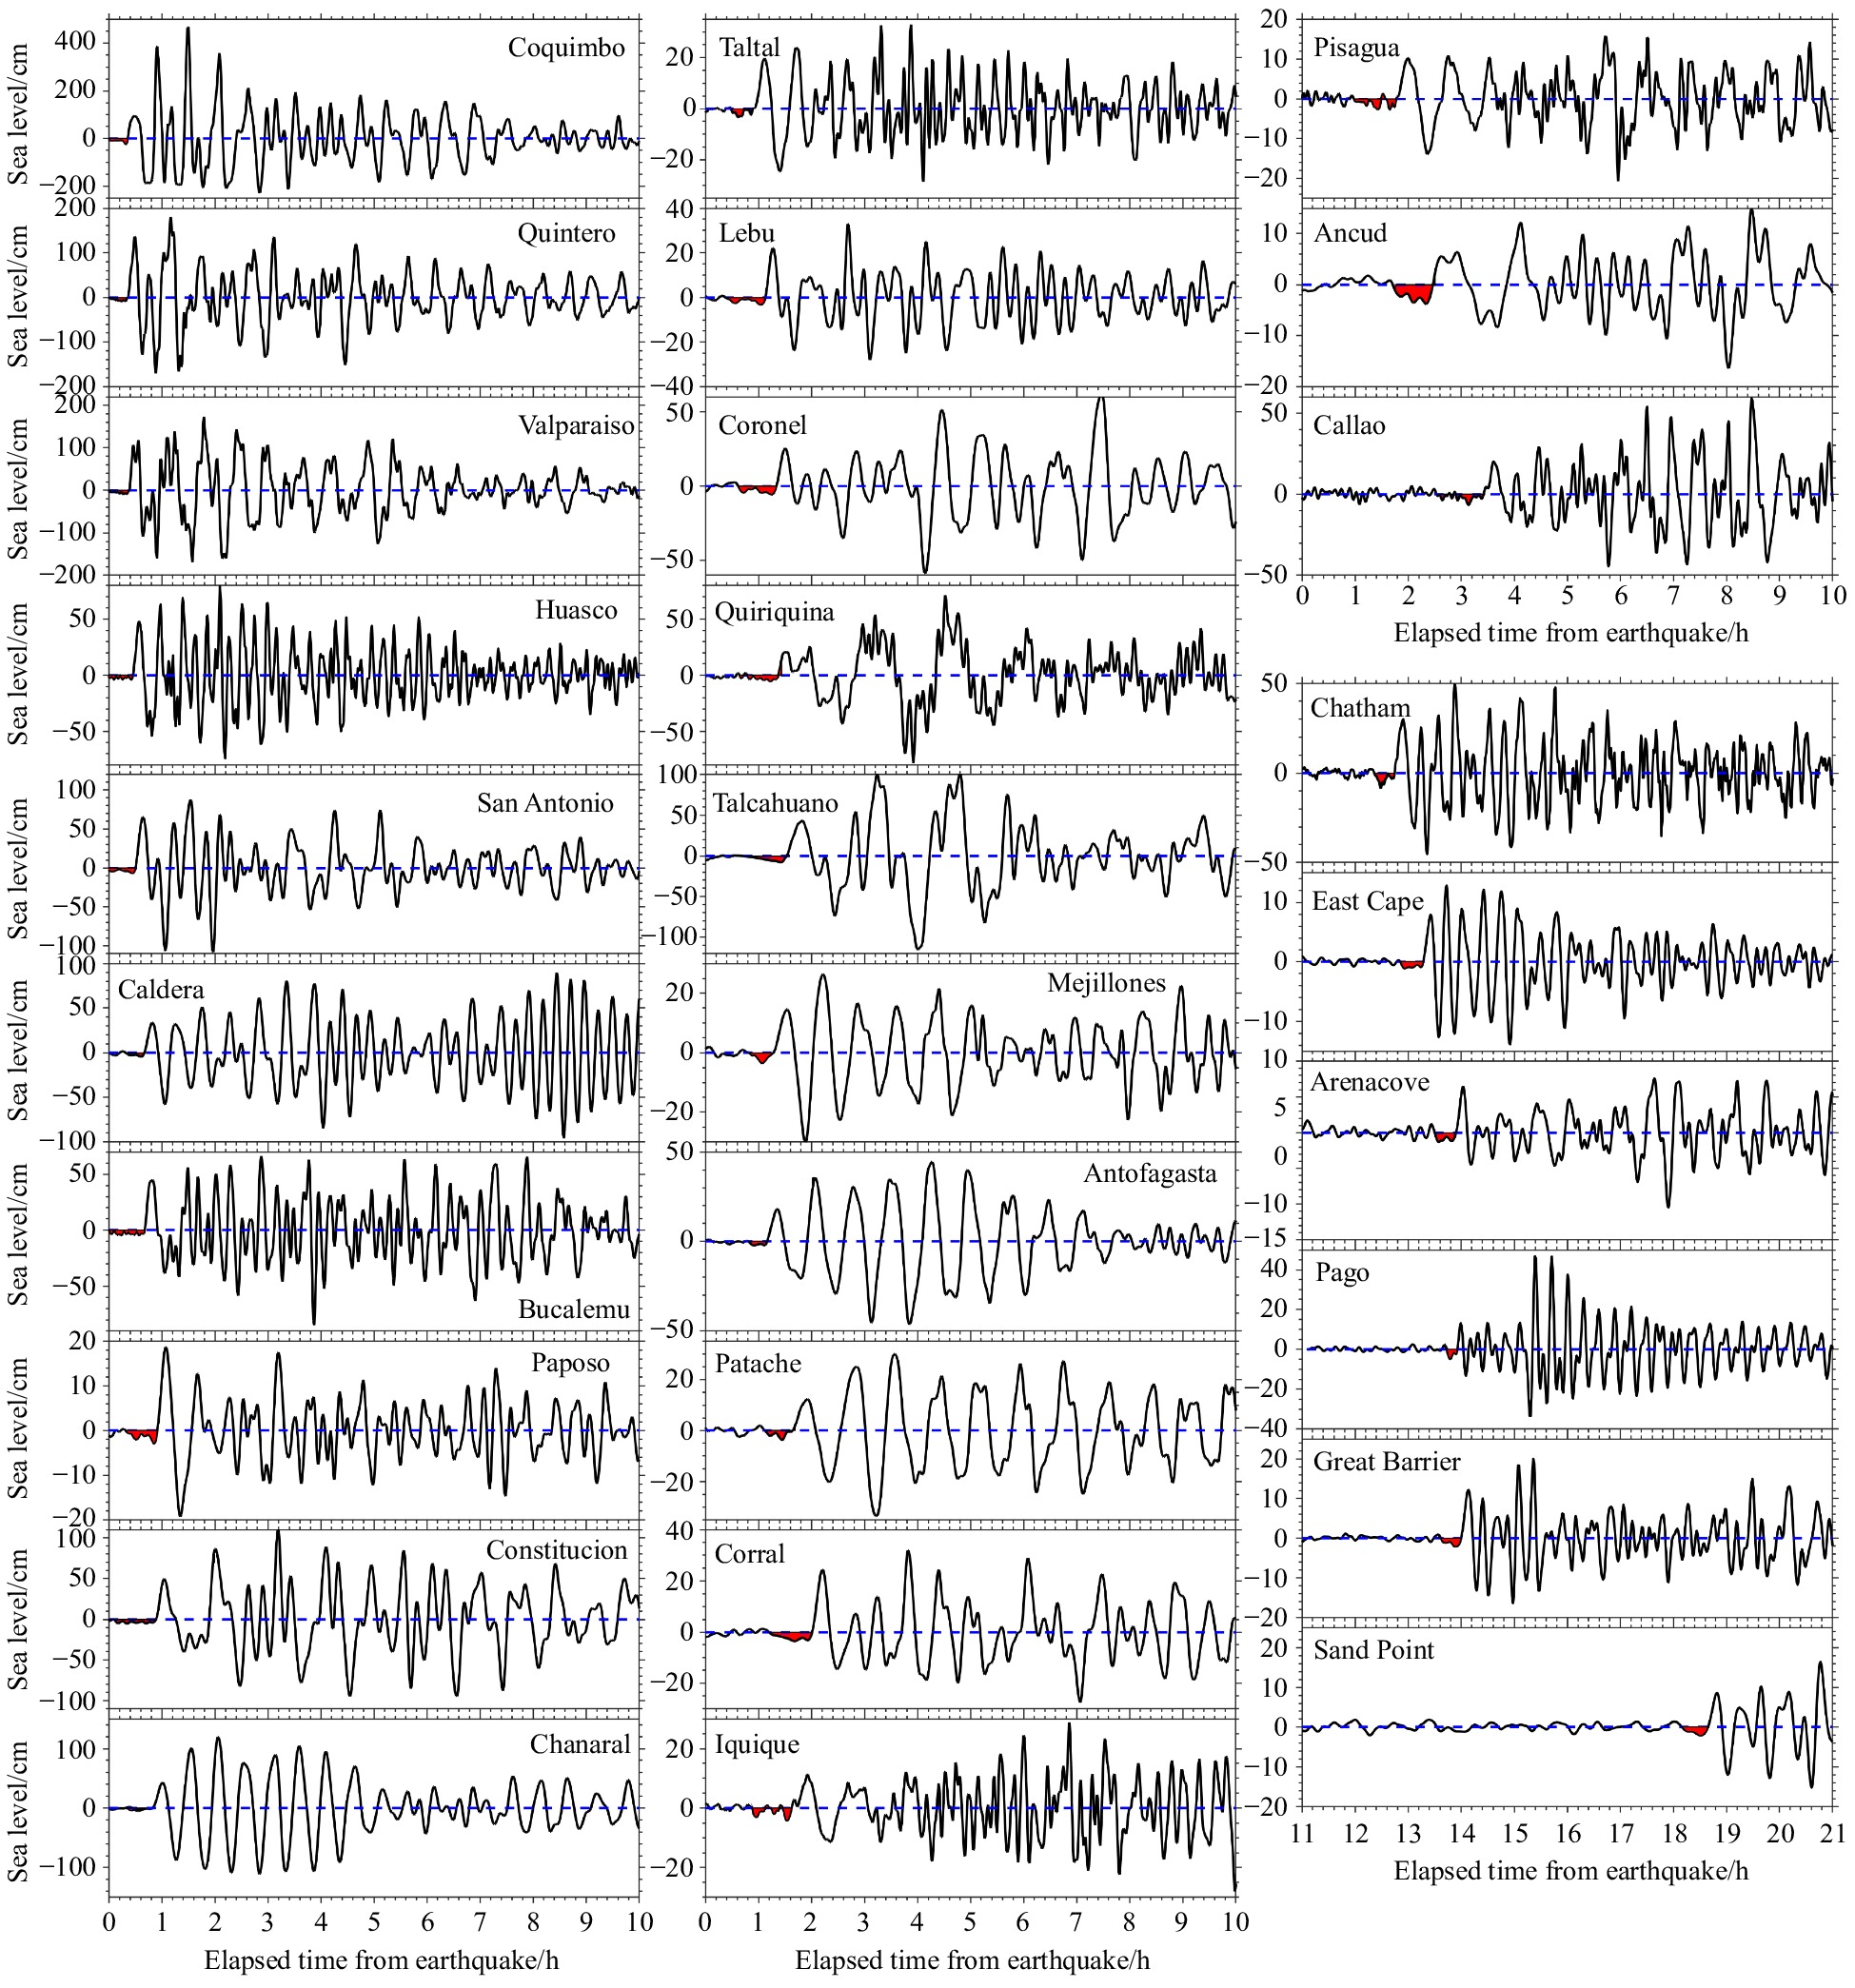
Figure 2. The 16 September 2015 Chile tsunami recorded by tide gauges at 22 near-field sites and 7 far-field sites. The red shaded areas are the leading negative phase marking the arrival of the tsunami waves.
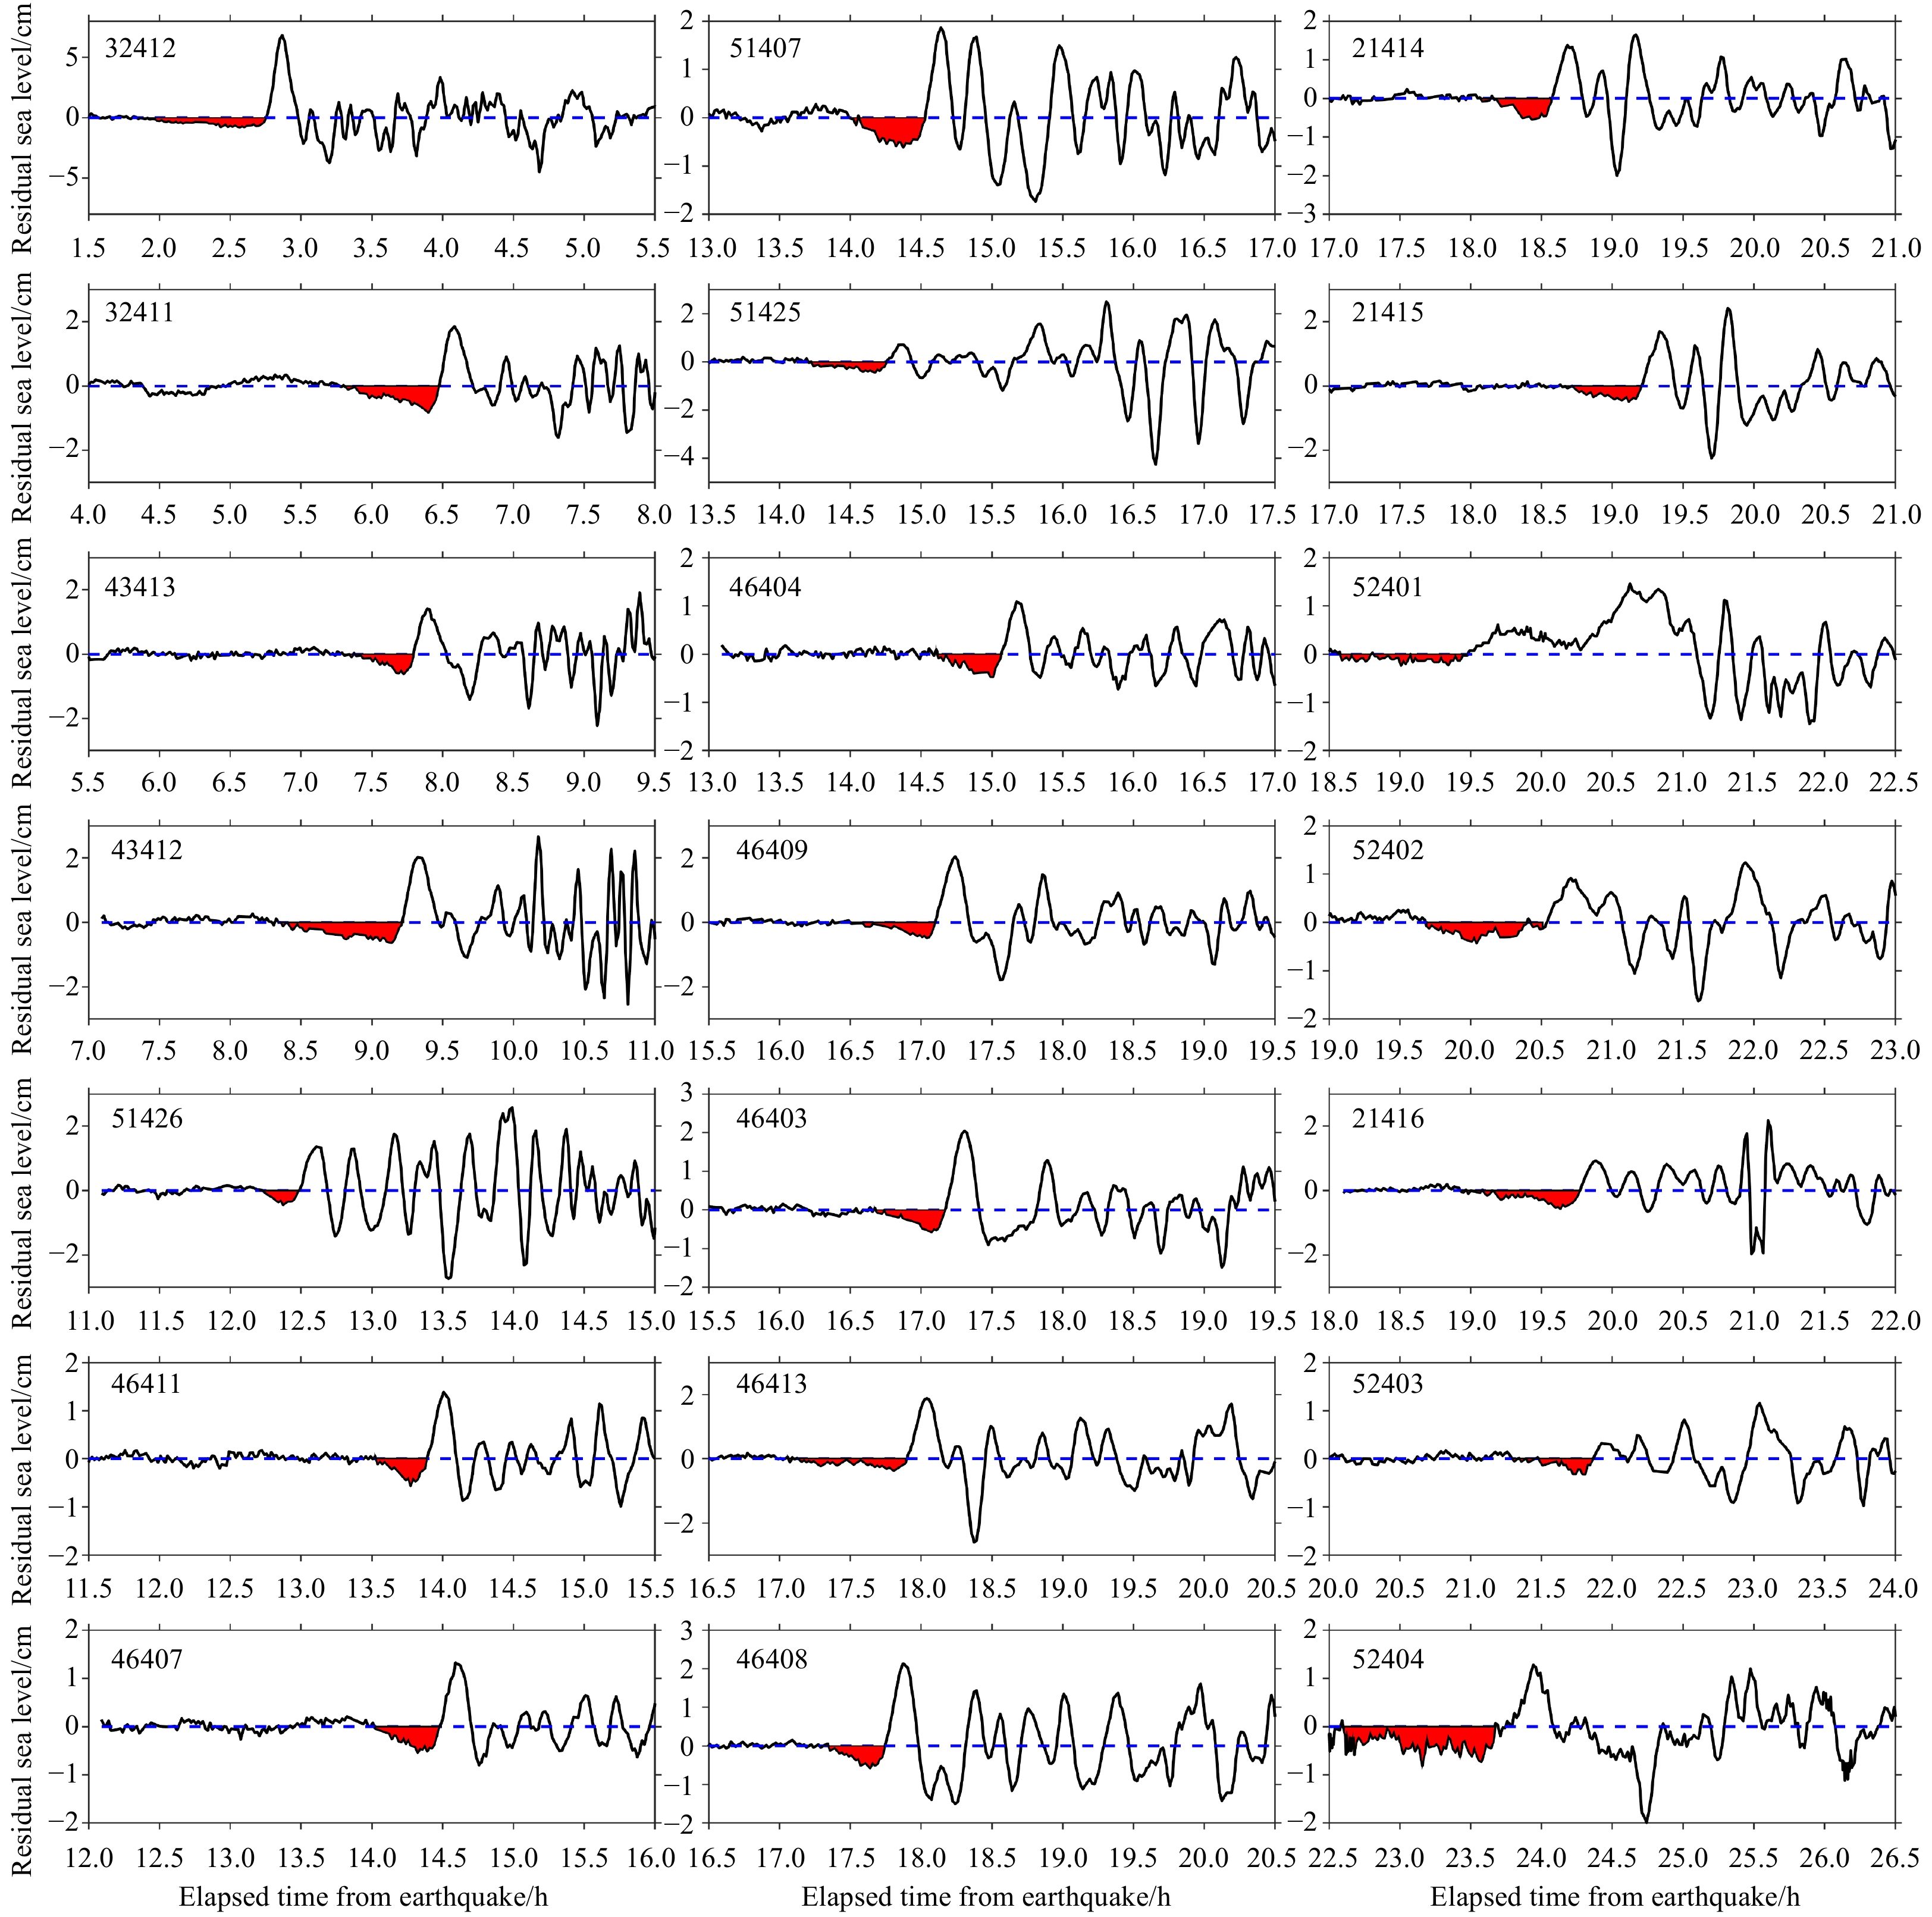
Figure 3. Tsunami waveform from 2015 Illapel tsunami recorded on DART stations across the Pacific Ocean. The red shaded areas are the leading negative phase that preceded the arrival of the main tsunami.
Figure 4. The relationship between the distance from the source and travel time. The black circles indicate the data available from DART observations for the 2015 Illapel, Chile tsunami.
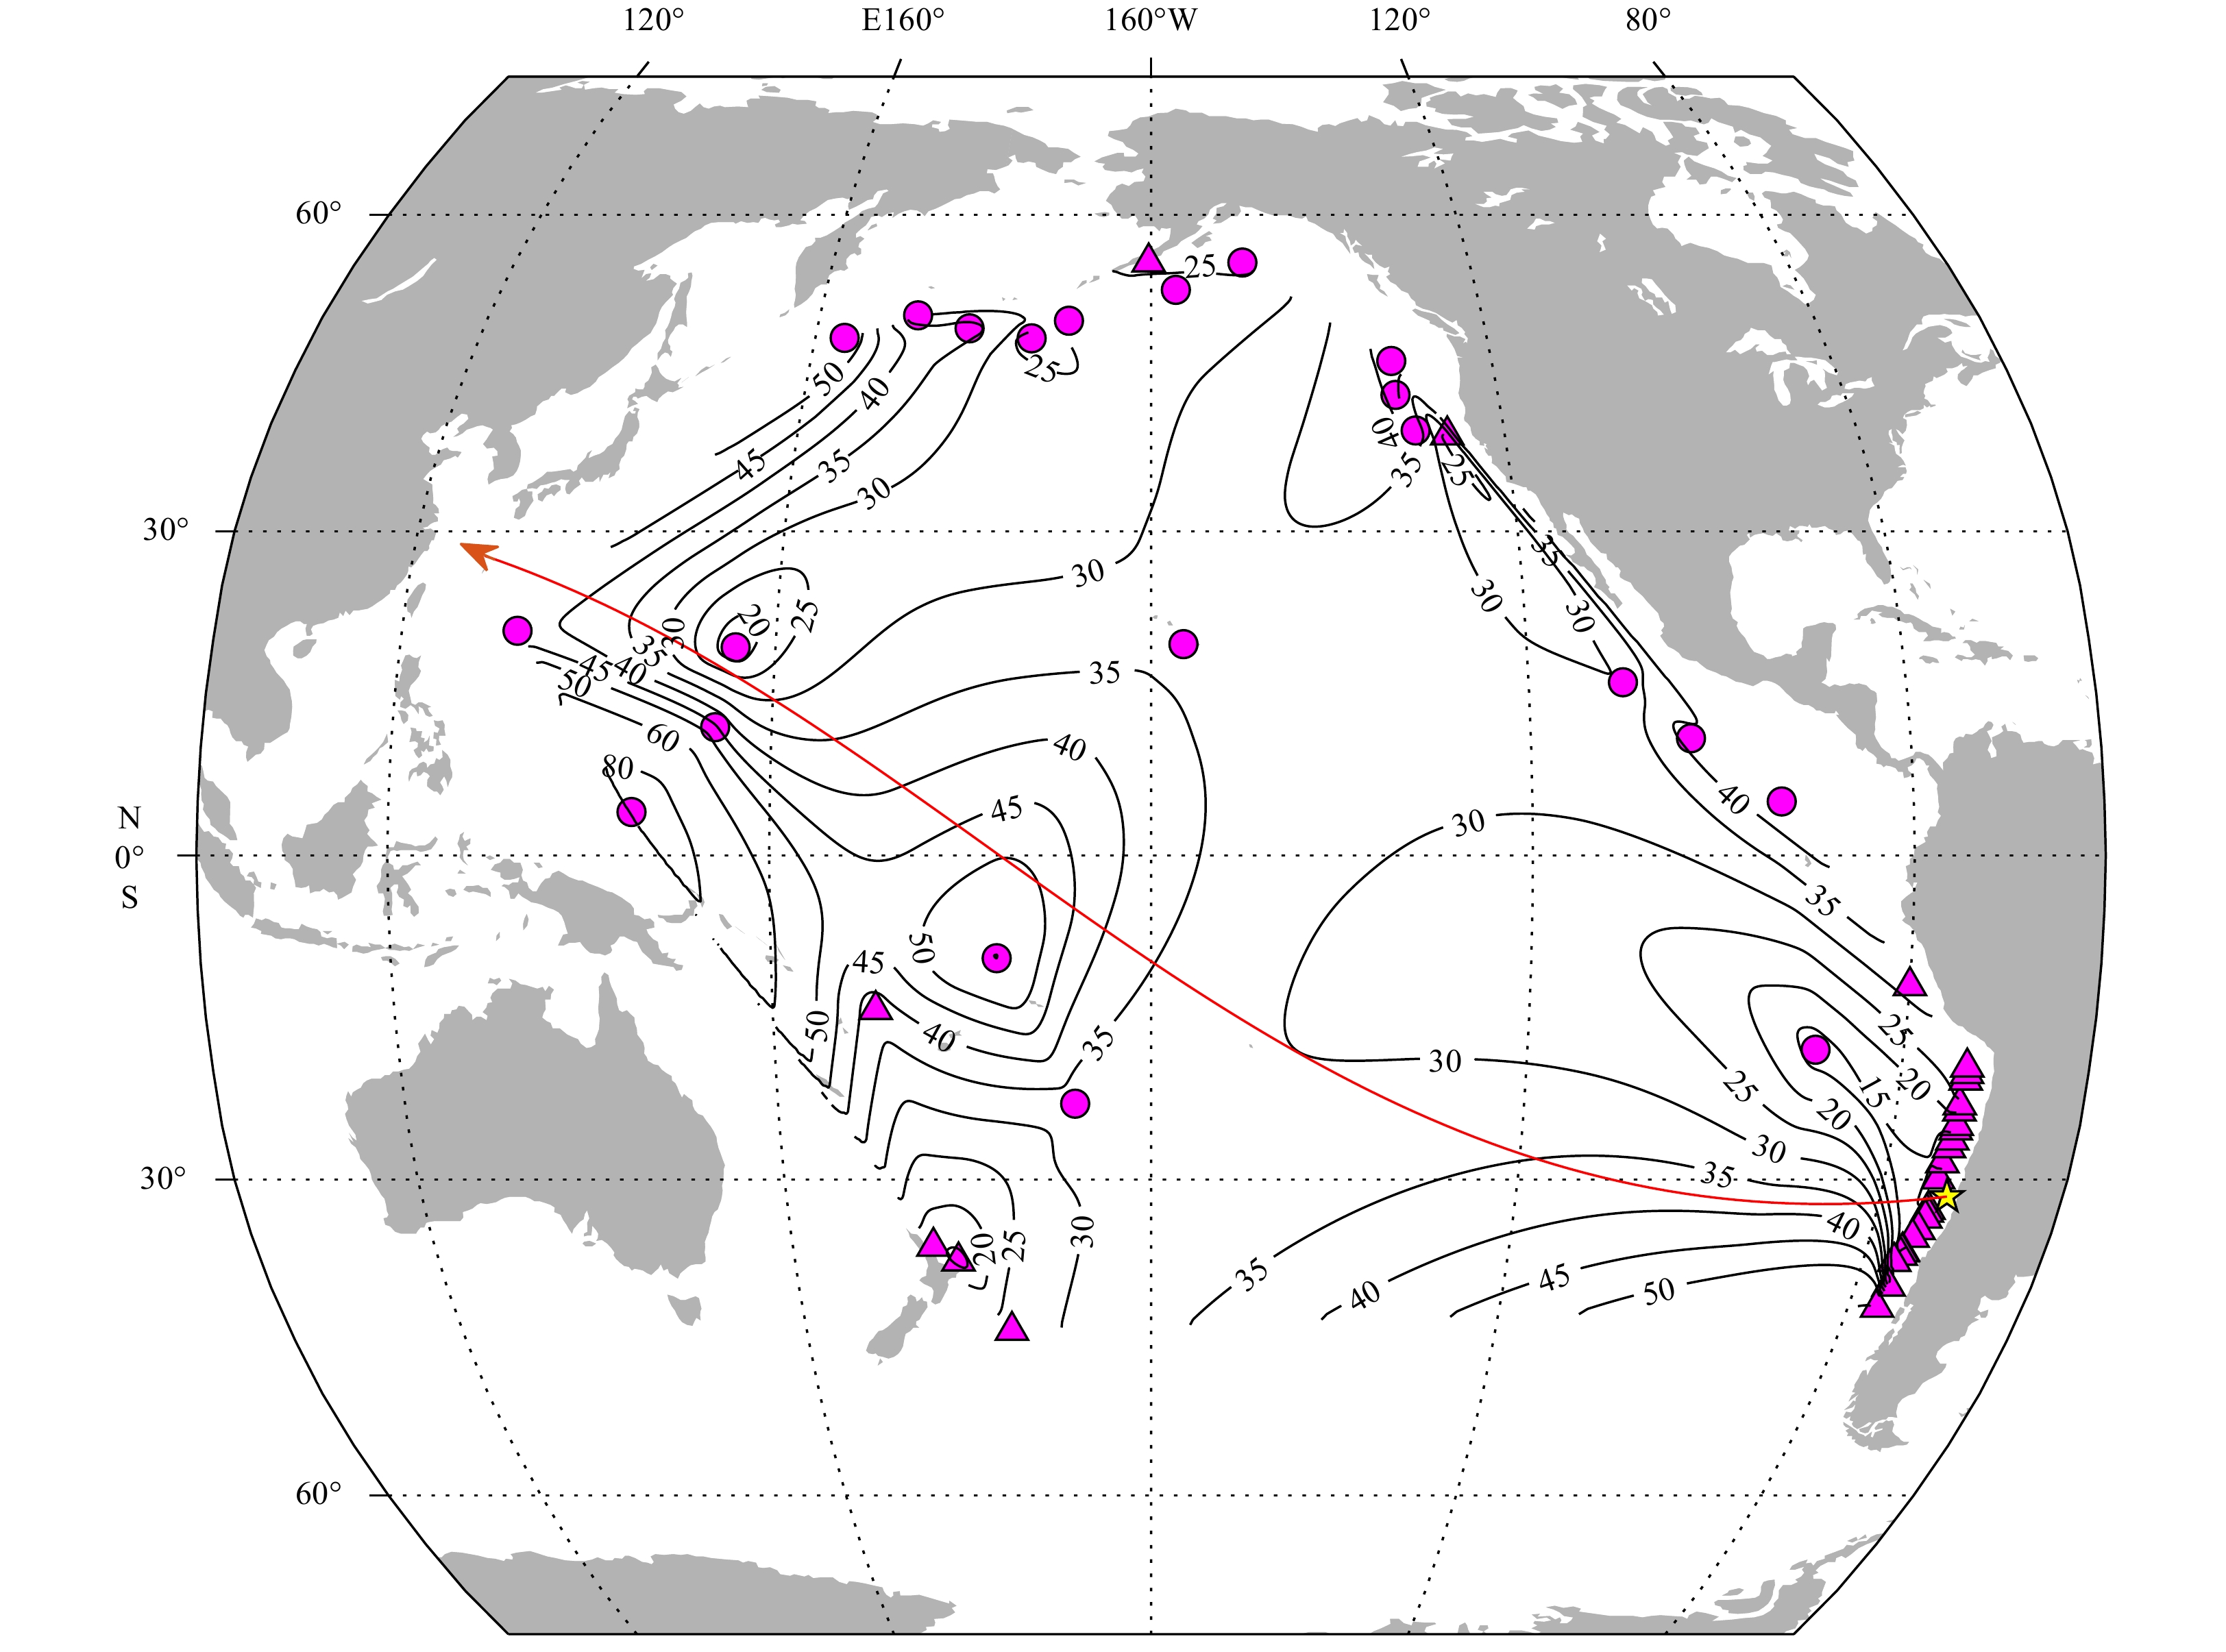
Figure 5. Contours of the amplitude ratio (%) of the LNP to the first frontal crest wave determined from near-field and far-field records across the Pacific Ocean. The solid line with red arrow represents the normal direction to the fault strike. Yellow star represents the epicenter. Solid circles and triangles indicate the locations of DART stations and tide gauges respectively.
Figure 6. Distribution of maximum simulated tsunami amplitude guided by seafloor topography and fault strike for the 2015 Illaple tsunami. Yellow star represents the epicenter. Solid circles indicate the locations of DART stations.
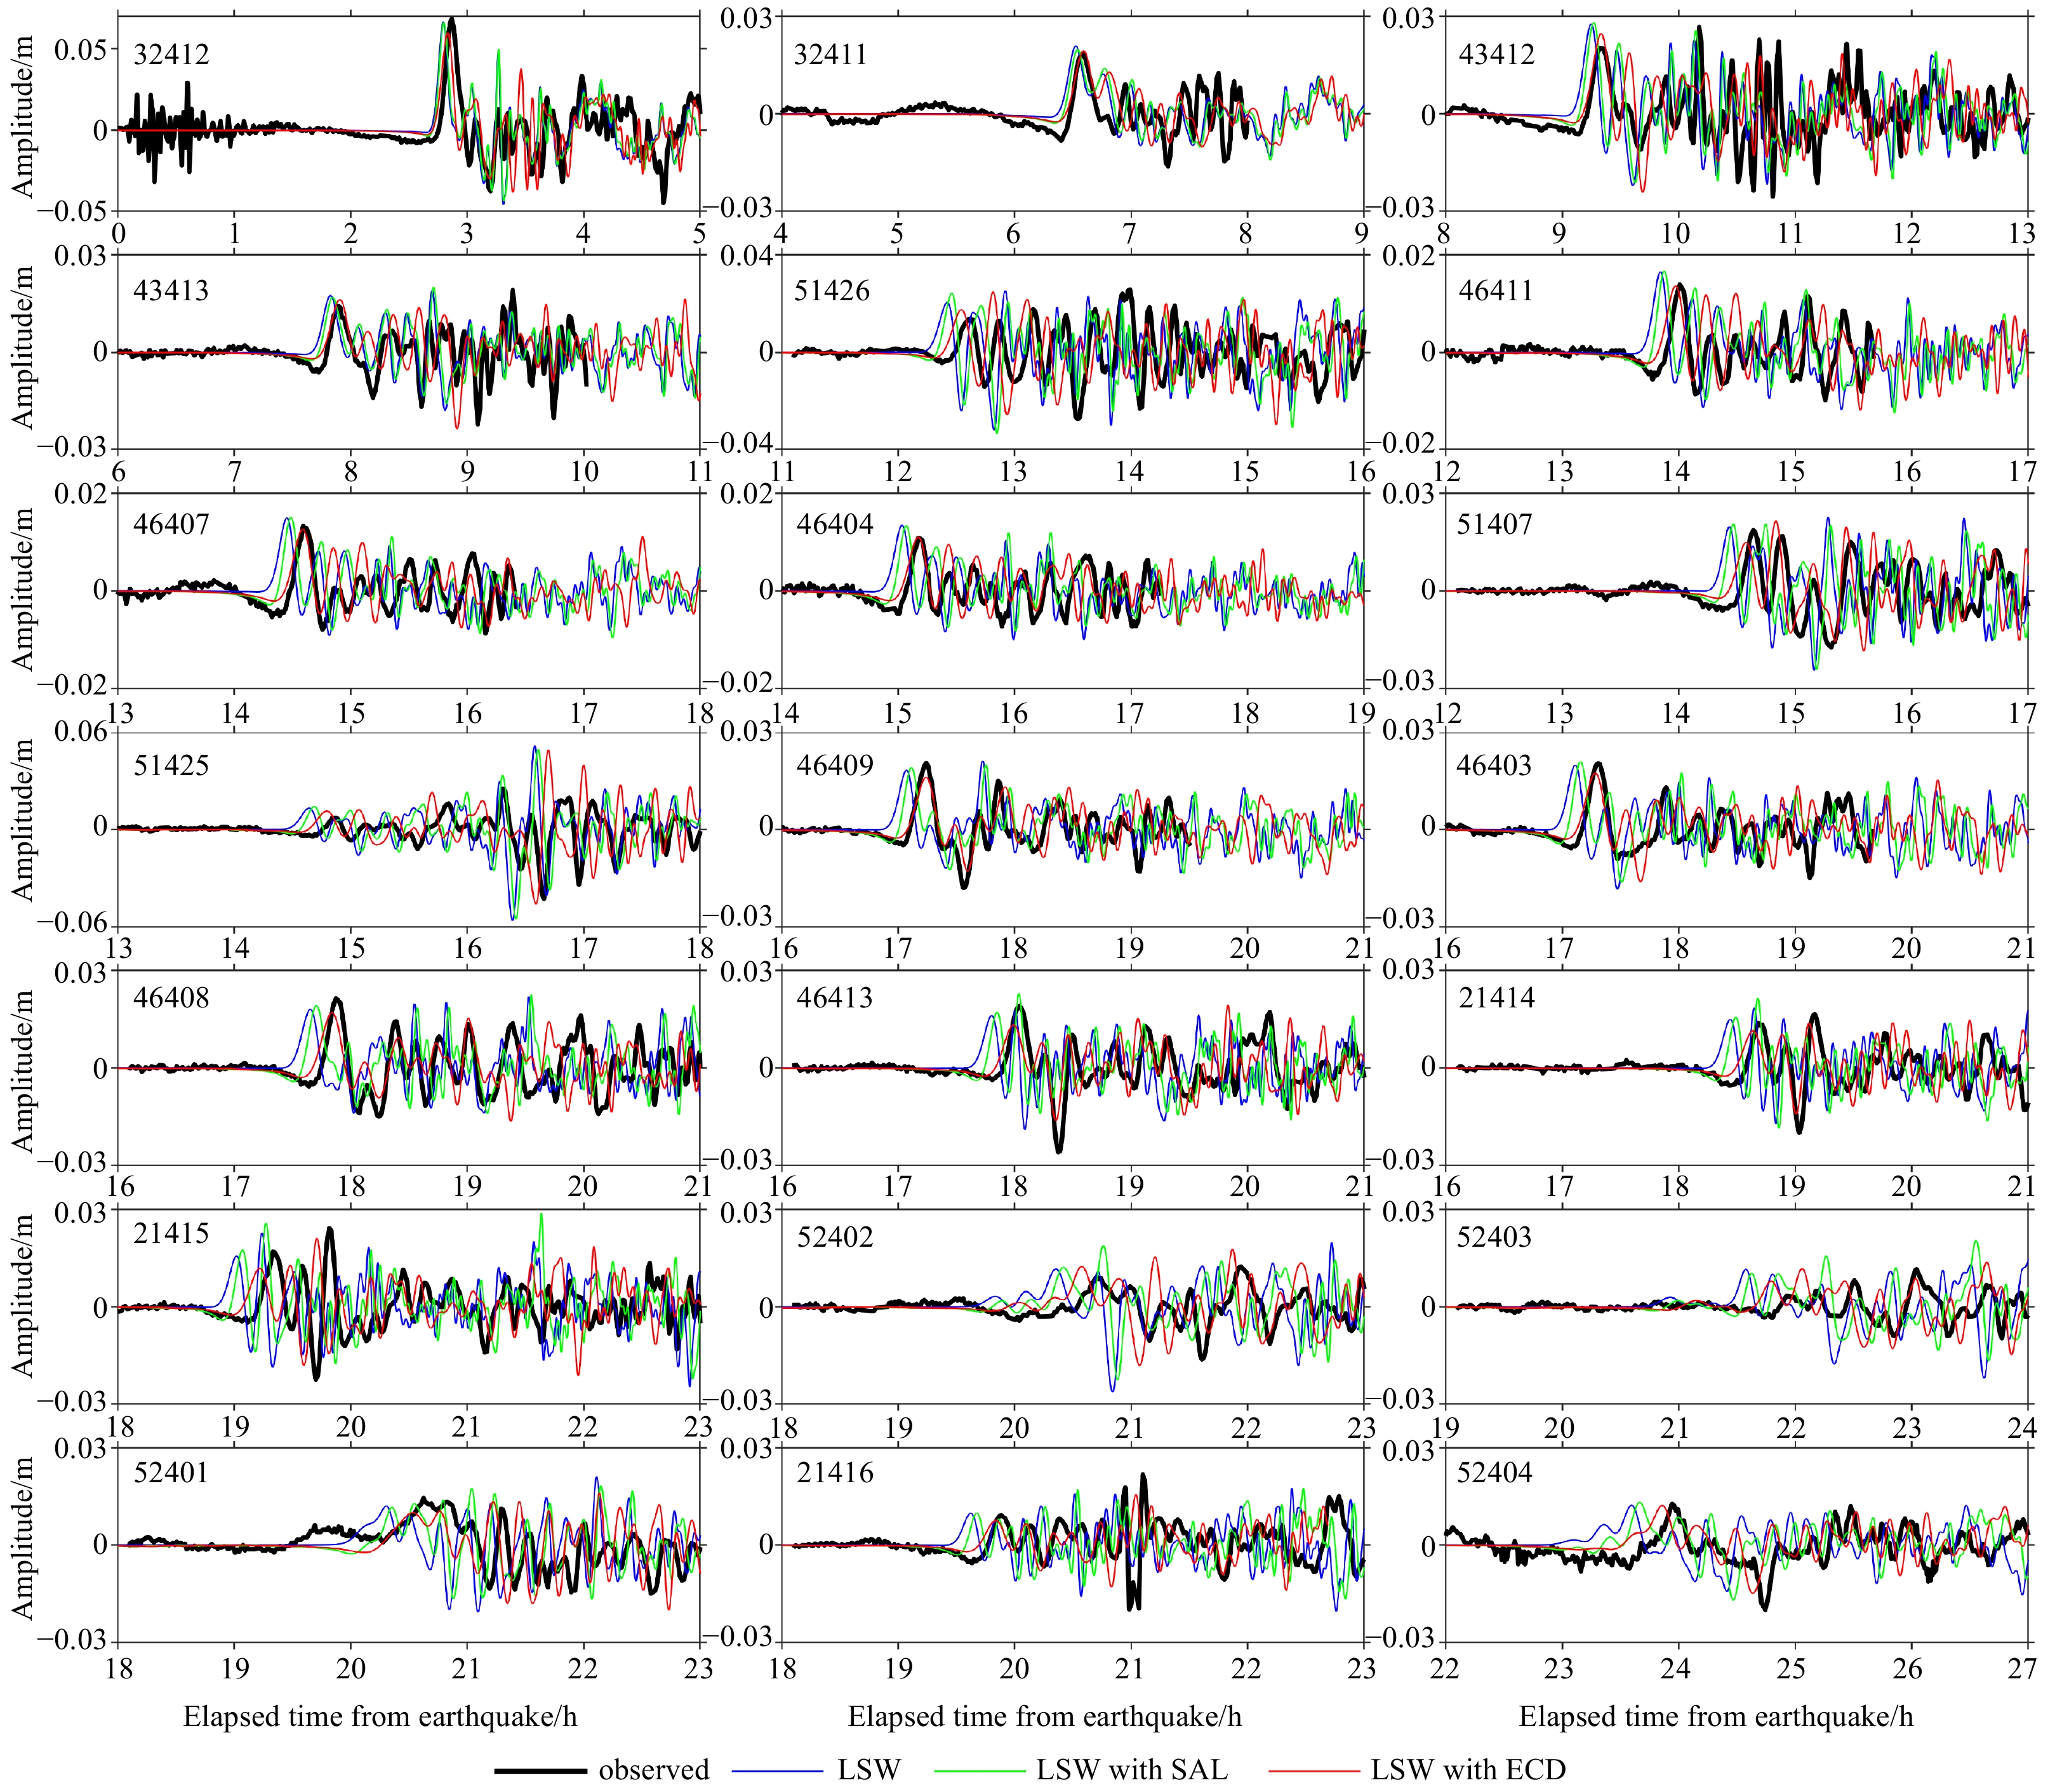
Figure 7. Comparison of simulated waveforms with the observed DART records (black lines) for the 2015 Illapel tsunami. The blue lines indicate simulated tsunami by solving the LSW; the green lines indicate simulated tsunami with the effects of the elastic loading; and the red lines represent simulated tsunami with the coupling effects of elastic loading, seawater density stratification and wave dispersion.
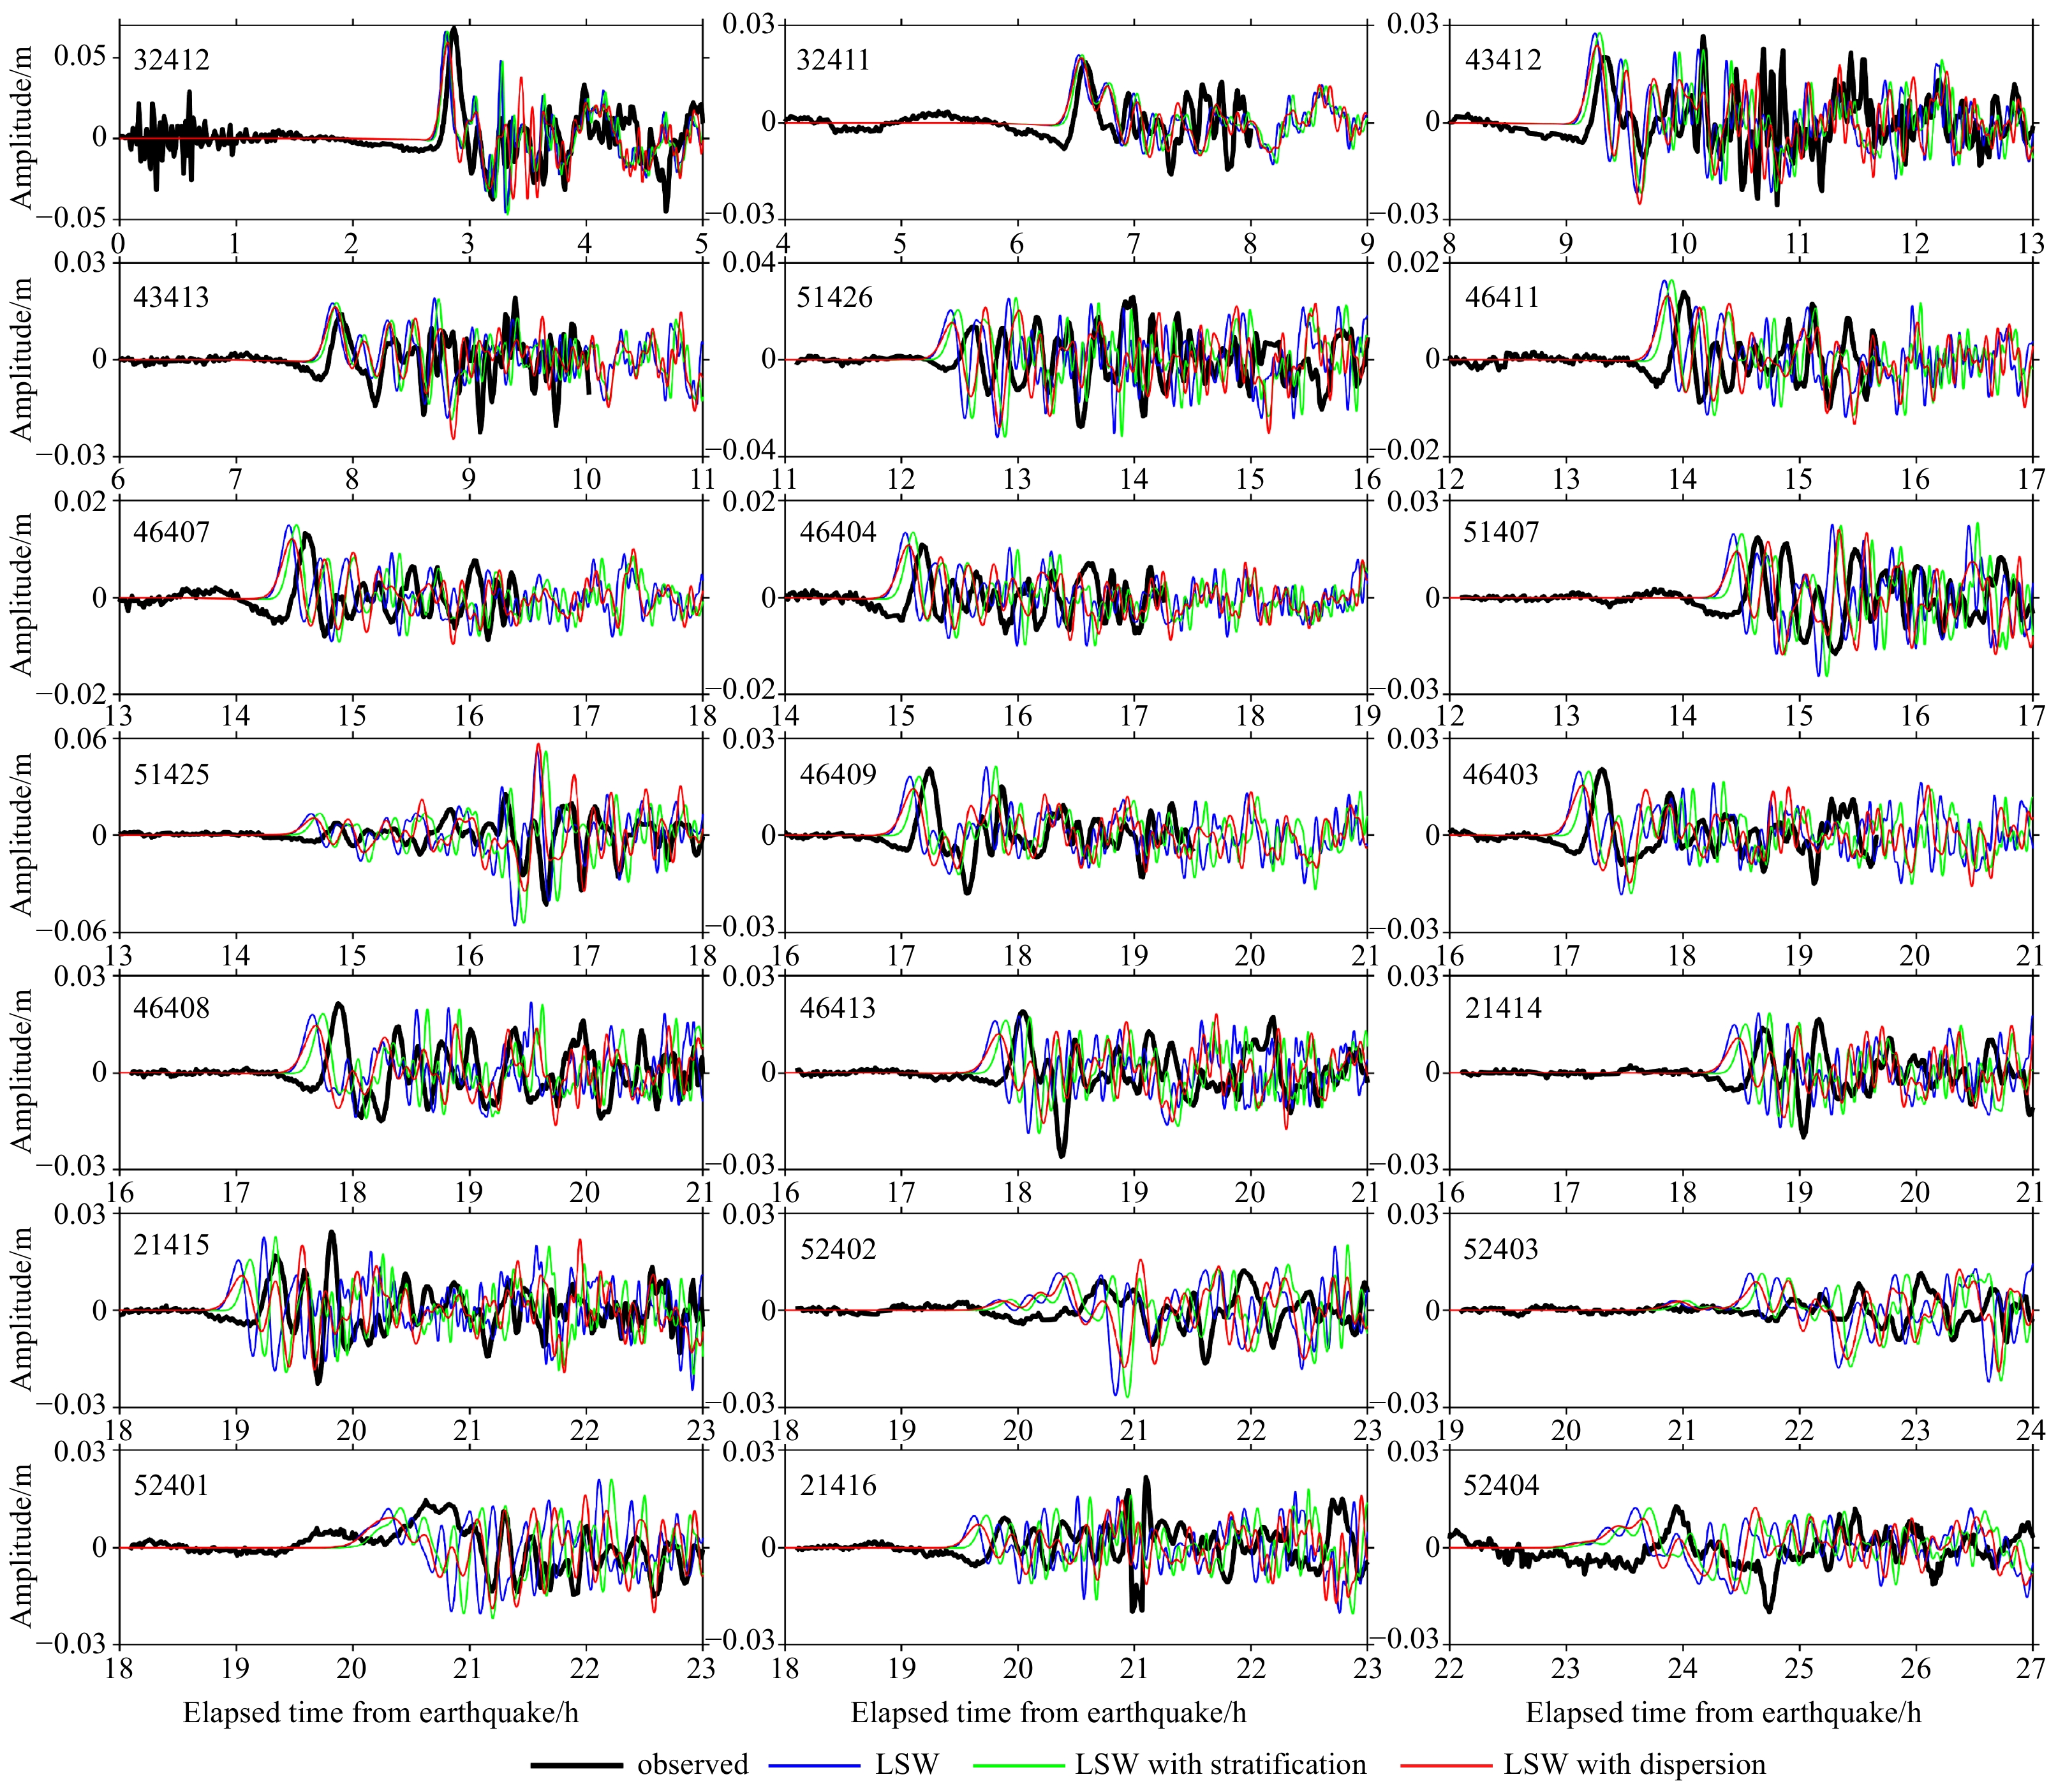
Figure 8. Comparison of simulated waveforms with the observed DART records (black lines) for the 2015 Illapel tsunami. The blue lines indicate simulated tsunami by solving the LSW. The green lines indicate simulated tsunami with the effect of the seawater density stratification. The red lines represent simulated tsunami with the wave dispersion.
Figure 9. Comparison of the LSW simulated tsunami propagation snapshots with corrected LSW simulations in the Pacific Ocean at 4 h, 15 h and 21 h after the earthquake. Column a shows the tsunami wavefields simulated by solving the LSW model, Column b shows the corrected tsunami wavefields simulated by taking into account the effect seawater density stratification, Column c shows the simulated tsunami wavefields with a correction for wave dispersion, Column d shows the simulated tsunami wavefields with SAL correction, Column e represents the simulated tsunami wavefield with coupled ECD correction, and Column f depicts the snapshots display area of tsunami propagation at corresponding moment. The positions of black arrow indicate the LNP arriving.
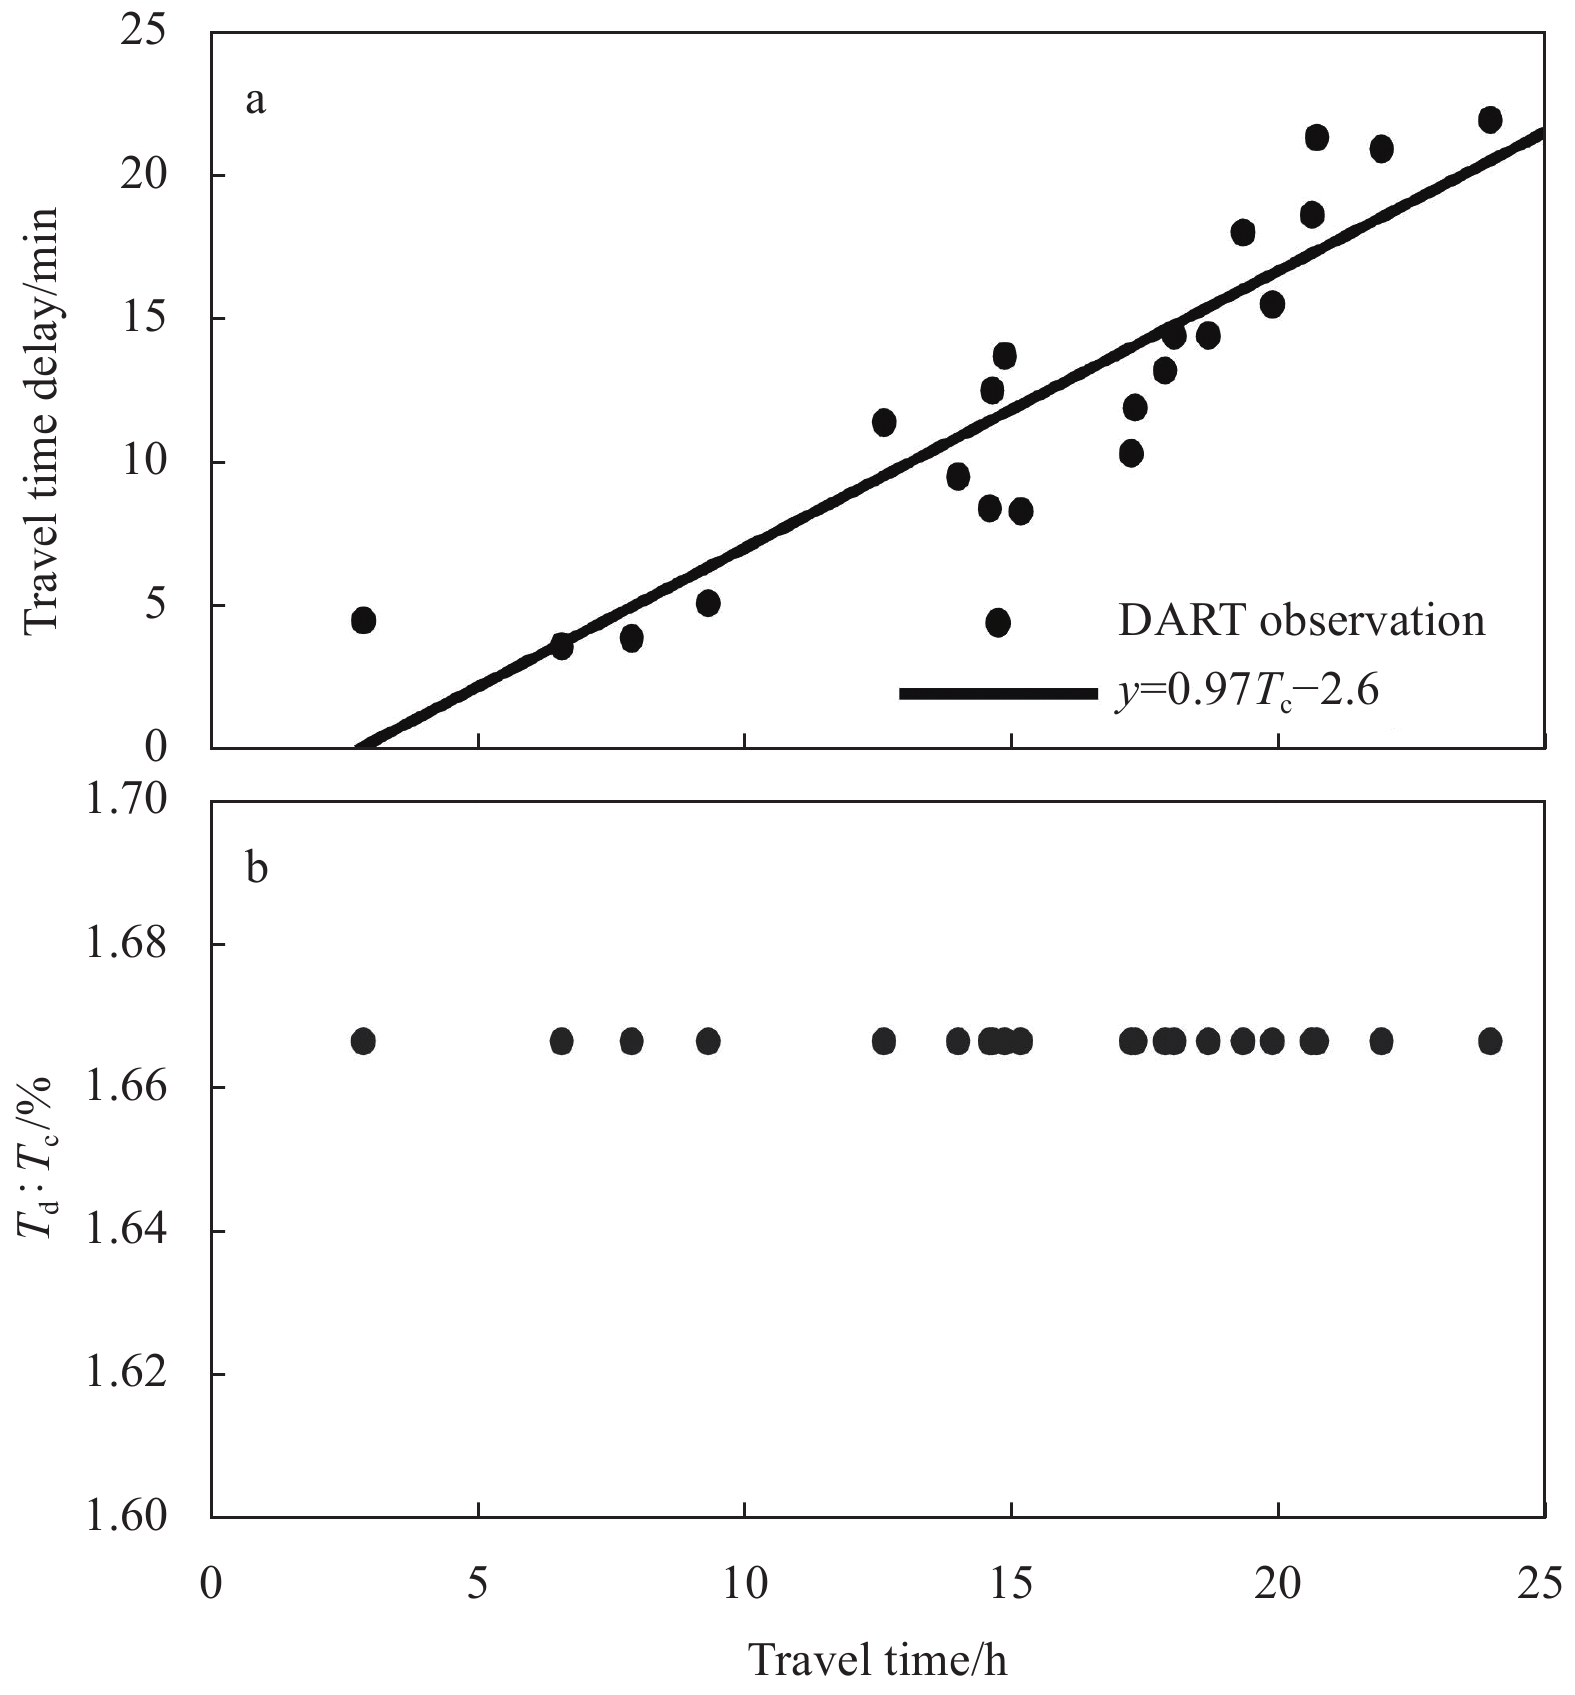
Figure 10. The travel time delays as function of the tsunami travel time across the Pacific Ocean (a), and the relationship between the ratio of Td to Tc and travel time based on available deep-ocean data (b). The black circles in a are the available DART observed travel time delays relative to the numerically simulated long waves.
Figure 11. Evaluation the impact of different correction schemes for improving tsunami travel time delay. a. Comparison of travel time delays between observed waveforms relative to the LSW simulations and corrected travel time delay at each DART station. b. The travel time delay differences between improved travel time delay and Td as functions of travel time (Tc).
Figure 12. The contribution rate for improving travel time delay using different correction schemes. Comparison the impact of SAL, seawater density stratification due to compressibility, physical dispersion and the coupling effects (ECD) on tsunami travel time delay corrections.
Figure 13. Percent differences of simulated maximum amplitude for the 2015 Chilean tsunami between with and without corrected models. a. Percent change between the LSW results and the corrected LSW simulations by coupling the seawater density stratification due to compressibility effect, b. percent change between the LSW results and the corrected LSW simulations by coupling the SAL effect, c. percent difference between the LSW results and the corrected LSW taking into account the effect of wave dispersion, and d. percent change between the LSW and the corrected LSW that includes the effects of the SAL, stratification and physical dispersion.
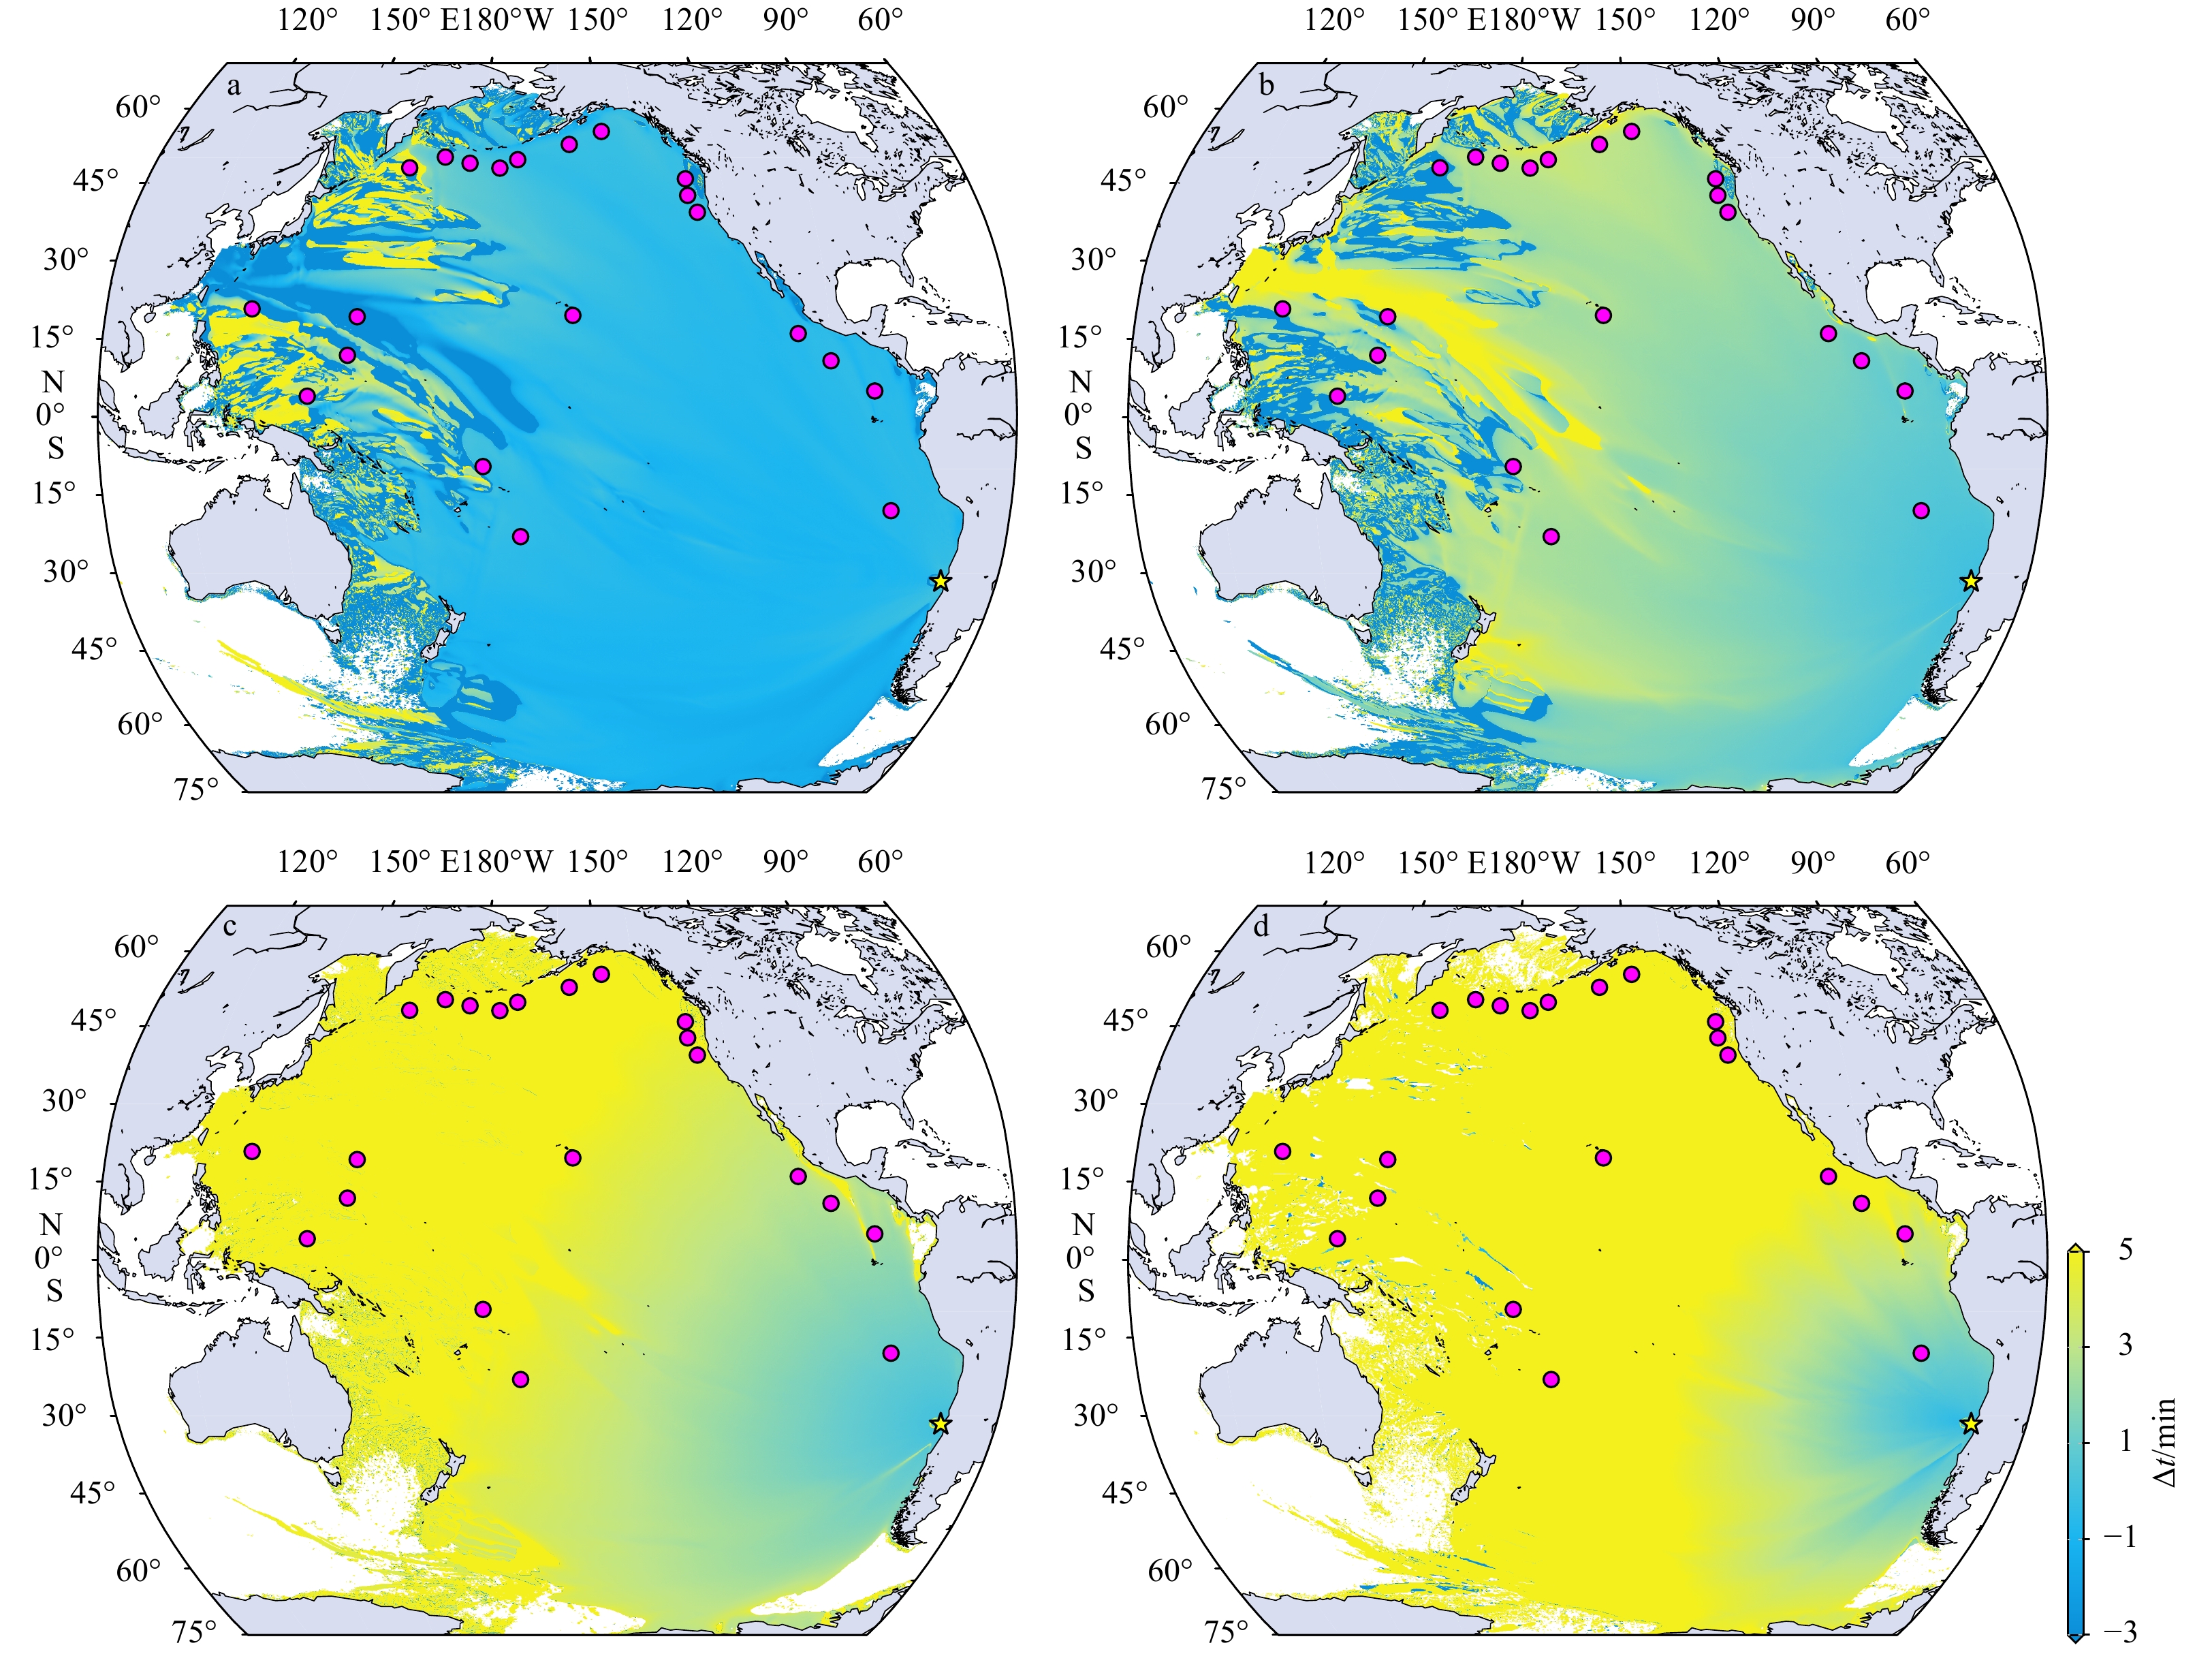
Figure 14. Tsunami arrival time differences (Δt) between estimated corrected LSW simulations and LSW solvers. a. Arrival time difference between the simulated tsunami that take into account dispersion effects and the LSW results, b. arrival time difference between the simulated tsunami with a correction for elasticity of solid Earth and the LSW results, c. arrival time difference between the simulation that take into account seawater stratification and the LSW results, and d. arrival time difference between the simulation that take into account the effects of ECD and the LSW results.


 DownLoad: