Key Laboratory of Marine Geology and Environment, Institute of Oceanology, Chinese Academy of Sciences, Qingdao 266071, China
2.
Laboratory for Marine Mineral Resources, Pilot National Laboratory for Marine Science and Technology (Qingdao), Qingdao 266071, China
3.
University of Chinese Academy of Sciences, Beijing 100049, China
4.
Center for Ocean Mega-Science, Chinese Academy of Sciences, Qingdao 266071, China
Funds:
The National Natural Science Foundation of China under contract No. 91958213; the Strategic Priority Research Program of the Chinese Academy of Sciences under contract No. XDB42020402; the National Programma on Global Change and Air-Sea Interaction under contract No. GASI-GEOGE-02; the International Partnership Program of the Chinese Academy of Sciences under contract No. 133137KYSB20170003; the Special Fund for the Taishan Scholar Program of Shandong Province under contract No. ts201511061; the National Key Basic Research Program of China under contract No. 2013CB429700.
Studies of the mineralogy and sulfur isotope composition of sediment-hosted hydrothermal sulfide minerals in cores are important for understanding the seafloor mineralization environment and material source and reconstructing the hydrothermal history. However, the source of ore-forming materials and the history of hydrothermal activity in the southern Okinawa Trough (SOT) remain unclear. Here, the mineralogy and sulfur isotope characteristics of sulfides from gravity core HOBAB4-S2, collected between the Yonaguni Knoll IV hydrothermal field (HF) and the Tangyin HF, was investigated. Enrichments in Zn (up to 321×10−6), Cu (up to 73.7×10⁻⁶), and Pb (up to 160×10−6) and the presence of pyrite, galena, pyrrhotite and minor sphalerite and chalcopyrite provide evidence for the input of hydrothermal materials into the sediments. The pyrite morphologies include disseminated cubic, pentagonal dodecahedron, and framboidal forms. Except for minor framboidal pyrite, euhedral pyrite from core HOBAB4-S2 is mainly of hydrothermal origin with Co/Ni ratios >1 and S/Fe atomic ratios <2 in the Cu-Zn-Pb-rich layers. The occurrences of hexagonal pyrrhotite, high-Co (up to 0.17%) pyrite and high-Fe sphalerite indicate that the hydrothermal precipitates formed at medium-high temperatures and low-sulfur fugacity (fS2) environments. The δ34S values of sulfides (0.21‰–3.45‰) with low- fS2 mineral assemblages (e.g., pyrrhotite ± high-Fe sphalerite) in the core are significantly lower than those of magmatic rocks and seawater, indicating possible incorporation of previously formed biogenic sulfur in the sediment. Combined with the age model of the core, it is suggested that hydrothermal activity likely began in the Tangyin HF before AD 1445–1483 and that at least three active episodes may have occurred since then.
Yang Yamin, Zeng Zhigang, Liu Xiting, et al. Fine-grained turbidites in the southern Okinawa Trough and its implication for earthquakes activity in the past 700 years. Geological Journal (Major revision).
The Okinawa Trough (OT) is an intracontinental back-arc basin and is located behind the Ryukyu trench-arc system (Lee et al., 1980; Sibuet et al., 1987). The Zn and Pb-enriched hydrothermal mineralization in the OT (Halbach et al., 1993; Ishibashi et al., 2015) resembles that of Kuroko-type deposits. This mineralization has attracted the attention of economic geologists since the discovery of active hydrothermal field (HF) Natsushima 84-1 Knoll in 1986 (Kimura et al., 1988). To date, at least 15 HFs have been reported in the OT (Beaulieu and Szafranski, 2018), including the Tangyin and Yonaguni Knoll IV HFs in the southern OT (SOT). Recently, considerable efforts have been made to investigate the characteristics of sulfide ore deposits (Glasby and Notsu, 2003; Gena et al., 2013; Zhang et al., 2018, 2019), the source of ore-forming material (Cao et al., 2018; Wang et al., 2020; Yang et al., 2020), hydrothermal fluids (Suzuki et al., 2008), the chemical compositions of hydrothermal vent organisms (Zeng et al., 2017a), volcanic rocks (Chen et al., 2018; Guo et al., 2018), the bacterial community of hydrothermal deposits in the SOT (Wang et al., 2018). However, the ore-forming material source of sulfides from the back-arc basin is complex and remains to be clarified despite much research effort. In addition to igneous rocks and seawater, magmatic fluids (Cao et al., 2018; Yang et al., 2020) or sediments (Wang et al., 2020) may have contributed to the hydrothermal systems in the SOT, but this role is still unclear. In addition, the history of hydrothermal activity in the SOT is also uncertain.
As records of the distribution and features of hydrothermal activity, hydrothermal sediments are mixtures of hydrothermal metal-bearing materials and background pelagic sediments (Gurvich, 2006). As the co-precipitates of sulfide ores, hydrothermal components in the sediments are an important part of the sulfide metallogenic system (Gurvich, 2006). Sediment-hosted hydrothermal components usually inherit metalliferous signatures via the discharge of hydrothermal particles or sulfide mass wasting (Feely et al., 1987). The primary input geochemical signals of hydrothermal sulfides are preserved in the sediments since there is no early diagenetic element mobilization (Feely et al., 1987; Kuhn et al., 2000; Agarwal et al., 2020). Therefore, the mineralogical and geochemical characteristics of hydrothermal sulfides can be used to reveal the hydrothermal mineralization environments and depositional processes of sediments (Yang et al., 2020). Moreover, the hydrothermal sediments in cores can be used to determine the history of hydrothermal activity (Gurvich, 2006).
The sediment core HOBAB4-S2 was collected from a seafloor depression between the active Tangyin and Yonaguni Knoll IV HFs in the SOT. In this paper, the major and trace element compositions of sediment samples and the mineralogical, geochemical and sulfur isotope compositions of sulfide minerals are reported. The aims of this study are to identify the hydrothermal components in the sediments, determine the mineralization conditions and infer the possible sulfur sources in the SOT. The occurrence time of hydrothermal activity is then constrained in conjunction with the age model of core HOBAB4-S2.
2.
Geological setting
The OT is an initially expanding back-arc basin behind the Ryukyu Arc in the western Pacific (Sibuet et al., 1987, 1995) (Fig. 1) and is formed by the subduction of the Philippine Sea Plate under the Eurasian continent (Halbach et al., 1993). The most recent extension of the OT commenced approximately 2 million years (Ma) ago at the Plio-Pleistocene boundary (Sibuet et al., 1987; Shinjo, 1998; Shinjo and Kato, 2000). Topographically, the OT is 1 200 km long, 60–100 km wide in the south and 230 km wide in the north (Sibuet et al., 1987). Seismic reflection data suggest that the sediment layer becomes thinner from north to south, with thicknesses of 1–2 km in the SOT (Klingelhoefer et al., 2009).
Figure
1.
Bathymatric map of the Okinawa Trough (OT). a. The locations of the samples and hydrothermal fields in the OT (bathymetric map from http://www.geomapapp.org/index.htm). b. Topography of the Tangyin and Yonaguni Knoll IV HFs and sampling location of core HOBAB4-S2 in the southern Okinawa Trough (SOT) (hydrothermal vent data from Beaulieu et al. (2013) and Tangyin HF data from Zeng et al. (2017a)). The bottom flow directions are from several months of mooring observations (Chung and Hung, 2000).
The OT is divided by the Tokara fault belt (TFB) and the Miyako fault belt (MFB) located at ~127°E and 130°E, respectively, into three segments: the SOT, the MOT and the NOT (Fig. 1a) (Shinjo et al., 1999; Shang et al., 2017; Zhang et al., 2018). The volcanic rocks in the SOT are mainly basalts and rhyolites (Shu et al., 2017) and minor intermediate rocks-dacites (Chen et al., 2018). Sufficient supplies of magma and heat provide favorable conditions for intense submarine hydrothermal activity in the SOT (Glasby and Notsu, 2003; Ishibashi et al., 2015; Zeng et al., 2017a). The emitted vent fluid is enriched in CO2 and CH4 volatile gases, indicating interactions between the hydrothermal fluid and organic matter in sediments (Ishibashi et al., 1995).
Tangyin HF in the SOT was discovered by the R/V Kexue during the HOBAB3 cruise in 2014 (Zeng et al., 2017a). It is located on the top of a twin Yuhua Hill seamount approximately 220 m high and 1.5 km wide from east to west. The seamount is characterized by a felsic volcanic basement (Zeng et al., 2017a). Sulfide types are Fe-Zn-rich massive, Zn-Pb-rich massive, and silica-rich precipitates (Wang et al., 2020). Yonaguni Knoll IV HF (Fig. 1b) is located in an elongated valley approximately 1 000 m long and 500 m wide. The valley is covered with muddy sediments and volcanic breccia. The hydrothermal mineralization types can be classified into five groups in these fields: anhydrite-rich chimneys, massive Zn-Pb-Cu enriched sulfides, Mn-rich chimneys, Ba-As chimneys, and pavement and silicified sediments (Suzuki et al., 2008). Previous moored investigations found that the bottom water in the SOT mainly flows toward the south and southeast directions with mean speeds of ~5 cm/s and 3 cm/s, respectively (Chung and Hung, 2000) (Fig. 1).
3.
Samples and methods
3.1
Sample location and chronological framework
The studied samples were recovered by a gravity corer from the SOT during the HOBAB4 cruise of the R/V Kexue at Station S2 in 2016 (Fig. 1). Sediment core HOBAB4-S2 (24°52′49.91″N, 122°37′19.70″E, water depth 1 505 m) was collected from a rifted basin between the Tangyin HF and the Yonaguni Knoll IV HF. The sediments in the core mainly consist of dark gray mud, with occasional silt and fine sand layers. The samples have a slightly fishy rotten egg odor and contain trace shell fragments. The age model of core HOBAB4-S2 was established with the OxCal 4.2 software based on accelerator mass spectrometry (AMS) 14C dating of mixed planktonic foraminifera and 210Pb dating of the upper layers①. Then, three sections were chosen for the collection of sulfide mineral grains. The sedimentary age of each section was calculated, and the ages are shown in Table 1.
Table
1.
The depths and corresponding sedimentary ages of the sections ①
Forty-eight sediment powder samples (<200 mesh) were chosen for the analysis of major elements. Glass discs for wavelength dispersive X-ray fluorescence (WD-XRF) spectrometry analysis were prepared by fusion of 0.5 g of the sediment powder sample with 5.0 g of lithium tetraborate:metaborate (2:1) (lithium borates 67-33, Claisse, Canada) using Pt-Au crucibles and molds employing fusion equipment supplied with gas burners (Fluxy, Claisse, Canada). The major element compositions were determined by XRF on fused glass disks using an AXIOS-Minerals spectrometer at the Institute of Geology and Geophysics, Chinese Academy of Sciences (IGGCAS) in Beijing, China. The loss on ignition (LOI) was measured after heating at 1 000°C for 1 h. The accuracy was monitored by the analysis of the reference material GBW07309. The analytical precision of the major elements was generally better than 5%.
The trace elements of sediment samples were measured at intervals of 1 cm by inductively coupled plasma mass spectrometry (ICP-MS) (ELAN DRC II) at the IOCAS. Every 40 mg sample powder was digested with 1.5 mL of HF and 0.5 mL of HNO3 in a Teflon vessel for 12 h at 150°C before 1 mL of HNO3 and 3 mL of deionized Milli-Q water were added to dissolve the residues. Finally, the dissolved samples were diluted to 40 g with deionized Milli-Q water for measurement using ICP-MS. A replicate for every 10 samples was measured to exclude data errors caused by instrument testing. The analytical precision and accuracy were monitored by analyzing the national marine sediment level standard reference materials GBW07315 and GBW07316 and USGS basalt standard substances BCR-2 and BHVO-2. The analytical results for the reference materials were consistent with their certified values and within the recommended ranges for standards. The relative accuracies of the ICP-MS analyses were estimated to be better than ±5%–10% for most elements.
Isolated sulfide grains in the sand-sized fractions (>63 µm) were observed and handpicked after the sand fraction was separated from the silt and clay fraction (<63 µm) via wet sieving. More than 50 sulfide minerals with coarse particles and good crystal forms were picked from the sediments. Then, the samples were ultrasonically cleaned, embedded in epoxy resin, and polished following the method of Dias et al. (2008). Thirty-five and 31 sulfide minerals were selected for major element and sulfur isotope analyses, respectively.
The major element compositions of sulfides were analyzed by a JXA-8230 electron probe microanalysis (EPMA) instrument with a 15 kV acceleration voltage, 20 nA beam current, and 1 μm beam diameter at the State Key Laboratory of Continental Dynamics, Northwest University in Xi’an, China. Many natural and synthetic minerals were used as standard samples to calibrate the sample results, including pyrite (FeS2), galena (PbS), sphalerite (ZnS), antimony telluride (Sb2Te3), and the pure metals gold (Au), copper (Cu), cobalt (Co), nickel (Ni), and manganese (Mn). The minimum detection limits of the elements were less than 0.01 wt%. The elements analyzed included S, Fe, Zn, Cu, Pb, Mn, Au, Ag, Cd, As, Ni and Se. The analytical precision was better than 1%.
In situ sulfur isotope analyses of pyrite and pyrrhotite were performed using a Nu Plasma 1700 multicollector (MC)-ICP-MS instrument (Nu Instruments, Wrexham, UK) with a 193 nm ArF excimer laser ablation system (RESOlution M-50, ASI) at the State Key Laboratory of Continental Dynamics, Northwest University. The operating conditions included an energy density of 3.6 J/cm2, a repetition rate of 3 Hz, and a spot size diameter of 30–37 μm, and helium was used as the carrier gas for sample laser ablation. A standard-sample bracketing (SSB) approach was used, and the calibrated standards NBS123, PTST (matrix-matched sulfur minerals), and Py-4 were repeatedly measured before and after each sample to correct for instrument drift and mass bias during the in situ sulfur isotope analysis. The external standard reference materials were Cpy-1 (natural chalcopyrite, δ34SV-CDT=4.2‰ ±0.3‰, 2SD) and Py-4 (natural pyrite, δ34SV-CDT = 1.7‰ ±0.3‰, 2SD) (Chen et al., 2017). The external reproducibility of the replicate sulfur isotope analyses is reported at the two-standard deviation (2SD) level. The analytical precision and accuracy of the sulfide measurements were monitored by repeated long-term analysis, and the results were generally better than 0.2‰. The S isotope composition was reported relative to the Vienna Canyon Diablo troilite (V-CDT, δ34SV-CDT). In detail, the sulfide measurement procedures followed the methods of Bao et al. (2017).
4.
Results
4.1
Major and trace element compositions of sediments
The major element compositions of the sediment samples show variations in SiO2 (55.35 wt% to 69.31 wt%), Al2O3 (10.01 wt% to 16.84 wt%), TFe2O3 (3.80 wt% to 6.75 wt%) and MnO (0.05 wt% to 0.07 wt%) (Table 2). The Al/(Al+Fe+Mn) ratios of the sediment samples are 0.64 at 166–167 cm, 0.66 at 312–315 cm, and 0.66 at 444–445 cm.
Table
2.
Major (wt%) and trace element (10−6) concentrations of sediments from the SOT
The trace element concentrations of the sediment samples show wide variations in Cu (18.6×10⁻⁶ to 73.7×10⁻⁶), Zn (76.9×10⁻⁶ to 356.0×10⁻⁶) and Pb (22.1×10⁻⁶ to 160.0×10⁻⁶) (Table 2). Three layers have relatively high Zn, Cu and Pb contents (especially Zn) (Fig. 2 and Table 2). At 167 cm, the Cu, Zn, and Pb concentrations in the sediment can reach 73.7×10⁻⁶, 356.0×10⁻⁶ and 16.0×10⁻⁶, respectively. The contents of Zn and Pb in the sediment are up to 246.0×10⁻⁶ and 92.1×10⁻⁶ at 313 cm and 321.0×10⁻⁶ and 121.0×10⁻⁶ at 445 cm, respectively.
Figure
2.
Plot showing the core and variations in the Cu, Zn and Pb concentrations.
The sulfide and sulfate minerals in the three Cu-Zn-Pb-rich layers of core HOBAB4-S2 contain mainly pyrite, some sphalerite, pyrrhotite, galena and chalcopyrite, arsenopyrite and radiated anhydrite aggregate (Figs 3 and 4). Sulfides in the sediment at 166–167 cm mostly consist of pyrite (Figs 4a–c) with some pyrrhotite and minor sphalerite, chalcopyrite (Figs 4a–c) and arsenopyrite (Fig. 4d). Morphologically, the sulfide particles are mainly granular (Fig. 3a), and euhedral pyrite separates exhibit an intergrown twinning texture (Fig. 3b). Pyrite occurs in the crystal forms of pentagonal dodecahedra (Fig. 3c) and cubes (Fig. 4b). Additionally, trace framboidal pyrite aggregates are observed in the core (Fig. 4c). Some pyrrhotite associated with arsenopyrite is found in the sediment at 166–167 cm (Fig. 4d). Sphalerite is intergrown with pyrite and occasionally tiny chalcopyrite particles (Fig. 4a). Sulfides in the sediment at 312–315 cm are mainly pyrite (Fig. 4e) with some pyrrhotite and sphalerite (Fig. 4f). Sphalerite coexists with pyrite and pyrrhotite. Sulfides from 444–445 cm are analogous to those from 312–315 cm and mainly contain pyrite, some sphalerite (Fig. 4g-h) and minor pyrrhotite (Fig. 4i).
Figure
3.
SEM image of representative sulfide and sulfate mineral morphologies separated from sediments in core HOBAB4-S2. a. Intergrowth sulfide aggregate is composed of nodular pyrite and minor sphalerite. b. Euhedral pyrite separates with an intergrowing twinning texture. c. Euhedral pyrite separates with a zonal texture. d. Euhedral pyrite with a crystal form of the pentagonal dodecahedron. e. Galena. f. Radiated anhydrite aggregates. Py: pyrite; Sph: sphalerite; Gn: galena; Anh: anhydrite.
Figure
4.
Photomicrographs of typical sulfide mineral assemblages from certain sediment layers in core HOBAB4-S2. The numbers represent δ34S measurements. (a–d) S2-3 separated from 166–167 cm: Intergrowths of pyrite with sphalerite and chalcopyrite (a); Cubic pyrite (b); Framboidal pyrite aggregates (c) and intergrowth of pyrrhotite with arsenopyrite (d). (e, f) S2-5 separated from 312–315 cm: Intergrowths of pyrite with sphalerite and chalcopyrite (e) and Intergrowth of pyrrhotite with subhedral sphalerite (f). (g–i) S2-8 separated from 444–445 cm: Intergrowth of euhedral pyrite with sphalerite (g); Inner chalcopyrite with pyrite on the surface and coexisting sphalerite (h); and Euhedral pyrrhotite (i). Py: pyrite; Cpy: chalcopyrite; Sph: sphalerite; Po: pyrrhotite; Apy: arsenopyrite; F-Py: framboidal pyrite.
The contents of major elements in pyrite are shown in Table 3. For pyrite from 166–167 cm, the contents of S and Fe are 51.88–53.54 wt% (average 52.86 wt%) and 45.64–47.98 wt% (average 47.54 wt%), respectively (Table 3). The Co/Ni and S/Fe atomic ratios are 1.45–31.33 and 1.90–1.97, respectively. The S and Fe contents of pyrite from 312–315 cm are 51.68–53.35 wt% (average 52.56 wt%) and 46.56–48.04 wt% (average 47.53 wt%), respectively (Table 3). The Co/Ni and S/Fe atomic ratios are 0.51–23.20 and 1.91–1.97, respectively. The S and Fe contents of pyrite from 444–445 cm are 50.84–53.26 (average 52.49 wt%) and 46.68–48.2 (average 47.49 wt%), respectively (Table 3). The Co/Ni and S/Fe atomic ratios are 1.86–11.89 and 1.88–1.99, respectively.
Table
3.
The major element contents (wt%) of pyrite and pyrrhotite from the OT, measured via EPMA
Depth /cm
Sample
Mineral
S
Fe
Pb
Ag
Cd
Sb
As
Se
Zn
Cu
Ni
Co
Au
Mn
Ti
Total
Fe/at%
S/Fe*
Co/Ni
166–167
S2-3-1
Py
52.95
47.71
−
0.01
0.01
0.02
0.01
−
−
−
0.04
0.06
−
−
−
100.82
1.94
1.50
S2-3-3-1
Py
53.01
47.93
−
0.01
0.02
−
−
0.03
0.02
−
0.01
0.07
0.10
−
−
101.19
1.94
7.00
S2-3-3-2
Py
53.29
47.77
−
−
−
−
0.02
−
0.02
−
−
0.08
0.07
−
0.03
101.27
1.95
S2-3-6-1
Py
53.42
48.73
−
−
−
−
0.02
0.02
0.05
−
−
0.08
−
−
−
102.30
1.92
S2-3-6-2
Py
53.17
47.54
−
−
−
−
−
−
0.03
0.05
−
0.09
0.06
−
−
100.94
1.96
S2-3-7-2
Py
51.88
47.54
−
−
−
−
0.01
−
−
−
0.03
0.10
−
0.02
−
99.58
1.91
3.33
S2-3-15-1
Py
52.31
47.80
−
−
−
0.01
−
0.01
0.06
0.02
−
0.13
−
0.01
−
100.35
1.92
S2-3-18
Po
37.69
63.33
−
−
−
−
−
0.01
−
0.14
0.01
0.09
−
−
−
101.27
49.01
1.03
S2-3-34
Py
53.06
47.68
−
−
0.03
0.03
0.05
0.03
−
0.04
−
0.12
0.04
−
−
101.09
1.95
S2-3-48
Py
53.10
47.80
−
0.01
0.02
−
0.07
−
0.05
0.04
0.01
0.08
−
0.08
0.03
101.28
1.94
8.00
S2-3-65-5
Py
52.25
46.31
−
0.01
0.02
0.08
1.06
−
0.02
0.14
0.01
0.13
0.01
−
−
100.03
1.97
13.00
S2-3-71
Py
53.03
47.05
−
−
0.01
0.03
0.13
0.08
0.01
−
0
0.01
−
0.02
−
100.45
1.97
S2-3-83
Py
52.13
47.96
−
−
−
0.04
−
−
−
0.01
0.02
0.06
0.11
0.02
0.01
100.35
1.90
3.00
S2-3-83
Py
53.54
47.98
−
−
−
0.03
0.01
−
0.03
0.07
0.03
0.07
−
−
−
101.77
1.95
2.33
S2-3-84
Po
38.11
62.93
−
0.02
−
−
−
0.01
0.01
0.29
0.03
0.12
0.03
−
−
101.53
48.5
1.06
S2-3-90
Py
53.21
47.38
−
−
−
0.02
0.02
−
−
0.03
−
0.09
0.02
−
0.01
100.78
1.97
S2-3-104
Py
53.39
47.86
−
0.06
0.01
0.03
−
0.05
0.07
0.02
0.02
0.17
−
0.02
−
101.70
1.95
8.50
312–315
S2-5-5
Py
53.35
48.04
−
−
0.04
0.03
−
−
0.09
0.06
0.03
0.07
−
0.02
0.01
101.74
1.94
2.30
S2-5-5
Py
53.28
48.02
−
−
0.03
0.04
−
−
0.07
−
0.01
0.10
0.06
0.02
0.02
101.68
1.94
10.00
S2-5-6-2
Py
52.91
47.70
−
−
−
0.01
0.02
0.02
0.05
0.02
0.01
−
0.08
−
0.01
100.92
1.94
S2-5-6-3
Py
52.80
47.70
−
0.01
−
−
0.02
0.02
−
−
0.02
0.10
−
0.03
−
100.69
1.94
5.00
S2-5-7-2
Py
52.49
47.43
−
−
−
0.01
−
−
−
0.01
0.04
0.09
0.02
−
−
100.09
1.94
2.25
S2-5-7-4
Py
52.09
47.09
−
−
0.01
0.02
−
−
0.06
0.01
0.02
0.08
−
0.01
0.01
99.42
1.94
4.00
S2-5-8-2
Py
52.33
47.47
−
0.02
−
−
−
−
−
0.05
0.02
0.06
−
0.04
−
99.99
1.93
3.00
S2-5-8-4
Py
51.68
47.27
−
−
−
−
−
−
0.08
0.02
0.02
0.05
0.06
0.07
0.02
99.30
1.91
2.50
S2-5-16-3
Py
52.23
47.54
−
−
−
−
−
−
0.17
−
0.13
0.07
0.03
0.03
−
100.19
1.92
0.54
S2-5-17
Po
38.00
62.52
−
−
0.04
−
−
−
−
0.22
−
0.15
0.14
−
−
101.06
48.42
1.06
S2-5-18
Py
52.82
47.87
−
0.08
−
0.02
−
0.02
0.06
−
−
0.06
−
0.01
−
100.92
1.93
S2-5-18-1
Py
52.30
46.56
0.02
−
−
0.01
−
−
0.08
−
0.01
0.12
−
−
−
99.07
1.97
12.00
S2-5-22
Py
52.38
47.71
−
−
−
−
0.06
−
−
0.06
0.02
0.09
0.03
0.14
−
100.48
1.92
4.50
S2-5-21-1
Po
38.57
61.89
−
−
0.02
−
−
−
0.11
0.12
0.05
0.12
−
−
−
100.88
47.81
1.09
444–445
S2-8-1-1
Py
53.26
48.01
−
0.04
0.02
−
0.01
0.04
0.01
−
0.04
0.09
0.01
−
−
101.52
1.94
2.25
S2-8-1-2
Py
53.21
48.20
−
−
−
−
−
0.01
−
−
0.04
0.08
0.04
−
−
101.58
1.93
2.00
S2-8-1
Py
50.84
47.32
−
0.01
−
0.01
0.10
−
0.04
−
0.01
0.06
0.02
−
0.01
98.42
1.88
6.00
S2-8-1
Py
51.46
47.96
−
−
−
−
0.14
0.03
0.06
0.03
0.01
0.07
0.02
−
−
99.77
1.88
7.00
S2-8-1-3
Py
53.09
46.68
−
0.02
−
−
−
−
0.01
−
0.01
0.11
−
0.02
0.05
99.98
1.99
11.00
S2-8-10-1
Py
52.68
47.13
−
−
−
0.01
0.14
−
−
0.05
−
0.07
0.09
0.11
−
100.26
1.96
S2-8-18-1
Po
38.13
61.42
−
−
0.01
−
−
0.04
0.25
0.14
0.05
0.08
0.07
−
0.01
100.19
47.85
1.08
S2-8-18-2
Po
38.43
61.60
−
0.03
−
−
0.05
−
0.04
0.13
0.04
0.13
−
0.03
0.01
100.48
47.77
1.09
S2-8-20-3
Py
52.70
47.91
−
0.04
0.02
0.02
0.03
−
0.11
−
0.03
0.10
0.02
0.03
−
101.01
1.92
3.33
S2-8-22-3
Py
51.99
46.93
0.11
−
0.09
0.02
0.06
0.02
0.02
0.04
−
0.06
−
0.02
0.02
99.37
1.94
S2-8-28-2
Py
53.06
47.18
−
−
−
0.02
0.04
−
−
0.04
−
0.09
0.09
0.01
−
100.52
1.97
S2-8-28-3
Py
52.59
47.55
−
−
0.04
0.05
0.04
−
0.21
−
−
0.06
0.04
0.01
−
100.58
1.94
S2-8-37-2
Po
38.37
62.07
−
0.04
0.04
−
−
0.01
0.12
0.19
−
0.10
0.10
−
−
101.05
47.99
1.08
Note: S/Fe* represents the atomic ratio of sulfur to iron. Py: pyrite; Po: pyrrhotite; − means below the detection limit.
The S and Fe contents of pyrrhotite from 166–167 cm are 37.69–38.11 wt% (average 37.9 wt%) and 62.93–63.33 wt% (average 63.13 wt%), respectively (Table 3). The Fe atomic percentages (at%) in pyrrhotite are 49.01%–48.50% (average 48.76%). The S and Fe contents of pyrrhotite from 312–315 cm are 38.00–38.57 wt% (average 38.29 wt%) and 61.89–62.52 wt% (average 62.21 wt%), respectively (Table 3). The Fe atomic percentages (at%) in pyrrhotite are 47.81–48.42 at% (average 48.33 at%). The S and Fe contents of pyrrhotite from 444–445 cm are 38.13–38.43 wt% (average 38.31 wt%) and 61.42–62.07 wt% (average 61.70 wt%), respectively (Table 3). The Fe atomic percentages in pyrrhotite are 47.77–47.99 at% (average 47.87 at%).
The sphalerite in thesesamples contains a certain amount of FeS (mol%) = (Fe–Cu)/(Fe–Cu + Zn); Fe, Cu, and Zn are in mol%; Wang et al., 2020) in addition to the major elements S and Zn. The FeS contents of sphalerite from 312–315 cm and 444–445 cm are 28.16–30.30 mol% and 25.84–31.29 mol%, respectively (Table 4).
Table
4.
The major element (wt%) and FeS contents (mol%) of sphalerite from the SOT as measured via EPMA
Depth/cm
Sample
Mineral
S
Zn
Fe
Cd
Sb
As
Se
Au
Cu
Co
Mn
Ti
Total
FeS/mol%
312–315
S2-5-16-4
Sph
34.20
47.28
18.08
0.08
0.05
0.01
0.02
0.06
0.43
0.01
0.12
−
100.33
30.30
S2-5-21-2
Sph
33.54
48.77
16.52
0.04
0.04
−
−
0.02
0.06
0.05
0.16
0.01
99.21
28.16
444–445
S2-8-28-4
Sph
33.23
49.09
15.37
0.05
−
0.01
−
0.02
0.41
0.05
0.75
−
99.00
26.20
S2-8-28-4
Sph
33.28
49.22
14.96
0.04
−
−
−
−
0.21
0.01
0.99
0.01
98.73
25.84
S2-8-37-1
Sph
33.03
46.25
18.95
0.06
0.01
0.04
−
0.01
0.92
−
0.28
0.03
99.57
31.29
Note: FeS (mol%)=(Fe–Cu)/(Fe–Cu+Zn); Fe, Cu, and Zn are in mol% (Wang et al., 2020). Sph: sphalerite; − means below the detection limit.
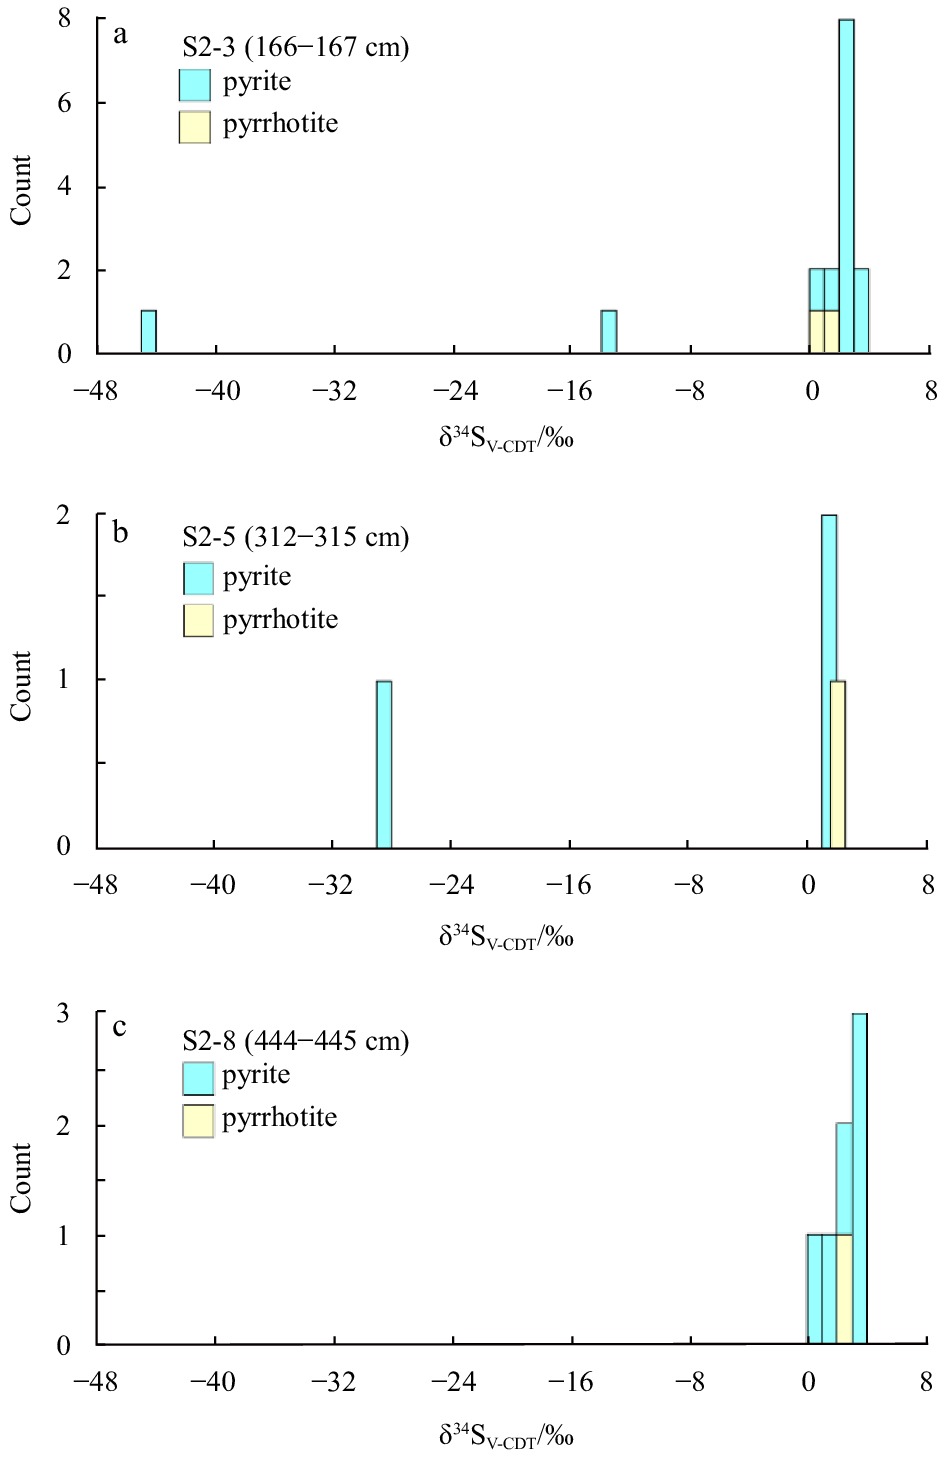
In total, 30 LA-ICP-MS spot analyses were performed on representative pyrite and pyrrhotite for sulfur isotope compositions, including 18 spots on pyrite and pyrrhotite from S2-3, four spots on pyrite and pyrrhotite from S2-5, and eight spots on pyrite and pyrrhotite from S2-8. The sulfur isotope dataset is provided in Fig. 5 and Table 5. In addition to three framboidal pyrite aggregates that have relatively low isotopic values of −13.22‰ and −44.06‰, most euhedral-granular pyrite minerals show narrow variable positive δ34S values (Fig. 4). Except for framboidal pyrite, the δ34S values of pyrite and pyrrhotite from S2-3 are 0.22‰–3.45‰ and 0.21‰–1.82‰, respectively (Fig. 5a). The δ34S values of pyrite in the S2-5 samples are 1.01‰–1.02‰, while the sulfur isotope composition of pyrrhotite is 2.09‰ (Fig. 5b). For pyrite from S2-8, the δ34S values range from 0.92‰ to 3.44‰, with an average of 2.41‰ (Fig. 5c).
Figure
5.
δ34S values of different pyrite and pyrrhotite samples from sediment core HOBAB4-S2 from the SOT. a. S2-3 selected from 166–167 cm; b. S2-5 selected from 312–315 cm; and c. S2-8 selected from 444–445 cm.
5.1
Identification of the hydrothermal signature in the sediments
5.1.1
The major and trace element compositions of sediments
The Al/(Al+Fe+Mn) ratio can be used to differentiate metalliferous sediments from nonmetalliferous sediments (Boström et al., 1969; Adachi et al., 1986; Rona, 1988; Li et al., 2014; Yu et al., 2018) with the assumption that Al is entirely derived from the continental crust. The observed values in the study sediments range from 0.64 to 0.66, which are slightly lower than that of the continental crust (0.69; Gibbs, 1986) and close to the value of hydrothermal sediments in the SOT (0.57; Yang et al., 2018). The large amount of terrigenous material accumulated in the sediments of the SOT (Diekmann et al., 2008; Li et al., 2009; Dou et al., 2016) may mask the signature of the small-volume hydrothermal fraction and increase the Al/(Al+Fe+Mn) index.
As hydrothermal-sensitive parameters, the trace elements Cu, Zn and Pb have been studied (Zhai et al., 2007; Yang et al., 2020). Cu, Zn and Pb show relatively consistent variations with depth, although the ranges differ (Fig. 2). Several Cu-Zn-Pb-rich layers are found in core HOBAB4-S2 (Fig. 2 and Table 2). Among them, three layers exhibit anomalous Zn, Cu and Pb contents in the sediment samples at 166–167 cm, 312–315 cm and 444–445 cm, which are much higher concentrations than those of surface sediments in the OT (Zn=91×10−6, Cu=23×10−6 and Pb=18×10−6; Zhao et al., 1997). Although the element contents of terrigenous clastic sediments may be affected by grain size in marginal sea basins, high element contents are mainly concentrated in relatively fine-grained sediments (Zhao, 1983). However, the Cu, Zn, and Pb contents in this core show poor correlations with the mean grain size (Supplementary information Fig. S1), indicating a weak influence of particle size on the element contents. The sediments are composed of coarse silt at 166–167 cm, while fine sand is the main component of the sediment at 312–315 cm and 444–445 cm. These features do not seem to be consistent with the influence of element granularity for terrigenous clastic sediments (Zhao, 1983). It is inferred that the enrichments in Cu-Pb-Zn in the HOBAB4-S2 sediments may not be related to terrestrial materials but that other metal-rich hydrothermal materials may be added. Some sulfide aggregates of pyrite, pyrrhotite, sphalerite and minor chalcopyrite are observed in these three layers (Figs 3 and 4). The occurrence of sphalerite may be the main factor for the high Zn contents. Therefore, it is suggested that additional metal-rich hydrothermal materials contribute to the core HOBAB4-S2 sediments.
5.1.2
Pyrite and its genesis
At least three types of pyrite in terms of shape, including disseminated cubic, pentagonal dodecahedral, and framboidal pyrite, are observed in core HOBAB4-S2 (Fig. 4). Pyrite in marine sediments may be derived from hydrothermal pyrite and low-temperature (<100°C) sedimentary pyrite (Hu et al., 2020). These two types have distinct differences in trace elements and sulfur isotopes. Thus, the chemical and sulfur isotope compositions of pyrite can be used to determine its genesis (Bajwah et al., 1987; Hu et al., 2019). Three framboidal pyrites have strong negative sulfur isotope values ranging from −13.22‰ to −44.06‰ (Fig. 5 and Table 5), which are similar to the δ34S values of sedimentary pyrite (–40‰ to –10‰) formed by low-temperature bacterial sulfate reduction (BSR) in modern sediments (Brunner and Bernasconi, 2005). This result suggests that framboidal pyrite may be the product of BSR-related sedimentary pyrite. Since pyrite with framboidal texture is rare in these samples, it is not discussed further. The origin of the euhedral pyrite is discussed.
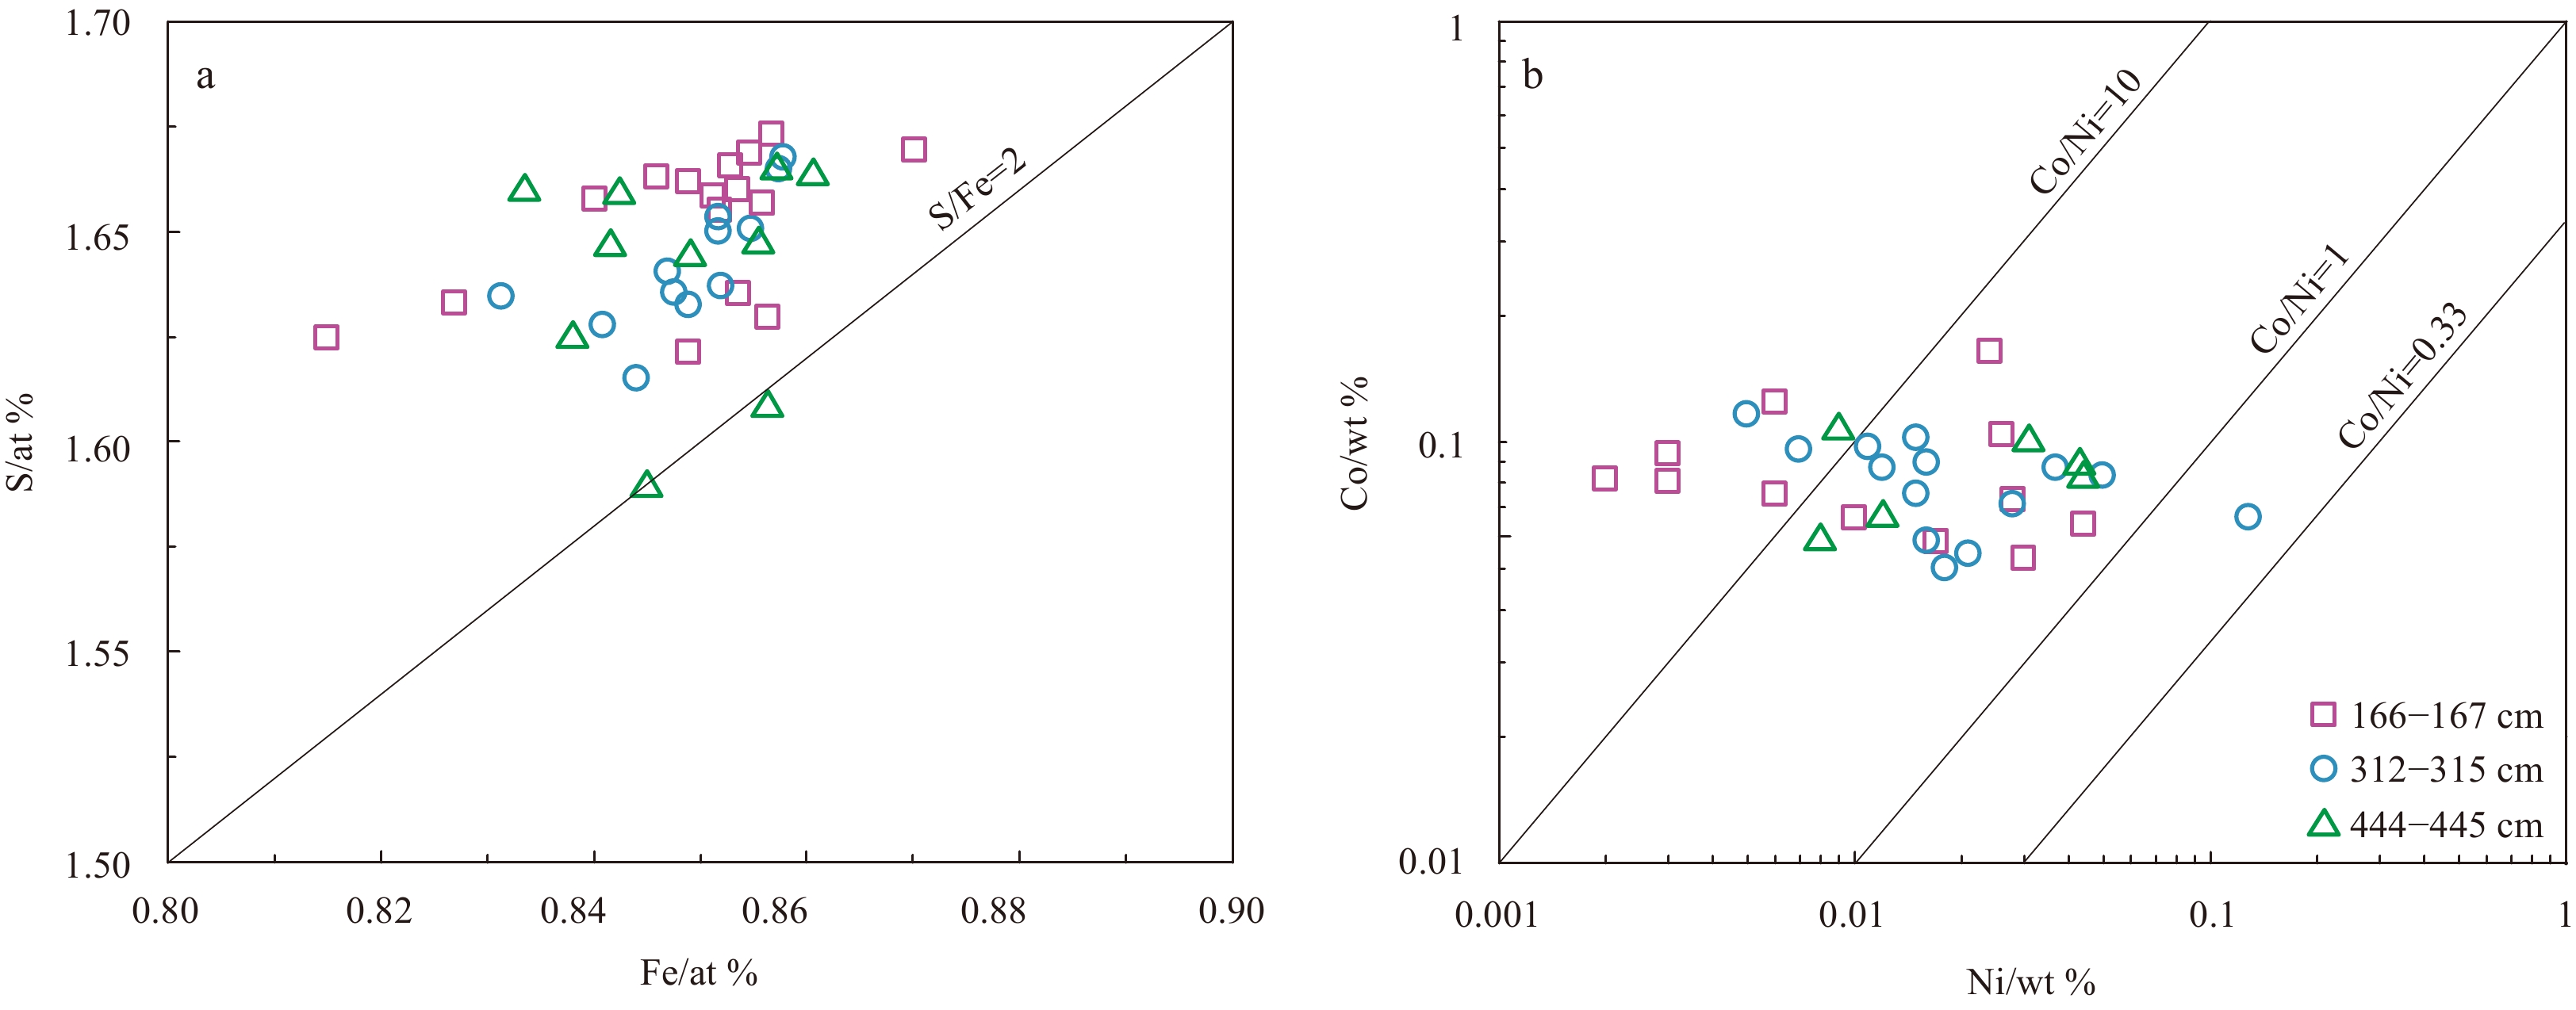
Many pyrites observed in this core are intergrown with sphalerite (Figs 4a, e, g and h), indicating that they are products of hydrothermal activity. The S/Fe atomic ratio in pyrite can be used to determine the formation conditions of this mineral (Mozgova et al., 2008). Generally, S/Fe is lower than its theoretical value (S/Fe*=2) for hydrothermal pyrite and close to 2 for sedimentary pyrite (Liu et al., 2018). The S/Fe atomic ratio values of pyrite at depths of 166–167 cm, 312–315 cm, and 444–445 cm are 1.91–1.97, 1.91–1.97, and 1.88–1.99, respectively, with corresponding average values of 1.95, 1.94 and 1.94 (Fig. 6a), indicating that pyrite in these samples has a hydrothermal origin.
Figure
6.
The Fe vs. S and Co vs. Ni diagrams for pyrite. a. Fe vs. S (at%) for pyrite. b. The plot of Co vs. Ni (wt%) for pyrite in core HOBAB4-S2 from the SOT.
Cobalt easily enters the pyrite lattice by isomorphism, whereas Ni is not enriched under high-temperature conditions (Tivey et al., 1995). The different physicochemical conditions for pyrite formation can cause changes in Co and Ni contents and different Co/Ni ratios (Raymond, 1996; Clark et al., 2004; Zhang et al., 2017). Therefore, the Co/Ni ratio in pyrite is regarded as an empirical indicator of the depositional environment (Clark et al., 2004; Koglin et al., 2010). In general, the Co/Ni ratio of hydrothermal pyrite is greater than 1 (Koglin et al., 2010; Zhang et al., 2017; Liu et al., 2018), whereas that of sedimentary pyrite is typically much lower (<1, average 0.63) (Price, 1972; Bajwah et al., 1987). The Co/Ni values of pyrite at depths of 166–167 cm, 312–315 cm, and 444–445 cm are 1.45–31.33, 0.51–23.20, and 1.86–11.89, respectively. Most of the pyrite samples exhibit Co/Ni ratios >1, and only one ratio is <1 (Fig. 6b), which indicates that the pyrite grains from the three layers in core HOBAB4-S2 are mainly of hydrothermal origin.
As mentioned above, the element compositions and sulfur isotope compositions of pyrite from 166–167 cm, 312–315 cm, and 444–445 cm in core HOBAB4-S2 show that most of the pyrite is hydrothermal pyrite and that framboidal pyrite is minor.
5.2
Chemical compositions of hydrothermal minerals and implications for mineralization conditions
Experimental studies of pyrite in hydrothermal systems show that pyrite with pentagonal dodecahedron shapes is dominant when the temperature is between 200°C and 300°C, while the cubic form of pyrite is dominant when the temperature is <200°C or >300–350°C (Cai and Zhou, 1994). Euhedral cubic pyrite (Fig. 4b) is the most common in these samples, followed by pentagonal dodecahedral and framboidal pyrites, reflecting moderate-high temperatures of mineralization. Moreover, the Co contents of pyrite formed at high temperatures, moderate temperatures and low temperatures are >0.1%, 0.01%–0.1% and less than 0.01%, respectively (Liu et al., 2018). The Co contents of pyrite from the sediments at 167–168 cm, 312–315 cm and 444–445 cm are 0.06%–0.17% (except for one below the detection limit), 0.05%–0.15% and 0.06%–0.13% (>0.01%), respectively, suggesting that pyrite was formed in moderate- and high-temperature environments.
The Fe atomic percentages in both monoclinic pyrrhotite and hexagonal pyrrhotite are 33.3–47.5 at% and 47.5–50.0 at%, respectively (Arnold, 1969). The Fe atomic percentages in pyrrhotite (47.77–49.01 at%) in this study fall within the range of values for hexagonal pyrrhotite, which indicates that the pyrrhotite in core HOBAB4-S2 is mainly hexagonal (Carpenter and Desborough, 1964). The formation temperature of hexagonal pyrrhotite was estimated to be at least 257°C based on the Fe atomic content in the Fe-S diagram according to Kissin and Scott (Kissin and Scott, 1982). Moreover, the precipitation of pyrrhotite in response to the low-sulfur fugacity (fS2) hydrothermal fluid indicates reducing conditions (Suzuki et al., 2008).
Fe2+ is known to substitute for Zn2+ in the sphalerite structure without destroying the lattice structure, and almost all sphalerite minerals contain a certain amount of Fe (Pring et al., 2008). Some hydrothermal conditions and mineralization processes can be inferred from the content of Fe in sphalerite (Scott, 1983; Koski et al., 1984). High-Fe sphalerite can reflect low-fS2 conditions (Scott and Barnes, 1971; Keith et al., 2014; Wang et al., 2020). Sphalerite in samples from core HOBAB4-S2 has high FeS contents (25.84–31.29 mol%) (Table 4), indicating low-fS2 reducing conditions.
The occurrence of euhedral pyrrhotite, pyrite with high Co contents, and high-Fe sphalerite in the samples from core HOBAB4-S2 indicates that the hydrothermal precipitates can be characterized by moderate-high temperatures and low-fS2 reducing environments. Low-fS2 mineral assemblages (e.g., pyrrhotite ± high-Fe sphalerite ± isocubanite) have been observed in hydrothermal precipitates from the Hakurei (Kawasumi and Chiba, 2017) and Tangyin HFs (Wang et al., 2020) in the OT. Sediment-rich mid-ocean ridge HFs such as the Guaymas Basin and Middle Valley rift are also low-fS2 reducing environments, resulting from increased H2 concentrations during the interaction between hydrothermal fluids and organic-rich sediments (Hannington et al., 1995; Rushdi and Simoneit, 2002; Kawasumi and Chiba, 2017).
5.3
The low sulfur isotope composition
The δ34S values of pyrite and pyrrhotite from 166–167 cm, 312–315 cm and 444–445 cm in core HOBAB4-S2 are 0.21‰–3.45‰, 1.01‰–2.09‰ and 0.92‰–3.44‰, except for three framboidal pyrites (δ34S=−13.22‰ to −44.06‰). These results are similar to the range of sulfur isotope values in sulfides from mature back-arc basins, such as the southern Mariana Basin (0.8‰ to 3.5‰) (Ikehata et al., 2015) and the North Fiji Basin (1.7‰ to 4.8‰, with an average value of 3.4‰) (Kim et al., 2006; Zeng et al., 2017b), and fall within the range of mid-ocean ridge (sediment-free) samples (−0.8‰ to +6.3‰, with an average value of 3.2‰) (Herzig et al., 1998). However, the values are lower than those of sulfides from the Iheya North Knoll HF in the MOT (8.8‰ to 10.5‰, with an average value of 9.9‰) (Ueno et al., 2003) and the Jade HF in the NOT (5.2‰ to 7.2‰, with an average value of 6.3‰) (Halbach et al., 1989; Zeng et al., 2002) (Table 6 and Fig. 7). This contrast indicates that the sulfur sources of the samples from the core are different from those in the Iheya North Knoll and Jade HFs.
Table
6.
Sulfur isotope values of sulfide samples from the SOT and other geological settings and δ34S values of other geological bodies. The values in brackets represent the average values
The δ34S values of the sulfides from the core (0.21‰–3.45‰) are all lower than those of island arc volcanic rocks (andesite and rhyolite, δ34S=5‰ to 7‰) (Ueda and Sakai, 1984; Woodhead et al., 1987) and seawater-derived S (δ34S=21.0‰±0.2‰) (Rees et al., 1978; Kim et al., 2006). Thus, a two-component mixing model of crustal host rocks and seawater cannot explain the anomalously low δ34S values (down to 0.21‰), indicating the addition of a light sulfur source. The possible causes for the low sulfur isotope compositions in hydrothermal systems include phase separation (Mckibben and Eldridge, 1990), the contribution of magmatic volatiles to hydrothermal systems, and biogenic sulfur (Liao et al., 2018; Meng et al., 2020).
Boiling of hydrothermal fluids and phase separation can lead to the loss of H2S and H2 to the vapor phase, changing the oxidation state of the residual fluid phase (Drummond and Ohmoto, 1985; Wang et al., 2020). Increasing the oxidation state would lead to lower δ34S values for H2S in the fluid phase (Mckibben and Eldridge, 1990). The temperature of hydrothermal fluid needs to reach approximately 342°C to boil at this depth (1 505 m) based on the calculation by Bischoff and Rosenbauer (Bischoff and Rosenbauer, 1985). The formation conditions of sulfides from core HOBAB4-S2 involved moderate-high temperature, and phase separation may not occur under such conditions. Moreover, the δ34S values of sulfides in the Jade (δ34S=6.0‰ to 7.3‰) (Lüders et al., 2001) and Iheya North Knoll HFs (δ34S=8.0‰ to 10.5‰) (Ueno et al., 2003), where subseafloor phase separation of hydrothermal fluid occurred, are positive and homogeneous. These δ34S values are all higher than those (δ34S=0.21‰ to 3.45‰) for sulfide samples from core HOBAB4-S2. Therefore, phase separation may not be a factor for the low δ34S values of sulfide.
The disproportionation of volatile SO2 into H2S and H2SO4 at temperatures below 400°C during magmatic degassing results in the formation of 32S-rich sulfide and 34S-rich sulfate, respectively (Herzig et al., 1998). The sulfur isotope fractionation between these phases may reach 16‰–21‰ (Kusakabe et al., 2000), with δ34S<5‰ for the generated sulfides and δ34S>5‰ for the sulfates. The sulfides from the Hine Hina HF in the Lau Basin (−7.7‰ to −2.8‰) (Herzig et al., 1998), the Susu Knolls (−8.0‰ to −3.9‰) and the PACMANUS HF (−0.8‰ to 5.6‰) (Kim et al., 2004; McDermott et al., 2015) in the Manus Basin have negative δ34S values. High-fS2 mineral assemblages (e.g., bornite ± low-Fe sphalerite ± enargite) indicating the incorporation of magmatic S have also been observed in these HFs (Moss and Scott, 2001; Kawasumi and Chiba, 2017). These results suggest that the sulfur in hydrothermal sulfides from these HFs was derived from magmatic SO2 disproportionation and generated H2S (Kim et al., 2004; de Ronde et al., 2005). The δ34S values of sulfide (0.21‰–3.44‰) in the core may be similar to those formed by the disproportionation of magmatic SO2. However, the low-fS2 reducing conditions indicated by low-fS2 mineral assemblages (e.g., high-Fe sphalerite ± pyrrhotite) are different from the high-fS2 conditions indicative of a contribution from magmatic SO2. Therefore, it isinferred that the contribution of magmatic volatiles to the hydrothermal fluid may not be responsible for the low sulfur isotope compositions of sulfides from core HOBAB4-S2.
In addition, biogenic sulfur is another source of light sulfur isotopes (Wang et al., 2020). Sulfate-reducing bacteria in sediments can reduce SO42− in seawater to S2−, resulting in sulfides with negative δ34S signatures (Rudnicki et al., 2001; Seal, 2006). Hydrothermal fluids can leach these previously formed sulfides from sedimentary strata during fluid-sediment interactions (LaFlamme et al., 2018; Wang et al., 2020). This mechanism has been used to explain the lighter δ34S values of hydrothermal pyrite away from the main vent site in the Iheya North Knoll HF (LaFlamme et al., 2018) and the low sulfur in the Tangyin HF (Wang et al., 2020). The sulfur isotope compositions of hydrothermal sulfides in the core (0.21‰–3.45‰) are similar to those of Fe-Zn-rich samples (δ34S=−1.32‰ to 4.97‰) reported by Wang et al. (2020). In addition, framboidal pyrite (δ34S=−13.22‰ to −44.06‰) formed by BSR (MacLean et al., 2008) is observed in core HOBAB4-S2 (Fig. 4c), which confirms the presence of sulfides formed by BSR in the sedimentary strata of the SOT. These sulfides are likely to be leached during high-temperature hydrothermal fluid circulation to provide a light sulfur component to the hydrothermal system. The results support the mechanism proposed by Wang et al. (2020) that biogenic sulfur may be responsible for the light sulfur isotopes of hydrothermal sulfide samples in the Tangyin HF.
5.4
The timing of possible hydrothermal activity in the Tangyin HF
Hydrothermal components in deep-sea sediments are mainly formed in two ways: (1) diffusion and settlement of hydrothermal materials from a neutrally buoyant plume (German et al., 1993; Mills et al., 1993; Dias et al., 2008) and lateral dispersion of the plume to form widely distributed hydrothermal sediments with high Fe (20.01–39.33 wt%) and Mn (4.00–13.65 wt%) contents (Barrett et al., 1987) and (2) mass wasting and erosion of sulfide debris formed near vents. Previous studies have shown that the particle size in the hydrothermal plume is no more than 70 μm (Gurvich, 2006), and the diameters of the majority of particles are less than 2 µm (Walker and Baker, 1988). However, the grain size of sulfides is greater than 63 µm. The contents of Fe (2.66–4.72 wt%) and Mn (0.04–0.05 wt%) in the sediments of core HOBAB4-S2 are lower than those in hydrothermal sediments formed by the dispersion of the hydrothermal plume. Therefore, sulfide materials may migrate and be transported by mass wasting and the vigorous settlement of sulfides from the hydrothermal plume.
Core HOBAB4-S2 is located south of the Tangyin HF and northwest of the Yonaguni Knoll IV HF (Fig. 1b). The plume disperses laterally in the direction of the bottom current to the south or southeast in the SOT (Chung and Hung, 2000), suggesting that the Tangyin HF is more likely to be the source of sulfides in this core. Samples of hydrothermal precipitates from the Tangyin HF are rich in Fe, Zn, Pb, silica and native sulfur (Zhang et al., 2019; Wang et al., 2020). Metalliferous sediments are enriched in pyrite, sphalerite, galena and minor pyrrhotite (Yang et al., 2020). The sulfides in the Yonaguni Knoll IV HF are mainly composed of sphalerite with minor pyrite and chalcopyrite (Zhang et al., 2019). Pyrite, galena, pyrrhotite and minor sphalerite are observed in the sediments of core HOBAB4-S2 (Figs 3 and 4), which are similar to those in the Tangyin HF. Therefore, the sulfides in the core are mainly derived from the nearby Tangyin HF and can shed light on the history of hydrothermal activity.
Three hydrothermal layers in core HOBAB4-S2 may record three episodes of hydrothermal activity in the Tangyin HF. According to the age model of the core, the deposition times of these layers are AD 1777–1815, AD 1600–1639 and AD 1445–1483 (Table 2). The time of hydrothermal activity slightly predates the deposition of sulfides in the sedimentary layers. Therefore, it can be deduced that Tangyin was active before AD 1445–1483, and at least three episodes of hydrothermal activity may have occurred since then.
6.
Conclusions
(1) Hydrothermal components from the Tangyin HF were identified in core HOBAB4-S2.
(2) The chemical compositions of sulfides suggest that those in the sediments formed at medium-high temperatures and under low-fS2 reducing conditions.
(3) The sulfide-rich samples in core HOBAB4-S2 exhibit a narrow range of δ34S values (0.21‰–3.45‰) with the lower δ34S values (down to 0.21‰), indicating that there may be another light sulfur source. The addition of biogenic sulfur may be the most likely reason for the lower sulfur isotope compositions.
(4) Hydrothermal activity began in the Tangyin HF before AD 1445−1483 and may have occurred at least three times since then.
Acknowledgements
We thank all the crew and scientists involved in the R/V Kexue during Cruise HOBAB4. We also thank two anonymous reviewers for their constructive comments and suggestions, Wenqiang Yang and Yongsheng Gai for the EPMA analysis of sulfides, Kaiyun Chen and Zhian Bao for the in situ sulfur isotope measurements of sulfides, and Xia Zhang for their help in revising the manuscript and responding to comments.
Adachi M, Yamamoto K, Sugisaki R. 1986. Hydrothermal chert and associated siliceous rocks from the northern Pacific their geological significance as indication od ocean ridge activity. Sedimentary Geology, 47(1–2): 125–148. doi: 10.1016/0037-0738(86)90075-8
[2]
Agarwal D K, Roy P, Prakash L S, et al. 2020. Hydrothermal signatures in sediments from eastern Southwest Indian Ridge 63°E to 68°E. Marine Chemistry, 218: 103732. doi: 10.1016/j.marchem.2019.103732
[3]
Arnold R G. 1969. Pyrrhotite phase relation below 304. Economic Geology, 64(4): 405–419. doi: 10.2113/gsecongeo.64.4.405
[4]
Bajwah Z U, Seccombe P K, Offler R. 1987. Trace element distribution, Co: Ni ratios and genesis of the Big Cadia iron-copper deposit, New South Wales, Australia. Mineralium Deposita, 22(4): 292–300. doi: 10.1007/BF00204522
[5]
Bao Zhian, Chen Lu, Zong Chunlei, et al. 2017. Development of pressed sulfide powder tablets for in situ sulfur and lead isotope measurement using LA-MC-ICP-MS. International Journal of Mass Spectrometry, 421: 255–262. doi: 10.1016/j.ijms.2017.07.015
[6]
Barrett T J, Taylor P N, Lugoqski J. 1987. Metalliferous sediments from DSDP Leg 92: The East Pacific Rise transect. Geochimica et Cosmochimica Acta, 51(9): 2241–2253. doi: 10.1016/0016-7037(87)90278-X
[7]
Beaulieu S E, Baker E T, German C R, et al. 2013. An authoritative global database for active submarine hydrothermal vent fields. Geochemistry, (11): 4892–4905. doi: 10.1002/2013GC004998
[8]
Beaulieu S E, Szafranski K. 2018. InterRidge Global Database of Active Submarine Hydrothermal Vent Fields. [WWW Document]. Electronic Publication Version 3.4. URLhttp://vents-data.interridge.org3.23.19[2018-10-8].
[9]
Bischoff J L, Rosenbauer R J. 1985. An empirical equation of state for hydrothermal seawater (3.2 percent NaCl). American Journal of Science, 285(8): 725–763. doi: 10.2475/ajs.285.8.725
[10]
Boström K, Peterson M N A, Joensuu O, et al. 1969. Aluminum-poor ferromanganoan sediments on active oceanic ridges. Journal of Geophysical Research, 74(12): 3261–3270. doi: 10.1029/JB074i012p03261
[11]
Brunner B, Bernasconi S M. 2005. A revised isotope fractionation model for dissimilatory sulfate reduction in sulfate reducing bacteria. Geochimica et Cosmochimica Acta, 69(20): 4759–4771. doi: 10.1016/j.gca.2005.04.015
[12]
Cai Yuanji. Zhou Mao. 1994. Crystalomorphological Characteristics of Pyrite in Hydrothermal Gold Deposit—An Experimental Study. Science in China Series B-Chemistry, (1): 119–131
[13]
Cao Hong, Sun Zhilei, Liu Changling, et al. 2018. Origin of natural sulfur-metal chimney in the Tangyin hydrothermal field, okinawa trough: constraints from rare earth element and sulfur isotopic compositions. China Geology, 1(2): 225–235. doi: 10.31035/cg2018023
[14]
Carpenter R H, Desborough G A. 1964. Range in solid solution and structure of naturally occurring troilite and pyrrhotite. American Mineralogist, 49(9−10): 1350–1365
[15]
Chen Lu, Chen Kaiyun, Bao Zhian, et al. 2017. Preparation of standards for in situ sulfur isotope measurement in sulfides using femtosecond laser ablation MC-ICP-MS. Journal of Analytical Atomic Spectrometry, 32(1): 107–116. doi: 10.1039/C6JA00270F
[16]
Chen Zuxing, Zeng Zhigang, Wang Xiaoyuan, et al. 2018. U-Th/He dating and chemical compositions of apatite in the dacite from the southwestern okinawa trough: implications for petrogenesis. Journal of Asian Earth Sciences, 161: 1–13. doi: 10.1016/j.jseaes.2018.04.032
[17]
Chung Y C, Hung G W. 2000. Particulate fluxes and transports on the slope between the southern East China Sea and the South Okinawa Trough. Continental Shelf Research, 20(4–5): 571–597. doi: 10.1016/S0278-4343(99)00086-2
[18]
Clark C, Grguric B, Mumm A S. 2004. Genetic implications of pyrite chemistry from the Palaeoproterozoic Olary Domain and overlying Neoproterozoic Adelaidean sequences, northeastern South Australia. Ore Geology Reviews, 25(3–4): 237–257. doi: 10.1016/j.oregeorev.2004.04.003
[19]
de Ronde C E J, Hannington M D, Stoffers P, et al. 2005. Evolution of a submarine magmatic-hydrothermal system: Brothers Volcano, Southern Kermadec Arc, New Zealand. Economic Geology, 100(6): 1097–1133. doi: 10.2113/gsecongeo.100.6.1097
[20]
Dias Á S, Mills R A, Taylor R N, et al. 2008. Geochemistry of a sediment push-core from the Lucky Strike hydrothermal field, Mid-Atlantic Ridge. Chemical Geology, 247(3–4): 339–351. doi: 10.1016/j.chemgeo.2007.10.015
[21]
Diekmann B, Hofmann J, Henrich R, et al. 2008. Detrital sediment supply in the southern Okinawa Trough and its relation to sea-level and Kuroshio dynamics during the late Quaternary. Marine Geology, 255(1–2): 83–95. doi: 10.1016/j.margeo.2008.08.001
[22]
Dou Yanguang, Yang Shouye, Shi Xuefa, et al. 2016. Provenance weathering and erosion records in southern Okinawa Trough sediments since 28 ka: Geochemical and Sr–Nd–Pb isotopic evidences. Chemical Geology, 425: 93–109. doi: 10.1016/j.chemgeo.2016.01.029
[23]
Drummond S E, Ohmoto H. 1985. Chemical evolution and mineral deposition in boiling hydrothermal systems. Economic Geology, 80(1): 126–147. doi: 10.2113/gsecongeo.80.1.126
[24]
Feely R A, Lewison M, Massoth G J, et al. 1987. Composition and dissolution of black smoker particulates from active vents on the Juan de Fuca Ridge. Journal of Geophysical Research:Solid Earth, 92(B11): 11347–11363. doi: 10.1029/JB092iB11p11347
[25]
Gena K, Chiba H, Kase K, et al. 2013. The tiger sulfide chimney, Yonaguni Knoll IV hydrothermal field, Southern Okinawa Trough, Japan: the first reported occurrence of Pt–Cu–Fe-Bearing Bismuthinite and Sn-Bearing Chalcopyrite in an active seafloor hydrothermal system. Resource Geology, 63(4): 360–370. doi: 10.1111/rge.12015
[26]
German C R, Higgs N C, Thomson J, et al. 1993. A geochemical study of metalliferous sediment from the TAG Hydrothermal Mound, 26°08′N, Mid-Atlantic Ridge. Journal of Geophysical Research: Solid Earth, 98(B6): 9683–9692. doi: 10.1029/92JB01705
[27]
Gibbs A K. 1986. The continental crust: its composition and evolution. Stuart Ross Taylor, Scott M. McLennan. The Journal of Geology, 94(4): 632–633. doi: 10.1086/629067
[28]
Glasby G P, Notsu K. 2003. Submarine hydrothermal mineralization in the Okinawa Trough, SW of Japan: an overview. Ore Geology Reviews, 23(3–4): 299–339. doi: 10.1016/j.oregeorev.2003.07.001
[29]
Guo Kun, Zhai Shikui, Wang Xiaoyuan, et al. 2018. The dynamics of the southern Okinawa Trough magmatic system: New insights from the microanalysis of the An contents, trace element concentrations and Sr isotopic compositions of plagioclase hosted in basalts and silicic rocks. Chemical Geology, 497: 146–161. doi: 10.1016/j.chemgeo.2018.09.002
[30]
Gurvich E G. 2006. Metalliferous Sediments of the World Ocean: Fundamental Theory of Deep-Sea Hydrothermal Sedimentation. Berlin, Germany: Springer
[31]
Halbach P, Nakamura K I, Wahsner M, et al. 1989. Probable modern analogue of Kuroko-type massive sulphide deposits in the Okinawa Trough back-arc basin. Nature, 338(6215): 496–499. doi: 10.1038/338496a0
[32]
Halbach P, Pracejus B, Maerten A. 1993. Geology and mineralogy of massive sulfide ores from the central Okinawa Trough, Japan. Economic Geology, 88(8): 2210–2225. doi: 10.2113/gsecongeo.88.8.2210
[33]
Hannington M D, Jonasson I R, Herzig P M, et al. 1995. Physical and chemical processes of seafloor mineralization at mid-ocean ridges. Seafloor Hydrothermal Systems: Physical, 115–157
[34]
Herzig P M, Hannington M D, Arribas Jr A. 1998. Sulfur isotopic composition of hydrothermal precipitates from the Lau back-arc: implications for magmatic contributions to seafloor hydrothermal systems. Mineralium Deposita, 33(3): 226–237. doi: 10.1007/s001260050143
[35]
Hu Xinkai, Tang Li, Zhang Shouting, et al. 2019. In situ trace element and sulfur isotope of pyrite constrain ore genesis in the Shapoling molybdenum deposit, East Qinling Orogen, China. Ore Geology Reviews, 105: 123–136. doi: 10.1016/j.oregeorev.2018.12.019
[36]
Hu Yongliang, Wang Wei, Zhou Chuanming. 2020. Morphologic and Isotopic Characteristics of Sedimentary Pyrite: A case study from deepwater facies, Ediacaran Lantian Formation in South China. Acta Sedimentologica Sinica, 38(1): 138–149
[37]
Ikehata K, Suzuki R, Shimada K, et al. 2015. Mineralogical and geochemical characteristics of hydrothermal minerals collected from hydrothermal vent fields in the southern mariana spreading center. In: Ishibashi J, Okino K, Sunamura M, eds. Subseafloor Biosphere Linked to Hydrothermal Systems. Tokyo, Japan: Springer, 275–287
[38]
Ishibashi J, Ikegami F, Tsuji T, et al. 2015. Hydrothermal activity in the Okinawa Trough back-arc basin: geological background and hydrothermal mineralization. In: Ishibashi J, Okino K, Sunamura M, eds. Subseafloor Biosphere Linked to Hydrothermal Systems. Tokyo, Japan: Springer, 337–359
[39]
Ishibashi J, Sano Y, Wakita H, et al. 1995. Helium and carbon geochemistry of hydrothermal fluids from the Mid-Okinawa Trough Back Arc Basin, southwest of Japan. Chemical Geology, 123(1–4): 1–15. doi: 10.1016/0009-2541(95)00051-M
[40]
Kawasumi S, Chiba H. 2017. Redox state of seafloor hydrothermal fluids and its effect on sulfide mineralization. Chemical Geology, 451: 25–37. doi: 10.1016/j.chemgeo.2017.01.001
[41]
Keith M, Haase K M, Schwarz-Schampera U, et al. 2014. Effects of temperature, sulfur, and oxygen fugacity on the composition of sphalerite from submarine hydrothermal vents. Geology, 42(8): 699–702. doi: 10.1130/G35655.1
[42]
Kim J, Lee I, Halbach P, et al. 2006. Formation of hydrothermal vents in the North Fiji Basin: Sulfur and lead isotope constraints. Chemical Geology, 233(3–4): 257–275. doi: 10.1016/j.chemgeo.2006.03.011
[43]
Kim J, Lee I, Lee K Y. 2004. S, Sr, and Pb isotopic systematics of hydrothermal chimney precipitates from the Eastern Manus Basin, western Pacific: evaluation of magmatic contribution to hydrothermal system. Journal of Geophysical Research: Solid Earth, 109(B12): B12210. doi: 10.1029/2003JB002912
[44]
Kimura M, Uyeda S, Kato Y, et al. 1988. Active hydrothermal mounds in the Okinawa Trough backarc basin, Japan. Tectonophysics, 145(3–4): 319–324. doi: 10.1016/0040-1951(88)90203-X
[45]
Kissin S A, Scott S D. 1982. Phase relations involving pyrrhotite below 350 degrees C. Economic Geology, 77(7): 1739–1754. doi: 10.2113/gsecongeo.77.7.1739
[46]
Klingelhoefer F, Lee C S, Lin Jingyi, et al. 2009. Structure of the southernmost Okinawa Trough from reflection and wide-angle seismic data. Tectonophysics, 466(3–4): 281–288. doi: 10.1016/j.tecto.2007.11.031
[47]
Koglin N, Frimmel H E, Minter W E L, et al. 2010. Trace-element characteristics of different pyrite types in Mesoarchaean to Palaeoproterozoic placer deposits. Mineralium Deposita, 45(3): 259–280. doi: 10.1007/s00126-009-0272-0
[48]
Koski R A, Clague D A, Oudin E. 1984. Mineralogy and chemistry of massive sulfide deposits from the Juan de Fuca Ridge. Geological Society of America Bulletin, 95(8): 930–945. doi: 10.1130/0016-7606(1984)95<930:MACOMS>2.0.CO;2
[49]
Kuhn T, Burger H, Castradori D, et al. 2000. Volcanic and hydrothermal history of ridge segments near the Rodrigues Triple Junction (Central Indian Ocean) deduced from sediment geochemistry. Marine Geology, 169(3–4): 391–409. doi: 10.1016/S0025-3227(00)00080-3
[50]
Kusakabe M, Komoda Y, Takano B, et al. 2000. Sulfur isotopic effects in the disproportionation reaction of sulfur dioxide in hydrothermal fluids: implications for the δ34S variations of dissolved bisulfate and elemental sulfur from active crater lakes. Journal of Volcanology and Geothermal Research, 97(1–4): 287–307. doi: 10.1016/S0377-0273(99)00161-4
[51]
LaFlamme C, Hollis S P, Jamieson J W, et al. 2018. Three-dimensional spatially constrained sulfur isotopes highlight processes controlling sulfur cycling in the near surface of the iheya north hydrothermal system, Okinawa Trough. Geochemistry, (8): 2798–2812. doi: 10.1029/2018GC007499
[52]
Lee C S, Shor Jr G G, Bibee L D, et al. 1980. Okinawa Trough: origin of a back-arc basin. Marine Geology, 35(1–3): 219–241. doi: 10.1016/0025-3227(80)90032-8
[53]
Li Chuanshun, Jiang Bo, Li Anchun, et al. 2009. Sedimentation rates and provenance analysis in the Southwestern Okinawa Trough since the mid-Holocene. Chinese Science Bulletin, 54(7): 1234–1242. doi: 10.1007/s11434-009-0010-0
[54]
Li Hongzhong, Zhai Mingguo, Zhang Lianchang, et al. 2014. Distribution, microfabric, and geochemical characteristics of siliceous rocks in central orogenic belt, China: implications for a hydrothermal sedimentation model. The Scientific World Journal, 2014: 780910. doi: 10.1155/2014/780910
[55]
Liao Shili, Tao Chunhui, Li Huaiming, et al. 2018. Bulk geochemistry, sulfur isotope characteristics of the Yuhuang-1 hydrothermal field on the ultraslow-spreading Southwest Indian Ridge. Ore Geology Reviews, 96: 13–27. doi: 10.1016/j.oregeorev.2018.04.007
[56]
Liu Zhongfa, Shao Yongjun, Zhou Haodi, et al. 2018. Major and trace element geochemistry of pyrite and pyrrhotite from stratiform and lamellar orebodies: implications for the ore genesis of the dongguashan copper (gold) deposit, Eastern China. Minerals, 8(9): 380. doi: 10.3390/min8090380
[57]
Lüders V, Pracejus B, Halbach P. 2001. Fluid inclusion and sulfur isotope studies in probable modern analogue Kuroko-type ores from the JADE hydrothermal field (Central Okinawa Trough, Japan). Chemical Geology, 173(1–3): 45–58. doi: 10.1016/S0009-2541(00)00267-9
[58]
MacLean L C W, Tyliszczak T, Gilbert P U P A, et al. 2008. A high-resolution chemical and structural study of framboidal pyrite formed within a low-temperature bacterial biofilm. Geobiology, 6(5): 471–480. doi: 10.1111/j.1472-4669.2008.00174.x
[59]
McDermott J M, Ono S, Tivey M K, et al. 2015. Identification of sulfur sources and isotopic equilibria in submarine hot-springs using multiple sulfur isotopes. Geochimica et Cosmochimica Acta, 160: 169–187. doi: 10.1016/j.gca.2015.02.016
[60]
Mckibben M A, Eldridge C S. 1990. Radical sulfur isotope zonation of pyrite accompanying boiling and epithermal gold deposition; a SHRIMP study of the Valles Caldera, New Mexico. Economic Geology, 85(8): 1917–1925. doi: 10.2113/gsecongeo.85.8.1917
[61]
Meng Xingwei, Li Xiaohu, Chu Fengyou, et al. 2020. Trace element and sulfur isotope compositions for pyrite across the mineralization zones of a sulfide chimney from the East Pacific Rise (1-2°S). Ore Geology Reviews, 116: 103209. doi: 10.1016/j.oregeorev.2019.103209
[62]
Mills R, Elderfield H, Thomson J. 1993. A dual origin for the hydrothermal component in a metalliferous sediment core from the Mid-Atlantic Ridge. Journal of Geophysical Research: Solid Earth, 98(B6): 9671–9681. doi: 10.1029/92JB01414
[63]
Moss R, Scott S D. 2001. Geochemistry and mineralogy of gold-rich hydrothermal precipitates from the eastern Manus Basin, Papua New Guinea. The Canadian Mineralogist, 39(4): 957–978. doi: 10.2113/ gscanmin.39.4.957
[64]
Mozgova N N, Trubkin N V, Borodaev Y S, et al. 2008. Mineralogy of massive sulfides from the Ashadze hydrothermal field, 13°N, Mid-Atlantic Ridge. The Canadian Mineralogist, 46(3): 545–567. doi: 10.3749/canmin.46.3.545
[65]
Price B J. 1972. Minor elements in pyrites from the smithers map area, bc and exploration applications of minor element studies [dissertation]. Columbia: University of British Columbia
[66]
Pring A, Tarantino S C, Tenailleau C, et al. 2008. The crystal chemistry of Fe-bearing sphalerites: an infrared spectroscopic study. American Mineralogist, 93(4): 591–597. doi: 10.2138/am.2008.2610
[67]
Raymond O L. 1996. Pyrite composition and ore genesis in the Prince Lyell copper deposit, Mt Lyell mineral field, western Tasmania, Australia. Ore Geology Reviews, 10(3−6): 231–250. doi: 10.1016/0169-1368(95)00025-9
[68]
Rees C E, Jenkins W J, Monster J. 1978. The sulphur isotopic composition of ocean water sulphate. Geochimica et Cosmochimica Acta, 42(4): 377–381. doi: 10.1016/0016-7037(78)90268-5
[69]
Rona P A. 1988. Hydrothermal mineralization at oceanic ridges. Canadian Mineralogist, 26(3): 431–465
[70]
Rudnicki M D, Elderfield H, Spiro B. 2001. Fractionation of sulfur isotopes during bacterial sulfate reduction in deep ocean sediments at elevated temperatures. Geochimica et Cosmochimica Acta, 65(5): 777–789. doi: 10.1016/S0016-7037(00)00579-2
[71]
Rushdi A I, Simoneit B R T. 2002. Hydrothermal alteration of organic matter in sediments of the Northeastern Pacific Ocean: Part 1. middle valley, juan de fuca ridge. Applied Geochemistry, 17(11): 1401–1428. doi: 10.1016/S0883-2927(02)00109-9
[72]
Sakai H, Des Marais D J, Ueda A, et al. 1984. Concentrations and isotope ratios of carbon, nitrogen and sulfur in ocean-floor basalts. Geochimica et Cosmochimica Acta, 48(12): 2433–2441. doi: 10.1016/0016-7037(84)90295-3
[73]
Scott S. 1983. Chemical behaviour of sphalerite and arsenopyrite in hydrothermal and metamorphic environments. Mineralogical Magazine, 47(345): 427–435. doi: 10.1180/minmag.1983.047.345.03
[74]
Scott S D, Barnes H L. 1971. Sphalerite geothermometry and geobarometry. Economic Geology, 66(4): 653–669. doi: 10.2113/gsecongeo.66.4.653
[75]
Seal II R R. 2006. Sulfur isotope geochemistry of sulfide minerals. Reviews in Mineralogy and Geochemistry, 61(1): 633–677. doi: 10.2138/rmg.2006.61.12
[76]
Shang Luning, Zhang Xunhua, Jia Yonggang, et al. 2017. Late Cenozoic evolution of the East China continental margin: insights from seismic, gravity, and magnetic analyses. Tectonophysics, 698: 1–15. doi: 10.1016/j.tecto.2017.01.003
[77]
Shinjo R. 1998. Petrochemistry and tectonic significance of the emerged late Cenozoic basalts behind the Okinawa Troughs Ryukyu arc system. Journal of Volcanology and Geothermal Research, 80(1–2): 39–53. doi: 10.1016/S0377-0273(97)00042-5
[78]
Shinjo R, Chung S L, Kato Y, et al. 1999. Geochemical and Sr-Nd isotopic characteristics of volcanic rocks from the Okinawa Trough and Ryukyu Arc: implications for the evolution of a young, intracontinental back arc basin. Journal of Geophysical Research: Solid Earth, 104(B5): 10591–10608. doi: 10.1029/1999JB900040
[79]
Shinjo R, Kato Y. 2000. Geochemical constraints on the origin of bimodal magmatism at the Okinawa Trough, an incipient back-arc basin. Lithos, 54(3–4): 117–137. doi: 10.1016/S0024-4937(00)00034-7
[80]
Shu Yunchao, Nielsen S G, Zeng Zhigang, et al. 2017. Tracing subducted sediment inputs to the Ryukyu arc-Okinawa Trough system: evidence from thallium isotopes. Geochimica et Cosmochimica Acta, 217: 462–491. doi: 10.1016/j.gca.2017.08.035
[81]
Sibuet J C, Hsu S K, Shyu C T, et al. 1995. Structural and kinematic evolutions of the Okinawa Trough backarc basin. In: Taylor B, ed. Backarc Basins. Boston, MA, USA: Springer, 343–379
[82]
Sibuet J C, Letouzey J, Barbier F, et al. 1987. Back arc extension in the Okinawa Trough. Journal of Geophysical Research: Solid Earth, 92(B13): 14041–14063. doi: 10.1029/JB092iB13p14041
[83]
Suzuki R, Ishibashi J I, Nakaseama M, et al. 2008. Diverse range of mineralization induced by phase separation of hydrothermal fluid: case study of the yonaguni knoll iv hydrothermal field in the okinawa trough back-arc basin. Resource Geology, 58(3): 267–288. doi: 10.1111/j.1751-3928.2008.00061.x
[84]
Tivey M K, Humphris S E, Thompson G, et al. 1995. Deducing patterns of fluid flow and mixing within the TAG active hydrothermal mound using mineralogical and geochemical data. Journal of Geophysical Research:Solid Earth, 100(B7): 12527–12555. doi: 10.1029/95JB00610
[85]
Ueda A, Sakai H. 1984. Sulfur isotope study of Quaternary volcanic rocks from the Japanese Islands Arc. Geochimica et Cosmochimica Acta, 48(9): 1837–1848. doi: 10.1016/0016-7037(84)90037-1
[86]
Ueno H, Hamasaki H, Murakawa Y, et al. 2003. Ore and gangue minerals of sulfide chimneys from the North Knoll, Iheya Ridge, Okinawa Trough, Japan. JAMSTEC Journal of Deep Sea Research, 22: 49–62
[87]
Walker S L, Baker E T. 1988. Particle-size distributions within hydrothermal plumes over the Juan de Fuca Ridge. Marine Geology, 78(3–4): 217–226. doi: 10.1016/0025-3227(88)90110-7
[88]
Wang Hao, Chu Fengyou, Li Xiaohu, et al. 2020. Mineralogy, geochemistry, and Sr–Pb and in situ S isotopic compositions of hydrothermal precipitates from the Tangyin hydrothermal field, southern Okinawa Trough: evaluation of the contribution of magmatic fluids and sediments to hydrothermal systems. Ore Geology Reviews, 126: 103742. doi: 10.1016/j.oregeorev.2020.103742
[89]
Wang Long, Yu Min, Liu Yan, et al. 2018. Comparative analyses of the bacterial community of hydrothermal deposits and seafloor sediments across Okinawa Trough. Journal of Marine Systems, 180: 162–172. doi: 10.1016/j.jmarsys.2016.11.012
[90]
Woodhead J D, Harmon R S, Fraser D G. 1987. O, S, Sr, and Pb isotope variations in volcanic rocks from the Northern Mariana Islands: implications for crustal recycling in intra-oceanic arcs. Earth and Planetary Science Letters, 83(1–4): 39–52. doi: 10.1016/0012-821X(87)90049-5
[91]
Yang Baoju, Liu Jihua, Shi Xuefa, et al. 2020. Mineralogy and sulfur isotope characteristics of metalliferous sediments from the Tangyin hydrothermal field in the southern Okinawa Trough. Ore Geology Reviews, 120: 103464. doi: 10.1016/j.oregeorev.2020.103464
[92]
Yang Baoju, Wu Yonghua, Liu Jihua, et al. 2018. Elemental geochemistry of surface sediments in Okinawa Trough and its implications for provenance and hydrothermal activity. Marine Geology & Quaternary Geology, 38(2): 25–37
[93]
Yu Zenghui, Li Huaiming, Li Mengxing, et al. 2018. Hydrothermal signature in the axial-sediments from the Carlsberg Ridge in the northwest Indian Ocean. Journal of Marine Systems, 180: 173–181. doi: 10.1016/j.jmarsys.2016.11.013
[94]
Zeng Zhigang, Chen Shuai, Ma Yao, et al. 2017a. Chemical compositions of mussels and clams from the Tangyin and Yonaguni Knoll IV hydrothermal fields in the southwestern Okinawa Trough. Ore Geology Reviews, 87: 172–191. doi: 10.1016/j.oregeorev.2016.09.015
[95]
Zeng Zhigang, Li Jun, Jiang Fuqing, et al. 2002. Sulfur isotopic composition of seafloor hydrothermal sediment from the Jade hydrothermal field in the central Okinawa Trough and its geological significance. Haiyang Xuebao, 21(3): 395–405
[96]
Zeng Zhigang, Ma Yao, Chen Shuai, et al. 2017b. Sulfur and lead isotopic compositions of massive sulfides from deep-sea hydrothermal systems: implications for ore genesis and fluid circulation. Ore Geology Reviews, 87: 155–171. doi: 10.1016/j.oregeorev.2016.10.014
[97]
Zhai Shikui, Yu Zenghui, Du Tongjun. 2007. Elemental geochemical records of seafloor hydrothermal activities in the sediments from the Okinawa Trough. Acta Oceanologica Sinica, 26(4): 53–62. doi: 10.1109/UT.2007.370822
[98]
Zhang Yu, Shao Yongjun, Chen Huayong, et al. 2017. A hydrothermal origin for the large Xinqiao Cu-S-Fe deposit, Eastern China: evidence from sulfide geochemistry and sulfur isotopes. Ore Geology Reviews, 88: 534–549. doi: 10.1016/j.oregeorev.2016.08.002
[99]
Zhang Xia, Zhai Shikui, Yu Zenghui, et al. 2018. Mineralogy and geological significance of hydrothermal deposits from the Okinawa Trough. Journal of Marine Systems, 180: 124–131. doi: 10.1016/j.jmarsys.2016.11.007
[100]
Zhang Xia, Zhai Shikui, Yu Zenghui, et al. 2019. Zinc and lead isotope variation in hydrothermal deposits from the Okinawa Trough. Ore Geology Reviews, 111: 102944. doi: 10.1016/j.oregeorev.2019.102944
[101]
Zhao Yiyang. 1983. Some geochemical patterns of shelf sediments of the China Seas. Chinese Journal of Geology, 18(4): 307–314
[102]
Zhao Yiyang, Zhai Shikui, Li Yongzhi, et al. 1997. New records of submarine hydrothermal activity in middle part of the Okinawa Trough. Chinese Science Bulletin, 42(7): 574–577. doi: 10.1007/BF03182621
Yuan Dang, Chuanshun Li, Xuefa Shi, et al. Metallogenetic process of Xunmei hydrothermal field (26°S), South Mid-Atlantic Ridge: Constraints from in-situ sulfur isotope and trace elements of sulfides. Marine Geology, 2023, 466: 107182. doi:10.1016/j.margeo.2023.107182
2.
Jingyi Chang, Yuanyuan Li, Hailong Lu. The Morphological Characteristics of Authigenic Pyrite Formed in Marine Sediments. Journal of Marine Science and Engineering, 2022, 10(10): 1533. doi:10.3390/jmse10101533
Table
6.
Sulfur isotope values of sulfide samples from the SOT and other geological settings and δ34S values of other geological bodies. The values in brackets represent the average values
Figure 1. Bathymatric map of the Okinawa Trough (OT). a. The locations of the samples and hydrothermal fields in the OT (bathymetric map from http://www.geomapapp.org/index.htm). b. Topography of the Tangyin and Yonaguni Knoll IV HFs and sampling location of core HOBAB4-S2 in the southern Okinawa Trough (SOT) (hydrothermal vent data from Beaulieu et al. (2013) and Tangyin HF data from Zeng et al. (2017a)). The bottom flow directions are from several months of mooring observations (Chung and Hung, 2000).
Figure 2. Plot showing the core and variations in the Cu, Zn and Pb concentrations.
Figure 3. SEM image of representative sulfide and sulfate mineral morphologies separated from sediments in core HOBAB4-S2. a. Intergrowth sulfide aggregate is composed of nodular pyrite and minor sphalerite. b. Euhedral pyrite separates with an intergrowing twinning texture. c. Euhedral pyrite separates with a zonal texture. d. Euhedral pyrite with a crystal form of the pentagonal dodecahedron. e. Galena. f. Radiated anhydrite aggregates. Py: pyrite; Sph: sphalerite; Gn: galena; Anh: anhydrite.
Figure 4. Photomicrographs of typical sulfide mineral assemblages from certain sediment layers in core HOBAB4-S2. The numbers represent δ34S measurements. (a–d) S2-3 separated from 166–167 cm: Intergrowths of pyrite with sphalerite and chalcopyrite (a); Cubic pyrite (b); Framboidal pyrite aggregates (c) and intergrowth of pyrrhotite with arsenopyrite (d). (e, f) S2-5 separated from 312–315 cm: Intergrowths of pyrite with sphalerite and chalcopyrite (e) and Intergrowth of pyrrhotite with subhedral sphalerite (f). (g–i) S2-8 separated from 444–445 cm: Intergrowth of euhedral pyrite with sphalerite (g); Inner chalcopyrite with pyrite on the surface and coexisting sphalerite (h); and Euhedral pyrrhotite (i). Py: pyrite; Cpy: chalcopyrite; Sph: sphalerite; Po: pyrrhotite; Apy: arsenopyrite; F-Py: framboidal pyrite.
Figure 5. δ34S values of different pyrite and pyrrhotite samples from sediment core HOBAB4-S2 from the SOT. a. S2-3 selected from 166–167 cm; b. S2-5 selected from 312–315 cm; and c. S2-8 selected from 444–445 cm.
Figure 6. The Fe vs. S and Co vs. Ni diagrams for pyrite. a. Fe vs. S (at%) for pyrite. b. The plot of Co vs. Ni (wt%) for pyrite in core HOBAB4-S2 from the SOT.


 DownLoad:
 DownLoad:


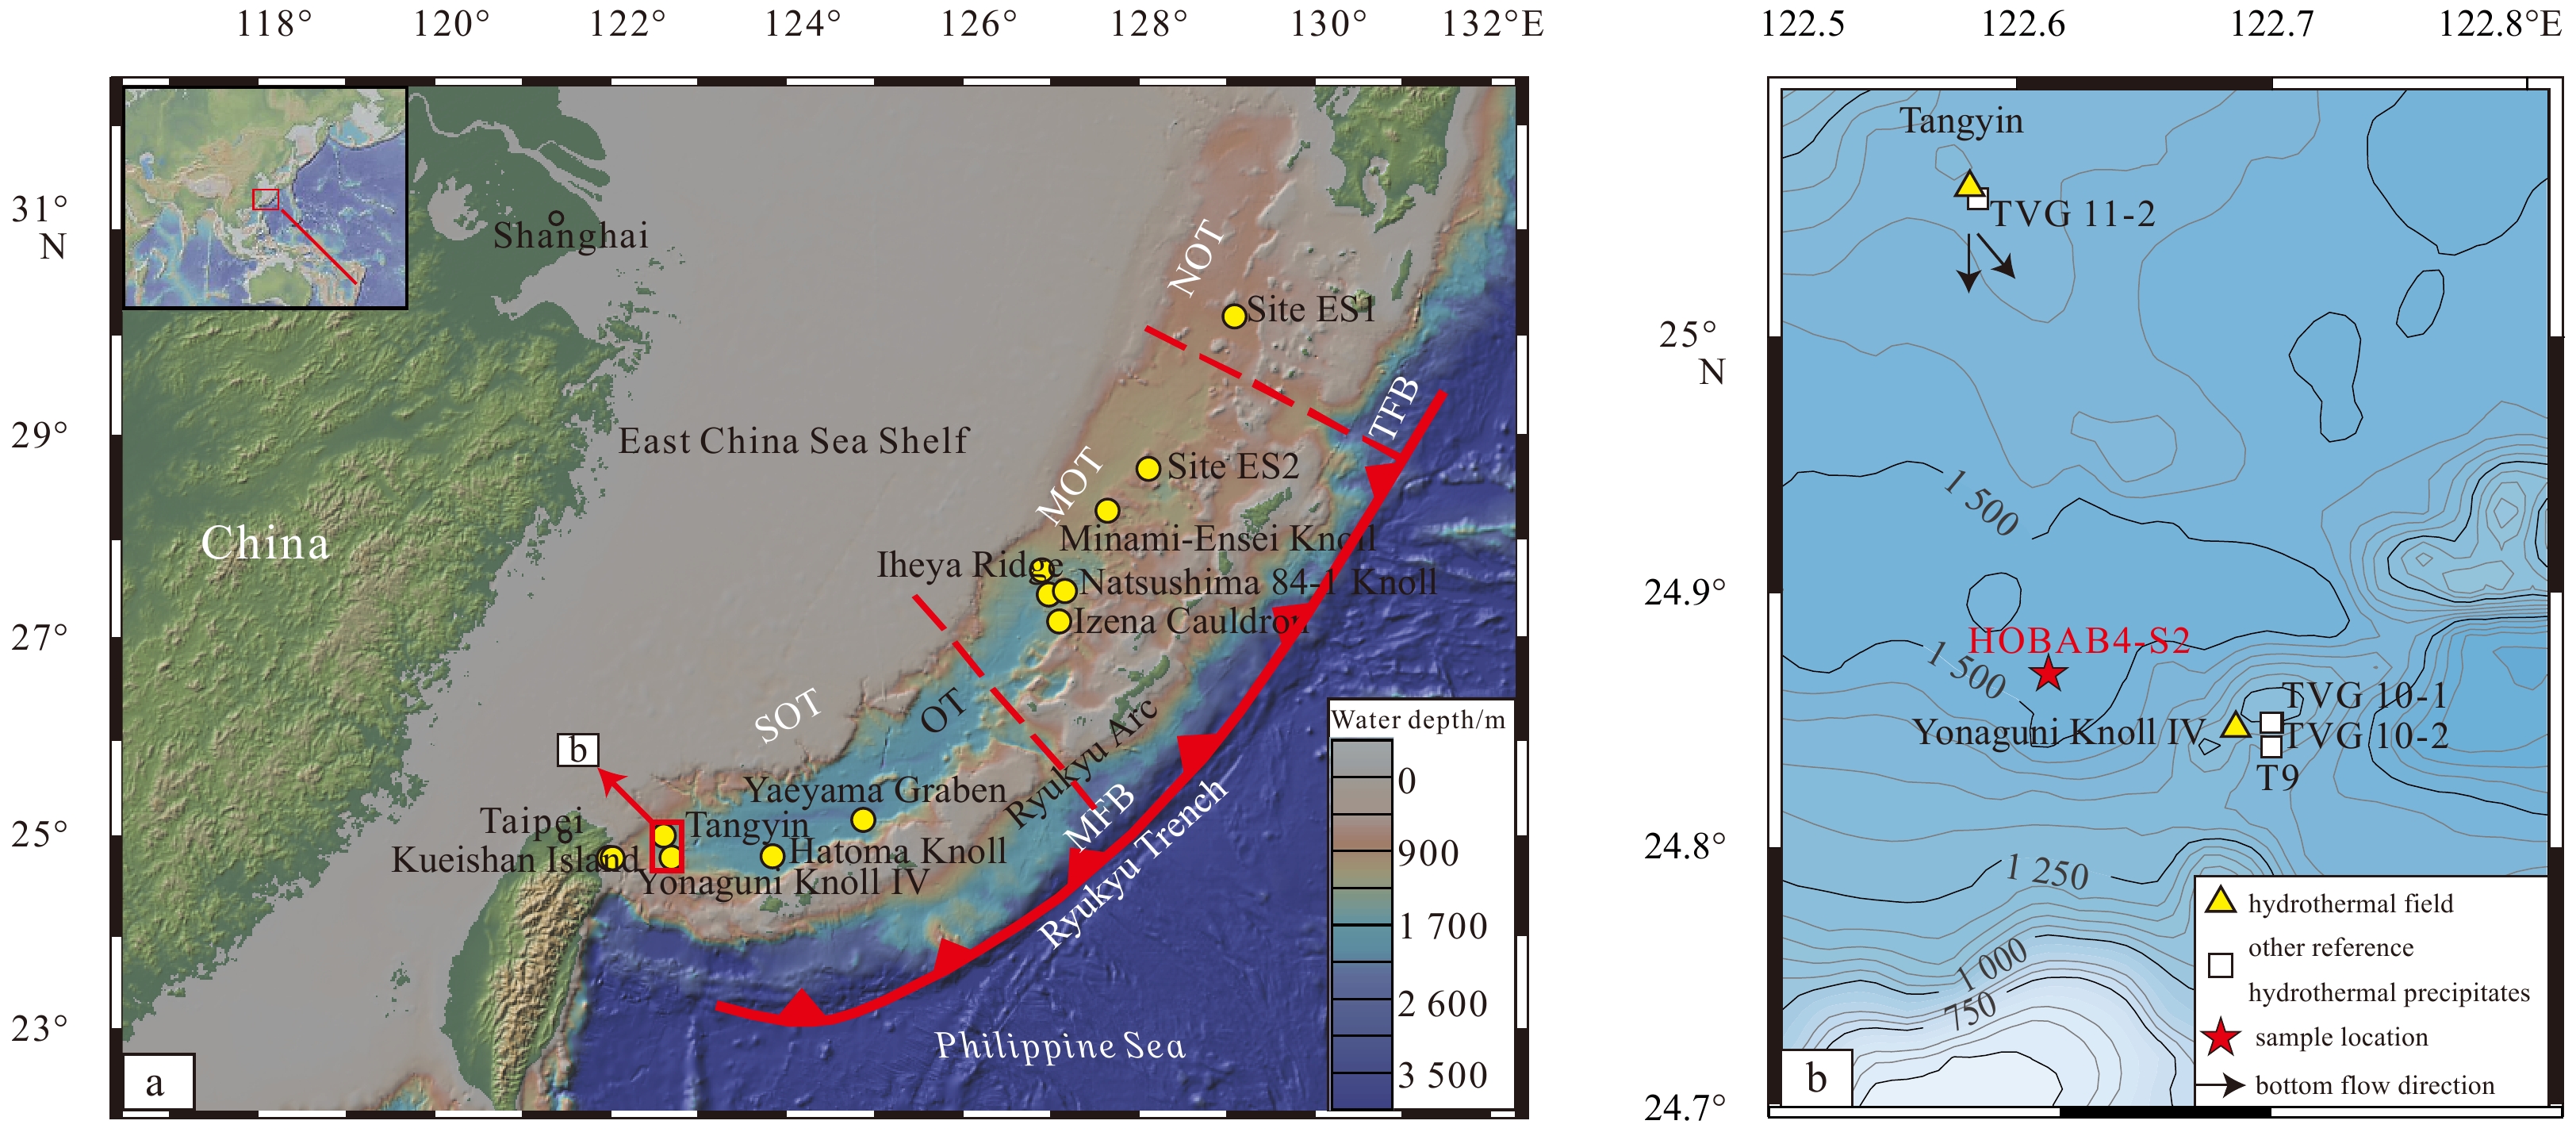


 DownLoad: