Xilong Wang, Kaijun Su, Juan Du, Linwei Li, Yanling Lao, Guizhen Ning, Li Bin. Estimating submarine groundwater discharge at a subtropical river estuary along the Beibu Gulf, China[J]. Acta Oceanologica Sinica, 2021, 40(9): 13-22. doi: 10.1007/s13131-021-1862-7
Citation:
Xilong Wang, Kaijun Su, Juan Du, Linwei Li, Yanling Lao, Guizhen Ning, Li Bin. Estimating submarine groundwater discharge at a subtropical river estuary along the Beibu Gulf, China[J]. Acta Oceanologica Sinica, 2021, 40(9): 13-22. doi: 10.1007/s13131-021-1862-7
Xilong Wang, Kaijun Su, Juan Du, Linwei Li, Yanling Lao, Guizhen Ning, Li Bin. Estimating submarine groundwater discharge at a subtropical river estuary along the Beibu Gulf, China[J]. Acta Oceanologica Sinica, 2021, 40(9): 13-22. doi: 10.1007/s13131-021-1862-7
Citation:
Xilong Wang, Kaijun Su, Juan Du, Linwei Li, Yanling Lao, Guizhen Ning, Li Bin. Estimating submarine groundwater discharge at a subtropical river estuary along the Beibu Gulf, China[J]. Acta Oceanologica Sinica, 2021, 40(9): 13-22. doi: 10.1007/s13131-021-1862-7
Guangxi Key Laboratory of Marine Disaster in the Beibu Gulf, Beibu Gulf University, Qinzhou 535011, China
2.
Institute of Radiation Medicine, Chinese Academy of Medical Sciences and Peking Union Medical College, Tianjin 300192, China
3.
Key Laboratory of Coastal Science and Engineering, Beibu Gulf University, Qinzhou 535011, China
4.
State Key Laboratory of Estuarine and Coastal Research, East China Normal University, Shanghai 200241, China
5.
Research Centre for Eco-Environmental Engineering, Dongguan University of Technology, Dongguan 523808, China
6.
Qinzhou Key Laboratory of Land Resources Use and Monitor, Beibu Gulf University, Qinzhou 535011, China
Funds:
The National Natural Science Foundation of China under contract No. 41906150; the Natural Science Foundation of Guangxi under contract No. 2018GXNSFBA281051; the Science and Technology Plan Projects of Guangxi Province under contract Nos Gui Science AD19245147 and Gui Science AB18126098; the Research Fund of Guangxi Education Department under contract No. 2018KY0616; the Research Startup Fund of Beibu Gulf University under contract No. 2018KYQD09.
In certain regions, submarine groundwater discharge (SGD) into the ocean plays a significant role in coastal material fluxes and their biogeochemical cycle; therefore, the impact of SGD on the ecosystem cannot be ignored. In this study, SGD was estimated using naturally occurring radium isotopes (223Ra and 224Ra) in a subtropical estuary along the Beibu Gulf, China. The results showed that the Ra activities of submarine groundwater were approximately 10 times higher than those of surface water. By assuming a steady state and using an Ra mass balance model, the SGD flux in May 2018 was estimated to be 5.98×10⁶ m3/d and 3.60×10⁶ m3/d based on 224Ra and 223Ra, respectively. At the same time, the activities of Ra isotopes fluctuated within a tidal cycle; that is, a lower activity was observed at high tide and a higher activity was seen at low tide. Based on these variations, the average tidal pumping fluxes of SGD were 1.15×10⁶ m3/d and 2.44×10⁶ m3/d with 224Ra and 223Ra, respectively. Tidal-driven SGD accounts for 24%–51% of the total SGD. Therefore, tidal pumping is an important driving force of the SGD in the Dafengjiang River (DFJR) Estuary. Furthermore, the SGD of the DFJR Estuary in the coastal zone contributes significantly to the seawater composition of the Beibu Gulf and the material exchange between land and sea.
One of the main manifestations of human activities in coastal ecosystems is the land-ocean interaction process. Among these interactions, submarine groundwater discharge (SGD) is an important but often overlooked process, which has been prominent in the global water cycles. Since many ingredients exhibit higher concentrations, such as nitrate, in groundwater than in seawater, SGD can be regarded as an important carrier of nutrients and other substances along coastal areas. At the same time, SGD-driven materials can change the composition and structure of offshore substances so as to change the traditional pattern of the biogeochemical cycles of coastal waters (Johannes, 1980; Maher et al., 2013; Kwon et al., 2014; Chen et al., 2020, Zhao et al., 2021).
SGD includes all flow of water on continental margins from the seabed to the coastal ocean, which contains both the fresh groundwater discharge and the recirculated seawater discharge (Burnett et al., 2003). Because of its underground and non-intuitive characteristics, it is generally difficult to directly measure. For instance, the physical measurement data can only partially reflect the SGD, and hydrogeological models require detailed hydrogeological analysis and reliable parameters. However, geochemical tracers have proven to be an effective method for SGD estimation and require relatively minimal effort; among these tracers, the radium (Ra) isotope is considered to be one of the most efficient ways (Beck et al., 2007; Colbert and Hammond, 2008; Moore et al., 2011; Zhang et al., 2020). There are four naturally occurring Ra isotopes, 223Ra (T1/2=11.4 d), 224Ra (T1/2=3.6 d), 226Ra (T1/2=1 600 a), and 228Ra (T1/2=5.75 a). Because of the large variation in the rates of their generation and decay, these four isotopes can be used to study the biogeochemical processes at different time scales.
The Beibu Gulf is considered to be the last clean sea area in China, and its marine environment is healthier than that of other coastal areas (Guo, 2020). However, owing to the rapid development of the economy along the Beibu Gulf coast region, the coastal marine environment has been under significant pressure. Accordingly, the contents of industrial sewage, living wastewater, mariculture wastewater, and other pollutants increased gradually, leading to the ecological and environmental problems progressively extending from the land to the coastal ocean. The ecological environment of the Beibu Gulf is deteriorating, while eutrophication, red tides, and other environmental problems have been observed constantly (Yang et al., 2015; Luo et al., 2016). The Dafengjiang River (DFJR) is a typical subtropical river along the Beibu Gulf and is the second largest river emptying into the Beibu Gulf. Therefore, a study on the SGD and its environmental impact in the DFJR Estuary will help in understanding the causes of water environment changes comprehensively and providing basic data for the protection and governance of the water environment.
2.
Study area
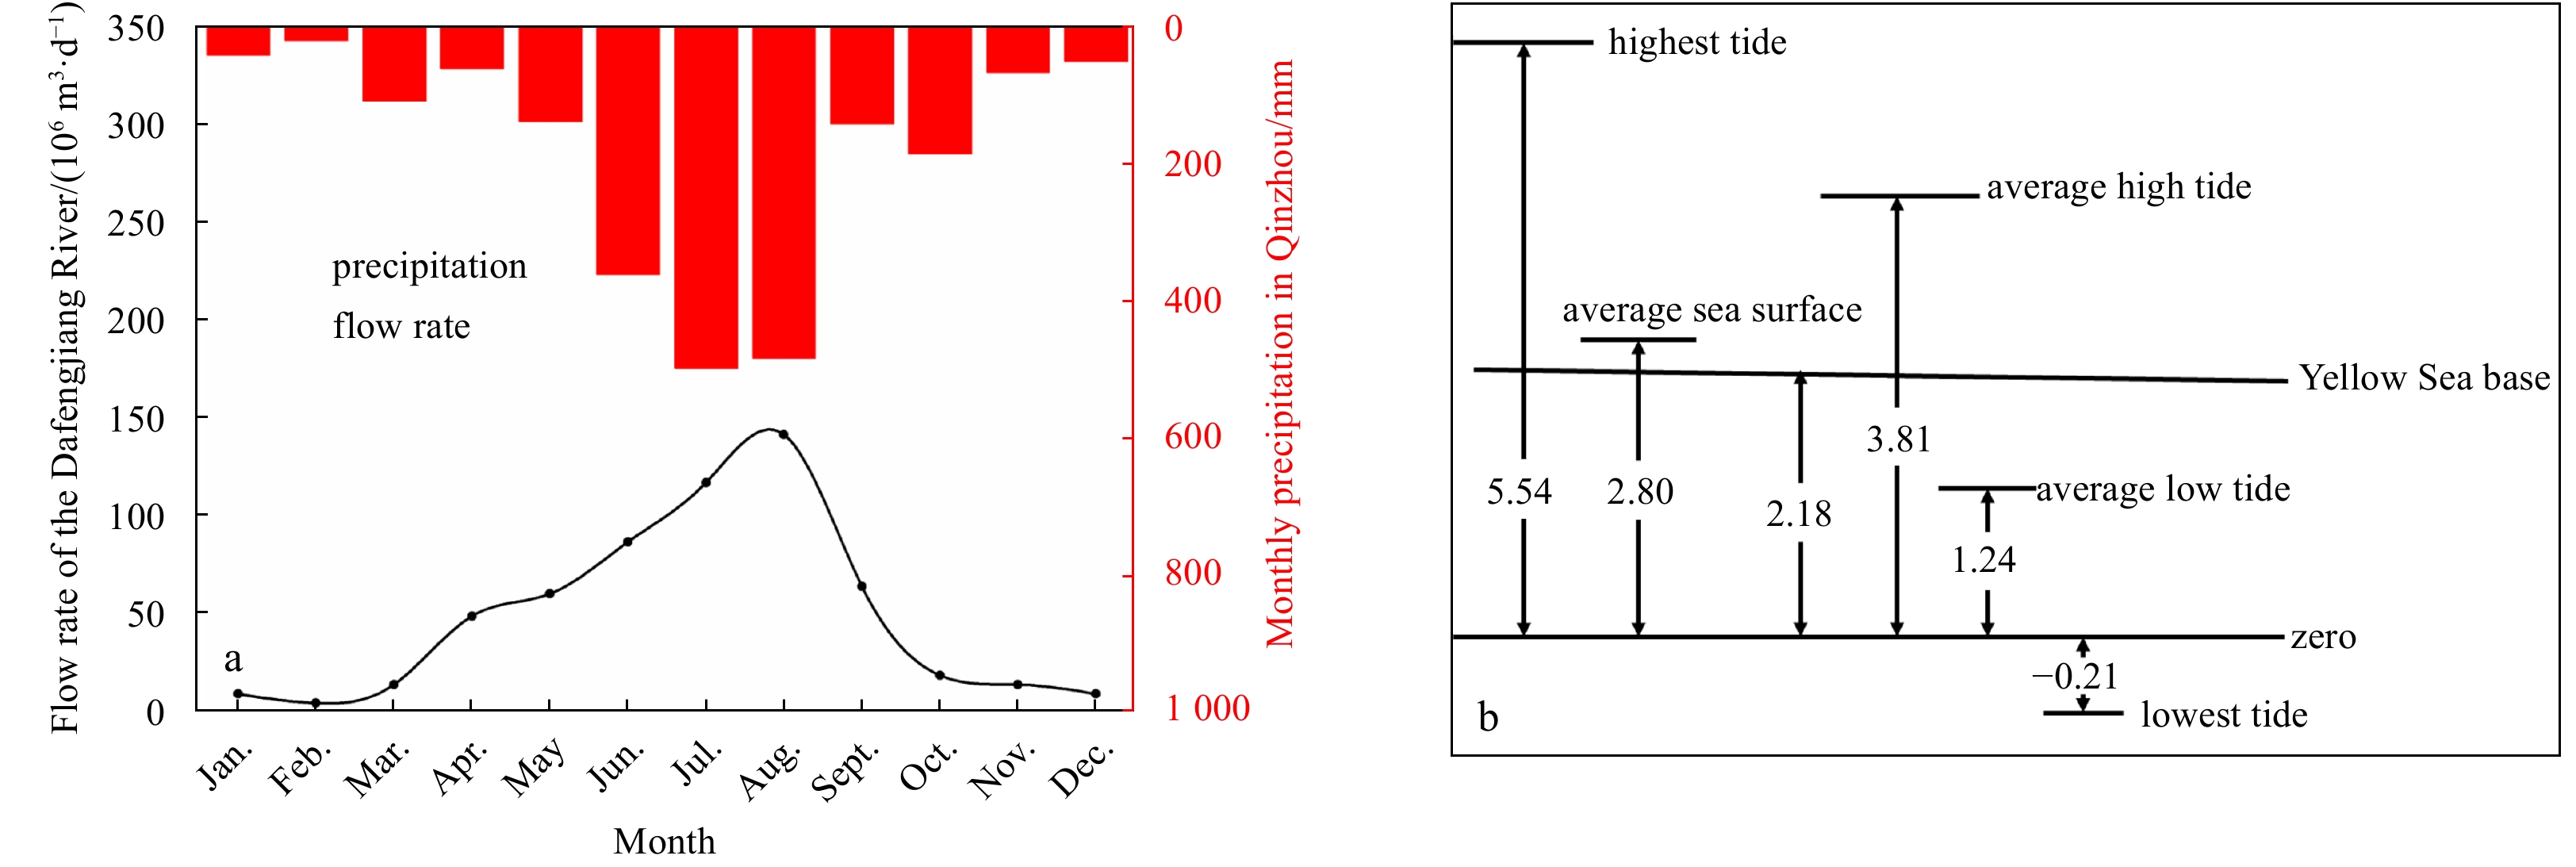
The DFJR Estuary is located on the south coast of Guangxi, China, which is a shallow estuary connected to the Beibu Gulf (Fig. 1). The DFJR is smaller compared to most of the well-studied rivers globally and those in China. It has a length of around 158 km, a drainage area of around 1 927 km2, and an average water depth of around 7 m (range of 2–14 m) (Li et al., 2015; Lu et al., 2020). The annual average freshwater discharge is 18.3×10⁹ m3, and approximately 36.0×10⁴ t of suspended sediments are loaded into the estuary (Lin et al., 2018). The annual rainfall of DFJR ranges from 1 200 mm to 2 300 mm, with an average of 1 600 mm (data from the China Meteorological Data Sharing Service System, http://data.cma.cn/). The DFJR is highly sensitive to the subtropical monsoon climate, with 80% of rainfall occurring in the wet season from April to September and 20% in the dry season from October to March of next year (Fig. 2a). At the same time, approximately 88% of the freshwater is discharged during the flood season (from April to September) when the south-western monsoon prevails. The discharge in August was the largest, accounting for 24% of the total annual water discharge. The remaining 12% is discharged during the dry season (from October to March of next year) (Luo et al., 2015; Lu et al., 2020). The estuary, which is somewhat triangular in shape, develops a main stream debouching into the open Beibu Gulf in the northwestern South China Sea (Fig. 1). The tides in the DFJR Estuary are diurnal and their amplitudes vary from 1.2 m to 5.7 m within the estuary (Fig. 2b; Yang et al., 2018).
Figure
1.
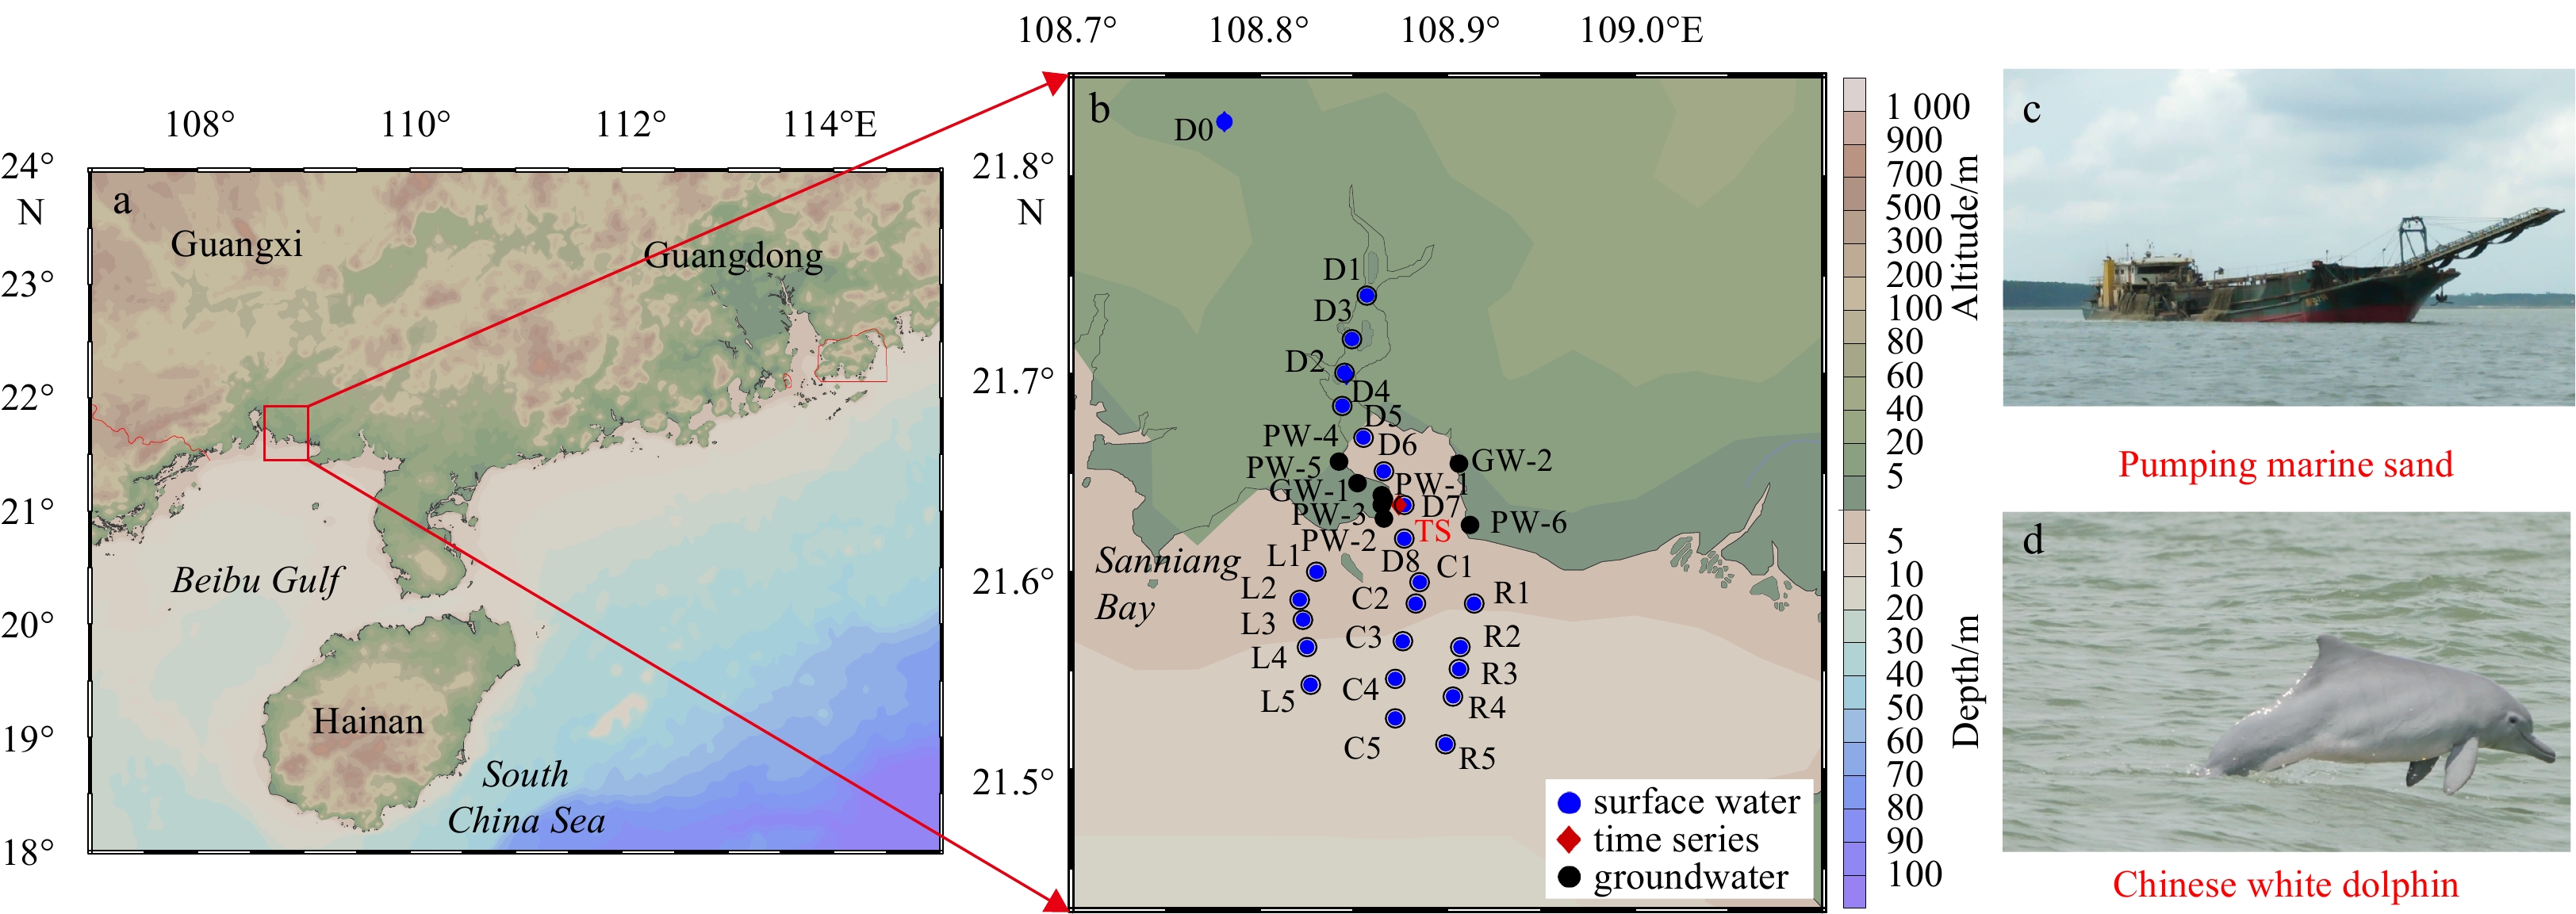
Location of Beibu Gulf and the Dafengjiang River (DFJR) facing the Beibu Gulf, in the southern part of China (a); sampling stations in and around the DFJR Estuary in May 2018 (b); the phenomenon of pumping marine sand in the river course (c); and the Chinese white dolphin in the Sanniang Bay (d) shown in b.
Figure
2.
Monthly precipitation in Qinzhou (the city where the DFJR Estuary is located) and the river flow rate into the DFJR Estuary (a); the behavior of tidal levels and its relationship with the Yellow Sea base (unit: m) (b).
The DFJR Estuary comprises various natural resources, such as mangroves and marine sand. Land along the DFJR Estuary coast is used for multiple purposes, including urban lands, forestry, agricultural activities, aquaculture, and industrial activities, which play an important role in substance input from land to the river (Xu et al., 2010; Yang et al., 2018; Lu et al., 2020). The DFJR has a channel connected to the Sanniang Bay (SNB), which is the natural habitat of the Chinese white dolphin (Sousa chinensis); this dolphin is a first-class nationally protected species in China that is affected by pollutants from the riverine and land sources (Fig. 1d; Lin et al., 2018). As an area used to conserve this species, the SNB requires good water quality. The concentration and distribution of nutrients in the DFJR Estuary have been studied previously; the results suggest that nitrogen pollution is rampant in this area (Wang et al., 2015b; Yang et al., 2018). The primary sources of pollution were focused on the agricultural activities, aquaculture, and industrial activities. However, SGD has not been considered an important land-ocean interaction process in this area. Given the ecological importance of the DFJR Estuary, a study on SGD and its impact on the marine environment of DFJR Estuary is necessary, which can be helpful for understanding the land-ocean interaction and providing basic data for the scientific management of this aquatic ecosystem.
3.
Sample collections and analysis
The on-spot field investigation in the DFJR Estuary was conducted in May 2018. The sampling sites of the observation are shown in the Fig. 1b, which covers the aquaculture area in the river course, the marine sand area in the estuary, and the coastal Beibu Gulf regions out of the river. At each station, the surface water sample (25 L) was collected via pumping water at a depth of around 0.5 m to obtain Ra isotopes. The temperature and salinity of the surface water were measured using a multiparameter water quality analyzer (AP-2000, Aquaread, UK). Then the water samples were passed through a column filled with around 20 g MnO2-impregnated acrylic fiber at a flow rate of approximately 0.5 L/min to ensure quantitative Ra adsorption. After adsorption, the fibers with Ra isotopes were transported to the laboratory for further processing and analysis. Several groundwater samples (pore water, around 10 L; and well water, around 20 L) were collected from the mangroves and wells along the coast of the DFJR Estuary to determine the SGD end-member (Fig. 1b). Pore water samples in the mangroves were collected by digging a borehole to insert the pushpoint sampler. The porewater was extracted using a peristaltic pump. Samples were filtered by a 0.45 μm cellulose acetate fiber filter (Whatman, ϕ 47 mm) to remove the suspended sediments and then passed through a MnO2-impregnated acrylic fiber column. In addition, a 27 h time series observation (with 3 h intervals) was conducted within the DFJR Estuary at Station TS (Fig. 1b). The sampling and processing methods were the same as those used for the surface water samples.
Upon returning to the laboratory, the Mn-fiber was washed with fresh water, and the water content of the Mn-fiber was reduced to approximately 75%. 224Ra and 223Ra contents on the Mn-fibers were then measured using a Radium Delayed Coincidence Counting System (RaDeCC, Moore and Arnold, 1996). To account for the dissolved parent (228Th) collected onto the Mn-fiber, the Mn-fibers were stored for 6 weeks and measured again to obtain the supported 224Ra. The uncertainties of 224Ra and 223Ra were estimated to be 5% and 12%, respectively, using the equations reported by Garcia-Solsona et al. (2008).
4.
Results
4.1
Hydrographic data
The distributions of temperature and salinity in the surface water of the DFJR Estuary are shown in Fig. 3. The temperature within the surface water of the DFJR Estuary varied from 31.5°C to 33.1°C, with an average of 32.3°C in May 2018. A higher temperature was observed near the estuary. Meanwhile, salinity ranged from 14.2 to 25.0, with an average value of 20.9. The lowest salinity was observed in the upper river. During the sampling month, the river discharge rate was 711 m3/s, and the precipitation was 128 mm.
Figure
3.
Distributions of temperature (a) and salinity (b) in the surface water of the DFJR Estuary in May 2018.
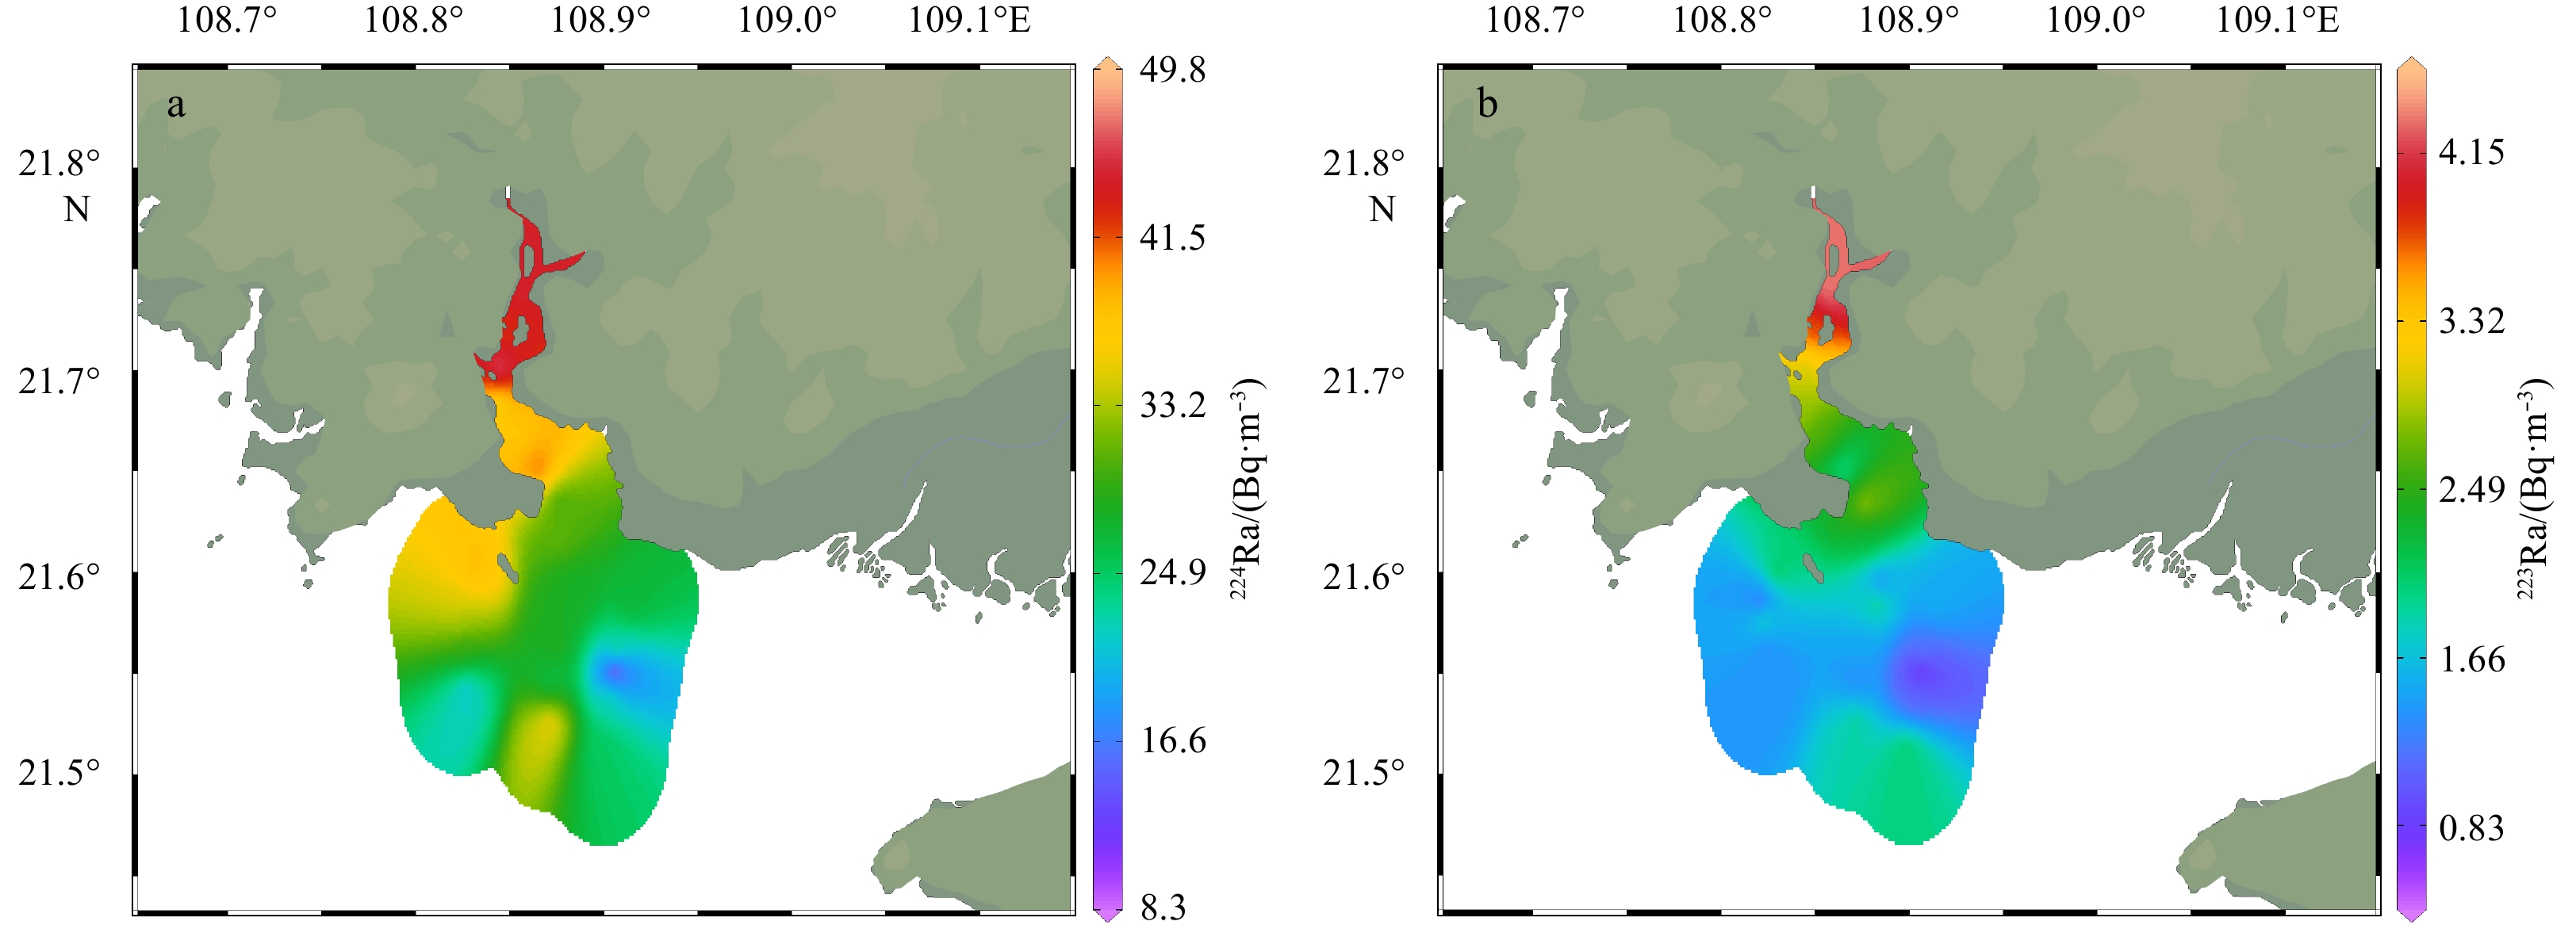
The distributions of 224Ra and 223Ra are shown in Fig. 4. Here, the 224Ra data are represented as excess 224Ra (224Raex), which have been calculated by subtracting the 228Th-supported 224Ra from the total 224Ra. The activities of 224Ra varied from 10.9 Bq/m3 to 48.0 Bq/m3 with an average value of 30.8 Bq/m3. Meanwhile, the activities of 223Ra ranged from 0.09 Bq/m3 to 4.38 Bq/m3, with an average value of 1.95 Bq/m3. The high activities of 224Ra and 223Ra in surface water were generally observed in the middle river course (Stations D1, D2, and D3) with a salinity of 14.2–16.9. Then, a decreasing gradient in the Ra isotope activities was observed to the river mouth and the SNB. According to the desorption experiment data reported by Luo et al. (2019), the Ra could be considered to have been totally desorbed from the suspended sediment in the studied estuary.
Figure
4.
Distributions of 224Ra (a) and 223Ra (b) in the surface water of the DFJR Estuary in May 2018.
The porewater samples showed very high activities for 224Ra and 223Ra compared to those exhibited by the surface water, ranging from 278 Bq/m3 to 587 Bq/m3 for 224Ra and from 9.42 Bq/m3 to 46.7 Bq/m3 for 223Ra. The average 224Ra and 223Ra activities were approximately 10 times higher than those of surface water. However, the well water samples collected around the DFJR Estuary showed relatively lower activities for 224Ra and 223Ra (Station GW-1, (2.02±0.10) Bq/m3 for 224Ra and (0.08±0.00) Bq/m3 for 223Ra; Station GW-2, (4.58±0.45) Bq/m3 for 224Ra and (0.18±0.09) Bq/m3 for 223Ra) compared to those exhibited in the surface water of the DFJR Estuary, which may be due to the shallow water depth (<2.5 m) and rainy season. Thus, the well water samples collected in this study were expected to mainly be sourced from the rainwater with low Ra activity; their contribution for the Ra isotopes in the DFJR Estuary was limited and could be ignored (Guo et al., 2011). Therefore, the discussion below for Ra isotopes was based on the porewater samples.
Figure 5 shows a scatter plot of 224Ra and 223Ra activities versus salinity in the surface water of the DFJR Estuary. The distribution patterns for 224Ra and 223Ra were similar, with low activities being observed near zero salinity. A decreasing trend was observed from the intermediate salinity (approximately 15–20) to the highest salinity, which reflected the release of 224Ra and 223Ra from suspended particles into the solution upon estuarine mixing. A similar distribution pattern can also be observed in other large rivers (e.g., Moore and Krest, 2004; Rengarajan and Sarma, 2015; Xu et al., 2013; Liu et al., 2018). The activities of 224Ra versus 223Ra for surface water and groundwater samples are shown in Fig. 6. From which, the slope of the fitting line in the surface water was 15.7 (r=0.98, n=24, p<0.01) during the sampling month. The fitting line of the groundwater samples showed a higher slope value than that of the surface water samples, indicating that the Ra in surface water may be part from the input of groundwater (Moore, 2006).
Figure
5.
Activities of 224Ra (a) and 223Ra (b) versus salinity in the DFJR Estuary in May 2018.
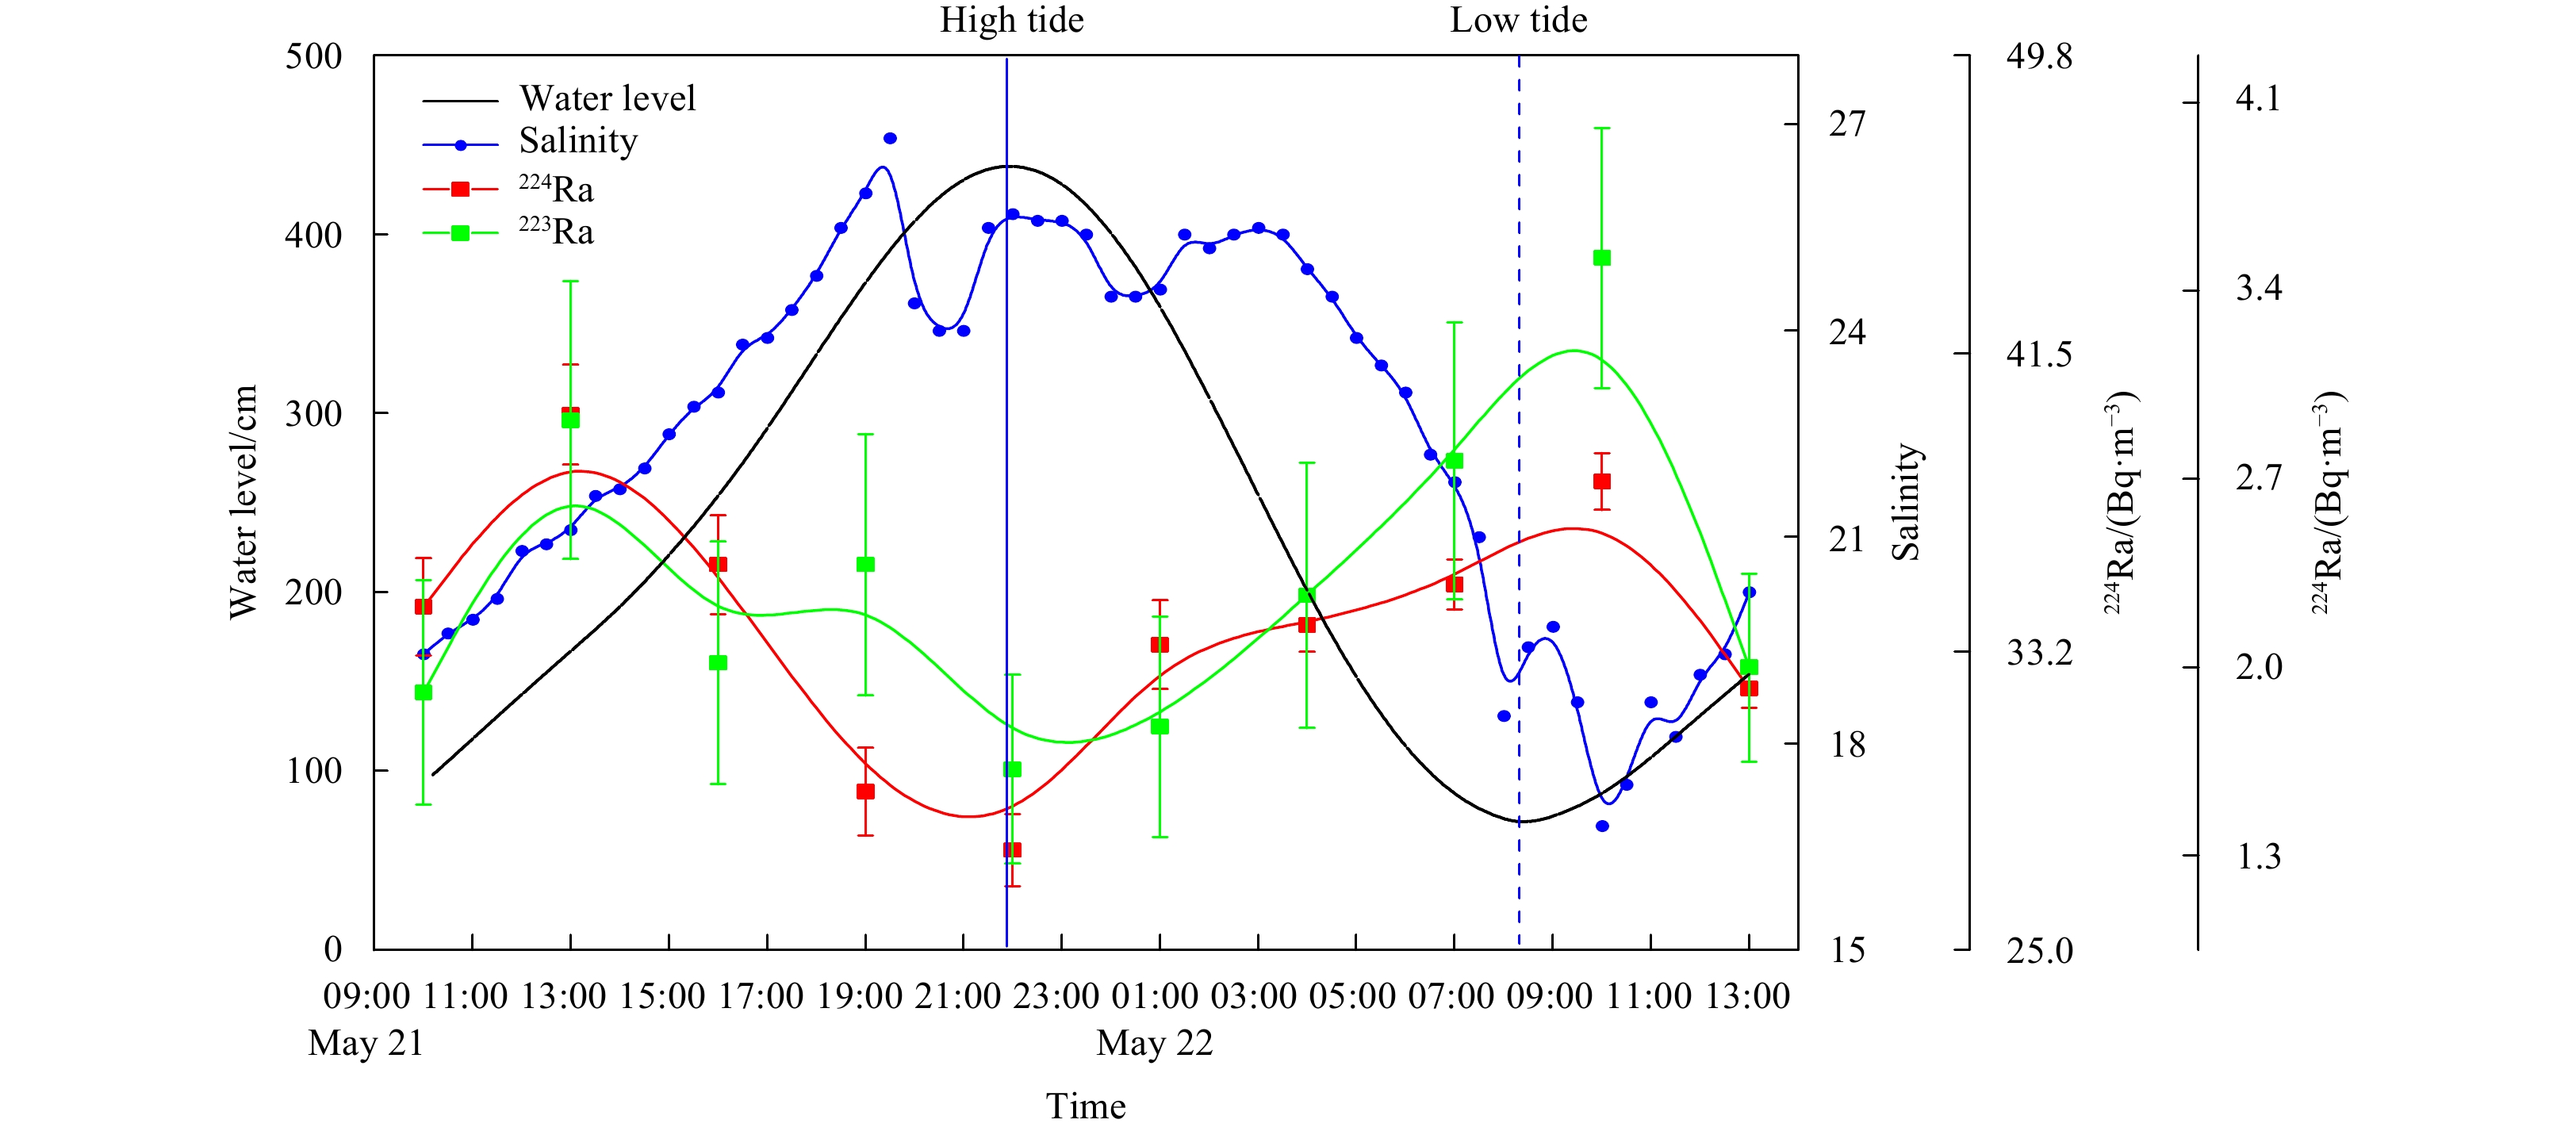
In coastal bays and estuaries, tidal pumping could be an important factor affecting the exchange rate between coastal water and the offshore seawater. Thus, a 27 h time series observation was conducted within the estuary at Station TS (21.634°N, 108.874°E, Fig. 1b). During the observation period, the salinity varied from 16.8 at low tide (tidal level: 71 cm) to 26.8 at high tide (tidal level: 441 cm). Similarly, the activities of Ra isotopes fluctuated within the tidal cycle, which was in contrast to the salinity changes; a lower activity was observed at high tide and a higher activity was seen at low tide (Fig. 7). This was due to the offshore sea water with lower Ra activity entering the estuary at high tide, and bringing out the estuarine water with higher Ra activity during the low tide.
Figure
7.
Tidal level condition and the measured salinity, 224Ra and 223Ra activities of the DFJR Estuary during time series sampling in May 21–22, 2018.
Water residence time is an important parameter for studying the water dynamics (migration, diffusion, etc.) of the DFJR Estuary and is related to the timescale of the substance transportation. In order to estimate the SGD in the DFJR Estuary, the residence time of the water body in the estuary must be obtained first. Since 224Ra and 223Ra have been derived from the same sources but exhibit different regeneration rates from their parents, the ratios of 224Ra and 223Ra can be used to estimate the residence time of the coastal water, which is generally known as the apparent water age. The DFJR Estuary is shaped like a triangle, with a peak inserting into the land and the riverine input from the north. Because it independently enters the sea, there are no other riverine Ra sources from the upper stream. Therefore, following Moore et al. (2006), by assuming that the system was in a steady state (that is, the Ra additions were balanced by the losses), the 224Ra and 223Ra balance in the DFJR Estuary can be written as follows:
where $ F_{{}^{224}{\rm{Ra}}} $ and $ F_{{}^{223}{\rm{Ra}}} $ are the total fluxes of 224Ra and 223Ra into the DFJR Estuary, respectively; $ I_{{}^{224}{\rm{Ra}}} $ and $ I_{{}^{223}{\rm{Ra}}} $ are the inventories of 224Ra and 223Ra in the study area, respectively; and $ {\lambda }_{{}^{224}{\rm{Ra}}} $ and $ {\lambda }_{{}^{223}{\rm{Ra}}} $ are the decay constants for 224Ra and 223Ra, respectively. In this study, the ratio of average activities of 224Ra to 223Ra in groundwater samples around the DFJR Estuary and the ratio of total inventories for 224Ra and 223Ra in the surface water samples of the DFJR Estuary were used to represent the initial input ratio and the inventory ratio, respectively. Thus, $ F\left(\dfrac{{}^{224}{\rm{Ra}}}{{}^{223}{\rm{Ra}}}\right)= $26.6 and $ I\left(\dfrac{{}^{224}{\rm{Ra}}}{{}^{223}{\rm{Ra}}}\right)= $15.8, which came out the apparent water age of the DFJR Estuary to be 5.3 d in May 2018. This period was longer than that observed in the Zhujiang River Estuary (1.8–3 d) during the wet season and shorter than that in the Changjiang River Estuary in May 2011 (11.3 d) and August 2009 (5.4–7.0 d) (Gu et al., 2012; Xu et al., 2013; Sun et al., 2014; Liu et al., 2018).
5.2
Ra isotopes budgets in the DFJR Estuary
In the DFJR Estuary, the sources for short-lived 224Ra and 223Ra mainly included the riverine input from the upper stream river, the contributions from the sediments (desorption from suspended sediments and diffusion from bottom sediments) and the SGD input. The sinks were mainly due to the mixing with the open seawater with low Ra activities and the self-decay. Assuming that the DFJR Estuary was in a steady state, a mass balance equation for Ra isotopes can be constructed as follows (Moore et al., 2008):
If the other sources and sinks for Ra isotopes could be determined, Ra input via SGD could be obtained. Subsequently, by dividing the groundwater endmembers, the SGD rate can be estimated.
The riverine input of Ra into the DFJR Estuary was estimated based on the river water discharge in May 2018 (711 m3/s) and the Ra in the fresh river water (Station D0, salinity=0.8, 224Ra activity=12.1 Bq/m3, and 223Ra activity=0.09 Bq/m3). Thus, $ {F}_{{\rm{river}}} $ was calculated to be 7.45×10⁷ Bq/d and 5.22×10⁵ Bq/d for 224Ra and 223Ra, respectively.
As shown in Fig. 5, the activities of 224Ra and 223Ra both decreased from the intermediate salinity (approximately 15–20), which indicated that the Ra had been totally been desorbed from the suspended sediments. The desorption experiment carried out by Luo et al. (2019) using sediments near the DFJR Estuary can also illustrate this verdict. Therefore, it does not have to take account of the desorption from the suspended sediments for Ra sources in this system. However, because of the shallow depth of the estuary, Ra diffusion from the bottom sediments to the water column cannot be ignored. To estimate Ra diffusion from the bottom sediments, the following equation was used to calculate the maximum possible diffusion flux of 224Ra:
$$
{F}_{{\rm{diffusion}}}={M}_{{}^{228}{\rm{Th}}}\times \frac{{{(D}_{{\rm{s}}}\times {\lambda }_{{}^{224}{\rm{Ra}}})}^{1/2}}{{K}_{{\rm{d}}}}\times A,
$$
(5)
where $ {F}_{{\rm{diffusion}}} $ is the diffusion flux (Bq/d) from the bottom sediment; $ {D}_{{\rm{s}}} $ is the diffusion coefficient of Ra in sediments, which is generally obtained from the diffusion coefficient of Ra in water and the porosity of the sediment (Wang et al., 2020). Subsequently, $ {D}_{{\rm{s}}} $ was calculated to be 4.1×10⁻⁶ cm2/s. $ {K}_{{\rm{d}}} $ is the distribution coefficient (80); and $ A $ is the area of the DFJR Estuary (6.86×10⁷ m2). The average activity of the parent ($M_{{}^{228}{\rm{Th}}} $, 0.049 Bq/g) in the surface sediment of the South China Sea (Liu et al., 2020) was used to estimate its contribution to 224Ra in the DFJR Estuary. The diffusion flux of 223Ra from the bottom sediment was calculated based on the activity ratio of 224Ra/223Ra (26.6) in the sediment porewater near the DFJR Estuary and the diffusion flux of 224Ra. Then, the diffusion fluxes of 224Ra and 223Ra in the DFJR Estuary were calculated to be 1.65×10⁴ Bq/d and 6.22×10² Bq/d, respectively. As discussed above, $ {F}_{{\rm{sediment}}} $ in Eq. (4) was 1.65×10⁴ Bq/d and 6.22×10² Bq/d for 224Ra and 223Ra, respectively.
The loss due to mixing with the open seawater with low Ra activities can be calculated using the following equation (Ji et al., 2013):
where P is the volume of the tidal prism, which can be estimated from the water surface area of the DFJR Estuary and the tidal amplitude (that is, 2.79×10⁸ m3); $ \tau $ is the apparent water age; $ Q_{{{\rm{Ra}}}_{{\rm{m}}}} $ and $ Q_{{{\rm{Ra}}}_{{\rm{s}}}} $ represent the measured Ra activities in the DFJR Estuary and the open seawater, respectively; and b is the return flow. According to the assumption of Moore et al. (2006), the return flow can be estimated using the fraction of seawater in the DFJR Estuary. Thus, a three-end member mixing model modified from Moore (2003) based on the water, salinity and 223Ra was used to estimate the fraction of seawater:
where $\, {f}_{{\rm{s}}} $, $ \,{f}_{{\rm{R}}} $, and $ \,{f}_{{\rm{GW}}} $ are the fractions of the seawater, river water, and groundwater in the estuary, respectively; $ {S}_{{\rm{s}}} $, $ {S}_{{\rm{R}}} $, and $ {S}_{{\rm{GW}}} $ are the salinities of the seawater, river water and groundwater, respectively; and $ {S}_{{\rm{m}}} $ is the measured salinity in the estuary water samples. Because a river water sample at salinity zero has not been obtained, the upstream water with a salinity of 0.8 (at Station D0) was used to represent the river water endmember ($ {S}_{{\rm{R}}}= $0.8). The salinity of the offshore seawater in the SNB was used as the seawater endmember, and the salinity (Ss) was measured to be 30.6. The average salinity of the groundwater samples ($ {S}_{{\rm{GW}}} $) was used as 21.9. $Q_{ {{}^{223}{\rm{Ra}}}_{{\rm{s}}} }$, $ Q_{{{}^{223}{\rm{Ra}}}_{{\rm{R}}}} $, and $ Q_{{{}^{223}{\rm{Ra}}}_{{\rm{GW}}}} $ are 223Ra activities of the seawater, river water and groundwater samples, respectively ($ Q_{ {{}^{223}{\rm{Ra}}}_{{\rm{s}}}}= $0.69 Bq/m3, $ Q_{{{}^{223}{\rm{Ra}}}_{{\rm{R}}}} $=0.09 Bq/m3, and $Q_{ {{}^{223}{\rm{Ra}}}_{{\rm{GW}}}} $=0.09 Bq/m3); $Q_{ {{}^{223}{\rm{Ra}}}_{{\rm{m}}}} $ is the measured 223Ra activity in the estuary water samples; and $\lambda_{{}^{223}{\rm{Ra}} }$ is the decay constant of 223Ra (0.060 6 d–1). Thus, the fractions of seawater, river water, and groundwater in the DFJR Estuary can be estimated by solving three Eqs (7), (8), and (9), simultaneously. Therefore, the average contribution proportion of SNB seawater to the estuary was 0.60 (that is, b=$ \,{f}_{{\rm{s}}} $=0.60). Given above, the loss fluxes by mixing with the open seawater for 224Ra and 223Ra were calculated to be 4.65×10⁸ Bq/d and 3.28×10⁷ Bq/d, respectively.
The radioactive decay of 224Ra and 223Ra cannot be ignored because the residence time of the study area is expressed on a time scale of days. In a steady state, the radioactive decay fluxes for 224Ra and 223Ra can be estimated from the inventories of the measured Ra isotopes with their decay constants $ \lambda $ and the apparent water age. Thus, the 224Ra and 223Ra fluxes by self-decay can be calculated to be 2.15×10⁹ Bq/d and 4.38×10⁷ Bq/d, respectively. Then, the excess Ra isotope fluxes (that is, the Ra inputs by SGD ($ {F}_{{\rm{SGD}}} $)) can be obtained from the Eq. (4) by considering the other sources and sinks estimated above. $ {F}_{{\rm{SGD}}} $ values were 2.55×10⁹ Bq/d and 7.65×10⁷ Bq/d for 224Ra and 223Ra, respectively.
5.3
The SGD flux into the DFJR Estuary
The SGD flux can be estimated by dividing the excess Ra isotope fluxes quantified above by the Ra activities in the potential groundwater samples. Thus, the activities of 224Ra and 223Ra in the groundwater samples seeping into the study area are necessitated. As shown in Fig. 6, the groundwater exhibiting a high Ra activity and a high activity ratio can be recognized as the probable groundwater end member that poured into the DFJR Estuary. The average activities of 224Ra and 223Ra in the groundwater samples that met these conditions (activities and ratios) were 426 Bq/m3 and 21.2 Bq/m3, respectively. Therefore, the SGD flux was estimated to be 5.98×10⁶ m3/d and 3.60×10⁶ m3/d based on 224Ra and 223Ra, respectively, during the sampling month in the DFJR Estuary, which can be equal to 9.73% and 5.86% of the DFJR water discharge in May (6.14×10⁷ m3/d), respectively. The SGD rate in the DFJR Estuary (5.25–8.72 cm/d in May 2018) was much lower than that in the Maowei Sea (20–36 cm/d; Chen et al., 2018) and the Zhenzhu Bay (36 cm/d; Wang et al., 2020), which were also located along the coast of the Beibu Gulf. The different SGD rates along the Beibu Gulf may reflect the different hydrogeological conditions. This may also be due to the different tracers, seasons, and the rainfall. In addition, a unique phenomenon occurred in the DFJR Estuary, sand pumping (Fig. 1c), during our sampling period. Although there was no evidence that the SGD rate was influenced by the sand pumping, the process of groundwater discharge must be different from that observed in areas with no sand pumping.
5.4
SGD flux into the DFJR Estuary driven by tidal pumping
In coastal bays and estuaries, tidal pumping is usually an important factor affecting the exchange between coastal water and the offshore seawater. As an important land–ocean interaction process, SGD may also be influenced by the tidal pumping. Thus, if the Ra exchange flux can be measured accurately over a tidal cycle, the flux of water associated with SGD should be calculated if the Ra activity in the discharged groundwater has been known (Peterson et al., 2008):
where $ {{F}_\Delta }_{{\rm{Ra}}} $ is the net Ra flux derived from the difference between the sources (other than SGD) and the sinks in the study area; $ Q_{{{\rm{Ra}}}_{{\rm{gw}}}} $ is the Ra activity in the potential groundwater end-member; $Q_{ {{\rm{Ra}}}_{{\rm{total}}}} $ is the Ra measured during the tidal cycle; and $ Q_{{{\rm{Ra}}}_{{\rm{bkgd}}}} $ is the Ra activity in the offshore seawater, which can be seen as the background value of the Ra activity in the DFJR Estuary. To avoid the influence of other factors other than tides as much as possible, the lowest value of Ra activity in the tidal cycle was taken as the background value ($ Q_{{{\rm{Ra}}}_{{\rm{bkgd}}}} $ equals 27.8 Bq/m3 for 224Ra and 1.64 Bq/m3 for 223Ra). Furthermore, $ h $ and $ A $ represent the water depth and area, respectively, and $ \tau $ is the apparent water age. Subsequently, for each time series sample, an SGD flux by applying Eq. (10) based on the variations of 224Ra and 223Ra can been obtained, respectively. The average tidal driven SGD fluxes from 224Ra and 223Ra were 1.15×10⁶ m3/d and 2.44×10⁶ m3/d, respectively, which can account for 24% and 51% of the total SGD flux in the DFJR Estuary, respectively. Therefore, tidal pumping is an important driving force for SGD into the DFJR Estuary. Otherwise, if the cycle-to-cycle differences, tidal variations, and meteorological influence are considered, the role of the tidal pumping in the study area can be more accurately defined. In addition, the groundwater end member could have an important influence on the SGD rate, and if we can increase the sampling density of the groundwater, the SGD rate can be calculated more accurately. However, because of the short half-life and low activity in the environment, the measurement of 223Ra may face certain uncertainties, which in turn can lead to some ambiguity in tracing SGD within the coastal waters. Nevertheless, it is still an effective method for estimating the magnitude of SGD within one day.
5.5
SGD rates into estuaries around the world
Due to the different geographical environments and the anisotropy of coastal sediments, SGD fluxes vary greatly at different sites. Table 1 summarizes the reported SGD rates in the estuaries worldwide. Cases of SGD in estuaries have been studied in temperate, subtropical, and tropical zones. Generally, the SGD rate in the tropical zones was higher than that in the subtropical and temperate zones, which may be due to the high precipitation in the tropical zone and the increase in biomass along the coast as the latitude decreases (Alongi, 2014; Sanders et al., 2016). The precipitation can influence the discharge of freshwater groundwater, leading to the change of total SGD. Meanwhile, the increased biological activities could increase the sediment porosity at the land-sea interface, creating favorable conditions for the SGD. The SGD rate of the DFJR Estuary was lower than that of the other estuaries in the subtropical zone. However, the nutrient concentration in the groundwater around the DFJR Estuary is much higher than that in the surface water (Lu et al., 2020). Thus, even a small volume of SGD can import high nutrient fluxes, leading to significant ecological and environmental effects. For instance, it has been reported that the SGD in a coral reef ecosystem is an important inducer of coastal water acidification in the Sanya Bay, Hainan (Wang et al., 2014). Thus, it is necessary to study the SGD in the nearshore area, especially in closed and semi-closed bays and estuaries, as SGD may have a significant impact on the ecological environment of these water areas and cause serious environmental problems.
Table
1.
Summary of the SGD rates into estuaries around the world
The SGD flux of a subtropical estuary along the Beibu Gulf was studied based on the 224Ra and 223Ra activities in May 2018. The ratios of 224Ra/223Ra were used to derive the average apparent water age of the DFJR Estuary in May 2018 to be 5.3 d. By a Ra mass balance model, the SGD fluxes into the DFJR Estuary in May 2018 were estimated to be 5.98×10⁶ m3/d and 3.60×10⁶ m3/d based on 224Ra and 223Ra, respectively, which can account for 9.73% and 5.86% of the DFJR water discharge in May, indicating that the flux of the important substances discharged through SGD may have an important impact on the balance of budgets for the biogenic elements in the DFJR Estuary. In addition, the tidal-driven SGD fluxes were also estimated via a continuous observation of 224Ra and 223Ra in the DFJR Estuary. The average corresponding tidal-driven SGD fluxes from 224Ra and 223Ra were 1.15×10⁶ m3/d and 2.44×10⁶ m3/d, respectively, which accounted for 24% and 51% of the total SGD flux in the DFJR Estuary, respectively. It was found that the tidal pumping plays an important role in driving the SGD into the DFJR Estuary. Furthermore, the SGD of nutrient-enriched groundwater may have an important impact on the coastal ecosystems of the DFJR Estuary by controlling the water quality in the adjacent sea and altering the stoichiometry of the N:P ratios; these effects should be further investigated.
Adyasari D, Oehler T, Afiati N, et al. 2018. Groundwater nutrient inputs into an urbanized tropical estuary system in Indonesia. Science of the Total Environment, 627: 1066–1079. doi: 10.1016/j.scitotenv.2018.01.281
[2]
Alongi D M. 2014. Carbon cycling and storage in mangrove forests. Annual Review of Marine Science, 6: 195–219. doi: 10.1146/annurev-marine-010213-135020
[3]
Atkins M L, Santos I R, Ruiz-Halpern S, et al. 2013. Carbon dioxide dynamics driven by groundwater discharge in a coastal floodplain creek. Journal of Hydrology, 493: 30–42. doi: 10.1016/j.jhydrol.2013.04.008
[4]
Beck A J, Rapaglia J P, Cochran J K, et al. 2007. Radium mass-balance in Jamaica Bay, NY: evidence for a substantial flux of submarine groundwater. Marine Chemistry, 106(3–4): 419–441. doi: 10.1016/j.marchem.2007.03.008
[5]
Burnett W C, Bokuniewicz H, Huettel M, et al. 2003. Groundwater and pore water inputs to the coastal zone. Biogeochemistry, 66(1–2): 3–33
[6]
Charette M A. 2007. Hydrologic forcing of submarine groundwater discharge: insight from a seasonal study of radium isotopes in a groundwater-dominated salt marsh estuary. Limnology and Oceanography, 52(1): 230–239. doi: 10.4319/lo.2007.52.1.0230
[7]
Charette M A, Buesseler K O. 2004. Submarine groundwater discharge of nutrients and copper to an urban subestuary of Chesapeake Bay (Elizabeth River). Limnology and Oceanography, 49(2): 376–385. doi: 10.4319/lo.2004.49.2.0376
[8]
Charette M A, Henderson P B, Breier C F, et al. 2013. Submarine groundwater discharge in a river-dominated Florida estuary. Marine Chemistry, 156: 3–17. doi: 10.1016/j.marchem.2013.04.001
[9]
Chen Xiaogang, Cukrov N, Santos I R, et al. 2020. Karstic submarine groundwater discharge into the Mediterranean: radon-based nutrient fluxes in an anchialine cave and a basin-wide upscaling. Geochimica et Cosmochimica Acta, 268: 467–484. doi: 10.1016/j.gca.2019.08.019
[10]
Chen Xiaogang, Zhang Fenfen, Lao Yanling, et al. 2018. Submarine groundwater discharge-derived carbon fluxes in mangroves: an important component of blue carbon budgets?. Journal of Geophysical Research: Oceans, 123(9): 6962–6979. doi: 10.1029/2018JC014448
[11]
Colbert S L, Hammond D E. 2008. Shoreline and seafloor fluxes of water and short-lived Ra isotopes to surface water of San Pedro Bay, CA. Marine Chemistry, 108(1–2): 1–17. doi: 10.1016/j.marchem.2007.09.004
[12]
Garcia-Solsona E, Masqué P, Garcia-Orellana J, et al. 2008. Estimating submarine groundwater discharge around Isola La Cura, northern Venice Lagoon (Italy), by using the radium quartet. Marine Chemistry, 109(3–4): 292–306. doi: 10.1016/j.marchem.2008.02.007
[13]
Gu Hequan, Moore W S, Zhang Lei, et al. 2012. Using radium isotopes to estimate the residence time and the contribution of submarine groundwater discharge (SGD) in the Changjiang effluent plume, East China Sea. Continental Shelf Research, 35: 95–107. doi: 10.1016/j.csr.2012.01.002
[14]
Guo Jing. 2020. Nitrogen biogeochemical processes and geochemical record of anthropogenic nutrient loading in coastal regions of Beibu Gulf, Guangxi Province (in Chinese)[dissertation]. Nanning: Guangxi University
[15]
Guo Zhanrong, Huang Lei, Yuan Xiaojie, et al. 2011. Estimating submarine groundwater discharge to the Jiulong River estuary using Ra isotopes. Advances in Water Science (in Chinese), 22(1): 118–125
[16]
Hong Qingquan, Cai Pinghe, Shi Xiangming, et al. 2017. Solute transport into the Jiulong River estuary via pore water exchange and submarine groundwater discharge: new insights from 224Ra/228Th disequilibrium. Geochimica et Cosmochimica Acta, 198: 338–359. doi: 10.1016/j.gca.2016.11.002
[17]
Ji Tao, Du Jinzhou, Moore W S, et al. 2013. Nutrient inputs to a Lagoon through submarine groundwater discharge: the case of Laoye Lagoon, Hainan, China. Journal of Marine Systems, 111-112: 253–262. doi: 10.1016/j.jmarsys.2012.11.007
[18]
Johannes R E. 1980. Ecological significance of the submarine discharge of groundwater. Marine Ecology Progress Series, 3(4): 365–373
[19]
Kelly R P, Moran S B. 2002. Seasonal changes in groundwater input to a well-mixed estuary estimated using radium isotopes and implications for coastal nutrient budgets. Limnology and Oceanography, 47(6): 1796–1807. doi: 10.4319/lo.2002.47.6.1796
[20]
Kwon E Y, Kim G, Primeau F, et al. 2014. Global estimate of submarine groundwater discharge based on an observationally constrained radium isotope model. Geophysical Research Letters, 41(23): 8438–8444. doi: 10.1002/2014GL061574
[21]
Li Pingyang, Xue Rui, Wang Yinghui, et al. 2015. Influence of anthropogenic activities on PAHs in sediments in a significant gulf of low-latitude developing regions, the Beibu Gulf, South China Sea: distribution, sources, inventory and probability risk. Marine Pollution Bulletin, 90(1–2): 218–226. doi: 10.1016/j.marpolbul.2014.10.048
[22]
Lin Junliang, Li Qiurong, Huang Huilin, et al. 2018. A study of pollutant fluxes variations in main sea-going rivers of Guangxi in recent ten years. Journal of Qinzhou University (in Chinese), 33(10): 8–15
[23]
Liu Huatai, Guo Zhanrong, Gao Aiguo, et al. 2016. 18O and 226Ra in the Minjiang River estuary, China and their hydrological implications. Estuarine, Coastal and Shelf Science, 173: 93–101. doi: 10.1016/j.ecss.2015.12.023
[24]
Liu Jianan, Du Jinzhou, Wu Ying, et al. 2018. Nutrient input through submarine groundwater discharge in two major Chinese estuaries: the Pearl River Estuary and the Changjiang River Estuary. Estuarine, Coastal and Shelf Science, 203: 17–28. doi: 10.1016/j.ecss.2018.02.005
[25]
Liu Jianan, Hrustić E, Du Jinzhou, et al. 2019. Net submarine groundwater-derived dissolved inorganic nutrients and carbon input to the oligotrophic stratified karstic estuary of the Krka River (Adriatic Sea, Croatia). Journal of Geophysical Research: Oceans, 124(6): 4334–4349. doi: 10.1029/2018JC014814
[26]
Liu Jin, Wu Yutian, Deng Shuang, et al. 2020. Depth profiles of 228Ra and 228Th in sediment cores in Nansha Sea Area. Environmental Chemistry (in Chinese), 39(8): 2272–2278
[27]
Lu Dongliang, Kang Zhenjun, Yang Bin, et al. 2020. Compositions and spatio-temporal distributions of different nitrogen species and lability of dissolved organic nitrogen from the Dafengjiang River to the Sanniang Bay, China. Marine Pollution Bulletin, 156: 111205. doi: 10.1016/j.marpolbul.2020.111205
[28]
Luek J L, Beck A J. 2014. Radium budget of the York River estuary (VA, USA) dominated by submarine groundwater discharge with a seasonally variable groundwater end-member. Marine Chemistry, 165: 55–65. doi: 10.1016/j.marchem.2014.08.001
[29]
Luo Hao, Li Linwei, Wang Jinlong, et al. 2019. The desorption of radium isotopes in river sediments in Qinzhou Bay. Haiyang Xuebao (in Chinese), 41(4): 27–41
[30]
Luo Jinfu, Li Tianshen, Lan Wenlu. 2016. Evolution trend and prevention strategy of algae bloom in the Beibu Gulf. Environmental Protection (in Chinese), 44(20): 40–42
[31]
Luo Yafei, Huang Haijun, Yan Liwen, et al. 2015. Distribution and diffusion of suspended matters based on remote sensing in the Dafengjiang Estuary. Transactions of Oceanology and Limnology (in Chinese), 27(3): 14–20
[32]
Maher D T, Santos I R, Golsby-Smith L, et al. 2013. Groundwater-derived dissolved inorganic and organic carbon exports from a mangrove tidal creek: the missing mangrove carbon sink?. Limnology and Oceanography, 58(2): 475–488. doi: 10.4319/lo.2013.58.2.0475
[33]
Makings U, Santos I R, Maher D T, et al. 2014. Importance of budgets for estimating the input of groundwater-derived nutrients to an eutrophic tidal river and estuary. Estuarine, Coastal and Shelf Science, 143: 65–76. doi: 10.1016/j.ecss.2014.02.003
[34]
Moore W S. 2003. Sources and fluxes of submarine groundwater discharge delineated by radium isotopes. Biogeochemistry, 66(1–2): 75–93
[35]
Moore W S. 2006. Radium isotopes as tracers of submarine groundwater discharge in Sicily. Continental Shelf Research, 26(7): 852–861. doi: 10.1016/j.csr.2005.12.004
[36]
Moore W S, Arnold R. 1996. Measurement of 223Ra and 224Ra in coastal waters using a delayed coincidence counter. Journal of Geophysical Research: Oceans, 101(C1): 1321–1329. doi: 10.1029/95JC03139
[37]
Moore W S, Beck M, Riedel T, et al. 2011. Radium-based pore water fluxes of silica, alkalinity, manganese, DOC, and uranium: a decade of studies in the German Wadden Sea. Geochimica et Cosmochimica Acta, 75(21): 6535–6555. doi: 10.1016/j.gca.2011.08.037
[38]
Moore W S, Blanton J O, Joye S B. 2006. Estimates of flushing times, submarine groundwater discharge, and nutrient fluxes to Okatee Estuary, South Carolina. Journal of Geophysical Research: Oceans, 111(C9): C09006
[39]
Moore W S, Krest J. 2004. Distribution of 223Ra and 224Ra in the plumes of the Mississippi and Atchafalaya Rivers and the Gulf of Mexico. Marine Chemistry, 86(3–4): 105–119. doi: 10.1016/j.marchem.2003.10.001
[40]
Moore W S, Sarmiento J L, Key R M. 2008. Submarine groundwater discharge revealed by 228Ra distribution in the upper Atlantic Ocean. Nature Geoscience, 1(5): 309–311. doi: 10.1038/ngeo183
[41]
Null K A, Corbett D R, DeMaster D J, et al. 2011. Porewater advection of ammonium into the Neuse River estuary, North Carolina, USA. Estuarine, Coastal and Shelf Science, 95(2–3): 314–325. doi: 10.1016/j.ecss.2011.09.016
[42]
Petermann E, Knöller K, Rocha C, et al. 2018. Coupling end-member mixing analysis and isotope mass balancing (222-Rn) for differentiation of fresh and recirculated submarine groundwater discharge into Knysna Estuary, South Africa. Journal of Geophysical Research: Oceans, 123(2): 952–970. doi: 10.1002/2017JC013008
[43]
Peterson R N, Burnett W C, Taniguchi M, et al. 2008. Radon and radium isotope assessment of submarine groundwater discharge in the Yellow River delta, China. Journal of Geophysical Research: Oceans, 113(C9): C09021
[44]
Prakash R, Srinivasamoorthy K, Gopinath S, et al. 2018. Measurement of submarine groundwater discharge using diverse methods in Coleroon Estuary, Tamil Nadu, India. Applied Water Science, 8(1): 13. doi: 10.1007/s13201-018-0659-0
[45]
Rahaman W, Singh S K. 2012. Sr and 87Sr/86Sr in estuaries of western India: impact of submarine groundwater discharge. Geochimica et Cosmochimica Acta, 85: 275–288. doi: 10.1016/j.gca.2012.02.025
[46]
Rengarajan R, Sarma V V S S. 2015. Submarine groundwater discharge and nutrient addition to the coastal zone of the Godavari estuary. Marine Chemistry, 172: 57–69. doi: 10.1016/j.marchem.2015.03.008
[47]
Sadat-Noori M, Maher D T, Santos I R. 2016a. Groundwater discharge as a source of dissolved carbon and greenhouse gases in a subtropical estuary. Estuaries and Coasts, 39(3): 639–656. doi: 10.1007/s12237-015-0042-4
[48]
Sadat-Noori M, Santos I R, Sanders C J, et al. 2015. Groundwater discharge into an estuary using spatially distributed radon time series and radium isotopes. Journal of Hydrology, 528: 703–719. doi: 10.1016/j.jhydrol.2015.06.056
[49]
Sadat-Noori M, Santos I R, Tait D R, et al. 2016b. Fresh meteoric versus recirculated saline groundwater nutrient inputs into a subtropical estuary. Science of the Total Environment, 566-567: 1440–1453. doi: 10.1016/j.scitotenv.2016.06.008
[50]
Sadat-Noori M, Santos I R, Tait D R, et al. 2017. High porewater exchange in a mangrove-dominated estuary revealed from short-lived radium isotopes. Journal of Hydrology, 553: 188–198. doi: 10.1016/j.jhydrol.2017.07.058
[51]
Sanders C J, Maher D T, Tait D R, et al. 2016. Are global mangrove carbon stocks driven by rainfall?. Journal of Geophysical Research: Biogeosciences, 121(10): 2600–2609. doi: 10.1002/2016JG003510
[52]
Santos I R, Bryan K R, Pilditch C A, et al. 2014. Influence of porewater exchange on nutrient dynamics in two New Zealand estuarine intertidal flats. Marine Chemistry, 167: 57–70. doi: 10.1016/j.marchem.2014.04.006
[53]
Schwartz M C. 2003. Significant groundwater input to a coastal plain estuary: assessment from excess radon. Estuarine, Coastal and Shelf Science, 56(1): 31–42. doi: 10.1016/S0272-7714(02)00118-X
[54]
Su Ni, Du Jinzhou, Moore W S, et al. 2011. An examination of groundwater discharge and the associated nutrient fluxes into the estuaries of eastern Hainan Island, China using 226Ra. Science of the Total Environment, 409(19): 3909–3918. doi: 10.1016/j.scitotenv.2011.06.017
[55]
Sun Jian, Lin Binliang, Li Kaiming, et al. 2014. A modelling study of residence time and exposure time in the Pearl River Estuary, China. Journal of Hydro-Environment Research, 8(3): 281–291. doi: 10.1016/j.jher.2013.06.003
[56]
Swarzenski P W, Burnett W C, Greenwood W J, et al. 2006. Combined time-series resistivity and geochemical tracer techniques to examine submarine groundwater discharge at Dor Beach, Israel. Geophysical Research Letters, 33(24): L24405. doi: 10.1029/2006GL028282
[57]
Wang Guizhi, Jing Wenping, Wang Shuling, et al. 2014. Coastal acidification induced by tidal-driven submarine groundwater discharge in a coastal coral reef system. Environmental Science & Technology, 48(22): 13069–13075
[58]
Wang Guizhi, Wang Zhangyong, Zhai Weidong, et al. 2015a. Net subterranean estuarine export fluxes of dissolved inorganic C, N, P, Si, and total alkalinity into the Jiulong River estuary, China. Geochimica et Cosmochimica Acta, 149: 103–114. doi: 10.1016/j.gca.2014.11.001
[59]
Wang Yali, Zhang Fenfen, Chen Xiaogang, et al. 2020. Influence of submarine groundwater discharge in the blue carbon budget of typical mangrove: a case study from the Zhenzhu Bay, Guangxi. Haiyang Xuebao (in Chinese), 42(10): 37–46
[60]
Wang Yu, Xiang Peng, Ye Youyin, et al. 2015b. Ecological characteristics of phytoplankton community in the habitat of Sousa Chinensis at Sanniangwan Bay, Guangxi. Chinese Journal of Applied & Environmental Biology (in Chinese), 21(6): 1162–1169
[61]
Wang Zhangyong, Wang Guizhi, Wang Shuling. 2013. Estimation of submarine groundwater discharge into the Sanya River estuary in the winter using 223Ra and 224Ra as tracers. China Sciencepaper (in Chinese), 8(9): 915–919
[62]
Webb J R, Santos I R, Maher D T, et al. 2019. Groundwater as a source of dissolved organic matter to coastal waters: insights from radon and CDOM observations in 12 shallow coastal systems. Limnology and Oceanography, 64(1): 182–196. doi: 10.1002/lno.11028
[63]
Xu Bochao, Dimova N T, Zhao Liang, et al. 2013. Determination of water ages and flushing rates using short-lived radium isotopes in large estuarine system, the Yangtze River Estuary, China. Estuarine, Coastal and Shelf Science, 121–122: 61–68. doi: 10.1016/j.ecss.2013.02.005
[64]
Xu Shuqing, Li Jiaming, Lu Shibiao, et al. 2010. The status of Mangrove resources and sustainable development strategies in Beibu Gulf of Guangxi. Bulletin of Biology (in Chinese), 45(5): 11–14
[65]
Yang Bin, Kang Zhenjun, Lu Dongliang, et al. 2018. Spatial variations in the abundance and chemical speciation of phosphorus across the river-sea interface in the Northern Beibu Gulf. Water, 10(8): 1103. doi: 10.3390/w10081103
[66]
Yang Jing, Zhang Renduo, Zhao Zhuangming, et al. 2015. Temporal and spatial distribution characteristics of nutrients in the coastal seawater of Guangxi Beibu Gulf during the past 25 years. Ecology and Environmental Sciences (in Chinese), 24(9): 1493–1498
[67]
Zhao Shibin, Xu Bochao, Yao Qinzhen, et al. 2021. Nutrient-rich submarine groundwater discharge fuels the largest green tide in the world. Science of the Total Environment, 770: 144845. doi: 10.1016/j.scitotenv.2020.144845
[68]
Zhang Yan, Santos I R, Li Hailong, et al. 2020. Submarine groundwater discharge drives coastal water quality and nutrient budgets at small and large scales. Geochimica et Cosmochimica Acta, 290: 201–215. doi: 10.1016/j.gca.2020.08.026
Qiangqiang Zhong, Hao Wang, Qiugui Wang, et al. Study of Ra desorption processes in an estuary system with high-turbidity at the Southeast China. Journal of Environmental Radioactivity, 2023, 259-260: 107108. doi:10.1016/j.jenvrad.2023.107108
2.
Zhaoxi Liu, Mingchen Ge, Qianqian Wang, et al. Spatial distribution and export of nutrients and metal elements in the subterranean estuary of Daya Bay. Acta Oceanologica Sinica, 2023, 42(8): 77. doi:10.1007/s13131-023-2212-8
3.
Huaxian Zhao, Shu Yang, Xinyi Qin, et al. Disentangling the Ecological Processes and Driving Forces Shaping the Seasonal Pattern of Halobacteriovorax Communities in a Subtropical Estuary. Microbial Ecology, 2023, 86(3): 1881. doi:10.1007/s00248-023-02195-w
Xilong Wang, Kaijun Su, Juan Du, Linwei Li, Yanling Lao, Guizhen Ning, Li Bin. Estimating submarine groundwater discharge at a subtropical river estuary along the Beibu Gulf, China[J]. Acta Oceanologica Sinica, 2021, 40(9): 13-22. doi: 10.1007/s13131-021-1862-7
Xilong Wang, Kaijun Su, Juan Du, Linwei Li, Yanling Lao, Guizhen Ning, Li Bin. Estimating submarine groundwater discharge at a subtropical river estuary along the Beibu Gulf, China[J]. Acta Oceanologica Sinica, 2021, 40(9): 13-22. doi: 10.1007/s13131-021-1862-7
Figure 1. Location of Beibu Gulf and the Dafengjiang River (DFJR) facing the Beibu Gulf, in the southern part of China (a); sampling stations in and around the DFJR Estuary in May 2018 (b); the phenomenon of pumping marine sand in the river course (c); and the Chinese white dolphin in the Sanniang Bay (d) shown in b.
Figure 2. Monthly precipitation in Qinzhou (the city where the DFJR Estuary is located) and the river flow rate into the DFJR Estuary (a); the behavior of tidal levels and its relationship with the Yellow Sea base (unit: m) (b).
Figure 3. Distributions of temperature (a) and salinity (b) in the surface water of the DFJR Estuary in May 2018.
Figure 4. Distributions of 224Ra (a) and 223Ra (b) in the surface water of the DFJR Estuary in May 2018.
Figure 5. Activities of 224Ra (a) and 223Ra (b) versus salinity in the DFJR Estuary in May 2018.
Figure 6. Plots of 224Ra versus 223Ra for all samples in the DFJR Estuary; b is an enlarged figure of the red frame in a.
Figure 7. Tidal level condition and the measured salinity, 224Ra and 223Ra activities of the DFJR Estuary during time series sampling in May 21–22, 2018.


 DownLoad:


 DownLoad: