Yellow Sea Fisheries Research Institute, Chinese Academy of Fishery Sciences, Qingdao 266071, China
2.
Marine Ecology and Environmental Science Laboratory, Pilot National Laboratory for Marine Science and Technology (Qingdao), Qingdao 266237, China
Funds:
The Youth Talent Support Program of the Laboratory for Marine Ecology and Environmental Science, Pilot National Laboratory for Marine Science and Technology (Qingdao) under contract No. LMEESYTSP-2018-04-02; the Creative Team Project of the Laboratory for Marine Ecology and Environmental Science, Pilot National Laboratory for Marine Science and Technology (Qingdao) under contract No. LMEES-CTSP-2018-4; the Central Public-interest Scientific Institution Basal Research Fund, CAFS under contract No. 2020TD50.
Growth and energy budget of marine amphipod juvenile Eogammarus possjeticus at different temperatures (20°C, 24°C, 26°C, 28°C, 30°C, 32°C and 34°C) were investigated in this study. The results showed that the cumulative mortality rate increased significantly with rising temperature (p<0.01), and exceeded 50% after 24 h when temperature was above 30°C. With the temperature increasing from 20°C to 26°C, the ingestion rate and absorption rate increased, but decreased significantly above 28°C (p<0.01), indicating a decline in feeding ability at high temperatures. The specific growth rate increased with rising temperature, but decreased significantly (p<0.01) after reaching the maximum value at 24°C. Similarly, the oxygen consumption and ammonia emission rates also showed a trend of first increase and then decrease. However, the O:N ratio decreased first and then increased with rising temperature, indicating that the energy demand of E. possjeticus juvenile transferred from metabolism of carbohydrate and lipid to protein. In the energy distribution of amphipods, the proportion of each energy is different. With rising temperature, the ratio of the energy deposited for growth accounted for ingested gross energy showing a trend of decrease, while the energy lost to respiration, ammonia excretion, and feces accounted for ingested gross energy being showed a trend of increase. It seemed that rising temperature increased the metabolism and energy consumption of the amphipods and, meanwhile, decreased the energy used for growth, which may be an important reason for the slow growth and small body size of the amphipods during the summer high-temperature period.
Temperature directly affects survival, metabolism, growth, and other physiological processes of animals, and, accordingly, their population development and biodiversity (Cottin et al., 2012). Climate warming has affected most ecosystems (Ohlberger, 2013). Although climate change occurs naturally over time, the current rate of warming is unprecedented and could seriously affect many communities (Parmesan, 2006; IPCC, 2007). In recent years, growing evidence suggests that the average body size of many organisms in both aquatic and terrestrial environments is declining as a result of climate warming (Gardner et al., 2011). This phenomenon has been suggested to represent a universal response to global warming that may impose significant adverse effects on ecosystem functioning and services (Baudron et al., 2014). Smaller mean body sizes in response to contemporary climate warming have been reported for a number of organisms in both aquatic and terrestrial environments (Sheridan and Bickford, 2011), including crustaceans (Moore and Folt, 1993), fishes (Todd et al., 2008; Genner et al., 2010; Cheung et al., 2013), amphibians (Reading, 2007), birds and mammals (Yom-Tov and Geffen, 2011). This indicates that negative effects of rising temperature on organism body size have been observed in both ecotherms and endotherms, but the mechanisms through which temperature affects individual physiology and body size differ fundamentally between the two groups. The body temperature of ectotherms closely tracks that of their immediate surrounding whereas endotherms maintain a constantly high core temperature (Hochachka and Somero, 1984; Atkinson and Sibly, 1997). Therefore, temperature has more profound effects on ectotherms. Moreover, ectotherms constitute the vast majority of organism biomass and about 99% of all species worldwide (Millien et al., 2006). So it is particularly important to understand how ectotherms respond to a warming climate. At present, most studies on ecological responses to climate change have focused on changes in species distribution (Parmesan and Yohe, 2003; Root et al., 2003) and phenology (Stenseth et al., 2002; Walther et al., 2002; Durant et al., 2007). So far, however, studies in the field of the relationship between temperature and body size have been mainly descriptive, with few researches on the interaction between physiological mechanisms that determine body size and the ecological environment (Ohlberger, 2013). It is well known that body size reflects growth potential and energetics, changing body size has implications for resilience in the face of climate change (Gardner et al., 2011). Accordingly, this research is expected to study the effects of climate warming on physiological process from the perspective of energy, so as to obtain more data on the temperature regulation and metabolic response of marine organisms as well as the physiology and response to rising temperature, which will increase the understanding of the potential mechanism and physiological consequences of size change.
Amphipod is one of the crustaceans with the highest ecological and species diversity, with more than 10 000 species, distributed in almost all aquatic environments around the world, including ocean, freshwater, and estuarine environments (Arfianti et al., 2018; Horton et al., 2021), especially abundant in marine ecosystems (Bedulina et al., 2010). They occupied an intermediate trophic position, represent a key link between trophic levels, and play a crucial role in nutrient cycles (Piscart et al., 2011; Machado et al., 2019). Because of their large numbers, rapid reproduction, short life cycle, and sensitivity to environmental changes (Xue et al., 2018), they are becoming increasingly important as model organisms in studies on development, regeneration, ecotoxicology, and evolutionary biology (Naumenko et al., 2017; Fišer et al., 2018). Therefore, it is of great significance to study the effects of temperature rise on the growth and energy budget of amphipods for researching the physiological mechanisms of climate warming to ectotherms. The amphipod Eogammarus possjeticus (Anisogammaridae) is common in northern China and is widely distributed along the coast of the Yellow Sea and Bohai Sea (Ren, 2006). This species has a higher mortality rate, slower growth, and smaller body size at higher temperature, especially during summer (Xue et al., 2013); correspondingly, its energy metabolism is likely also affected. This study focused on the survival, growth, respiratory metabolism, and energy budget of E. possjeticus juvenile under temperature rises. This study explored the physiological and ecological response mechanism of amphipods to rising temperature, to provide some basic data for the research of energy ecology of ectotherms as a consequence of global warming.
2.
Materials and methods
2.1
Amphipod collection and cultivation
Amphipods E. possjeticus were collected from the Laizhou Bay (37°03′–37°10′N, 119°29′–119°30′E) in May 2018 using a suction sampler and were sieved through a 2 mm mesh. The animal samples were transported to the laboratory within 3 h in three sealed plastic bags, filled with one-third seawater (10 L) and two-thirds of the pure oxygen.
A total of 500–600 of healthy and vigorous mating pairs were selected and evenly distributed to five identical incubators (50 cm long, 40 cm wide and 30 cm high) filled with 30 L of seawater in the laboratory. The mating pairs in all the containers were checked at 1 h or 2 h intervals until they separated from each other; and then the males were immediately removed and the ovigerous females were cultured separately. After hatching, about 1 000 juveniles (4–6 mm length) from a single batch were cultured temporarily in a plastic tank (50 cm long, 40 cm wide and 30 cm high) filled with 10 L seawater at temperature of 18.8°C to 19.7°C, salinity of 29 to 32, pH of 8.0 to 8.1, and dissolved oxygen of 6.3 mg/L to 7.1 mg/L. The amphipods were cultured with a 12L:12D photoperiod. The seawater was renewed every day and the amphipods were fed with fresh macroalgae (Enteromorpha sp.) which were taken from the seaside of the Fushan Bay (36°02′–36°03′N, 120°21′–120°22′E) in May 2018 once a day. The wet weight of the macroalgae was at 150%–200% of the amphipod’s total wet body weight. The amphipods were allowed to acclimatize to the cultivation conditions for one week before the experiments.
2.2
Experimental design and sampling
2.2.1
Cumulative mortality and median lethal temperature
This study designed seven temperatures (20°C-control, 24°C, 26°C, 28°C, 30°C, 32°C, and 34°C) and separately heated samples to the designed temperatures in triplicates. At the beginning of experimentation, water temperature in each treatment started at 20°C, and was increased (by temperature control system) to the target treatment temperature by 0.5°C/h. After reaching the treatment temperature, the mortality rate and median lethal temperature of amphipods at 12 h, 24 h, 48 h, 72 h, 96 h, and 7 d were determined. Experiments were conducted in 2 L plastic tanks filled with 1 L of continuously aerated water. Each test tank contained 40 individuals.
Cumulative mortality rate (MR, %) was calculated by the following formula:
where Nt is the number of dead individuals, and N0 is the original number of individuals per treatment.
Cumulative mortality data were used to estimate median lethal temperature (LT50) and confidence intervals (95%) for different treatments, using the improved Trimmed Spearman Karber method (Huang and Xu, 2017):
where i is class interval (the logarithmic difference between two adjacent temperature intervals); Xm is the logarithms of the maximum temperature; p is mortality of each treatment (expressed as a decimal); and $\sum p$ is the sum of mortalities for all temperature treatments.
Calculation of 95% confidence intervals for LT50 as follows:
where Sx50 is the standard error of lg LT50; q is survival rate for all treatments, and equals 1−p; n is the number of amphipods in each treatment.
2.2.2
Food ingestion and individual growth
Ingestion, growth, respiratory, and excretion were determined for each treatment at 7 d. Because juvenile survival at 32°C and 34°C was <50% after 24 h, calculation of ingestion and growth rates was limited to juveniles in treatments at 20°C, 24°C, 26°C, 28°C, and 30°C.
Before experimentation, uneaten food was removed and feces were siphoned from each tank. Amphipods, 30 individuals in each of three replicates for each treatment, were fed (0.510±0.002) g (wet weight) of Enteromorpha sp. algae. Feces were siphoned from the bottom of tanks into large beakers after 24 h of feeding, and uneaten algae were carefully removed with forceps.
Ingestion (IR, mg/(g·h)), absorption (AR, %), faecal egestion (FR, mg/(g·h)), and specific growth (SGR, %) rates per day were calculated as follows:
where Wd is the dry weight of food consumed (mg), Wa is the wet weight of amphipods for food ingestion experiment (g), Wf is the dry weight of feces (mg), W0 and Wt are the initial and final mean wet weights of amphipods (g), respectively; L0 and Lt are the initial and final mean body lengths (anterior margin of the head to posterior tip of the telson) of amphipods (mm), respectively; t1 and t2 are the food ingestion time (h) and the experimental duration (d), respectively.
2.2.3
Respiration and excretion
Respiration was calculated by comparing the dissolved oxygen content of closed 1 L bottles filled with seawater containing 30 individuals to that in a reference bottle without amphipods following 4 h incubation. Ammonia excretion was measured at the end of respiratory experiments. No food was provided during the respiration and excretion tests. Experiments were replicated three times.
where D0 and Dt are the dissolved oxygen contents of the control and temperature treatment, respectively; N0 and Nt are the ammonia nitrogen concentrations in water in the control and temperature treatment (mg/L). V is the respiratory chamber volume (L), t is the experimental duration (h), and R1 and R2 are the oxygen consumption rates of amphipods at temperatures T1 and T2, respectively.
2.2.4
Energy budget
Energy budgets were calculated using the method described by Fang et al. (2010), and were established according to the equation:
$$
C = G + F + U + R,
$$
(13)
where C is energy consumed, G is energy for growth, F is energy loss to faeces, and U is energy lost to ammonia excretion, and R is energy loss as respiration. Because the experimental duration was relatively short, this study does not consider molting energy.
2.3
Data analyses
Statistical analyses were conducted using Excel and IBM SPSS statistical software. Differences in parameters between treatments were compared by one-factor ANOVA model followed by Tukey’s test for multiple comparisons at a significance level of 0.05. Prior to statistical analyses, raw data were assessed for normality and homogeneity of variance by Kolmogorov–Smirnov and Levene’s tests, respectively.
3.
Results
3.1
Cumulative mortality and median lethal temperature
The cumulative mortality of E. possjeticus juvenile at different temperatures was shown in Table 1. With rising temperature, cumulative mortality rate gradually increased, especially above 30°C. The LT50 values and corresponding 95% confidence intervals at various times were obtained using a modified Karber’s method (Table 2). LT50 gradually decreased from 32.66°C at 12 h to 29.32°C at 7 d. ANOVA revealed a significant effect of temperature on the cumulative mortality rate (p<0.01, df=6, mean square=6 032.14, F=71.20).
Table
1.
The cumulative mortality rates of E. possjeticus juvenile under different temperatures
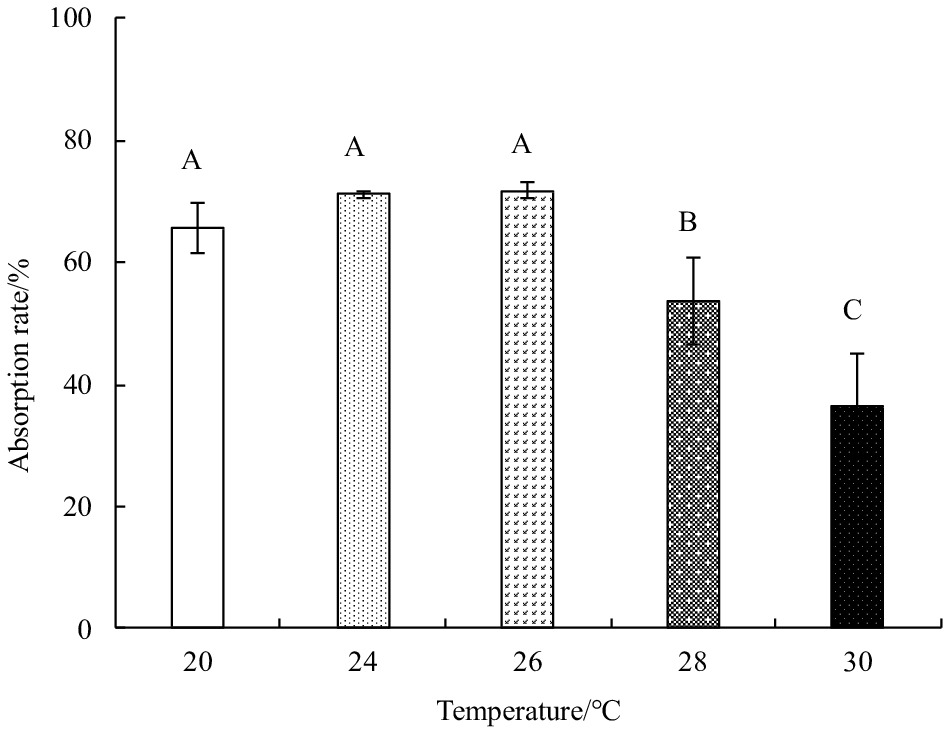
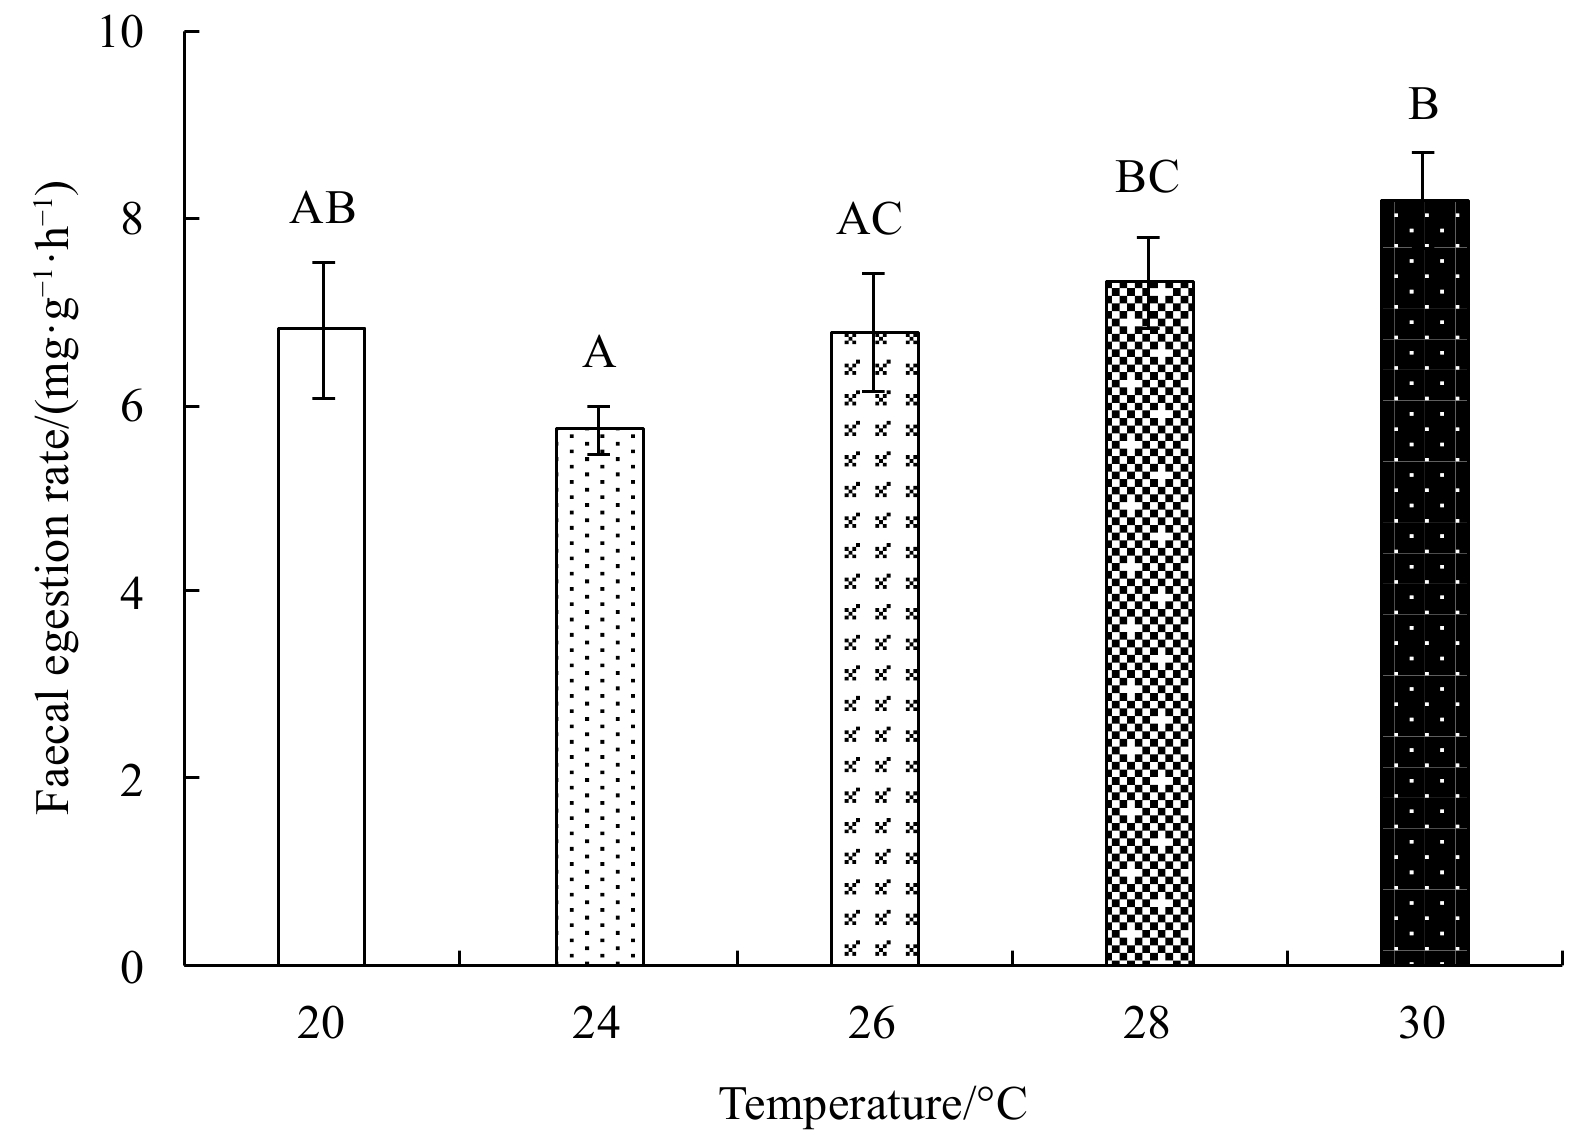
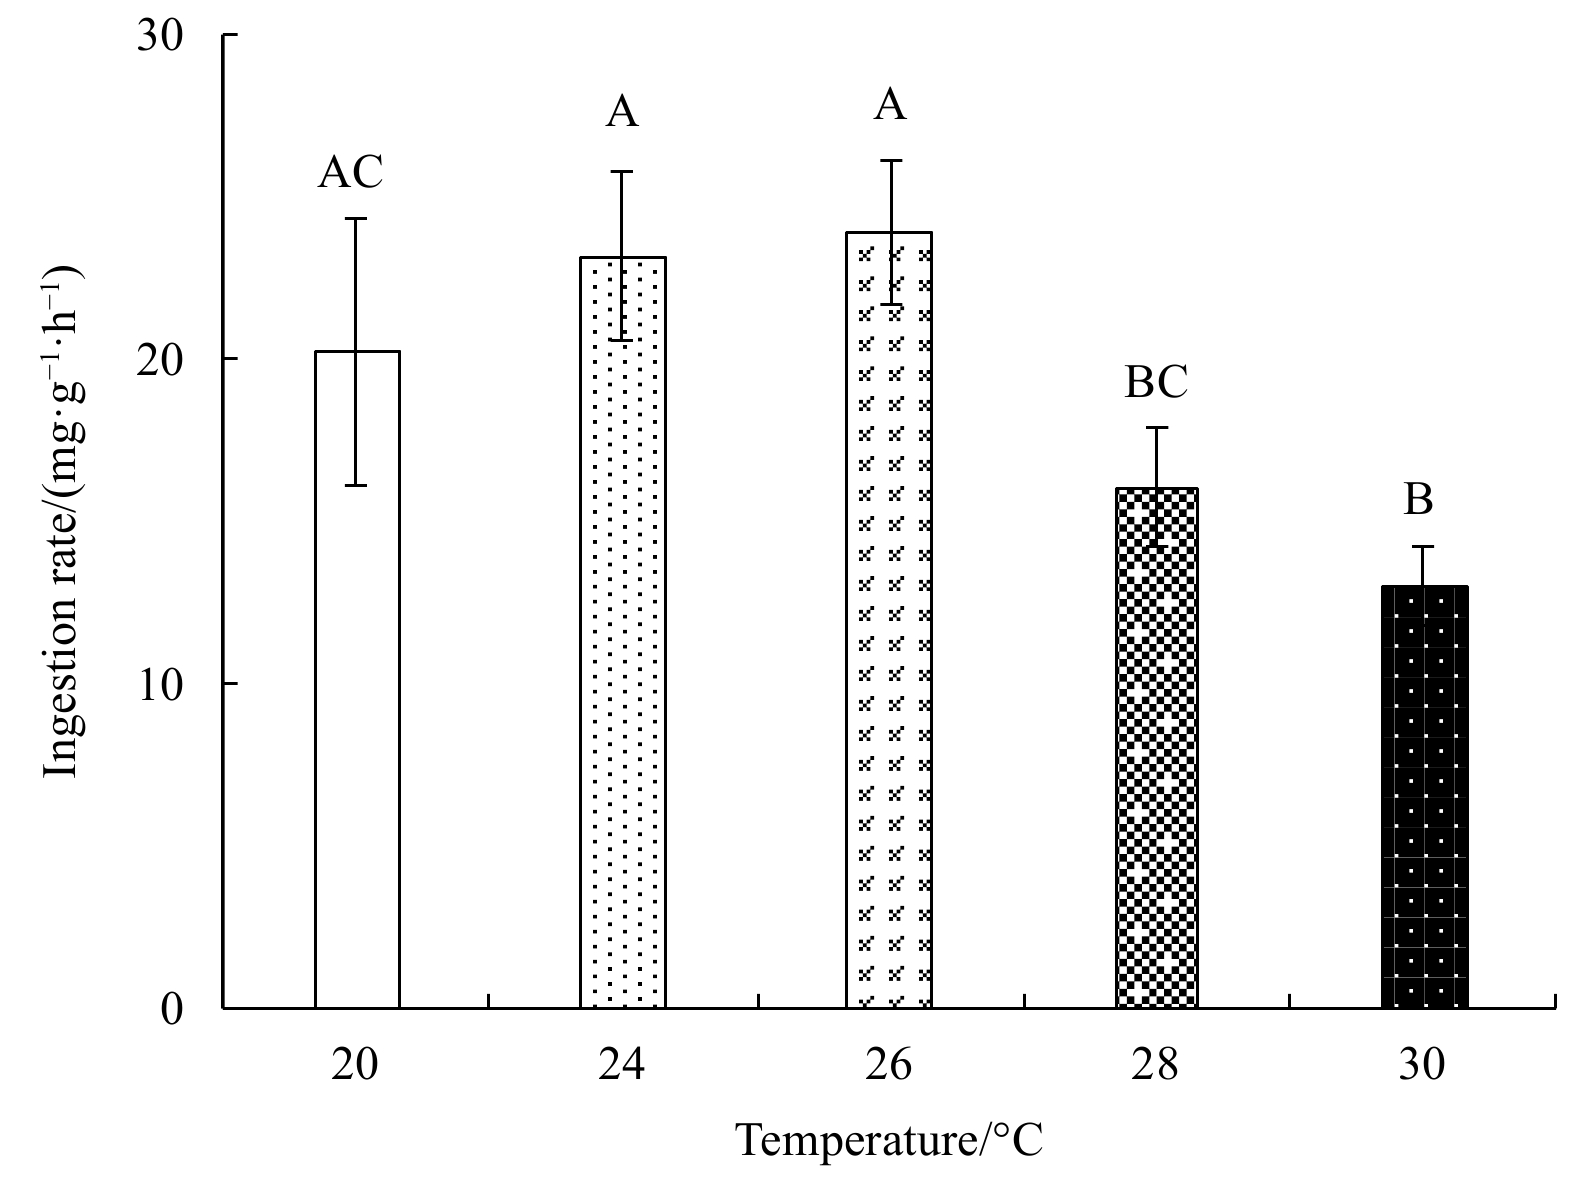
Ingestion rates and feed absorption efficiencies first increased, and then gradually decreased with rising temperature (Figs 1 and 2). Both parameters were highest at 26°C and lowest at 30°C. The maximum ingestion rate was (23.95±2.23) mg/(g·h), and the minimum (13.06±1.22) mg/(g·h); the maximum feed absorption efficiency was 71.75%±1.33%, and the minimum 36.60%±8.32%. The fecal egestion rate first decreased, and then increased with rising temperature (Fig. 3). One-factor ANOVA revealed significant differences in ingestion rate (p<0.01, df=4, mean square=65.14, F=6.49), feed absorption efficiency (p<0.01, df=4, mean square=661.15, F=15.86), and fecal egestion rate at different temperatures (p<0.05, df=4, mean square=2.40, F=5.24).
Figure
1.
The ingestion rate of E. possjeticus juvenile at different temperatures. Different capital letters indicate significant differences (p<0.05) among different treatments, the same as below.
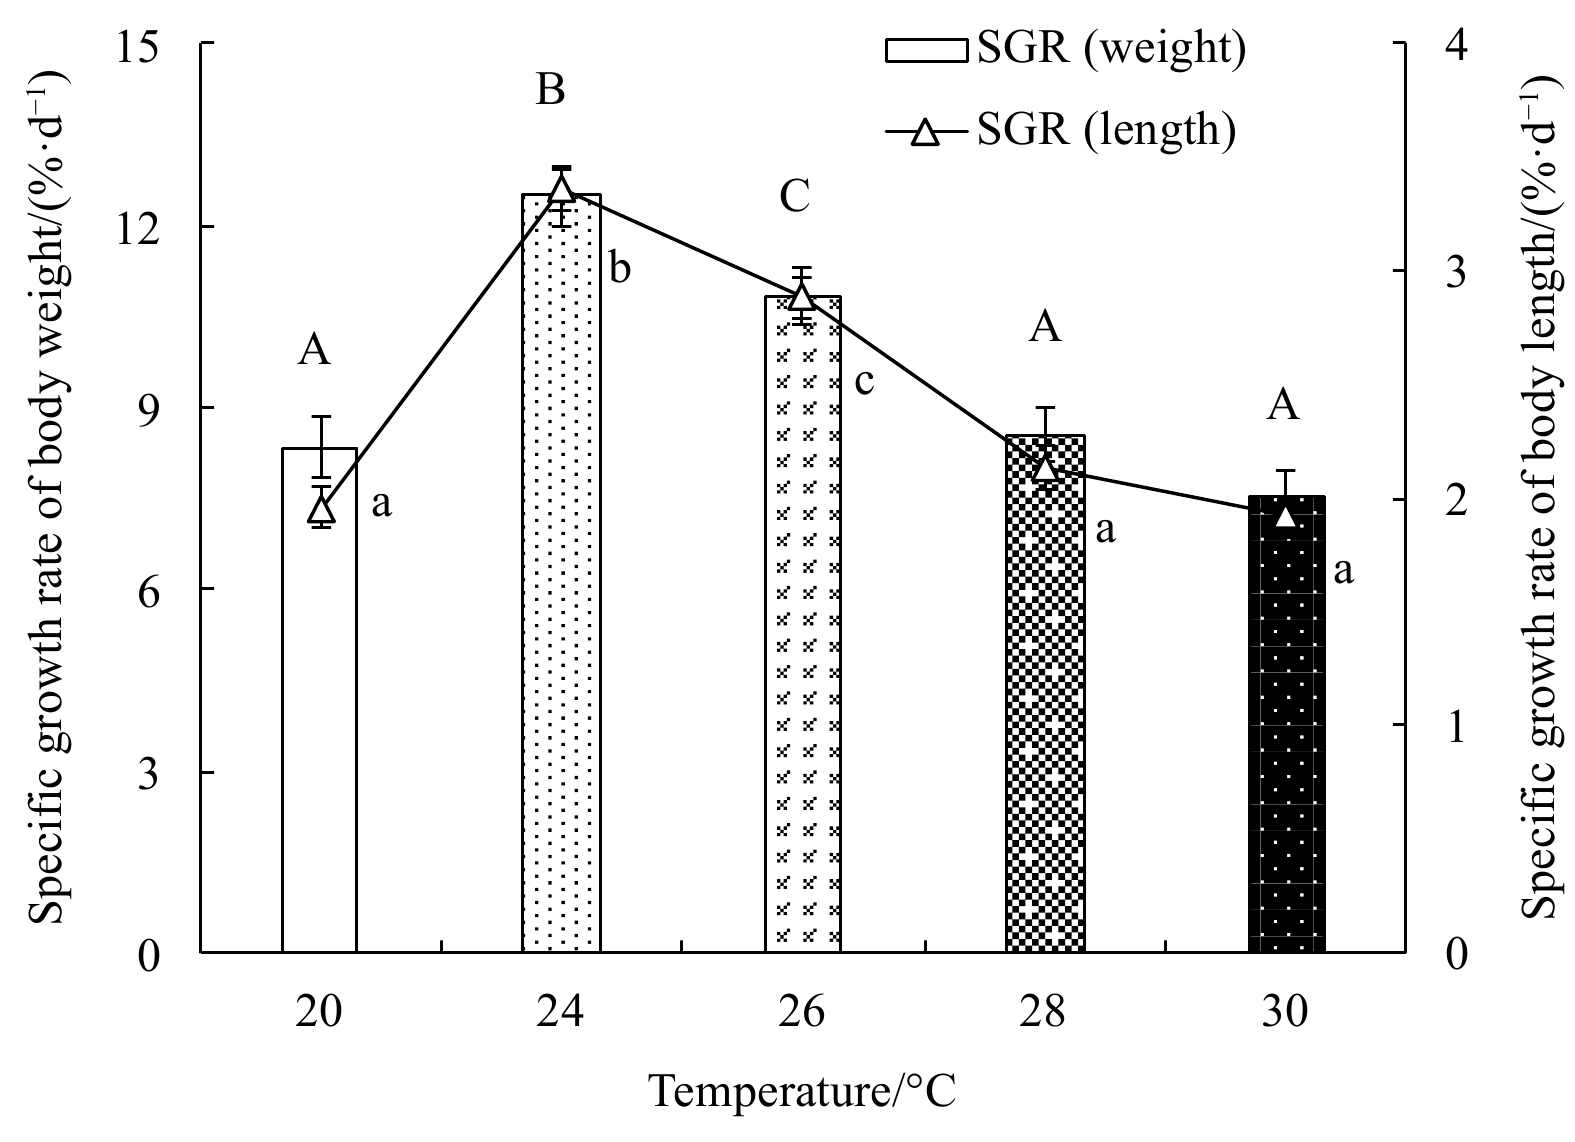
Specific growth rate first increased, and then decreased with rising temperature (Fig. 4). The SGR in weight (SGRw) and length (SGRl) were highest at 24°C, with maxima 12.50%±0.50% per day and 3.36%±0.09% per day, respectively, and lowest at 30°C, with minima 7.53%±0.43% per day and 1.92%±0.09% per day, respectively. One-factor ANOVA revealed temperature had a significant effect on the specific growth rate (SGRw, p<0.01, df=4, mean square=12.73, F=38.09; SGRl, p<0.01, df=4, mean square=1.22, F=95.34).
Figure
4.
The specific growth rate of body weight and specific growth rate of body length of E. possjeticus juvenile at different temperatures.
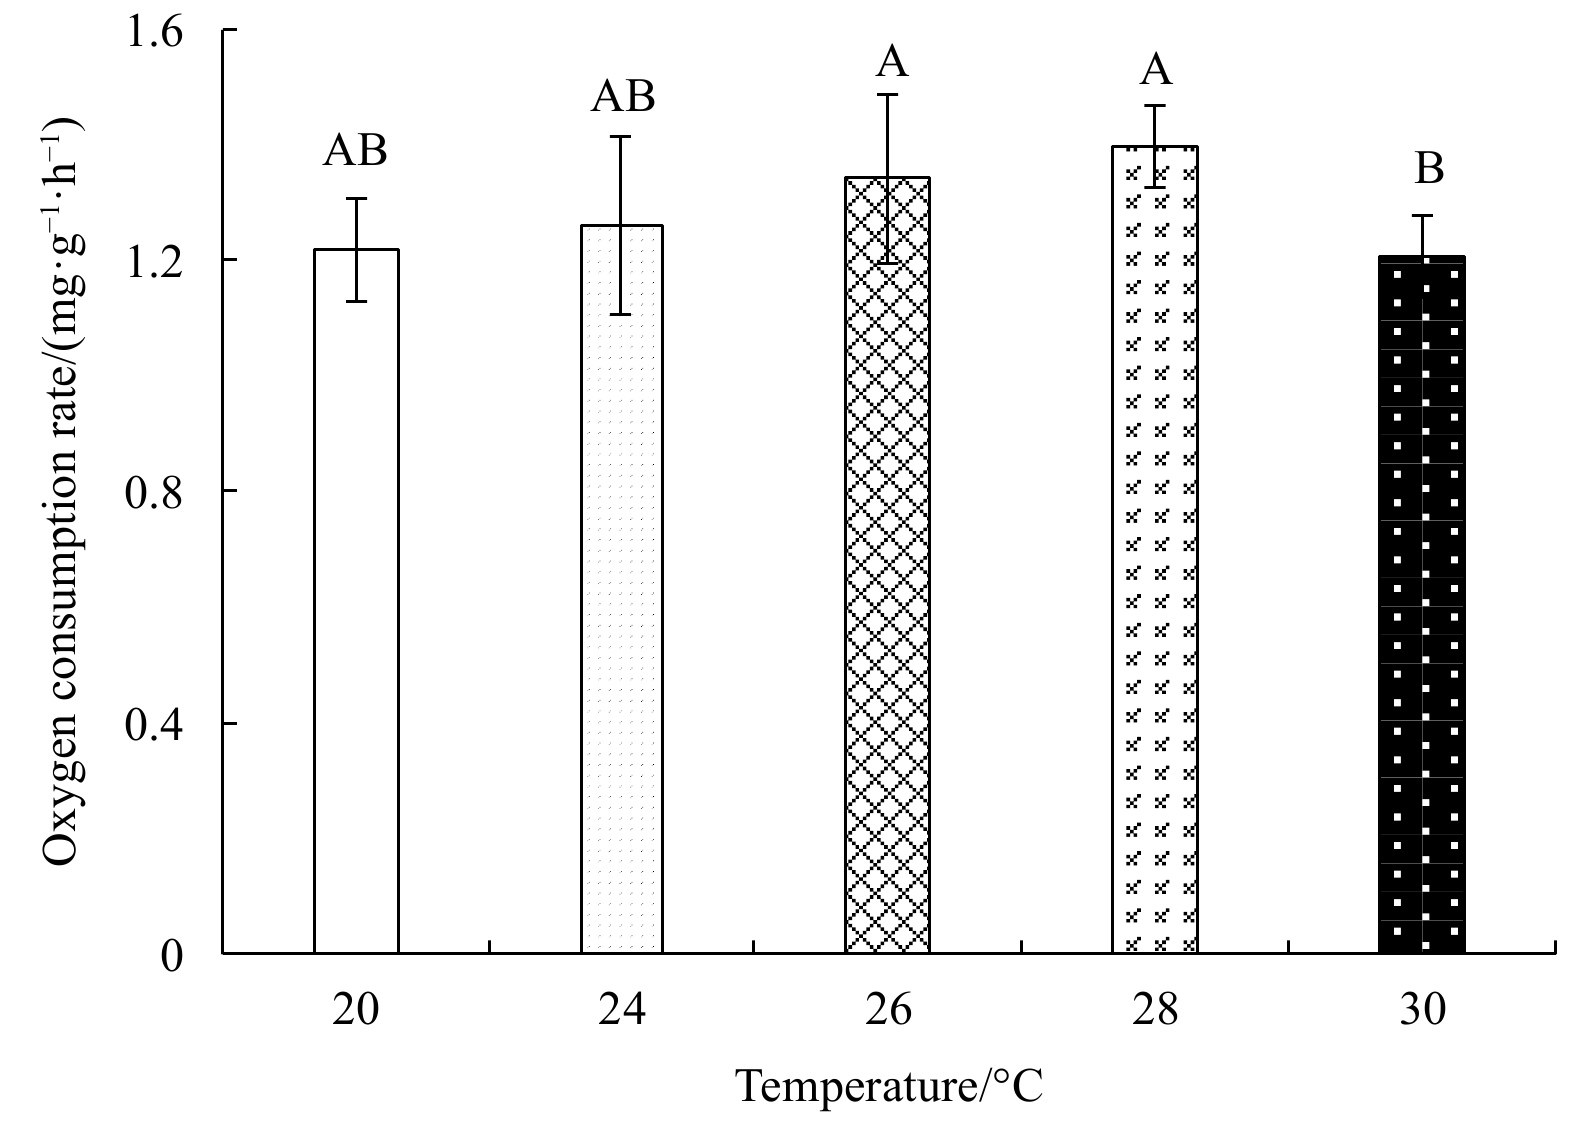
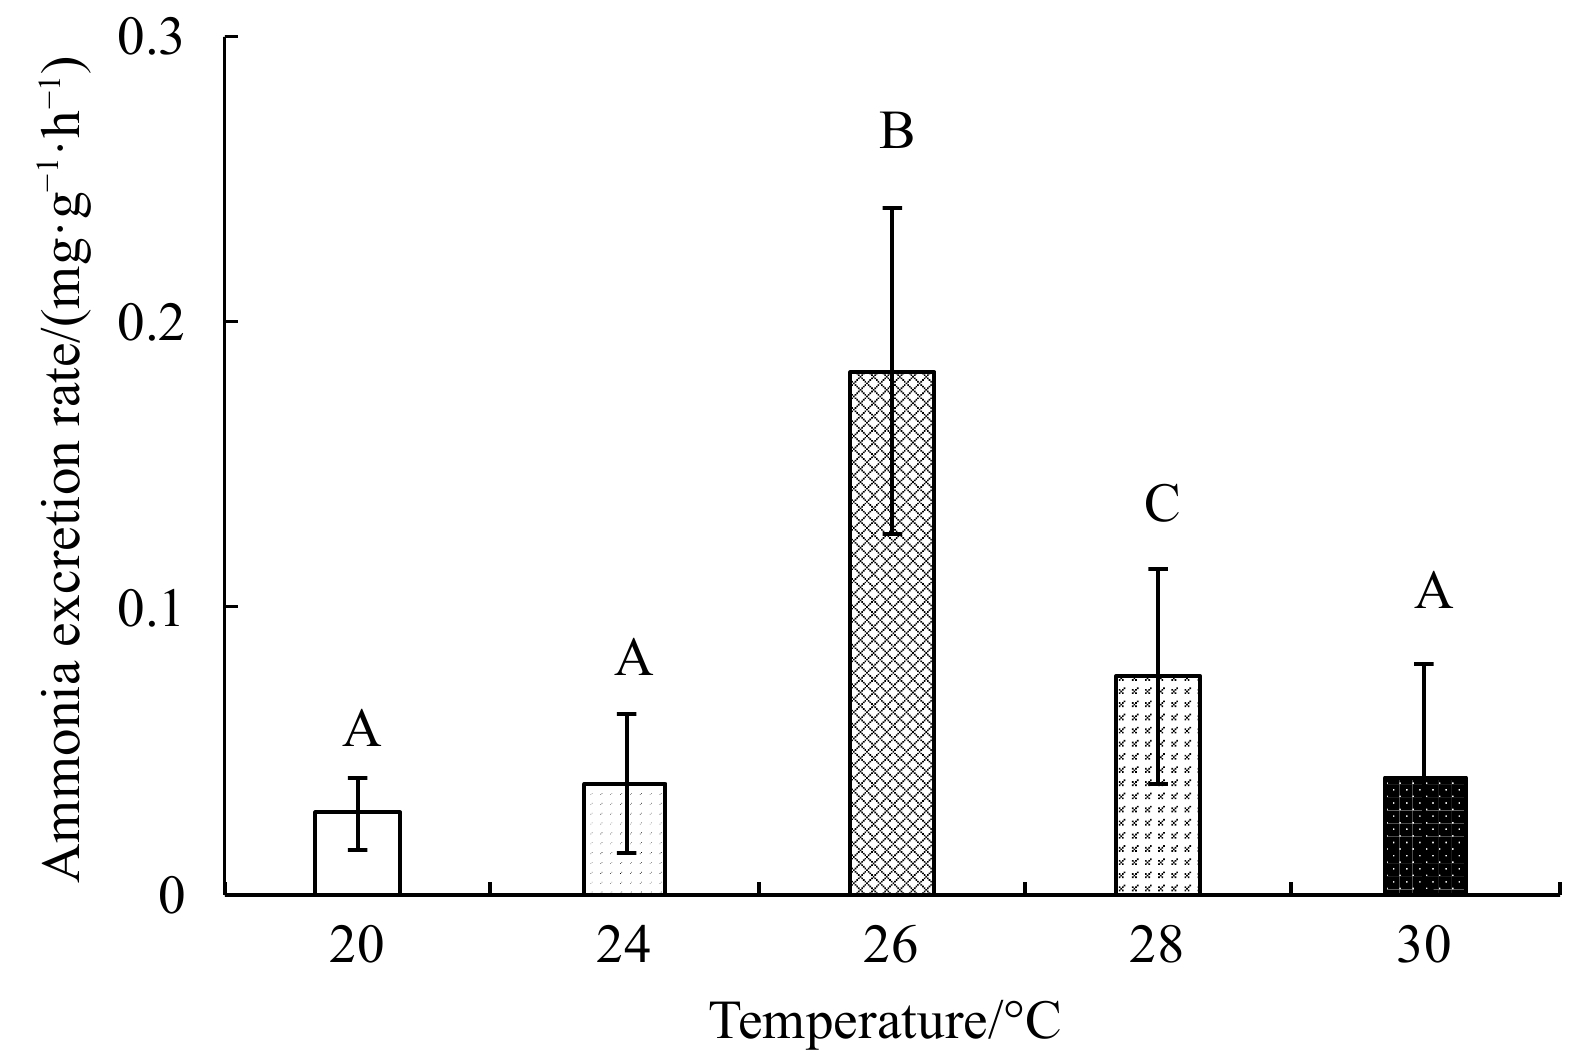
With rising temperature, the oxygen consumption rate first increased and then decreased (Fig. 5); it was highest at 28°C ((1.40±0.07) mg/(g·h)), and lowest at 30°C ((1.21±0.07) mg/(g·h)). The ammonia excretion rate also first increased, and then decreased with rising temperature (Fig. 6); it was highest at 26°C ((0.18±0.06) mg/(g·h)) and lowest ((0.03±0.01) mg/(g·h)) at 20°C. One-factor ANOVA revealed significant differences in ammonia excretion rate at different temperatures (p<0.01, df=4, mean square=0.14, F=66.11).
Figure
5.
The oxygen consumption rate of E. possjeticus juvenile at different temperatures.
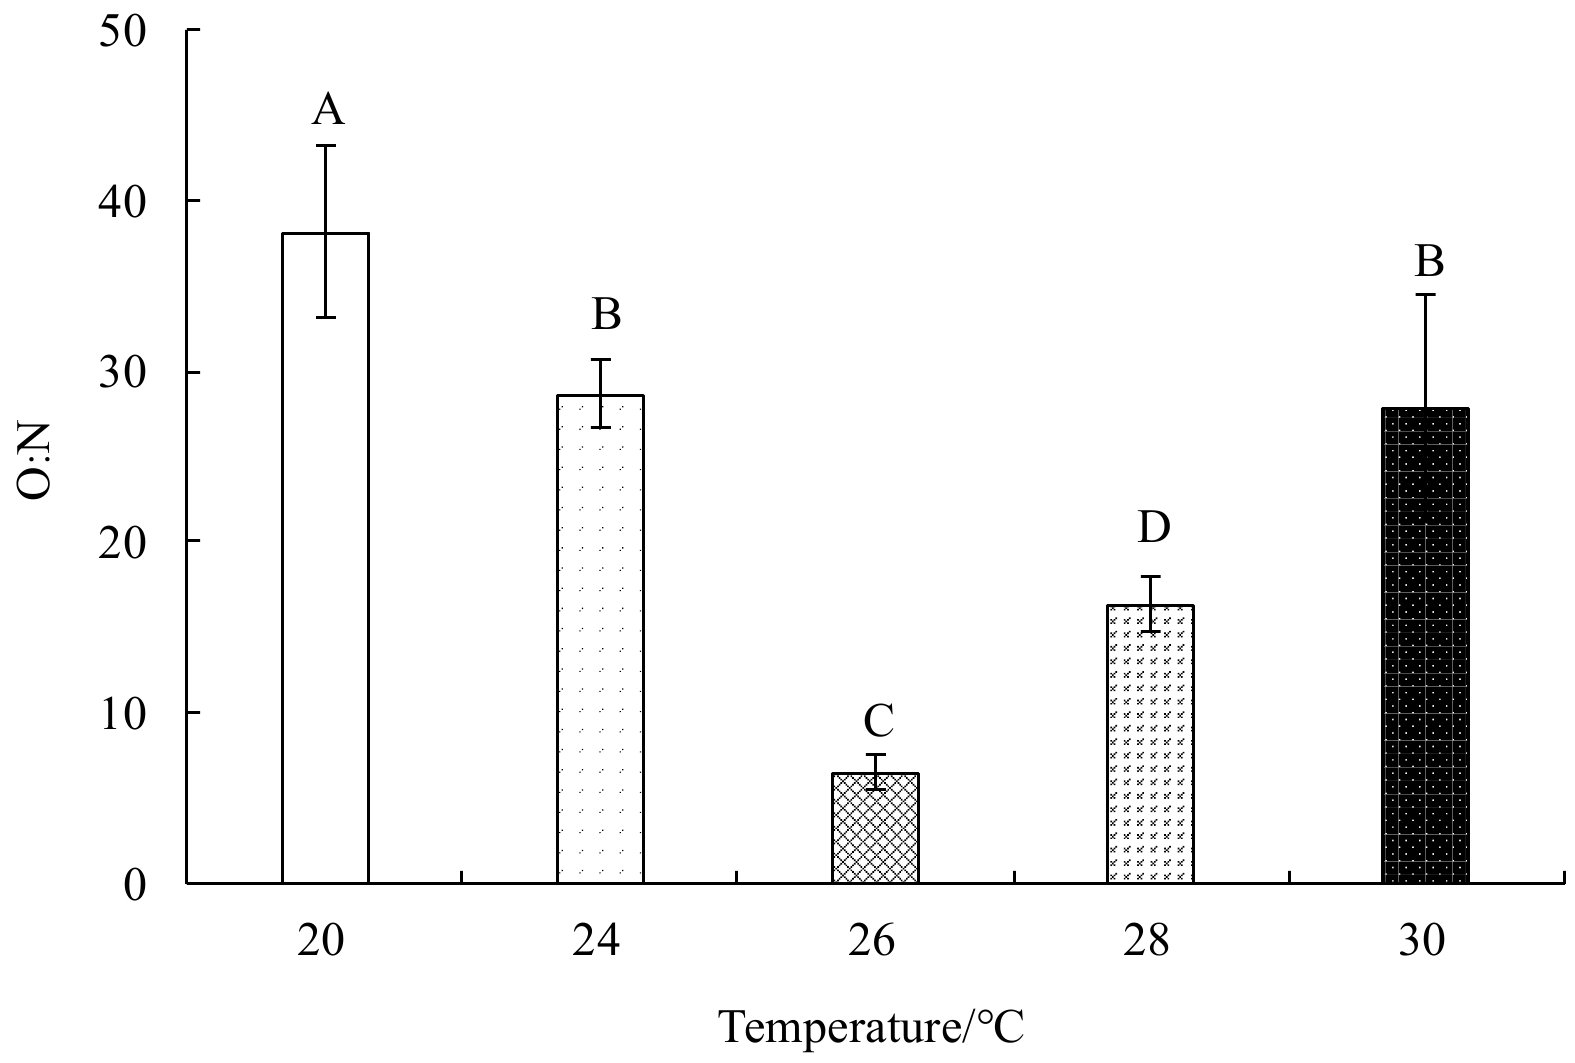
O:N ratios initially decreased, and then increased with rising temperature (Fig. 7); they were highest (38.14±5.03) at 20°C, and lowest (6.51±1.04) at 26°C. One-factor ANOVA revealed a significant difference in the O:N ratio among treatments (p<0.01, df=4, mean square=449.65, F=9.37).
Figure
7.
The O:N ratio of E. possjeticus juvenile at different temperatures.
The sensitivity of respiration to temperature is often expressed as a Q10 value, which reflects the relationship between reaction rate and temperature; the higher the Q10 value is, the greater the influence of temperature is. With rising temperature, Q10 first increased, and then decreased (Table 3).
Table
3.
The Q10 coefficients under different temperature intervals for E. possjeticus juvenile
With rising temperature, the ingestion, respiratory, excretion, and growth energies first increased, and then decreased (Table 4). Ingestion and growth energies decreased significantly above 28°C. One-factor ANOVA revealed temperature had a significant effect on the consumption energy (p<0.01, df=4, mean square=73 847.41, F=8.41), excretion energy (p<0.01, df=4, mean square=89.40, F=69.68) and growth energy (p<0.01, df=4, mean square=74 259.68, F=9.94). The equations of energy budget of E. possjeticus juvenile under different temperatures are shown in Table 5.
Table
4.
Short-term energy budget of E. possjeticus juvenile at different temperatures
Temperature /°C
Consumption energy /(J·g–1·h–1)
Respiration energy /(J·g–1·h–1)
Excretion energy /(J·g–1·h–1)
Fecal energy /(J·g–1·h–1)
Growth energy /(J·g–1·h–1)
20
605.47±122.21a
62.68±4.69ab
2.55±0.31a
78.50±8.50ab
461.74±116.94a
24
679.49±76.76a
63.46±7.83ab
3.42±0.60a
65.05±2.87a
547.57±67.77a
26
690.93±64.46a
65.95±6.78ab
15.66±1.41b
75.36±7.03ab
533.95±53.82a
28
415.13±56.98b
68.84±3.55a
6.52±0.93c
72.76±6.21ab
267.01±53.01b
30
348.54±32.51b
55.35±3.35b
3.28±0.98a
84.44±5.30b
205.47±30.57b
Note: Different letters in the same column indicate significant differences among treatments (p<0.05).
4.1
Effect of rising temperature on survival, ingestion and growth
Higher temperature increases the metabolic consumption and turnover rate of organisms, increasing mortality even in the absence of starvation (Kooijman, 2010; O’Connor et al., 2011). The results showed that E. possjeticus juveniles survived longer at (relatively) lower temperatures (e.g., higher survival rates at 20°C and 24°C), but the mortality would be significantly increased at higher temperatures, especially above 30°C. Moreover, as time went on, the difference became more obvious with a significant decrease in the median lethal temperature and 95% confidence interval. It was similar to observations reported by Foucreau et al. (2014) and Balloo and Appodoo (2017). With the increase of temperature, the metabolic activity and consumption of organism may increase. If food resources are limited, the survival of organisms will be threatened, and the population development and ecosystem function will be affected in the long run (Mas-Martí et al., 2015; Galic and Forbes, 2017).
An increase in temperature within a certain range will increase an amphipod’s food consumption (Foucreau et al., 2016). Higher temperatures increase metabolism in ectotherms, reflecting their increased energy requirements (Brown et al., 2004). However, it suggested that such energy requirements increases were not necessarily related to linear increases in ingestion rate. This study obtained similar results that the ingestion rate of E. possjeticus juvenile maintained a higher level at higher temperatures, and it did not increase linearly with rising temperatures. In poikilothermic animals, the rising temperature within the appropriate temperature range might positively affect assimilation, improving digestive efficiency and promoting growth (Díaz Villanueva et al., 2011). Rising temperature will accelerate the movement of food through the digestive tract of animals, and promote digestion by increasing the activity of digestive enzymes; however, beyond the optimal temperature, the activity of digestive enzymes will be significantly reduced (Zhang et al., 2017). With rising temperature, the evacuation rate increases, which may contribute to lower digestibility. In contrast, high water temperature may result in rapid digestion by high digestive enzyme activity. Therefore, higher evacuation rate, combined with higher level of digestive enzyme activity related to temperature rises could affect feed conversion efficiency (Zhang et al., 2017). Moreover, extreme temperatures will reduce an animal’s performance, negatively affecting feed assimilation and absorption, slowing down the growth rate, tending to decrease body size and even causing death (Atkinson, 1994; Daufresne et al., 2009; Pawar et al., 2016).
4.2
Effects of rising temperature on respiratory metabolism
It is known that species have optimal temperatures at which metabolism in physiological function is best (Pang et al., 2015). Higher temperature will increase the metabolic rate of aquatic animals within an appropriate temperature range, while extreme temperature, such as exceeding the optimal temperature, will have a negative effect, causing metabolic rates to exceed levels of absorbed energy (Saucedo et al., 2004). Gomes et al. (2013) demonstrated that both oxygen consumption and ammonia excretion of Gondogeneia antarctica increased with rising temperature from 0°C to 5.0°C. The results are consistent with the above conclusions. Within an appropriate temperature range, the oxygen consumption and ammonia release rate of E. possjeticus increased with the increasing temperature (below 26°C), while at the more extreme temperature (such as 30°C), their respiratory metabolism decreased significantly.
O:N values indicate the contribution of protein catabolism to total metabolism, and the balance relationship between protein, carbohydrate, and lipid catabolism rates in tissues (Jadhav et al., 2012). A high O:N value (>30) indicates a body’s energy is provided mainly from metabolism of carbohydrates and lipids, and a low O:N value (<30) indicates a protein metabolism (Bayne, 1976). For E. possjeticus juvenile, the O:N ratio decreased with rising temperature (below 26°C), indicating that the energy demand of E. possjeticus juvenile transferred from metabolism of carbohydrate and lipid to protein. Probably, as energy demand changes with temperature, the shifts of substrate are part of the mechanisms used to supply energy efficiently under the specific conditions (Gomes et al., 2013). These results suggest that the capacity of amphipods to compensate their metabolic rates seems to be limited. The E. possjeticus is proved to alter its energetic demand by increasing its oxygen consumption rate or reducing its ammonia excretion rate, and temperature changes can greatly affect its homeostasis.
The Q10 of aquatic animals varies depending on species. In the appropriate temperature range, the minimum Q10 value appears at the optimal temperature, and Q10 value increases on both sides of the optimal temperature. When the temperature exceeds the appropriate range, Q10 value may decrease again, that is, Q10 value will also decrease near the limit value beyond the appropriate temperature range (Ye et al., 2011; Shi et al., 2011). The mean Q10 values for crustaceans lie between 1.47 and 1.92 (Cumillaf et al., 2016). Maybe due to different species, the mean Q10 values for E. possjeticus juvenile ranged from 0.34 to 1.24, and the lower Q10 values appeared twice at 20–24°C (Q10 value was 1.03) and 28–30°C (Q10 value was 0.34), respectively. These results indicate that 20–24°C is the optimum temperature range for E. possjeticus juvenile, while 28–30°C is beyond the optimum temperature.
4.3
Effects of rising temperature on energy budget
In estimating the energy budget, an important factor is water temperature, which affects feeding, basal metabolism, growth, excretion and defecation (Yuan, 2005). Cui et al. (1995) showed that the metabolic rate of fish increased with rising temperature within a certain range, and decreased with the further rising temperature beyond a certain range. The ratio of growth energy to food energy resulted in a bell shaped curve with the change of water temperature in red fin puffer Fugu rubripes (Jia et al., 2008). In addition, the percentage of growth energy and energy utilization decreased with higher energy demand at water temperature that were too high or low (Peres and Oliva-Teles, 1999). With rising temperature, an individual adjusts its metabolism, which directly impacts its adaptability, which is affected by its energy budget (Sandersfeld et al., 2015; Huang et al., 2016). Within an optimum temperature range, a species devotes most energy towards important physiological functions and energy storage. However, under stressful thermal conditions, the physiological functions of organisms are negatively affected, and meanwhile the energy allocation is seriously impacted since organisms might not consume enough food to meet increasing metabolic demands (Clarke and Johnston, 1999; Sandersfeld et al., 2015). This was also confirmed in our research results. The consumption energy and metabolism of E. possjeticus juvenile increased with rising temperature, while the temperature exceeded 28°C, feeding and growth energy significantly decreased.
Temperature also influences the partitioning of consumed energy between tissue accretion and energy sinks such as nitrogen excretion and faeces (Bermudes et al., 2010). The proportion of energy allocated to respiration, excretory, and fecal energies of E. possjeticus juvenile all increased with rising temperature, indicating an active metabolism at high temperatures. Species usually reach a smaller size at higher development temperatures, potentially through thermal sensitivity of growth rates and cell size, which represent adaptive responses to temperature with a fitness advantage of being smaller in warmer environments (Kozłowski et al., 2004; Yuan et al., 2007). On the other hand, in warming environments, smaller-sized individuals are better able to balance demand and uptake because of their larger surface area to volume ratio (Pauly, 2010). The above mentioned possibly explain the slower growth rate and smaller body size of E. possjeticus in summer. In addition, the highest value of SGR, IR, AR or the proportion of growth energy in the energy consumed from food assimilation was found at 24°C in amphipods, suggesting that the optimum temperature for E. possjeticus juvenile is approximately 24°C which is higher than our previous studies (21°C) (Xue et al., 2018). Currently lower than optimal temperatures imply positive effects of warming, while currently optimal or higher than optimal temperatures imply negative effects of rising temperatures on individual growth performance (Ohlberger, 2013).
The results suggest that rising temperature has a measurable impact on the feeding physiology and metabolic physiology in E. possjeticus juvenile and affects its energy supply mode. It seemed that rising temperature increased the metabolism and energy consumption of the amphipods, but decreased the energy used for growth, which may be an important reason for the slow growth and small body size of the amphipods during the summer high-temperature period.
Acknowledgements
We are grateful to the anonymous reviewers for their constructive comments and suggestions that help us to improve the manuscript.
Arfianti T, Wilson S, Costello M J. 2018. Progress in the discovery of amphipod crustaceans. PeerJ, 6: e5187. doi: 10.7717/peerj.5187
[2]
Atkinson D. 1994. Temperature and organism size: A biological law for ectotherms?. Advances in Ecological Research, 25: 1–58. doi: 10.1016/s0065–2504(08)60212–3
[3]
Atkinson D, Sibly R M. 1997. Why are organisms usually bigger in colder environments? Making sense of a life history puzzle. Trends in Ecology & Evolution, 12(1): 235–239. doi: 10.1016/s0169–5347(97)01058–6
[4]
Balloo N, Appadoo C. 2017. Effect of acidified seawater and high temperature on the survival and behaviour of supralittoral and sublittoral amphipods (Crustacea). Western Indian Ocean Journal of Marine Science, 16(2): 1–11
[5]
Baudron A R, Needle C L, Rijnsdorp A D, et al. 2014. Warming temperatures and smaller body sizes: synchronous changes in growth of North Sea fishes. Global Change Biology, 2(4): 1023–1031. doi: 10.1111/gcb.12514
[6]
Bayne B L. 1976. Aspects of reproduction in bivalve molluscs. In: Estuarine Processes. New York: Academic Press, 432–448, doi: 10.1016/b978–0-12–751801-5.50043–5
[7]
Bedulina D S, Zimmer M, Timofeyev M A. 2010. Sub-littoral and supra-littoral amphipods respond differently to acute thermal stress. Comparative Biochemistry and Physiology Part B: Biochemistry and Molecular Biology, 155(4): 413–418. doi: 10.1016/j.cbpb.2010.01.004
[8]
Bermudes M, Glencross B, Austen K, et al. 2010. The effects of temperature and size on the growth, energy budget and waste outputs of barramundi (Lates calcarifer). Aquaculture, 306(1–4): 160–166. doi: 10.1016/j.aquaculture.2010.05.031
[9]
Brown J H, Gillooly J F, Allen A P, et al. 2004. Toward a metabolic theory of ecology. Ecology, 85(7): 1771–1789. doi: 10.1890/03–9000
[10]
Cheung W W L, Sarmiento J L, Dunne J, et al. 2013. Shrinking of fishes exacerbates impacts of global ocean changes on marine ecosystems. Nature Climate Change, 3(3): 254–258. doi: 10.1038/nclimate1691
[11]
Clarke A, Johnston N M. 1999. Scaling of metabolic rate with body mass and temperature in teleost fish. Journal of Animal Ecology, 68(5): 893–905. doi: 10.1046/j.1365–2656.1999.00337.x
[12]
Cottin D, Roussel D, Foucreau N, et al. 2012. Disentangling the effects of local and regional factors on the thermal tolerance of freshwater crustaceans. Naturwissenschaften, 99(4): 259–264. doi: 10.1007/s00114–012-0894–4
[13]
Cui Yibo, Chen Shaolian, Wang Shaomei. 1995. Effect of temperature on the energy budget of the grass carp, Ctenopharyngodon idellus Val. Oceanologia et Limnologia Sinica (in Chinese), 26(2): 169–174
[14]
Cumillaf J P, Blanc J, Paschke K, et al. 2016. Thermal biology of the sub-polar–temperate estuarine crab Hemigrapsus crenulatus (Crustacea: Decapoda: Varunidae). Biology Open, 5(3): 220–228. doi: 10.1242/bio.013516
[15]
Daufresne M, Lengfellner K, Sommer U. 2009. Global warming benefits the small in aquatic ecosystems. Proceedings of the National Academy of Sciences of the United States of America, 106(31): 12788–12793. doi: 10.1073/pnas.0902080106
[16]
Díaz Villanueva V, Albariño R, Canhoto C. 2011. Detritivores feeding on poor quality food are more sensitive to increased temperatures. Hydrobiologia, 678(1): 155–165. doi: 10.1007/s10750–011-0837–7
[17]
Durant J M, Hjermann D Ø, Ottersen G, et al. 2007. Climate and the match or mismatch between predator requirements and resource availability. Climate Research, 33: 271–283. doi: 10.3354/cr033271
[18]
Fang Jinghui, Tian Xiangli, Dong Shuanglin. 2010. The influence of water temperature and ration on the growth, body composition and energy budget of tongue sole (Cynoglossus semilaevis). Aquaculture, 299(1–4): 106–114. doi: 10.1016/j.aquaculture.2009.11.026
[19]
Fišer C, Robinson C T, Malard F. 2018. Cryptic species as a window into the paradigm shift of the species concept. Molecular Ecology, 27(3): 613–635. doi: 10.1111/mec.14486
[20]
Foucreau N, Cottin D, Piscart C, et al. 2014. Physiological and metabolic responses to rising temperature in Gammarus pulex (Crustacea) populations living under continental or Mediterranean climates. Comparative Biochemistry and Physiology Part A: Molecular & Integrative Physiology, 168: 69–75. doi: 10.1016/j.cbpa.2013.11.006
[21]
Foucreau N, Piscart C, Puijalon S, et al. 2016. Effects of rising temperature on a functional process: consumption and digestion of leaf litter by a freshwater shredder. Fundamental and Applied Limnology, 187(4): 295–306. doi: 10.1127/fal/2016/0841
[22]
Galic N, Forbes V E. 2017. Effects of temperature on the performance of a freshwater amphipod. Hydrobiologia, 785(1): 35–46. doi: 10.1007/s10750–016-2901–9
[23]
Gardner J L, Peters A, Kearney M R, et al. 2011. Declining body size: a third universal response to warming?. Trends in Ecology & Evolution, 26(6): 285–291. doi: 10.1016/j.tree.2011.03.005
[24]
General Administration of Quality Supervision, Inspection and Quarantine of the People’s Republic of China, Standardization Administration of the People’s Republic of China. 2008. GB 17378.4-2007 The specification for marine monitoring—Part 4: Seawater analysis (in Chinese). Beijing: Standards Press of China, 111–113
[25]
Genner M J, Sims D W, Southward A J, et al. 2010. Body size-dependent responses of a marine fish assemblage to climate change and fishing over a century-long scale. Global Change Biology, 16(2): 517–527. doi: 10.1111/j.1365–2486.2009.02027.x
[26]
Gomes V, de Arruda Campos Rocha Passos M J, da Silva Rocha A J, et al. 2013. Metabolic rates of the antarctic amphipod Gondogeneia antarctica at different temperatures and salinities. Brazilian Journal of Oceanography, 61(4): 243–249. doi: 10.1590/S1679–87592013000400005
[27]
Hochachka P W, Somero G N. 1984. Biochemical Adaptation. Princeton: Princeton University Press
Huang Rui, Xu Fengkai. 2017. Study on the acute toxicity of rotenone to Lateolabrax japonicas and Chaeturichthys stigmatias Richardson. Transactions of Oceanology and Limnology (in Chinese), (1): 96–101. doi: 10.13984/j.cnki.cn37–1141.2017.01.013
[30]
Huang Jinfeng, Xu Qiyou, Chang Yumei. 2016. Effects of temperature and dietary protein on the growth performance and IGF-I mRNA expression of juvenile mirror carp (Cyprinus carpio). Aquaculture Nutrition, 22(2): 283–292. doi: 10.1111/anu.12254
[31]
IPCC. 2007. Climate Change 2007: Synthesis Report. Contribution of working groups I, II and III to the fourth assessment report of the Intergovernmental Panel on Climate Change. Geneva, Switzerland: IPCC
[32]
Jadhav M, Bawane V, Gulave A. 2012. Size dependent variation in the rate of oxygen consumption, ammonia and O:N ratio of freshwater bivalve, Lamellidens marginalis from Godavari river during monsoon (M. S) India. Trends in Fisheries Research, 1(2): 22–26
[33]
Jia Haibo, Sun Yao, Tang Qisheng. 2008. Effects of temperature on energy budget and ecological conversion efficiency of tiger puffer Takifugu rubripes. Marine Fisheries Research (in Chinese), 29(5): 39–46
[34]
Kooijman S. 2010. Dynamic Energy Budget Theory for Metabolic Organisation. 3rd ed. Cambridge: Cambridge University Press
[35]
Kozłowski J, Czarnołęski M, Dańko M. 2004. Can optimal resource allocation models explain why ectotherms grow larger in cold?. Integrative and Comparative Biology, 44(6): 480–493. doi: 10.1093/icb/44.6.480
[36]
Machado G B O, Ferreira A P, Bueno M, et al. 2019. Effects of macroalgal host identity and predation on an amphipod assemblage from a subtropical rocky shore. Hydrobiologia, 836: 65–81. doi: 10.1007/s10750–019-3941–8
[37]
Mas-Martí E, Muñoz I, Oliva F, et al. 2015. Effects of increased water temperature on leaf litter quality and detritivore performance: a whole-reach manipulative experiment. Freshwater Biology, 60(1): 184–197. doi: 10.1111/fwb.12485
[38]
Millien V, Lyons S K, Olson L, et al. 2006. Ecotypic variation in the context of global climate change: revisiting the rules. Ecology Letters, 9(7): 853–869. doi: 10.1111/j.1461–0248.2006.00928.x
[39]
Moore M, Folt C. 1993. Zooplankton body size and community structure: effects of thermal and toxicant stress. Trends in Ecology & Evolution, 8(5): 178–183. doi: 10.1016/0169–5347(93)90144-e
[40]
Naumenko S A, Logacheva M D, Popova N V, et al. 2017. Transcriptome-based phylogeny of endemic Lake Baikal amphipod species flock: fast speciation accompanied by frequent episodes of positive selection. Molecular Ecology, 26(2): 536–553. doi: 10.1111/mec.13927
[41]
O’Connor M I, Gilbert B, Brown C J. 2011. Theoretical predictions for how temperature affects the dynamics of interacting herbivores and plants. The American Naturalist, 178(5): 626–638. doi: 10.1086/662171
[42]
Ohlberger J. 2013. Climate warming and ectotherm body size—from individual physiology to community ecology. Functional Ecology, 27(4): 991–1001. doi: 10.1111/1365–2435.12098
[43]
Pang Xu, Yuan Xingzhong, Cao Zhendong, et al. 2015. The effect of temperature on repeat swimming performance in juvenile qingbo (Spinibarbus sinensis). Fish Physiology and Biochemistry, 41: 19–29. doi: 10.1007/s10695–014-0002–0
[44]
Parmesan C. 2006. Ecological and evolutionary responses to recent climate change. Annual Review of Ecology, Evolution, and Systematics, 37(1): 637–669. doi: 10.1146/annurev.ecolsys.37.091305.1101
[45]
Parmesan C, Yohe G. 2003. A globally coherent fingerprint of climate change impacts across natural systems. Nature, 421(6918): 37–42. doi: 10.1038/nature01286
[46]
Pauly D. 2010. Gasping Fish and Panting Squids: Oxygen, Temperature and the Growth of Water-Breathing Animals. Oldendorf/Luhe, Germany: International Ecology Institute
[47]
Pawar S, Dell A I, Savage V M, et al. 2016. Real versus artificial variation in the thermal sensitivity of biological traits. The American Naturalist, 187(2): E41–E52. doi: 10.1086/684590
[48]
Peres H, Oliva-Teles A. 1999. Influence of temperature on protein utilization in juvenile European seabass (Dicentrarchus labrax). Aquaculture, 170(3–4): 337–348. doi: 10.1016/s0044–8486(98)00422–0
[49]
Piscart C, Navel S, Maazouzi C, et al. 2011. Leaf litter recycling in benthic and hyporheic layers in agricultural streams with different types of land use. Science of the Total Environment, 409(20): 4373–4380. doi: 10.1016/j.scitotenv.2011.06.060
[50]
Reading C J. 2007. Linking global warming to amphibian declines through its effects on female body condition and survivorship. Oecologia, 151(1): 125–131. doi: 10.1007/s00442–006-0558–1
Root T L, Price J T, Hall K R, et al. 2003. Fingerprints of global warming on wild animals and plants. Nature, 421(6918): 57–60. doi: 10.1038/nature01333
[53]
Sandersfeld T, Davison W, Lamare M D, et al. 2015. Elevated temperature causes metabolic trade-offs at the whole-organism level in the Antarctic fish Trematomus bernacchii. Journal of Experimental Biology, 218: 2373–2381. doi: 10.1242/jeb.122804
[54]
Saucedo P E, Ocampo L, Monteforte M, et al. 2004. Effect of temperature on oxygen consumption and ammonia excretion in the Calafia mother-of-pearl oyster, Pinctada mazatlanica (Hanley, 1856). Aquaculture, 229(1–4): 377–387. doi: 10.1016/s0044–8486(03)00327–2
[55]
Sheridan J A, Bickford D. 2011. Shrinking body size as an ecological response to climate change. Nature Climate Change, 1: 401–406. doi: 10.1038/nclimate1259
[56]
Shi Yonghai, Zhang Genyu, Liu Jianzhong, et al. 2011. Effects of temperature and salinity on oxygen consumption of tawny puffer Takifugu flavidus juvenile. Aquaculture Research, 42(2): 301–307. doi: 10.1111/j.1365–2109.2010.02638.x
[57]
Stenseth N C, Mysterud A, Ottersen G, et al. 2002. Ecological effects of climate fluctuations. Science, 297(5585): 1292–1296. doi: 10.1126/science.1071281
[58]
Todd C D, Hughes S L, Marshall C T, et al. 2008. Detrimental effects of recent ocean surface warming on growth condition of Atlantic salmon. Global Change Biology, 14(5): 958–970. doi: 10.1111/j.1365–2486.2007.01522.x
[59]
Walther G R, Post E, Convey P, et al. 2002. Ecological responses to recent climate change. Nature, 416(6879): 389–395. doi: 10.1038/416389a
[60]
Xue Suyan, Fang Jianguang, Zhang Jihong, et al. 2013. Effects of temperature and salinity on the development of the amphipod crustacean Eogammarus sinensis. Chinese Journal of Oceanology and Limnology, 31(5): 1010–1017. doi: 10.1007/s00343–013-2302–0
[61]
Xue Suyan, Mao Yuze, Li Jiaqi, et al. 2018. Life history responses to variations in temperature by the marine amphipod Eogammarus possjeticus (Gammaridae) and their implications for productivity in aquaculture. Hydrobiologia, 814: 133–145. doi: 10.1007/s10750–018-3524–0
[62]
Ye Le, Yang Shengyun, Zhu Xiaoming, et al. 2011. Effects of temperature on survival, development, growth and feeding of larvae of Yellowtail clownfish Amphiprion clarkii (Pisces: Perciformes). Acta Ecologica Sinica, 31(5): 241–245. doi: 10.1016/j.chnaes.2011.06.003
[63]
Yom-Tov Y, Geffen E. 2011. Recent spatial and temporal changes in body size of terrestrial vertebrates: probable causes and pitfalls. Biological Reviews, 86(2): 531–541. doi: 10.1111/j.1469–185X.2010.00168.x
[64]
Yuan Xiutang. 2005. Studies on physio-ecology and bioremediation of the sea cucumber, Apostichopus japonicus (Selenka) (in Chinese)[dissertation]. Qingdao: Institute of Oceanology, Chinese Academy of Sciences
[65]
Yuan Xiutang, Yang Hongsheng, Wang Lili, et al. 2007. Effects of aestivation on the energy budget of sea cucumber Apostichopus japonicus (Selenka) (Echinodermata: Holothuroidea). Acta Ecologica Sinica (in Chinese), 27(8): 3155–3161. doi: 10.3321/j.issn:1000–0933.2007.08.008
[66]
Zhang Lei, Zhao Zhigang, Fan Qixue. 2017. Effects of water temperature and initial weight on growth, digestion and energy budget of yellow catfish Pelteobagrus fulvidraco (Richardson, 1846). Journal of Applied Ichthyology, 33(6): 1108–1117. doi: 10.1111/jai.13465
Ana Paula Ferreira, Glauco Barreto de Oliveira Machado, Juan Carlos Farias Pardo, et al. The effects of ocean warming and elevated CO2 on the feeding behavior and physiology of two sympatric mesograzers. Comparative Biochemistry and Physiology Part A: Molecular & Integrative Physiology, 2025, 304: 111831. doi:10.1016/j.cbpa.2025.111831
2.
Farzaneh Momtazi, Abdolvahab Maghsoudlou, Hanieh Saeedi. Uncovering the hidden amphipod biodiversity and its drivers in the Persian Gulf. Deep Sea Research Part II: Topical Studies in Oceanography, 2025, 220: 105463. doi:10.1016/j.dsr2.2025.105463
3.
Pengfei Duan, Yongsheng Tian, Zhentong Li, et al. Comparative transcriptome analysis of hybrid Jinhu grouper (Epinephelus fuscoguttatus ♀ × Epinephelus tukula ♂) and Epinephelus fuscoguttatus under temperature stress. Aquaculture, 2024, 578: 740037. doi:10.1016/j.aquaculture.2023.740037
4.
Chongxiang Li, Yiyuan Tang, Wenhui Sun, et al. Physiological responses of Ampithoe valida and its feeding potential on Ulva prolifera. Marine Environmental Research, 2023, 186: 105942. doi:10.1016/j.marenvres.2023.105942
5.
Meng Liang, Wenrong Feng, Xue Chen, et al. Effects of different temperatures on growth and intestinal microbial composition of juvenile Eriocheir sinensis. Frontiers in Physiology, 2023, 14 doi:10.3389/fphys.2023.1163055
Figure 1. The ingestion rate of E. possjeticus juvenile at different temperatures. Different capital letters indicate significant differences (p<0.05) among different treatments, the same as below.
Figure 2. The absorption rate of E. possjeticus juvenile at different temperatures.
Figure 3. The faecal egestion rate of E. possjeticus juvenile at different temperatures.
Figure 4. The specific growth rate of body weight and specific growth rate of body length of E. possjeticus juvenile at different temperatures.
Figure 5. The oxygen consumption rate of E. possjeticus juvenile at different temperatures.
Figure 6. The ammonia excretion rate of E. possjeticus juvenile at different temperatures.
Figure 7. The O:N ratio of E. possjeticus juvenile at different temperatures.


 DownLoad:

 DownLoad:


 DownLoad: