Liang Yi, Haifeng Wang, Geng Liu, Yanping Chen, Huiqiang Yao, Xiguang Deng. Magnetic minerals in Mid-Pleistocene sediments on the Caiwei Guyot, Northwest Pacific and their response to the Mid-Brunhes climate event[J]. Acta Oceanologica Sinica, 2021, 40(12): 1-11. doi: 10.1007/s13131-021-1872-5
Citation:
Liang Yi, Haifeng Wang, Geng Liu, Yanping Chen, Huiqiang Yao, Xiguang Deng. Magnetic minerals in Mid-Pleistocene sediments on the Caiwei Guyot, Northwest Pacific and their response to the Mid-Brunhes climate event[J]. Acta Oceanologica Sinica, 2021, 40(12): 1-11. doi: 10.1007/s13131-021-1872-5
Liang Yi, Haifeng Wang, Geng Liu, Yanping Chen, Huiqiang Yao, Xiguang Deng. Magnetic minerals in Mid-Pleistocene sediments on the Caiwei Guyot, Northwest Pacific and their response to the Mid-Brunhes climate event[J]. Acta Oceanologica Sinica, 2021, 40(12): 1-11. doi: 10.1007/s13131-021-1872-5
Citation:
Liang Yi, Haifeng Wang, Geng Liu, Yanping Chen, Huiqiang Yao, Xiguang Deng. Magnetic minerals in Mid-Pleistocene sediments on the Caiwei Guyot, Northwest Pacific and their response to the Mid-Brunhes climate event[J]. Acta Oceanologica Sinica, 2021, 40(12): 1-11. doi: 10.1007/s13131-021-1872-5
State Key Laboratory of Marine Geology, Tongji University, Shanghai 200092, China
2.
Ministry of Natural Resources Key Laboratory of Marine Mineral Resources, Guangzhou Marine Geological Survey, China Geological Survey, Guangzhou 510075, China
3.
Southern Marine Science and Engineering Guangdong Laboratory (Guangzhou), Guangzhou 510301, China
4.
Second Institute of Oceanography, Ministry of Natural Resources, Hangzhou 310012, China
Funds:
The Natural Science Foundation of Shanghai under contract No. 19ZR1459800; the Key Special Project for Introduced Talents Team of Southern Marine Science and Engineering Guangdong Laboratory (Guangzhou) under contract No. GML2019ZD0106; the Project of Global Changing and Air-sea Interaction under contract No. GASI-GEOGE-04.
Seamounts are ubiquitous topographic units in global oceans, and their influences on local oceanic circulation have attracted great attention in physical oceanography; however, previous efforts were less made in paleoclimatology and paleoceanography. The Caiwei Guyot in the Magellan Seamounts of the western Pacific is a typical seamount, and in this study, we investigate a well-dated sediment core by magnetic properties to reveal the relationship between deep-sea sedimentary processes and global climate changes. The principal results are as follows: (1) the dominant magnetic minerals in the sediments are low-coercivity magnetite in pseudo-single domain range, probably including a biogenic contribution; (2) the variabilities of magnetic parameters can be clustered into two sections at ~500 ka, and the differences between the two units are evident in amplitudes and means; (3) changes in the grainsize-dependent magnetic parameters can be well correlated to records of global ice volume and atmospheric CO2 in the middle Pleistocene. Based on these results, a close linkage was proposed between deep-sea sedimentary processes in the Caiwei Guyot and global climate changes. This linkage likely involves different roles of biogenic magnetite in the sediments between interglacial and glacial intervals, responding to changes in marine productivity and deep-sea circulation and displaying a major change in the Mid-Brunhes climate event. Therefore, we proposed that the sedimentary archives at the bottom of the Caiwei Guyot record some key signals of global climate changes, providing a unique window to observe interactions between various environmental systems on glacial-interglacial timescales.
About 50 000 seamounts have been discovered in the Pacific Ocean, and the Magellan Seamounts locate in the western Pacific, including the Caiwei, the Vlinder, and the Loah, and their spatial distribution is like a northwestward chain (Fig. 1). The Caiwei is a deep-sea guyot with the Caiqi belonged in the southwest, and was formed by large-scale eruption of hot spots during 120–90 Ma (Wessel, 1997; Wessel and Lyons, 1997; Stepashko, 2008). The water depths of its top and base are ~1 500–1 600 m, and ~5 500 m, respectively, and the seamount slopes are ~20°–30°. The Caiwei Guyot is located within the main path of the Antarctic bottom water (AABW) and the lower circumpolar deep water (LCDW) to the north Pacific (Talley, 2008; Kawabe and Fujio, 2010), and its oceanographic setting is dominated by clockwise flows at its base (Fig. 1) and an anti-cyclonic eddy over the guyot (Guo et al., 2020), yielding similar hydrochemical properties around the seamount, such as salinity, pH value, and nitrate (Liu et al., 2019). The sediments on the guyot are mainly cobalt-rich crusts, carbonate rocks, and/or calcareous pelagic deposits (He et al., 2001; Wei et al., 2017; Zhao et al., 2020), and have been extensively surveyed in terms of mineral resources and megafaunal community (Wang et al., 2016b; Xu et al., 2016), and microorganisms (Liu et al., 2019; Sun et al., 2020; Yang et al., 2020).
Figure
1.
Schematic map showing the study area and oceanographic setting. The flow passing through the seamount and a Taylor column was observed based on the data obtained by the conductivity temperature and depth instrument (CTD) and mooring system (Guo et al., 2020). The flows were modified from previous works (Guo et al., 2020; Kawabe and Fujio, 2010; Zhai and Gu, 2020). Reference sites were mentioned or discussed in the main text.
Although these published results extend our understanding in sedimentology and biology in such a unique deep-sea environment, the evolution of these environmental factors on geological timescales are less documented. To reveal the deep-sea process in the Caiwei Guyot and its linkage to global climate changes, we studied a well-dated core in this work by rock magnetism and enviromagnetism during the middle Pleistocene. Based on an investigation of characteristics and changes in magnetic minerals in the sediments of Core MABC-11, a proxy of deep-sea paleoenvironmental processes was derived and its linkage to the Mid-Brunhes event (MBE), which represents a major and latest transition in global climate changes in the middle Pleistocene, was revealed and discussed.
2.
Materials and methods
2.1
Materials
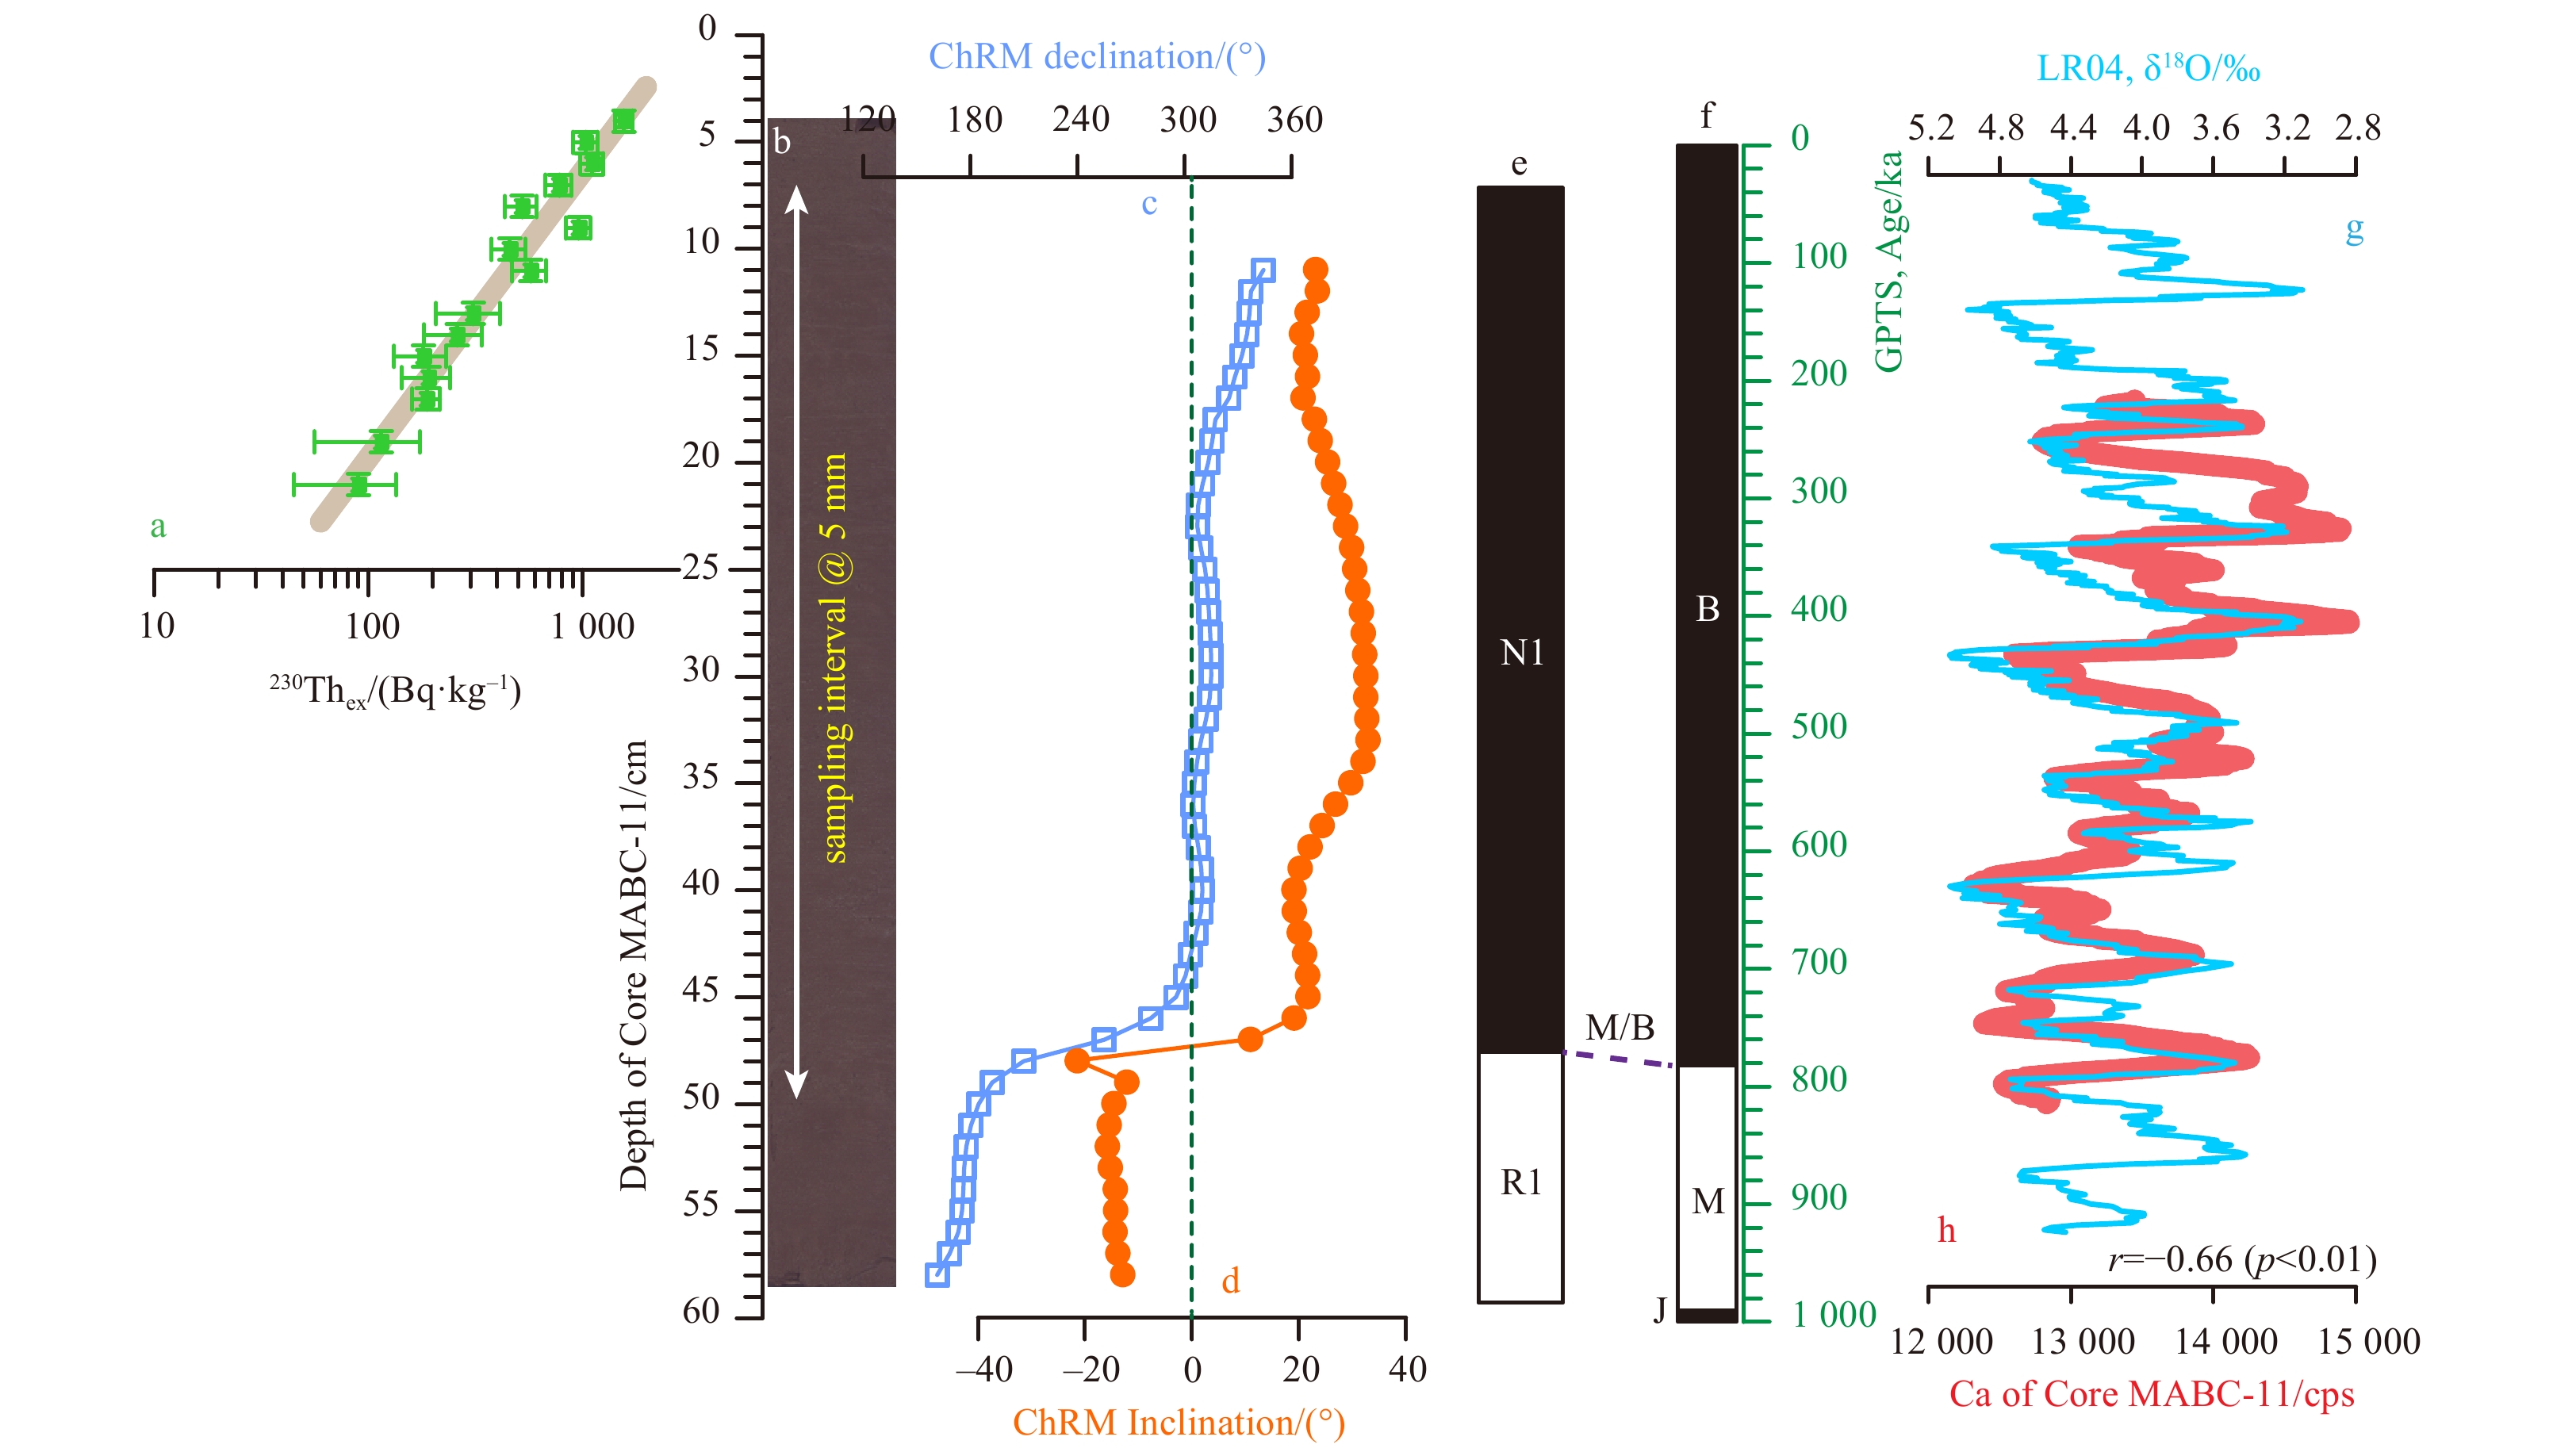
The study core, MABC-11 (15.22°N, 155.53°E, 5 840 m water depth), was collected from the eastern base of the Caiwei Guyot during the DY27 cruise by the R/V Haiyang No. 6 in July 2012, using a box corer, with a core length of 59 cm. By magnetostratigraphy and tuning changes in element Ca intensity obtained from a geochemical scanning to the deep-sea benthic δ18O stack LR04 (Lisiecki and Raymo, 2005), which reflects changes in global ice volume, it is estimated that the sediment accumulation rates of Core MABC-11 are 0.4–2.0 mm/ka during the depositional interval with an average of 0.73 mm/ka (Yi et al., 2021). This estimate is consistent with the excess 230Th data in the upper part of the core (Yang et al., 2020). Based on this reliably geochronology (Fig. 2), in this study, the core was sampled for the depth interval of 7.0–49.5 cm at 5 mm resolution, and 85 specimens in total were studied from a magnetic perspective during ~215–800 ka.
Figure
2.
Core MABC-11 with the age-depth model during the middle Pleistocene. a. The excess 230Th data and the estimated SAR for the upper part (Yang et al., 2020); b. photo of the core; c–e. ChRM declination and inclination, with the polarity of Core MABC-11 (Yi et al., 2021); f. the geological polarity timescale (GPTS) (Hilgen et al., 2012), and g–h. comparison between element Ca of Core MABC-11 and the benthic δ18O stack LR04 (Lisiecki and Raymo, 2005) on glacial-interglacial timescales, inferring a higher level of marine productivity in the Caiwei Guyot during interglacial intervals (Yi et al., 2021). B: Brunhes chron; M: Matuyama chron; J: Jaramillo subchron; M/B: the Matuyama/Brunhes boundary.
All samples in total were first dried in vacuum and placed in standard 8-cm3 cubic plastic boxes. Magnetic susceptibility (χLF and χHF) was measured using an AGICO MFK1-FA multi-frequency Kappabridge magnetic susceptibility meter at frequencies of 976 Hz and 15 616 Hz. Anhysteretie remanent magnetization (ARM) was imparted to the samples using a peak alternating field (AF) of 100 mT and a direct biasing field of 0.05 mT using a 2G enterprises SQUID magnetometer with inline AF coils, and then the susceptibility of ARM (χARM) was calculated as ARM/0.05 mT. Isothermal remanent magnetization was produced with a 2-G Enterprises model 660 pulse magnetizer successively in pulsed fields of 1 T (saturated isothermal remanent magnetization, SIRM), –0.1 T (IRM–0.1T) and –0.3 T (IRM–0.3T) fields.
The percentage of frequency-dependent susceptibility (χfd%), hard isothermal remanent magnetization (HIRM), S−100, S−300, and Lratio were calculated using the following equations (Tauxe et al., 2010):
Hysteresis loop, IRM acquisition and first-order reversal curve (FORC) analyses were conducted on 17 representative samples in 3 cm interval using a Princeton Measurements Inc. MicroMag 3900 Vibrating Sample Magnetometer (VSM). A peak field of 0.3 T was set for hysteresis loops and IRM acquisitions, and saturation magnetization (Ms), saturation remanence (Mrs), coercive force (Bc), and the coercivity of the remanence (Bcr) were determined from the hysteresis loops (Tauxe, 2010), after corrected using the data between 0.25 T and 0.30 T. Setting a peak field of 1.0 T and an interval of 3.2 mT, FORC diagrams (125 lines) were produced on two samples (25 cm and 45 cm in depth) using FORCme software (Heslop and Roberts, 2012; Heslop, 2015) with a smoothing factor of 4. For the same two samples, low-temperature magnetic measurements (zero-field cooling, ZFC) were performed. The ZFC curves were measured using a quantum design magnetic properties measurement system (MPMS XP-5, sensitivity 5.0×10¹⁰ Am2). Samples were first cooled from room temperature to 20 K in zero field and were then exposed to a field of 2.5 T (this saturation IRM is denoted SIRM20K). After the magnetic field was switched off, SIRM20K was measured from 20 K to 300 K at 2.5 K intervals. All magnetic measurements were conducted at the Paleomagnetism and Geochronology Lab (PGL), Institute of Geology and Geophysics, Chinese Academy of Sciences.
2.3
Other measurements
Four representative samples at 15 cm, 25 cm, 35 cm, and 45 cm depth were measured, including sediment grain size, clay minerals, and rare earth element (REE), to identify some basic properties of the studied core.
(1) Grain-size samples were placed in an ultrasonic vibrator with sodium hexametaphosphate ((NaPO3)6) for several minutes to facilitate dispersion, and measured using a Malvern Mastersizer 2000 grain size analyzer in the Key Laboratory of Engineering Oceanography, Second Institute of Oceanography, Ministry of Natural Resources, China.
(2) REE samples were freeze-dried and ground in an agate mortar. To separate biogenic and authigenic components from the bulk samples, about 0.2 g bulk sediment samples were leached with 20 mL 1 mol/L hydrochloric acid (HCl) for 24 h at 50°C. After leaching with 1 mol/L HCl, the residues of the leached samples were completely digested with concentrated HF-HNO3-HClO4 in an airtight Teflon container. REE concentrations were respectively determined by ICP-MS (PQ3, thermo elemental) in the Guangzhou Marine Geological Survey.
(3) For clay mineral analysis, the samples were disaggregated in deionized water and treated with 20 mL of 10% H2O2 and then with 1 mol/L acetic acid to remove organic materials and carbonates, respectively. Then, the samples were washed with deionized water to remove excess ions and to aid deflocculation of the clays. The <2 μm fraction was then separated according to the Stoke’s Law; 1 500 mL of solution from the top of the containers was removed and left to stand. The suspension containing the clay fraction was prepared and air-dried for X-ray diffraction (XRD) analysis using a PANalytical diffractometer fitted with CuKα-radiation at 40 kV and 40 mA in the Guangzhou Marine Geological Survey.
3.
Results and discussion
3.1
Basic properties of the studied core
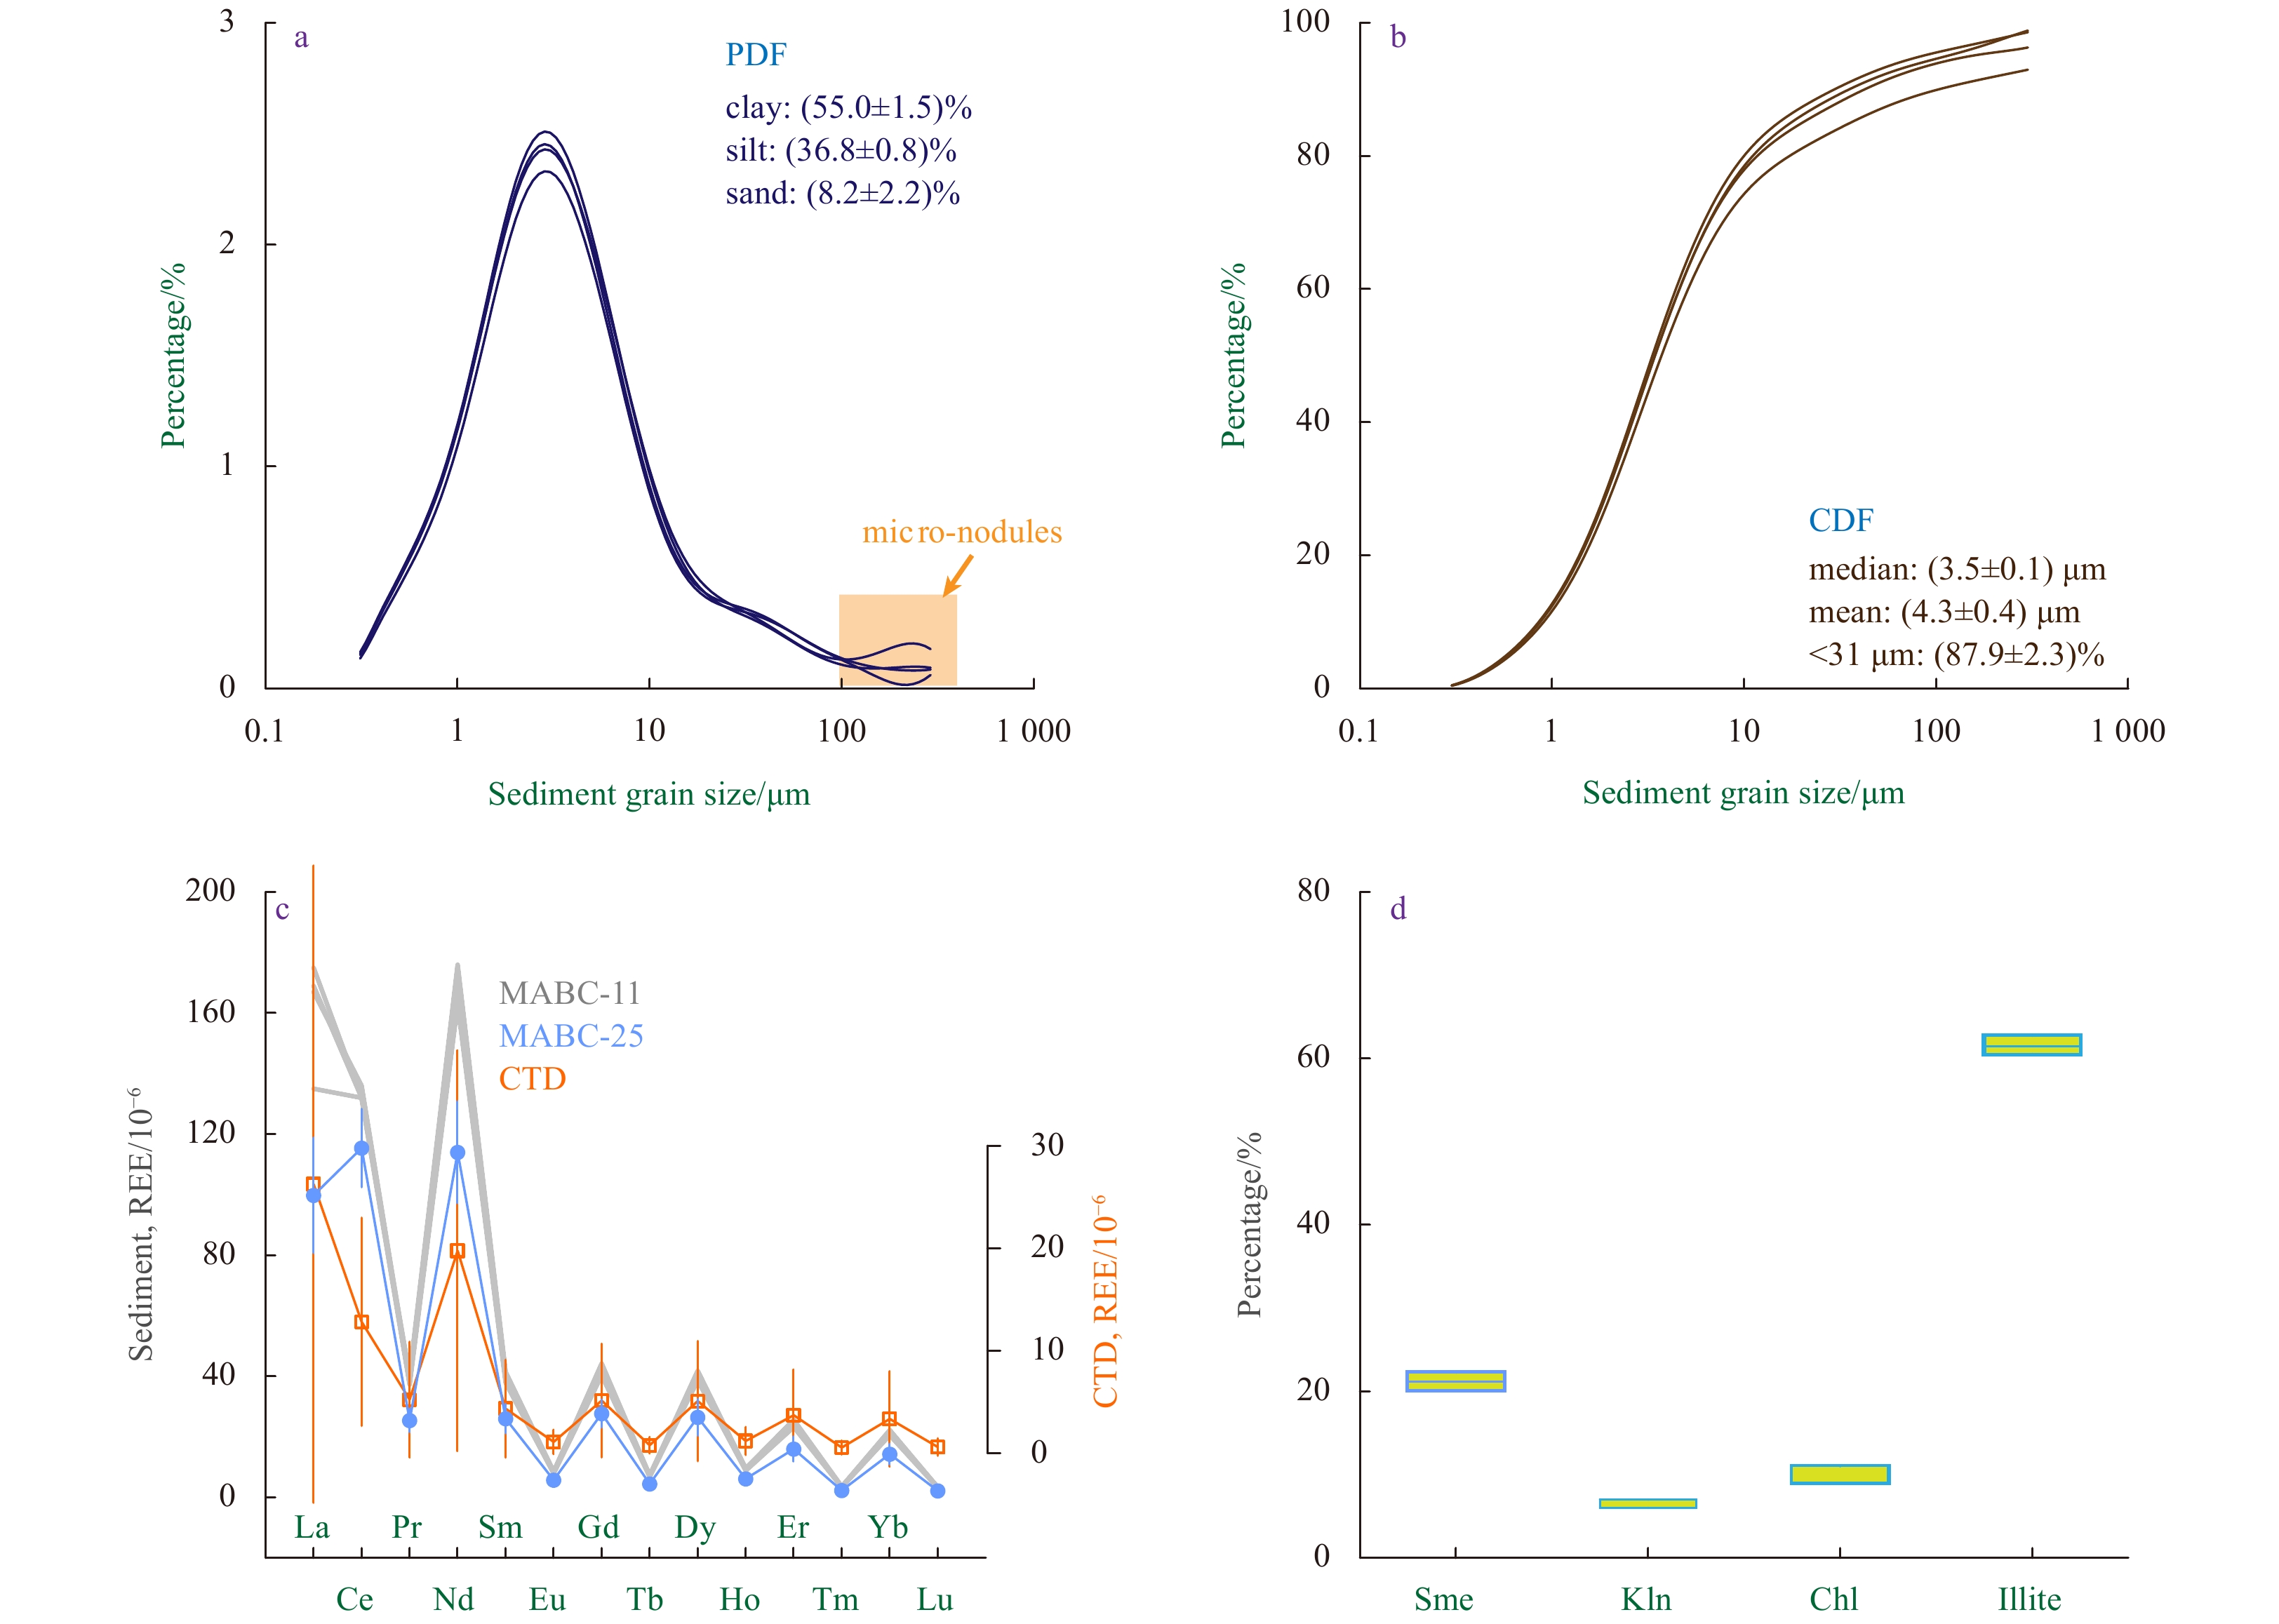
The sediments of Core MABC-11 are dark brown (10YR 3/3) and homogenous pelagic muds with micro-nodules occasionally existed. The sediment grain size of four representative samples confirms this observation and show that the intra-core changes in sediment grain size are small with a median size of (3.5 ± 0.1) μm (Figs 3a and b). A multi-modal pattern of grain-size spectrum is evident, with modal sizes of ~3 μm and ~40 μm, inferring low sedimentary dynamics at the base of the Caiwei Guyot during the depositional interval.
Figure
3.
Some basic information of the sediments of Core MABC–11. a and b. Sediment grain-size distributions; c. REE distribution patterns of the sediments of Core MABC–11 (this study) and the sediments of Core MABC–25, and water columns close to the Caiwei Guyot (Deng et al., 2017); and d. box plot of clay minerals in the sediments of Core MABC–11. PDF: probability density function, CDF: cumulative distribution function, Sme: smectite, Kln: kaolinite, Chl: chlorite.
The REE are usually used to trace various geochemical processes (Haley et al., 2004), and changes in REE of Core MABC-11 exhibit a similar pattern with ones of pore water and borehole sediments (Fig. 3c; Table 1) in surrounding regions (Deng et al., 2017) and in the Mariana Trench (Wang et al., 2016a). This pattern may infer that the redox condition, sedimentation rate and adsorption capacity of sediments are the three major factors in REE changes (Deng et al., 2017).
Clay minerals in Core MABC-11 contain illite in major (over 60%) and 10%–20% of smectite, chlorite, and kaolinite. The relative ratios between these clay minerals are close to the cases in the Mariana Trench (Wang et al., 2016a) and in the Philippian Sea (Xu et al., 2015), indicating that regional inputs and aeolian contribution are the two major sources of the sediments (Xu et al., 2015; Wang et al., 2016a; Deng et al., 2017; Yi et al., 2020).
All these results suggest similar sedimentary processes and sediment sources in the study area, and sedimentary characteristics can be used to infer regional evolution in paleoenvironment and paleoceanography in the middle Pleistocene.
3.2
Changes in magnetic parameters
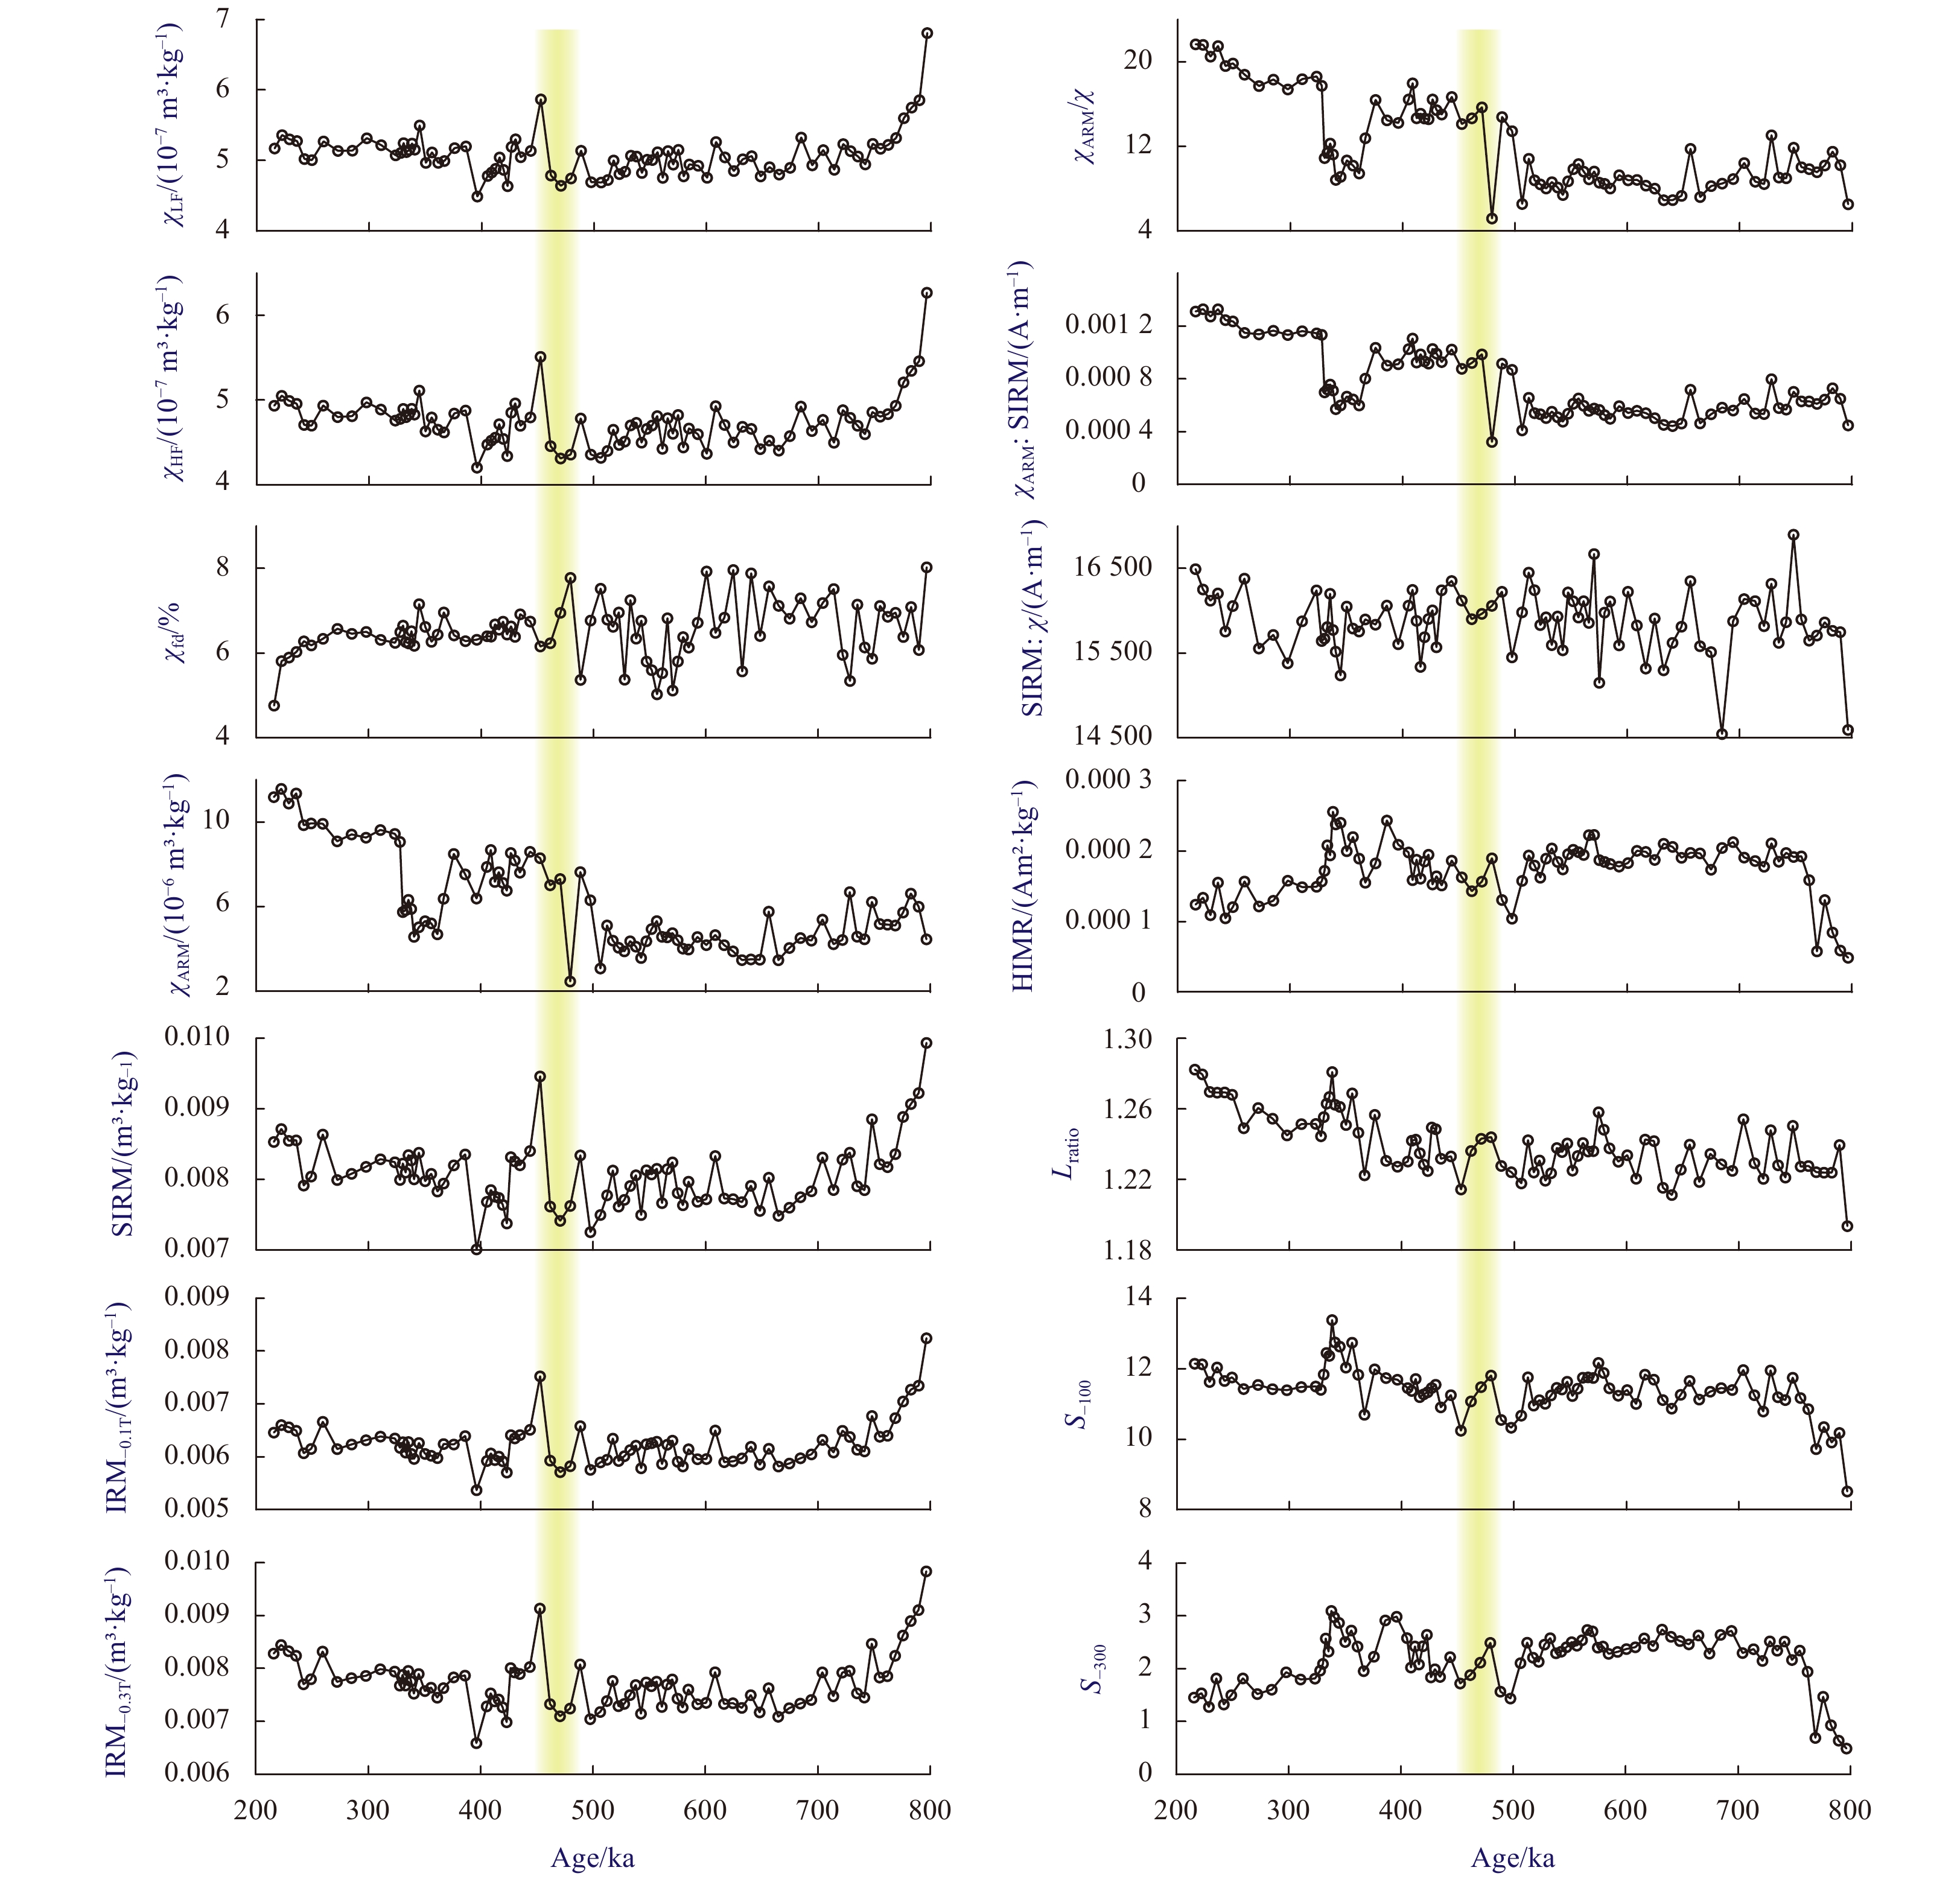
The values of mass-specific χ in Core MABC-11 vary from 4.49×10⁻⁷ m3/kg to 6.81×10⁻⁷ m3/kg, and χfd% is generally high (>5%) and changes variably in the lower part (Fig. 4). χARM is usually sensitive to single-domain (SD) grains (Maher, 1988; Duan et al., 2012), and SIRM can be used to infer magnetic particles excluding the influence of superparamagnetic (SP) grains (Evans and Heller, 2003). The values of χARM and SIRM are 2.47×10⁻⁶–11.6×10⁻⁶ m3/kg and 7.01×10⁻³–9.94×10⁻³ Am2/kg, respectively, and display a similar pattern to χ curves (Fig. 4).
Figure
4.
Changes in magnetic parameters of Core MABC-11.
Low S−100, S−300, and Lratio values indicate the dominance of low-coercivity magnetic minerals throughout the whole sequence (Fig. 4). The concentration-dependent magnetic parameters (χ, χARM, and SIRM) have similar variations throughout the core, which suggests that these proxies are not greatly influenced by mineralogical variations. Based on the general variation of the concentration-dependent magnetic parameters (χ, χARM and SIRM) and the grainsize-dependent rock magnetic parameters (χfd%, χARM/χ, and χARM/SIRM), the magnetic series can be divided into two units (Fig. 4).
In general, for the upper part, the concentration-dependent magnetic parameters (χ, χARM and SIRM) have a large variance, while for the low part, the grainsize-dependent rock magnetic parameters (χfd%, χARM/χ, and SIRM/χ) vary relatively large (Fig. 4). By a one-way analysis of variance (ANOVA), the difference of five parameters (χARM, χARM/χ, χARM/SIRM, Lratio, and S−100) between the two units is significant in statistics (p<0.01), confirming a shift in magnetic parameters around 500 ka.
3.3
Relationship between magnetic parameters
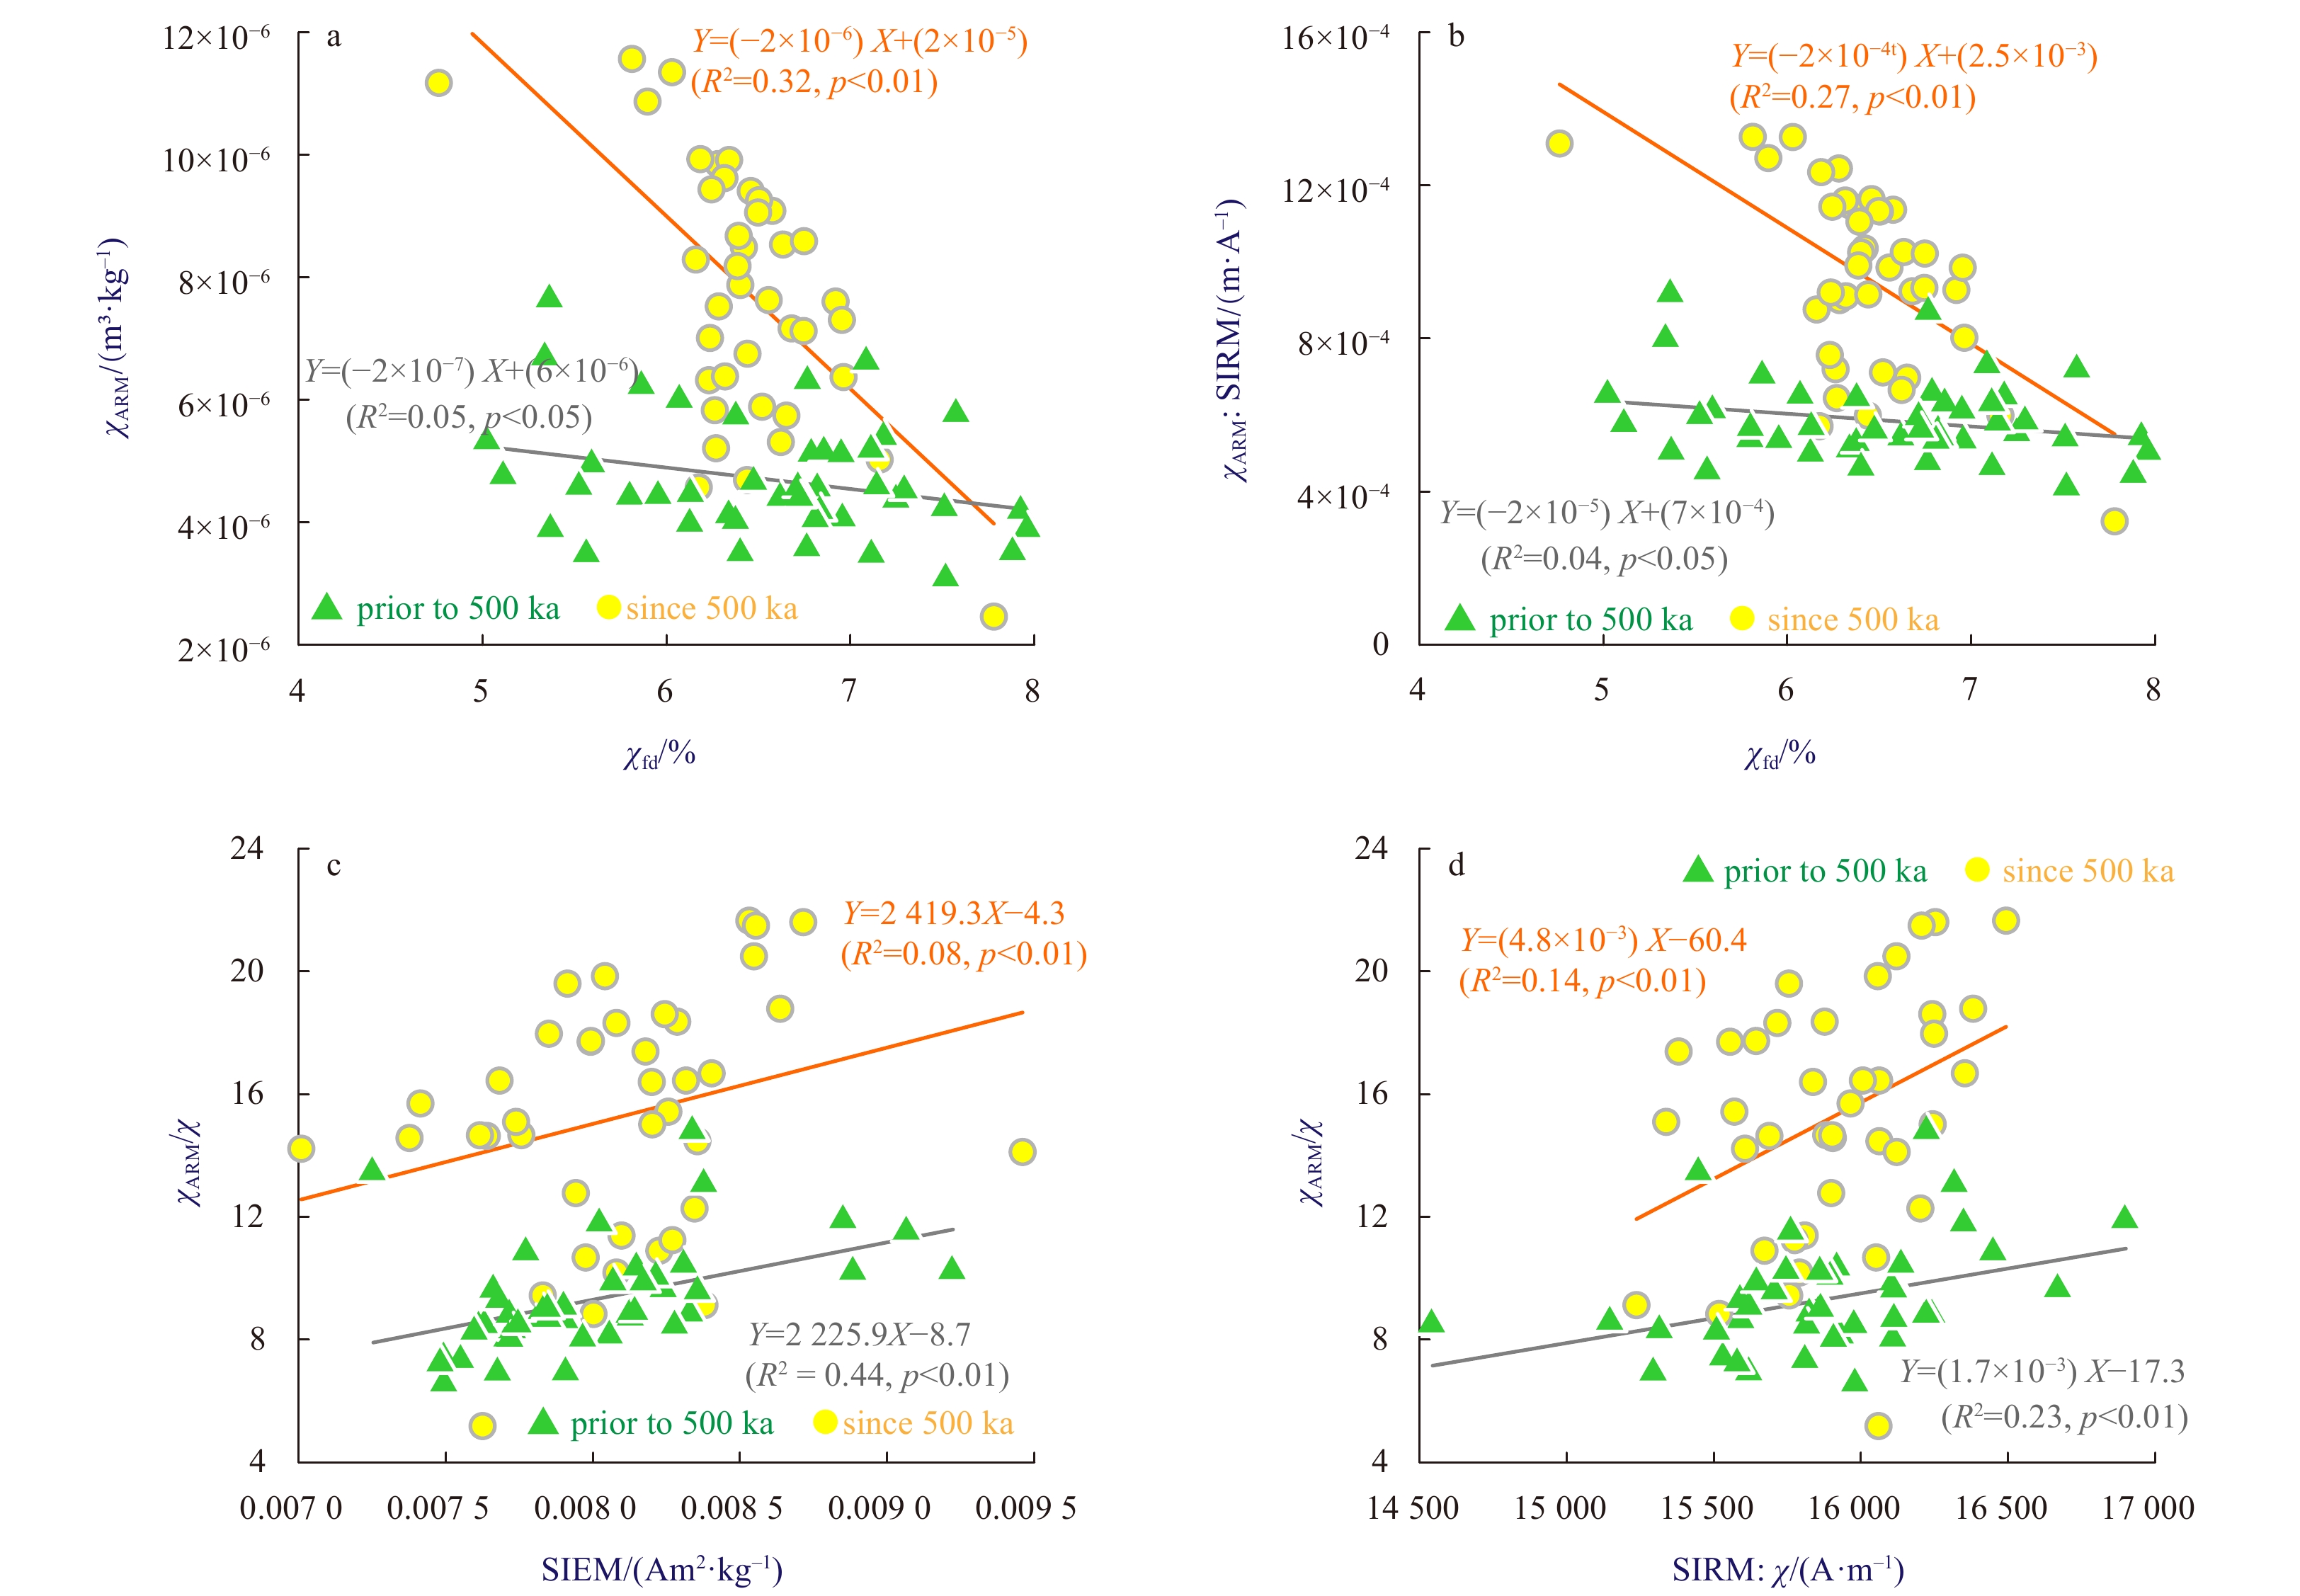
Correlation coefficients can be applied to assess relationships between magnetic parameters. As shown in their scatter plots (Fig. 5), the differences mainly associated with the grainsize-dependent parameters are significant. In specific, in the case of SIRM vs. χARM/χ, the difference between the intercepts is evident; and in contrary, for the cases of χfd vs. χARM, χfd vs. χARM/SIRM, and SIRM/χ vs. χARM/χ, the differences in the slopes are evident with a small difference in regression intercepts. Additionally, for other paired parameters, such as χ vs. χfd and χ vs. SIRM, there is no difference between the two units, thus not shown in this work.
Figure
5.
Relationship between magnetic parameters of Core MABC-11.
The distinct regression intercepts indicate that the basic background of magnetic particles would be evident; while a difference in regression slopes may indicate different magnetic properties in different time intervals. Hence, it is inferred that magnetic properties changed significantly and the boundary around ~500 ka is a key point for deep-sea environmental changes in the Caiwei Guyot during the Middle Pleistocene.
3.4
Magnetic minerals in the sediments
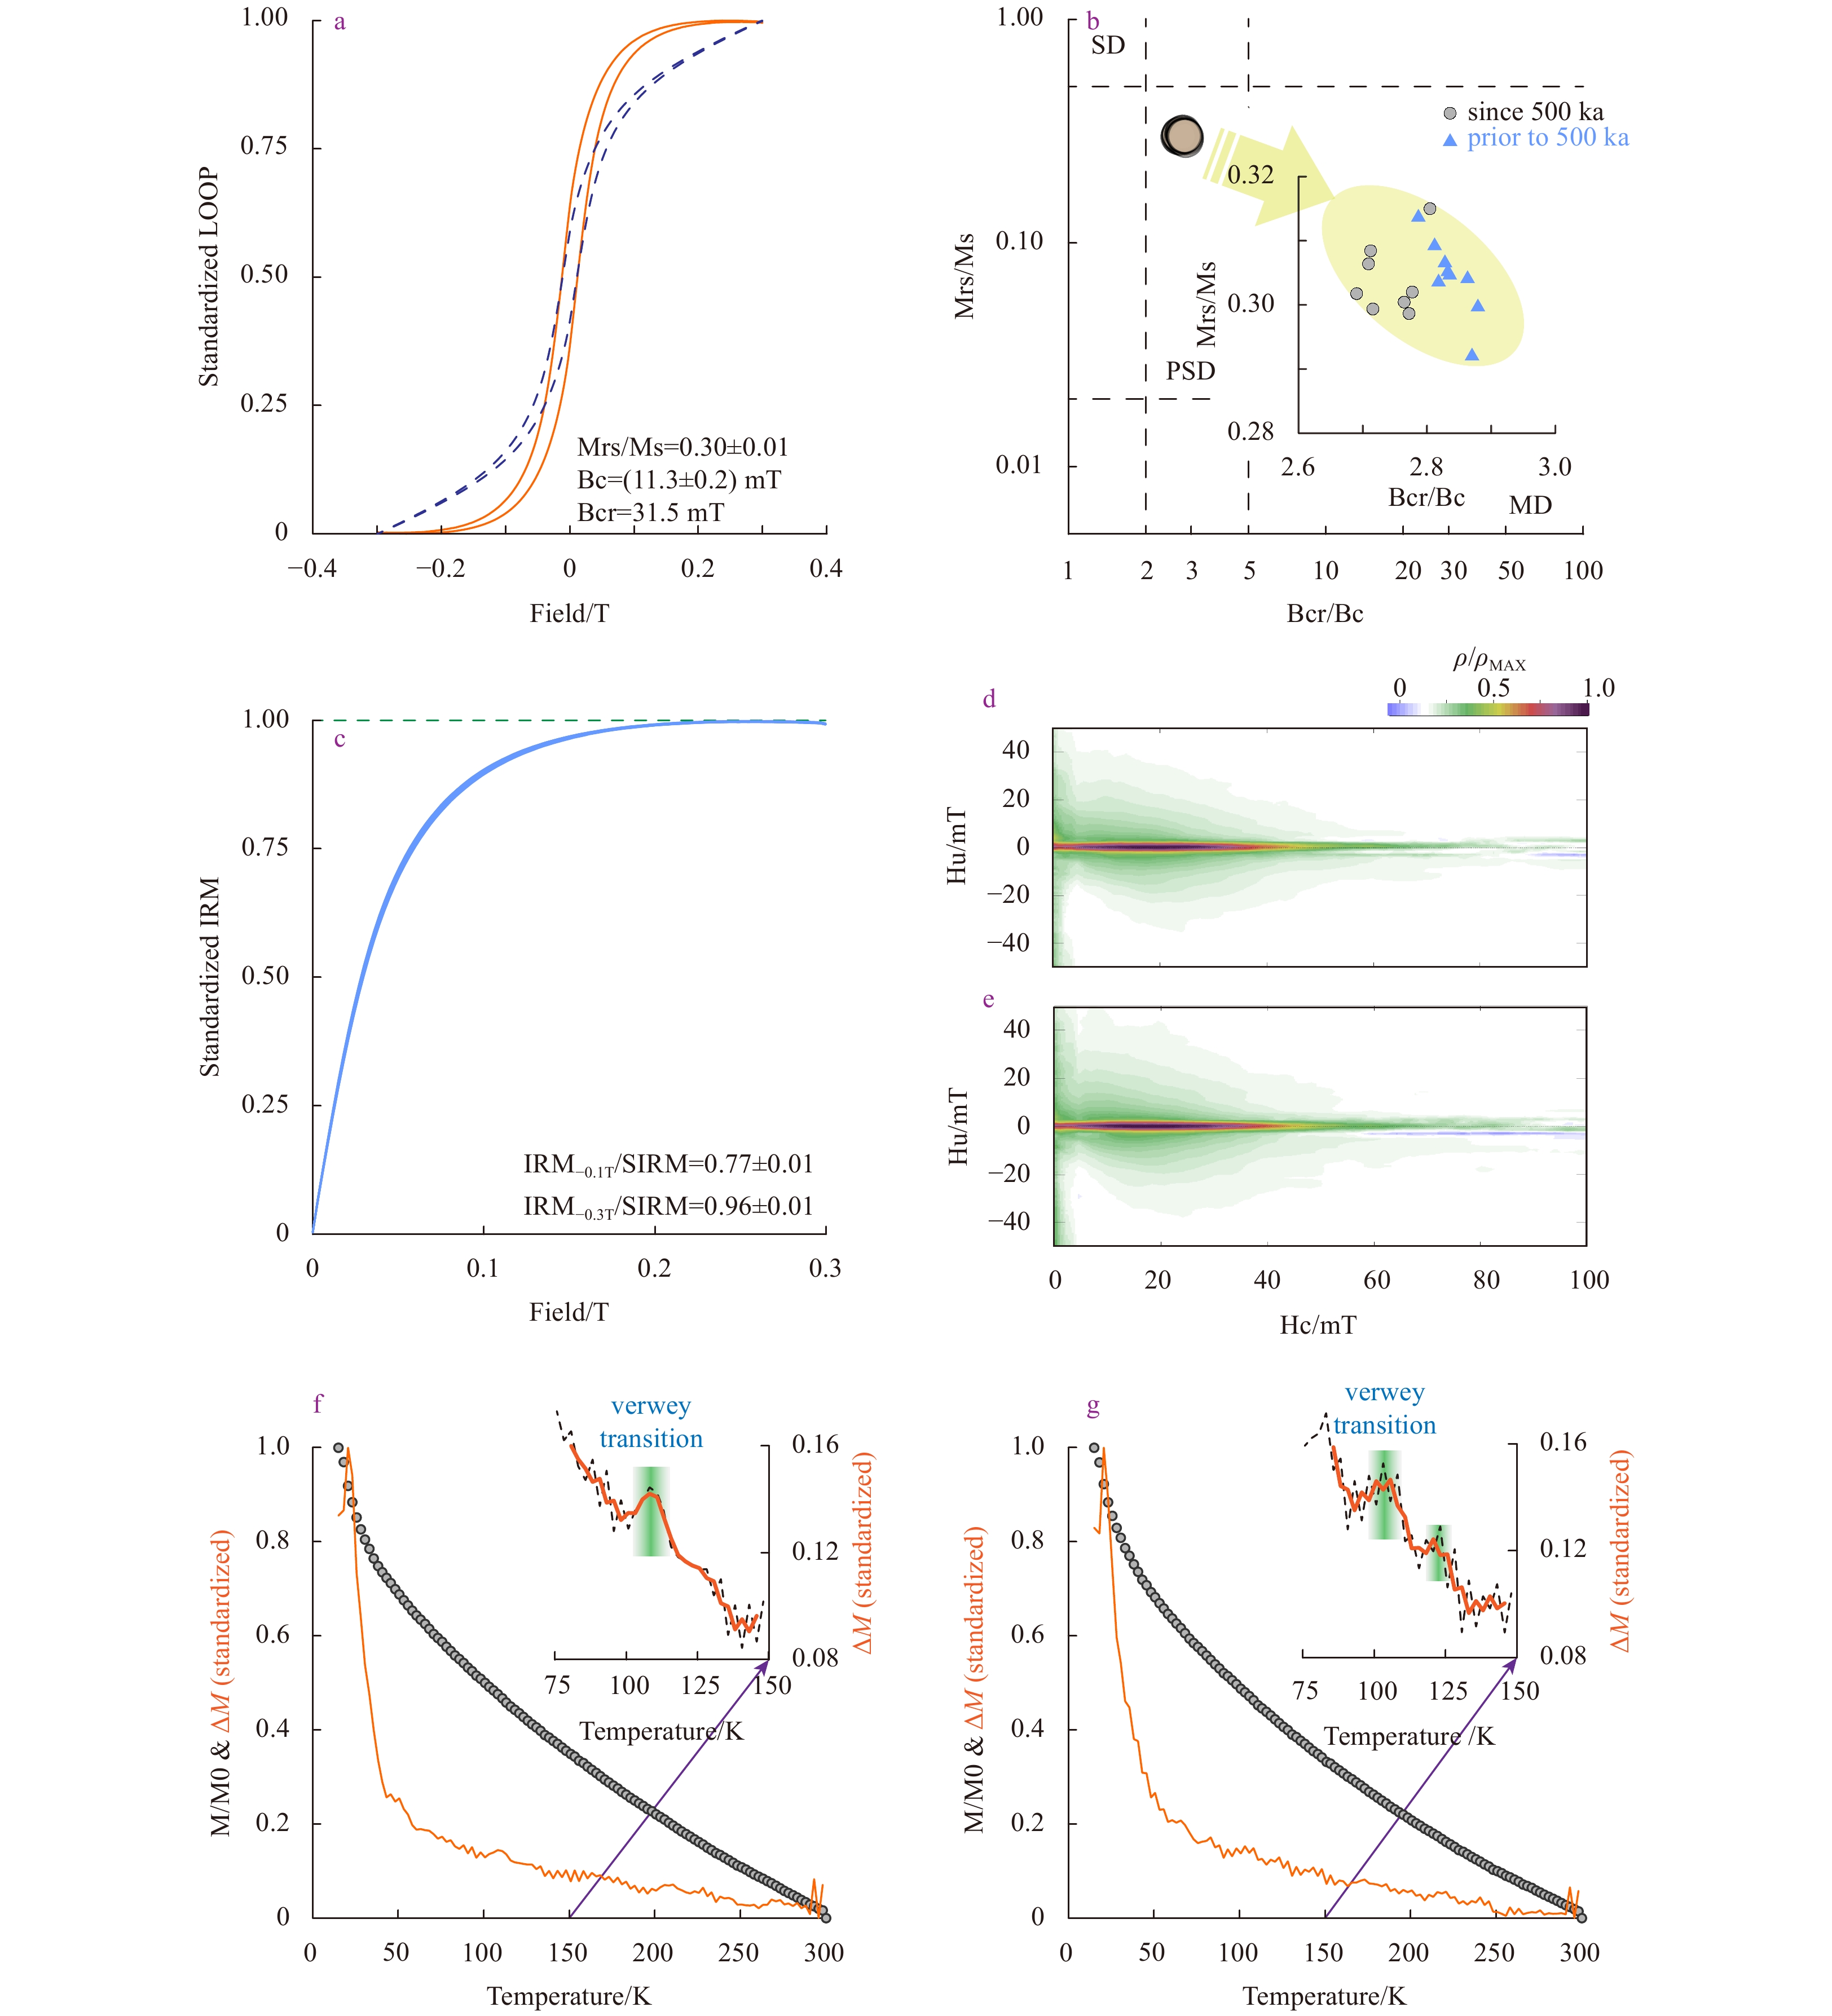
Rock magnetic analysis shows that hysteresis loops are closed below 200 mT, and IRM acquisition curves are saturated in relatively low magnetic fields (<200 mT), with an IRM–0.3T/SIRM of 0.94–0.99 (Fig. 6), indicating the dominance of low-coercivity magnetic minerals in the sediments of Core MABC-11. The limited vertical spread and wide horizonal spread of the contours in FORC diagrams (Figs 6d–e) indicate that magnetostatic interactions are negligible (Roberts et al., 2000, 2014), and the bulk of the coercivity distribution lies in the 10–50 mT range, with peaks at ~20 mT, agreeing well with ones of Core MABC-05 on the Caiwei Guyot (Lin et al., 2019) and Core J01A in the Mariana Trench (Deng et al., 2016).
Figure
6.
Rock magnetism of representative samples of Core MABC–11. a. Hysteresis loop of one sample in original (dash line) and calibrated (solid line) forms, and other samples were not shown due to the high similarity; the standard deviation of Bcr values is 1.87×10⁶; b. day plot of 17 selected samples; SD, single domain; PSD, pseudo–single domain; MD, multiple domain; c. IRM curves of 17 selected samples; and d–g. FORC diagrams and ZFCs with their derivatives of two samples (25 cm and 45 cm in depth, respectively).
The samples’ Bc and Bcr are (11.1 ± 0.2) mT and 31.5 mT, respectively, and on the day plot (Day et al., 1977), they are distributed within the upper part of the pseudo-single domain (PSD) range, inferring that the magnetic grains in the sediments are mainly PSD or close to SD. A three-humped distribution was observed by mathematically unmixing hysteresis loops using the normal function (Heslop and Roberts, 2012; Heslop, 2015), and their coercivities are 6–7 mT, 31–35 mT, and 84–98 mT, respectively (Yi et al., 2021). Although the difference of hysteresis loops, IRM acquisition curves, and FORC diagrams between the samples is not evident, on the day plot (Fig. 6b), the samples prior to ~500 ka have a higher ratio between Bcr/Bc and Mrs/Ms, inferring that magnetic grains are slightly coarser (Roberts et al., 2018) in the lower part of Core MABC-11. Moreover, the ZFC samples exhibit a Verwey transition at 100–130 K (Fig. 6), indicating the dominance of magnetite (Verwey, 1939). The Verwey transition of magnetic particles from different sources may have distinct temperatures, offering an effective tool to identify the contribution of biogenic magnetite (Chang et al., 2016). In specific, for biogenic magnetite, the Verwey transition is usually low (~100 K), while for inorganic magnetite, the Verwey transition is relatively high (~120 K) (Chang et al., 2016). In our study, the Verwey transition of one sample is relatively narrow and centered at ~110 K (Fig. 6f), while for the other sample, two peaks are observed at ~105 K and ~120 K (Fig. 6g).
The magnetic behaviors of Core MABC-11 are similar with ones of Cores NGC36, NGC65, and NGC88 in the western Pacific (Yamazaki, 2009), Core XTGC1311 in the middle Pacific (Li et al., 2020), and IODP Site U1337 in the eastern Pacific (Yamazaki, 2012), in which the presence of magnetic bacterial fossils was claimed. In addition, Mn values in Core MABC-11 is ~20% higher than ones in Core J01A in the Mariana Trench (Yi et al., 2020, 2021), where the oceanographic setting is dominated by the AABW/LCDW with a high level of dissolute oxygen (Xiao et al., 2020); and there is a surface-to-bottom linkage in the Caiwei Guyot (Guo et al., 2020), which provides sufficient dissolute oxygen to the oceanic bottom (Yi et al., 2021). Integrating all these evidences, it is inferred that the finer magnetic particles are not attributed to magnetite dissolution in a reduction environment, but the potential contribution of biogenic magnetite. Hence, we proposed that the dominant magnetic mineral is low-coercivity magnetite and their grains are fine, likely indicating the presence of biogenic magnetite.
Figure
7.
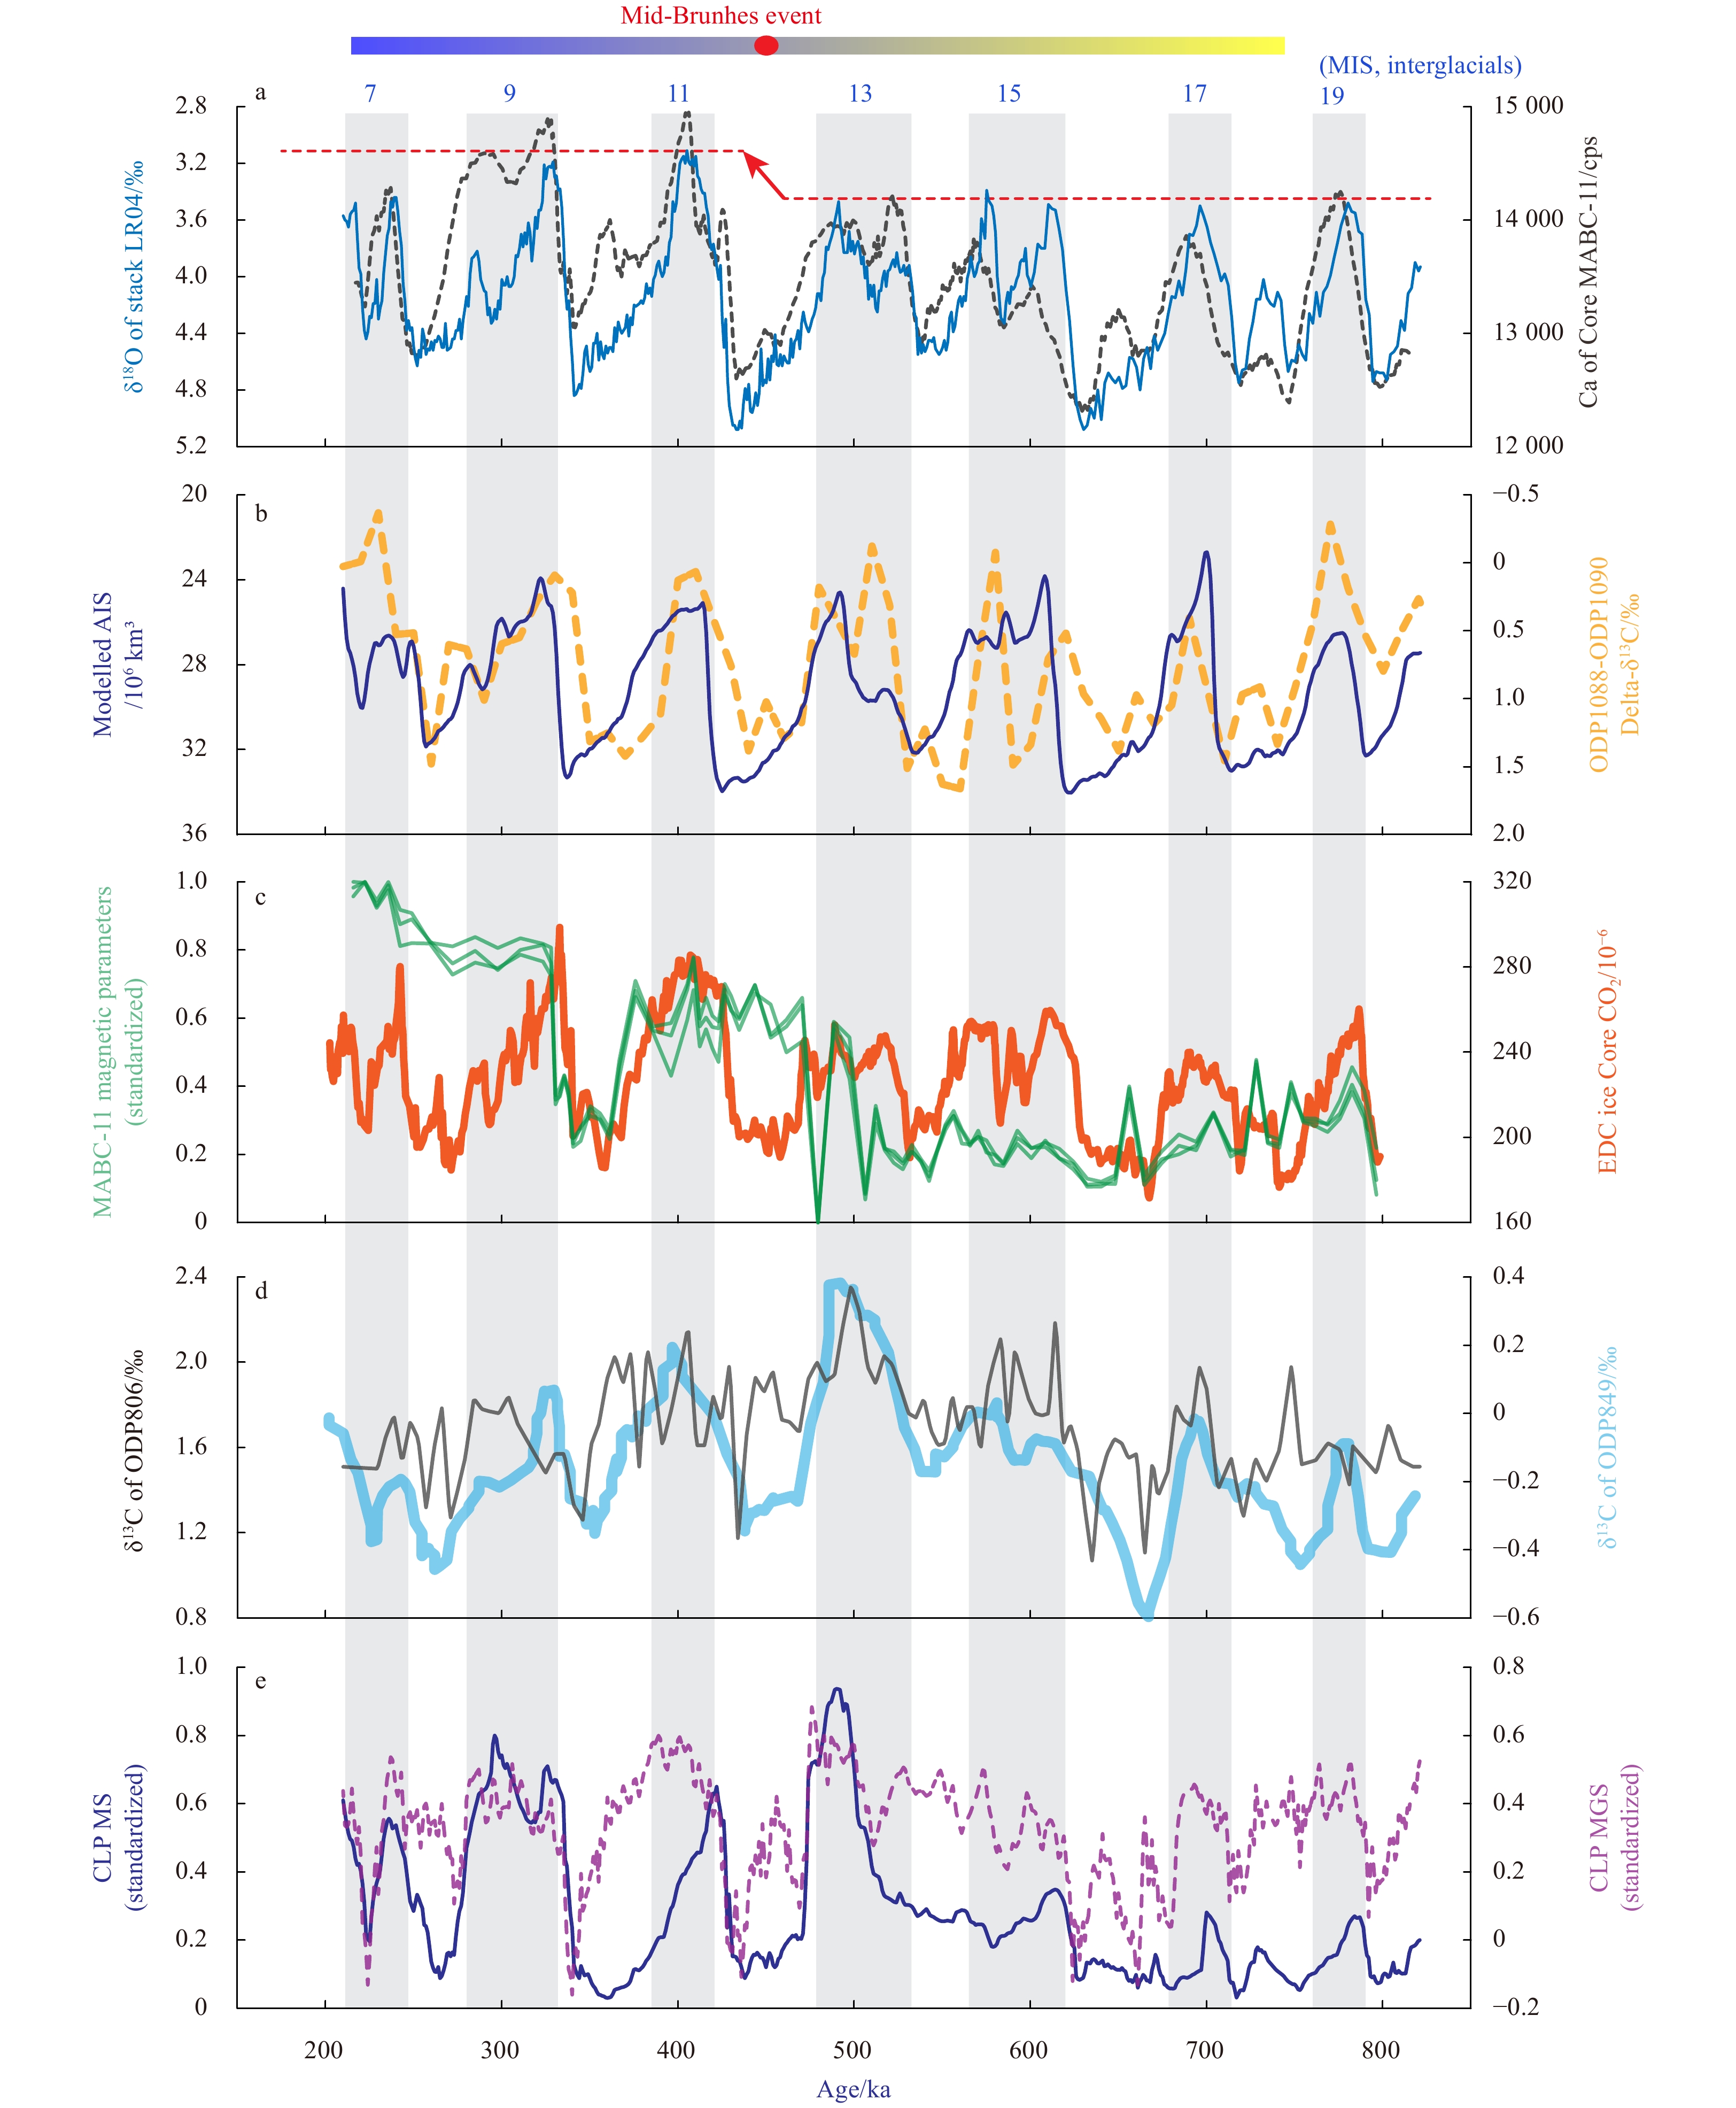
Comparison of various environmental proxies in the middle Pleistocene (210–820 ka). a. The benthic δ18O stack LR04 (Lisiecki and Raymo, 2005), vs. the element Ca of Core MABC-11 (Yi et al., 2021); MIS, marine isotope stages, which are labelled as numbers 7–19 on the top; b. the modelled Antarctic ice volume (AIS) (Pollard and DeConto, 2009), vs. the Circumpolar Deep Water (CDW) inferred from the gradient of δ13C record of ODP Sites 1088 and 1090 (Hodell and Venz-Curtis, 2006); c. three magnetic parameters (χARM, χARM/χ, and χARM/SIRM) of Core MABC-11 derived in this study, vs. the EPICA Dome C ice core CO2 (Lüthi et al., 2008); d. the planktonic δ13C of western Pacific ODP Site 806 (Berger et al., 1993) and eastern Pacific ODP Site 849 (Mix et al., 1995); and e. stack grain size (MGS) and magnetic susceptibility (MS) of Chinese Loess Plateau (CLP, Sun et al., 2006).
It is hotly debated that whether the MBE is a multiple equilibrium in the climate system (Jansen et al., 1986; Paillard, 1998), or a transition between two distinct climate states singly responding to astronomical forcing (Yin, 2013; Tzedakis et al., 2017). The corresponding mechanism for the MBE may involve a latitudinal shift of the Southern Hemisphere westerlies inducing CO2 respiring from the Southern Ocean (Kemp et al., 2010) and/or a slowdown of AABW formation (Yin, 2013) after the MBE. However, the relationship between orbital forcing, greenhouse gases and ice volume is complex (Barth et al., 2018; Past Interglacials Working Group of PAGES, 2016), and because of locating at a remote end of AABW/LCDW influences, deep-sea paleoceanographic changes in the western Pacific could be more sensitive to their changes, which have not been well documented yet.
Similar to changes in the LR04 and atmospheric CO2 across the MBE (Fig. 7a), a major shift in the grainsize-dependent rock magnetic parameters (χARM, χARM/χ, and χARM/SIRM) of Core MABC-11 was observed in this study (Fig. 7c). The three magnetic records of the Caiwei Guyot also exhibit alternations between glacial and interglacial intervals, which can be generally correlated to marine isotope stages (MIS) identified by the deep-sea benthic δ18O record (Fig. 7a) and the circumpdar deep water (CDW) changes inferred by the δ13C gradient between ODP Sites 1088 and 1090 (Fig. 7b). Considering the three magnetic parameters are mainly sensitive to changes in magnetic grains in the sediments, it is inferred magnetic grains tend to finer during interglacial intervals in the Caiwei Guyot in the middle Pleistocene, and magnetic grains became smaller substantially since ~500 ka, which could be correlated to the MBE in the Earth’s climate (Fig. 7).
The grainsize-dependent magnetic parameters can be usually employed to indicate the relative contribution of biogenic magnetite in various sediments (Yamazaki, 2009; Oldfield, 2013; Liu et al., 2015; Chang et al., 2018), suggesting a close linkage between magnetic properties in the sediments and global glacial-interglacial alternations. Taking this observation as a reference, we explain changes in magnetic parameters of Core MABC-11 as follows.
Previous researchers have proposed that magnetofossils increase in warm climates in the Quaternary (Yamazaki, 2009; Liu et al., 2015; Chang et al., 2018). Because of this, high values of χARM, χARM/χ, and χARM/SIRM of Core MABC-11 may be associated with flourishing biota in the tropical Pacific during interglacial intervals (Fig. 7d), and biogenic magnetite likely increased, while during glacial intervals, detrital magnetite grains from inland Asia (Fig. 7e) and surrounding areas increased relatively. Although no direct evidence indicating the weakening of deep-ocean circulation after the MBE (Fig. 7b), the warmer interglacial intervals and the weaker AABW from a modelling perspective (Yin, 2013) may induce marine productivity to vary at a higher level (Figs 7a and d), probably resulting in higher values of the magnetic parameters of Core MABC-11. Therefore, it seems that there is a consistent linkage between magnetic properties of the deep-sea sediments and global glacial-interglacial alternations in the north Pacific during the middle Pleistocene. In addition, it is notable that the increase of magnetic parameters in MIS 13 precedes to the MBE, agreeing with changes in marine productivity and Chinese loess plateau (Figs 7a, d and e). This leading phase in the Caiwei Guyot may be linked to the two-stage transition of the MBE (Ao et al., 2020), which is worthy of further investigation in future.
4.
Conclusions
By studying magnetic properties of the sediments on the base of the Caiwei Guyot, Magellan Seamounts in the western Pacific, a well-dated record of magnetic parameters in the middle Pleistocene was derived, which can be used for inferences of deep-sea paleoceanographic processes in the study area. Our main findings are summarized as follows. (1) The dominant magnetic mineral in the sediments is low-coercivity magnetite possibly with biogenic contribution, and their grain sizes are in pseudo–single domain range; (2) the concentration-dependent magnetic parameters have a large variance in the upper part of the core, and for the low part, the grainsize-dependent rock magnetic parameters are relatively large; (3) three records of the studied core, including χARM, χARM/χ, and χARM/SIRM, can be well correlated to changes in global ice volume and atmospheric CO2 and display a major shift in the MBE. Based on these observations, we proposed a response of magnetic properties of the sediments on the Caiwei Guyot to global climate changes as follows. During interglacial intervals, optimum climate may induce marine productivity in the tropical Pacific, probably increasing biogenic magnetite in the sediments on the Caiwei Guyot and decreasing magnetic grain sizes. Since the MBE, the warmer interglaciations may increase marine productivity with biogenic magnetite to vary at a higher level and induce a substantial increase of magnetic parameters. Therefore, we conclude that the sedimentary records in the Caiwei Guyot documented some key changes in the Earth’s climate, providing a unique window to observe interactions between various environmental systems on glacial-interglacial timescales.
Acknowledgements
We thank Huafeng Qin and Zhongshan Shen in the Institute of Geology and Geophysics, Chinese Academy of Sciences, for their helps in magnetic measurements. The data presented in this study is available at https://mda.vliz.be/directlink.php?fid=VLIZ_00000824_60d14bf7dabdb732357748.
Ao Hong, Rohling E J, Stringer C, et al. 2020. Two-stage mid-Brunhes climate transition and mid-Pleistocene human diversification. Earth-Science Reviews, 210: 103354. doi: 10.1016/j.earscirev.2020.103354
[2]
Barth A M, Clark P U, Bill N S, et al. 2018. Climate evolution across the Mid-Brunhes transition. Climate of the Past, 14(12): 2071–2087. doi: 10.5194/cp-14-2071-2018
[3]
Berger W H, Bickert T, Schmidt H, et al. 1993. Quaternary carbon isotope record of pelagic foraminifers: Site 806, Ontong Java Plateau. In: Proceedings of the Ocean Drilling Program, Volume 130 Scientific Results. College State, TX, USA: Ocean Drilling Program, 381–395
[4]
Chang Liao, Harrison R J, Zeng Fan, et al. 2018. Coupled microbial bloom and oxygenation decline recorded by magnetofossils during the Palaeocene–Eocene Thermal Maximum. Nature Communications, 9(1): 4007. doi: 10.1038/s41467-018-06472-y
[5]
Chang Liao, Heslop D, Roberts A P, et al. 2016. Discrimination of biogenic and detrital magnetite through a double Verwey transition temperature. Journal of Geophysical Research: Solid Earth, 121(1): 3–14. doi: 10.1002/2015JB012485
[6]
Cheng Hai, Edwards R L, Sinha A, et al. 2016. The Asian monsoon over the past 640,000 years and ice age terminations. Nature, 534(7609): 640–646. doi: 10.1038/nature18591
[7]
Clark P U, Alley R B, Pollard D. 1999. Northern Hemisphere ice-sheet influences on global climate change. Science, 286(5442): 1104–1111. doi: 10.1126/science.286.5442.1104
[8]
Day R, Fuller M, Schmidt V A. 1977. Hysteresis properties of titanomagnetites: grain-size and compositional dependence. Physics of the Earth and Planetary Interiors, 13(4): 260–267. doi: 10.1016/0031-9201(77)90108-X
[9]
Deng Yinan, Ren Jiangbo, Guo Qingjun, et al. 2017. Rare earth element geochemistry characteristics of seawater and porewater from deep sea in western Pacific. Scientific Reports, 7(1): 16539. doi: 10.1038/s41598-017-16379-1
[10]
Deng Xiguang, Yi Liang, Paterson G A, et al. 2016. Magnetostratigraphic evidence for deep-sea erosion on the Pacific Plate, south of Mariana Trench, since the middle Pleistocene: potential constraints for Antarctic bottom water circulation. International Geology Review, 58(1): 49–57. doi: 10.1080/00206814.2015.1055597
[11]
Duan Zongqi, Gao Xing, Liu Qingsong. 2012. Anhysteretic remanent magnetization (ARM) and its application to geoscience. Progress in Geophysics (in Chinese), 27(5): 1929–1938. doi: 10.6038/j.issn.1004-2903.2012.05.013
[12]
Evans M E, Heller F. 2003. Environmental Magnetism: Principles and Applications of Enviromagnetics. Amsterdam: Academic Press, 1–299
[13]
Guo Binbin, Wang Weiqiang, Shu Yeqiang, et al. 2020. Observed deep anticyclonic cap over Caiwei Guyot. Journal of Geophysical Research: Oceans, 125(10): e2020JC016254. doi: 10.1029/2020JC016254
[14]
Haley B A, Klinkhammer G P, McManus J. 2004. Rare earth elements in pore waters of marine sediments. Geochimica et Cosmochimica Acta, 68(6): 1265–1279. doi: 10.1016/j.gca.2003.09.012
[15]
He Gaowen, Zhao Zubin, Zhu Kechao. 2001. Cobalt-Rich Crust Resources in the West Pacific (in Chinese). Beijing: Geological Publishing House, 1–92
[16]
Heslop D. 2015. Numerical strategies for magnetic mineral unmixing. Earth-Science Reviews, 150: 256–284. doi: 10.1016/j.earscirev.2015.07.007
[17]
Heslop D, Roberts A P. 2012. A method for unmixing magnetic hysteresis loops. Journal of Geophysical Research: Solid Earth, 117(B3): B03103. doi: 10.1029/2011JB008859
[18]
Hilgen F J, Lourens L J, Van Dam J A, et al. 2012. Chapter 29−the neogene period. In: Gradstein F M, Ogg J G, Schmitz M D, et al.,eds. The Geologic Time Scale. Boston, MA, USA: Elsevier, 923–978, doi: 10.1016/B978-0-444-59425-9.00029-9
[19]
Hodell D A, Venz-Curtis K A. 2006. Late Neogene history of deepwater ventilation in the Southern Ocean. Geochemistry, 7(9): Q09001. doi: 10.1029/2005gc001211
[20]
Jansen J H F, Kuijpers A, Troelstra S R. 1986. A Mid-Brunhes climatic event: long-term changes in global atmosphere and ocean circulation. Science, 232(4750): 619–622. doi: 10.1126/science.232.4750.619
[21]
Jouzel J, Masson-Delmotte V, Cattani O, et al. 2007. Orbital and millennial Antarctic climate variability over the past 800, 000 years. Science, 317(5839): 793–796. doi: 10.1126/science.1141038
[22]
Kawabe M, Fujio S. 2010. Pacific Ocean circulation based on observation. Journal of Oceanography, 66(3): 389–403. doi: 10.1007/s10872-010-0034-8
[23]
Kemp A E S, Grigorov I, Pearce R B, et al. 2010. Migration of the Antarctic polar front through the mid-Pleistocene transition: evidence and climatic implications. Quaternary Science Reviews, 29(17–18): 1993–2009. doi: 10.1016/j.quascirev.2010.04.027
[24]
Li Jinhua, Liu Yan, Liu Shuangchi, et al. 2020. Classification of a complexly mixed magnetic mineral assemblage in Pacific Ocean surface sediment by electron microscopy and supervised magnetic unmixing. Frontiers in Earth Science, 8: 609058. doi: 10.3389/feart.2020.609058
[25]
Lin Zhen, Yi Liang, Wang Haifeng, et al. 2019. Rock magnetism of deep-sea sediments at Caiwei Guyot, Magellan seamounts of Northwest Pacific and its significance to abyssal environmental changes. Chinese Journal of Geophysics (in Chinese), 62(8): 3067–3077. doi: 10.6038/cjg2019M0526
[26]
Lisiecki L E, Raymo M E. 2005. A Pliocene-Pleistocene stack of 57 globally distributed benthic δ18O records. Paleoceanography, 20(1): PA1003. doi: 10.1029/2004PA001071
[27]
Liu Suzhen, Deng Chenglong, Xiao Jule, et al. 2015. Insolation driven biomagnetic response to the Holocene warm period in semi-arid East Asia. Scientific Reports, 5(1): 8001. doi: 10.1038/srep08001
[28]
Liu Qian, Huo Yingyi, Wu Yuehong, et al. 2019. Bacterial community on a Guyot in the northwest Pacific Ocean influenced by physical dynamics and environmental variables. Journal of Geophysical Research: Biogeosciences, 124(9): 2883–2897. doi: 10.1029/2019jg005066
[29]
Loulergue L, Schilt A, Spahni R, et al. 2008. Orbital and millennial-scale features of atmospheric CH4 over the past 800, 000 years. Nature, 453(7193): 383–386. doi: 10.1038/nature06950
[30]
Lüthi D, Le Floch M, Bereiter B, et al. 2008. High-resolution carbon dioxide concentration record 650, 000–800, 000 years before present. Nature, 453(7193): 379–382. doi: 10.1038/nature06949
[31]
Maher B A. 1988. Magnetic properties of some synthetic sub-micron magnetites. Geophysical Journal, 94(1): 83–96. doi: 10.1111/j.1365-246X.1988.tb03429.x
[32]
Mix A C, Pisias N G, Rugh W, et al. 1995. Benthic foraminifer stable isotope record from Site 849 (0–5 Ma): local and global climate changes. In: Proceedings of the Ocean Drilling Program, Volume 138 Scientific Results. College State, TX, USA: Ocean Drilling Program, 371–412
[33]
Oldfield F. 2013. Mud and magnetism: records of late Pleistocene and Holocene environmental change recorded by magnetic measurements. Journal of Paleolimnology, 49(3): 465–480. doi: 10.1007/s10933-012-9648-8
[34]
Paillard D. 1998. The timing of Pleistocene glaciations from a simple multiple-state climate model. Nature, 391(6665): 378–381. doi: 10.1038/34891
[35]
Past Interglacials Working Group of PAGES. 2016. Interglacials of the last 800, 000 years. Reviews of Geophysics, 54(1): 162–219. doi: 10.1002/2015RG000482
[36]
Pollard D, DeConto R M. 2009. Modelling West Antarctic ice sheet growth and collapse through the past five million years. Nature, 458(7236): 329–332. doi: 10.1038/nature07809
[37]
Roberts A P, Heslop D, Zhao Xiang, et al. 2014. Understanding fine magnetic particle systems through use of first-order reversal curve diagrams. Reviews of Geophysics, 52(4): 557–602. doi: 10.1002/2014rg000462
[38]
Roberts A P, Pike C R, Verosub K L. 2000. First-order reversal curve diagrams: a new tool for characterizing the magnetic properties of natural samples. Journal of Geophysical Research: Solid Earth, 105(B12): 28461–28475. doi: 10.1029/2000jb900326
[39]
Roberts A P, Tauxe L, Heslop D, et al. 2018. A critical appraisal of the “Day” diagram. Journal of Geophysical Research: Solid Earth, 123(4): 2618–2644. doi: 10.1002/2017jb015247
[40]
Stepashko A A. 2008. Spreading cycles in the Pacific Ocean. Oceanology, 48(3): 401–408. doi: 10.1134/S0001437008030120
[41]
Sun Youbin, Clemens S C, An Zhisheng, et al. 2006. Astronomical timescale and palaeoclimatic implication of stacked 3.6-Myr monsoon records from the Chinese Loess Plateau. Quaternary Science Reviews, 25(1−2): 33–48. doi: 10.1016/j.quascirev.2005.07.005
[42]
Sun Qiqi, Song Jinming, Li Xuegang, et al. 2020. Bacterial vertical and horizontal variability around a deep seamount in the Tropical Western Pacific Ocean. Marine Pollution Bulletin, 158: 111419. doi: 10.1016/j.marpolbul.2020.111419
[43]
Talley L D. 2008. Freshwater transport estimates and the global overturning circulation: shallow, deep and throughflow components. Progress in Oceanography, 78(4): 257–303. doi: 10.1016/j.pocean.2008.05.001
[44]
Tauxe L, Butler R F, Van Der Voo R, et al. 2010. Essentials of Paleomagnetism. Berkeley: University of California Press, 1–512
[45]
Tzedakis P C, Crucifix M, Mitsui T, et al. 2017. A simple rule to determine which insolation cycles lead to interglacials. Nature, 542(7642): 427–432. doi: 10.1038/nature21364
[46]
Verwey E J W. 1939. Electronic conduction of magnetite (Fe3O4) and its transition point at low temperatures. Nature, 144(3642): 327–328. doi: 10.1038/144327b0
[47]
Wang Fenlian, He Gaowen, Wang Haifeng, et al. 2016a. Geochemistry of rare earth elements in a core from Mariana Trench and its significance. Marine Geology & Quaternary Geology (in Chinese), 36(4): 67–75. doi: 10.16562/j.cnki.0256-1492.2016.04.008
[48]
Wang Yanmei, Zhang Huodai, Liu Jihua, et al. 2016b. Abundances and spatial distributions of associated useful elements in Co-rich crusts from Caiwei Seamount in Magellan Seamounts. Marine Geology & Quaternary Geology (in Chinese), 36(2): 65–74. doi: 10.16562/j.cnki.0256-1492.2016.02.008
[49]
Wei Zhenquan, Deng Xiguang, Zhu Kechao, et al. 2017. Characteristic of substrate rocks of Caiwei Seamounts in the west Pacific Ocean. Marine Geology Frontiers (in Chinese), 33(12): 1–6. doi: 10.16028/j.1009-2722.2017.12001
[50]
Wessel P. 1997. Sizes and ages of seamounts using remote sensing: implications for intraplate volcanism. Science, 277(5327): 802–805. doi: 10.1126/science.277.5327.802
[51]
Wessel P, Lyons S. 1997. Distribution of large Pacific seamounts from Geosat/ERS-1: implications for the history of intraplate volcanism. Journal of Geophysical Research: Solid Earth, 102(B10): 22459–22475. doi: 10.1029/97JB01588
[52]
Xiao Chunhui, Wang Yonghong, Tian Jiwei, et al. 2020. Mineral composition and geochemical characteristics of sinking particles in the Challenger Deep, Mariana Trench: implications for provenance and sedimentary environment. Deep Sea Research Part I: Oceanographic Research Papers, 157: 103211. doi: 10.1016/j.dsr.2019.103211
[53]
Xu Zhaokai, Li Tiegang, Clift P D, et al. 2015. Quantitative estimates of Asian dust input to the western Philippine Sea in the mid-late Quaternary and its potential significance for paleoenvironment. Geochemistry, 16(9): 3182–3196. doi: 10.1002/2015gc005929
[54]
Xu Peng, Liu Feng, Ding Zhongjun, et al. 2016. A new species of the thorid genus Paralebbeus Bruce & Chace, 1986 (Crustacea: Decapoda: Caridea) from the deep sea of the Northwestern Pacific Ocean. Zootaxa, 4085(1): 119–126. doi: 10.11646/zootaxa.4085.1.5
[55]
Yamazaki T. 2009. Environmental magnetism of Pleistocene sediments in the North Pacific and Ontong-Java Plateau: temporal variations of detrital and biogenic components. Geochemistry, 10(7): Q07Z04. doi: 10.1029/2009GC002413
[56]
Yamazaki T. 2012. Paleoposition of the Intertropical Convergence Zone in the eastern Pacific inferred from glacial-interglacial changes in terrigenous and biogenic magnetic mineral fractions. Geology, 40(2): 151–154. doi: 10.1130/g32646.1
[57]
Yang Zifei, Qian Qiankun, Chen Min, et al. 2020. Enhanced but highly variable bioturbation around seamounts in the northwest Pacific. Deep Sea Research Part I: Oceanographic Research Papers, 156: 103190. doi: 10.1016/j.dsr.2019.103190
[58]
Yi Liang, Wang Haifeng, Deng Xiguang, et al. 2021. Geochronology and geochemical properties of Mid-Pleistocene sediments on the Caiwei Guyot in the Northwest Pacific imply a surface-to-deep linkage. Journal of Marine Science and Engineering, 9(3): 253. doi: 10.3390/jmse9030253
[59]
Yi Liang, Xu Dong, Jiang Xingyu, et al. 2020. Magnetostratigraphy and authigenic 10Be/9Be dating of Plio-Pleistocene abyssal surficial sediments on the southern slope of Mariana Trench and sedimentary processes during the Mid-Pleistocene Transition. Journal of Geophysical Research: Oceans, 125(8): e2020JC016250. doi: 10.1029/2020jc016250
[60]
Yin Qiuzhen. 2013. Insolation-induced mid-Brunhes transition in Southern Ocean ventilation and deep-ocean temperature. Nature, 494(7436): 222–225. doi: 10.1038/nature11790
[61]
Zachos J, Pagani M, Sloan L, et al. 2001. Trends, rhythms, and aberrations in global climate 65 Ma to present. Science, 292(5517): 686–693. doi: 10.1126/science.1059412
[62]
Zhai Fangguo, Gu Yanzhen. 2020. Abyssal circulation in the Philippine Sea. Journal of Ocean University of China, 19(2): 249–262. doi: 10.1007/s11802-020-4241-7
[63]
Zhao Bin, Wei Zhenquan, Yang Yong, et al. 2020. Sedimentary characteristics and the implications of cobalt-rich crusts resources at Caiwei Guyot in the Western Pacific Ocean. Marine Georesources & Geotechnology, 38(9): 1037–1045. doi: 10.1080/1064119X.2019.1648615
Yang Wang, Tongzheng Zhang, Harunur Rashid. Diverse glacial ventilation in deep Pacific: An integrated record from Mariana Trench and Magellan Seamounts over the last 1.2 Myr [Global and Planetary Change, volume 230, November 2023, 104279]: Comment. Global and Planetary Change, 2024, 243: 104614. doi:10.1016/j.gloplacha.2024.104614
2.
Zhongshan Shen, Yanping Chen, Pavel Mikhailik, et al. Early diagenesis, sedimentary dynamics and metal enrichment reveal deep-sea ventilation in Magellan Seamounts during the middle Pleistocene. Frontiers in Marine Science, 2024, 11 doi:10.3389/fmars.2024.1470134
3.
Liang Yi. Diverse glacial ventilation in deep Pacific: An integrated record from Mariana Trench and Magellan Seamounts over last 1.2 Myr. Global and Planetary Change, 2023, 230: 104279. doi:10.1016/j.gloplacha.2023.104279
4.
Yanping Chen, Dong Xu, Huafeng Qin, et al. Relationships between Abyssal Redox Conditions and Rock Magnetic Properties of Surficial Sediments in the Western Pacific. Journal of Marine Science and Engineering, 2023, 11(6): 1132. doi:10.3390/jmse11061132
5.
Haifeng Wang, Xiguang Deng, Liang Yi, et al. Dominant eccentricity cycles in paleoenvironmental variabilities recorded by pelagic sediments in the western Pacific during 15–11 Ma. Palaeogeography, Palaeoclimatology, Palaeoecology, 2023, 628: 111776. doi:10.1016/j.palaeo.2023.111776
6.
Dong Xu, Liang Yi, Haifan Yuan, et al. Geochronological Evidence Inferring Carbonate Compensation Depth Shoaling in the Philippine Sea after the Mid-Brunhes Event. Journal of Marine Science and Engineering, 2022, 10(6): 745. doi:10.3390/jmse10060745
7.
Yun Cai, Yibing Li, Xingyu Jiang. Response of Magnetic Minerals to the Mid-Brunhes Climate Event Recorded in Deep-Sea Sediments of the West Philippine Sea. Journal of Marine Science and Engineering, 2022, 10(12): 1977. doi:10.3390/jmse10121977
8.
Liang Yi, Bangqi Hu, Jingtao Zhao, et al. Magnetostratigraphy of Abyssal Deposits in the Central Philippine Sea and Regional Sedimentary Dynamics During the Quaternary. Paleoceanography and Paleoclimatology, 2022, 37(5) doi:10.1029/2021PA004365
9.
Yibing Li, Xinyu Liu, Weiwei Chen, et al. Magnetic Properties and Initiation of Biogenic Reefs in Xisha Islands, South China Sea, at the Oligo–Miocene Boundary. Journal of Marine Science and Engineering, 2021, 9(9): 1031. doi:10.3390/jmse9091031
Liang Yi, Haifeng Wang, Geng Liu, Yanping Chen, Huiqiang Yao, Xiguang Deng. Magnetic minerals in Mid-Pleistocene sediments on the Caiwei Guyot, Northwest Pacific and their response to the Mid-Brunhes climate event[J]. Acta Oceanologica Sinica, 2021, 40(12): 1-11. doi: 10.1007/s13131-021-1872-5
Liang Yi, Haifeng Wang, Geng Liu, Yanping Chen, Huiqiang Yao, Xiguang Deng. Magnetic minerals in Mid-Pleistocene sediments on the Caiwei Guyot, Northwest Pacific and their response to the Mid-Brunhes climate event[J]. Acta Oceanologica Sinica, 2021, 40(12): 1-11. doi: 10.1007/s13131-021-1872-5
Figure 1. Schematic map showing the study area and oceanographic setting. The flow passing through the seamount and a Taylor column was observed based on the data obtained by the conductivity temperature and depth instrument (CTD) and mooring system (Guo et al., 2020). The flows were modified from previous works (Guo et al., 2020; Kawabe and Fujio, 2010; Zhai and Gu, 2020). Reference sites were mentioned or discussed in the main text.
Figure 2. Core MABC-11 with the age-depth model during the middle Pleistocene. a. The excess 230Th data and the estimated SAR for the upper part (Yang et al., 2020); b. photo of the core; c–e. ChRM declination and inclination, with the polarity of Core MABC-11 (Yi et al., 2021); f. the geological polarity timescale (GPTS) (Hilgen et al., 2012), and g–h. comparison between element Ca of Core MABC-11 and the benthic δ18O stack LR04 (Lisiecki and Raymo, 2005) on glacial-interglacial timescales, inferring a higher level of marine productivity in the Caiwei Guyot during interglacial intervals (Yi et al., 2021). B: Brunhes chron; M: Matuyama chron; J: Jaramillo subchron; M/B: the Matuyama/Brunhes boundary.
Figure 3. Some basic information of the sediments of Core MABC–11. a and b. Sediment grain-size distributions; c. REE distribution patterns of the sediments of Core MABC–11 (this study) and the sediments of Core MABC–25, and water columns close to the Caiwei Guyot (Deng et al., 2017); and d. box plot of clay minerals in the sediments of Core MABC–11. PDF: probability density function, CDF: cumulative distribution function, Sme: smectite, Kln: kaolinite, Chl: chlorite.
Figure 4. Changes in magnetic parameters of Core MABC-11.
Figure 5. Relationship between magnetic parameters of Core MABC-11.
Figure 6. Rock magnetism of representative samples of Core MABC–11. a. Hysteresis loop of one sample in original (dash line) and calibrated (solid line) forms, and other samples were not shown due to the high similarity; the standard deviation of Bcr values is 1.87×10⁶; b. day plot of 17 selected samples; SD, single domain; PSD, pseudo–single domain; MD, multiple domain; c. IRM curves of 17 selected samples; and d–g. FORC diagrams and ZFCs with their derivatives of two samples (25 cm and 45 cm in depth, respectively).
Figure 7. Comparison of various environmental proxies in the middle Pleistocene (210–820 ka). a. The benthic δ18O stack LR04 (Lisiecki and Raymo, 2005), vs. the element Ca of Core MABC-11 (Yi et al., 2021); MIS, marine isotope stages, which are labelled as numbers 7–19 on the top; b. the modelled Antarctic ice volume (AIS) (Pollard and DeConto, 2009), vs. the Circumpolar Deep Water (CDW) inferred from the gradient of δ13C record of ODP Sites 1088 and 1090 (Hodell and Venz-Curtis, 2006); c. three magnetic parameters (χARM, χARM/χ, and χARM/SIRM) of Core MABC-11 derived in this study, vs. the EPICA Dome C ice core CO2 (Lüthi et al., 2008); d. the planktonic δ13C of western Pacific ODP Site 806 (Berger et al., 1993) and eastern Pacific ODP Site 849 (Mix et al., 1995); and e. stack grain size (MGS) and magnetic susceptibility (MS) of Chinese Loess Plateau (CLP, Sun et al., 2006).


 DownLoad:


 DownLoad:


 DownLoad: