Figure
1.
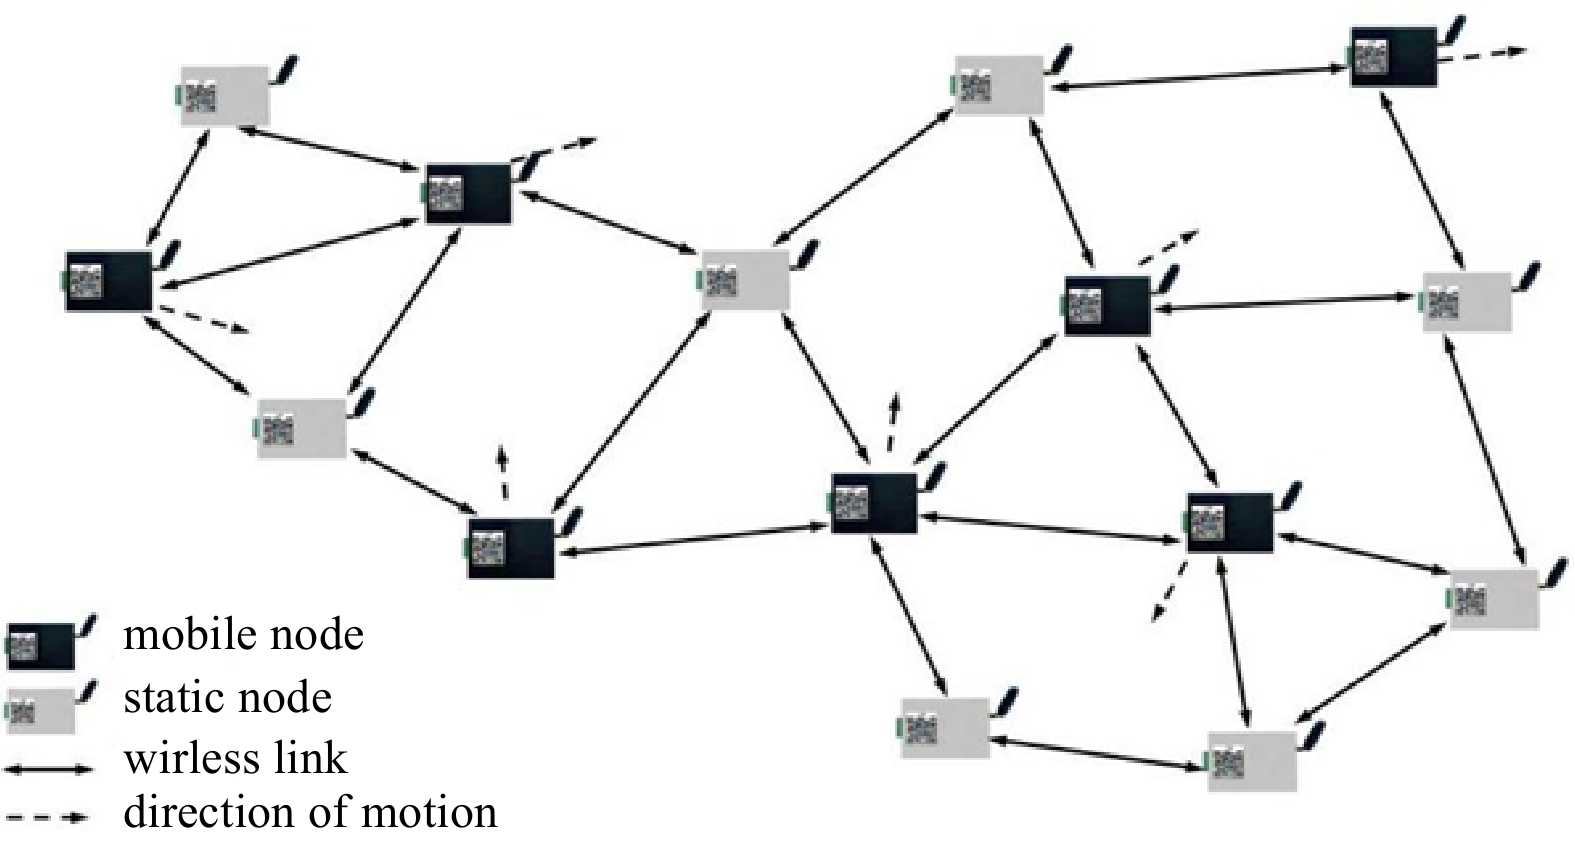
Water surface wireless ad hoc network structure.
| Citation: | Yiqun Xu, Jia Wang, Li Guan. Application research of narrow band Internet of things buoy and surface hydrodynamics monitoring[J]. Acta Oceanologica Sinica, 2021, 40(8): 176-181. doi: 10.1007/s13131-021-1884-1

|
Network communication is the foundation of ocean research. Due to the vast ocean area and complex environment, the offshore area (usually 12 nautical miles away) mainly relies on high-throughput satellite communication and Beidou short message communication. The coastal area can rely on mobile operator networks. As a matter of fact, the costs of satellite communication are high, the antenna is complex and difficult to implement, and the information circulation of Beidou short messages is small. Besides that, mobile operators have limited network coverage, so communication is still an obstacle in marine research and utilization (Xia et al., 2017; Gao, 2018; Wang et al., 2019).
Due to the characteristics of surface currents in coastal waters directly affect coastal erosion, sediment deposition, garbage floating, oil spill diffusion, aquaculture environment, ship navigation, red tide migration and other production activities, it indicates the important practical application value of hydrodynamic monitoring. There are two main methods for monitoring small-scale surface flow hydrodynamics in coastal waters: numerical simulation and physical model. However, the numerical simulation methods have large errors which need to be corrected by the in situ measurement, but the costs of physical models are high. Therefore it is necessary to establish a dynamic, low-cost, and refined surface flow monitoring method.
This paper uses the open frequency band 433 MHz to design a wireless communication base station which is carried by ships, navigation beacons, buoys, shore-based system, islands and even UAVs. These base stations can rapidly set up wireless ad hoc networks with a radius of 100 km. Meanwhile, a wireless self-organizing network with a radius of 100 km can be implemented. Furthermore, the paper designs a micro buoy based on narrow-band Internet of things, which has the functions of wireless narrow-band communication, Beidou positioning, timing and sensor interface. The paper also conducts monitoring tests on some sea areas. By placing a large number of micro buoys, the position and speed of the buoys in real time, are collected continuously, accurately and finely for a long time. Then the surface hydrodynamic data, such as velocity, flow direction and wave height data are obtained. This study uses micro-buoy to track the route of sediment deposition, and the obtained data are highly consistent with the satellite remote sensing image, which proves that the micro-buoy has high application value to the research of sea surface hydrodynamics (Gao, 2018; Moffatt, 2005; Du et al., 2010).
The communication system of marine narrow band Internet of things is composed of fixed base stations and mobile communication nodes. A fixed base station can achieve wireless data communication in waters with a radius of 20 km. Base station is the communication hub between the cloud server and the communication node. Communication nodes can be mobile or fixed, and buoys or moving ships can be used as mobile communication nodes. In addition, communication node can also act as a relay to achieve communication relay transmission. Several base stations and mobile nodes are transmitting signals through communication relays, forming a wireless network with a radius of 100 km. Water surface wireless ad hoc network structure is shown in Fig. 1.
The paper designs a micro buoy based on the 433 MHz frequency band and LoRa communication mechanism narrowband wireless ad hoc network.
The circuit board and object of the miniature buoy are shown in Fig. 2. It mainly includes central processing unit, LoRa module, Beidou module and RS485 interface module. The RS485 interface can be connected to ocean monitoring sensors to collect ocean parameters such as temperature, dissolved oxygen, pH value, and salinity.

The micro buoys can be placed uniformly in the test waters, drifting with the tide, and periodically (default 1 min) sending information with latitude, longitude, wave height, speed and others to the base station, which can collect surface water dynamic data accurately, and precisely in real time. With the support of the differential system, the accuracy of bouy’s location can reach 2.5 cm. The buoys have their own power supply and can last for one month, which is a very good method for small-scale offshore hydrodynamic research. And by the way, because of their low cost, they can not be recycled. (Zhuang, 2006; Wang et al., 2014; Srinivasan et al., 2019)
The velocity characteristics of the buoy need to be obtained through experiments in a pool, which is 60 m long, 2 m wide and 1 m deep.
The inlet velocity is controlled by adjusting the frequency of the motor, and a steady flow pipe is placed at the inlet to ensure uniform flow. The velocity is measured by Doppler current meter and the actual flow rate of the pool is 0.390 6 m/s based on the average flow rate data of 3 000 groups.
The buoys are placed from the middle section of the pool. The experimental process is shown in Fig. 3. The experimental distance is 16 m. The elapsed time of the buoy is recorded with a stopwatch. The buoys are divided into 10 groups. Groups 1–4 are the buoys with the aspect ratio of rudder blades of 0.5, 1, 1.5 and 2 respectively. Group 5–8 are buoys with foam and the ratio of rudder blades to side of 0.5, 1, 1.5 and 2, respectively. Group 9 is buoys without rudder blades and group 10 is buoys without rudder blades and with foam. Each group is measured three times. The experimental data are shown in Table 1.

| Number | Aspect ratio λ | Float time/s | Velocity measured by buoy /(m·s−1) | Vbuoy−Vactually /(m·s−1) | Average error /(m·s−1) |
| 1 | 0.5 | 65.12 | 0.245 7 | 0.144 888 | 0.158 925 |
| 70.16 | 0.228 05 | 0.162 538 | |||
| 72.32 | 0.221 239 | 0.169 349 | |||
| 2 | 1 | 64.33 | 0.248 718 | 0.141 87 | 0.135 762 |
| 62.24 | 0.257 069 | 0.133 519 | |||
| 61.85 | 0.258 69 | 0.131 898 | |||
| 3 | 1.5 | 64.12 | 0.249 532 | 0.141 056 | 0.137 839 |
| 66.03 | 0.242 314 | 0.148 274 | |||
| 60.06 | 0.266 4 | 0.124 188 | |||
| 4 | 2 | 61.18 | 0.261 523 | 0.129 065 | 0.136 976 |
| 62.93 | 0.254 251 | 0.136 337 | |||
| 65.29 | 0.245 06 | 0.145 528 | |||
| 5 | 0.5 (with foam) | 63.05 | 0.253 767 | 0.136 821 | 0.146 644 |
| 66.47 | 0.240 71 | 0.149 878 | |||
| 67.41 | 0.237 354 | 0.153 234 | |||
| 6 | 1 (with foam) | 65.67 | 0.243 642 | 0.146 946 | 0.150 22 |
| 64.87 | 0.246 647 | 0.143 941 | |||
| 69.32 | 0.230 814 | 0.159 774 | |||
| 7 | 1.5 (with foam) | 65.50 | 0.244 275 | 0.146 313 | 0.137 763 |
| 61.56 | 0.259 909 | 0.130 679 | |||
| 62.92 | 0.254 291 | 0.136 297 | |||
| 8 | 2 (with foam) | 67.34 | 0.237 6 | 0.152 988 | 0.151 803 |
| 68.40 | 0.233 918 | 0.156 67 | |||
| 65.35 | 0.244 836 | 0.145 752 | |||
| 9 | without rudder blades | 70.03 | 0.228 474 | 0.162 114 | 0.148 012 |
| 65.22 | 0.245 324 | 0.145 264 | |||
| 63.01 | 0.253 928 | 0.136 66 | |||
| 10 | without rudder blades and with foam | 70.96 | 0.225 479 | 0.165 109 | 0.150 247 |
| 67.28 | 0.237 812 | 0.152 776 | |||
| 62.08 | 0.257 732 | 0.132 856 |
 DownLoad:
CSV
DownLoad:
CSV
The experimental data show that the error between buoy velocity value and actual velocity value is within the range of 0.13–0.15 m/s, and the error is relatively stable. While the ratio of the rudder blade is changed and the foam is increased, the measured velocity of the buoy has little change. It indicates that the disposable buoy can reflect the flow velocity to some extent and has practical application value.
The buoys are released-into the sea. The information of longitude, latitude, velocity and wave height data of buoy is sent to the cloud server with a period of 1 min. With the purpose of visually displaying the trajectory of the buoys and analyzing the dynamic characteristics of surface flow, a public service platform is developed independently based on cloud architecture, which can be used to the public service platform analysis and data mining to form a visual application. In addition, it can intuitively express practical applications such as oil spill diffusion, marine debris drift, sedimentation tracking, sea hydrodynamic balance, tide stroke measurement, etc.
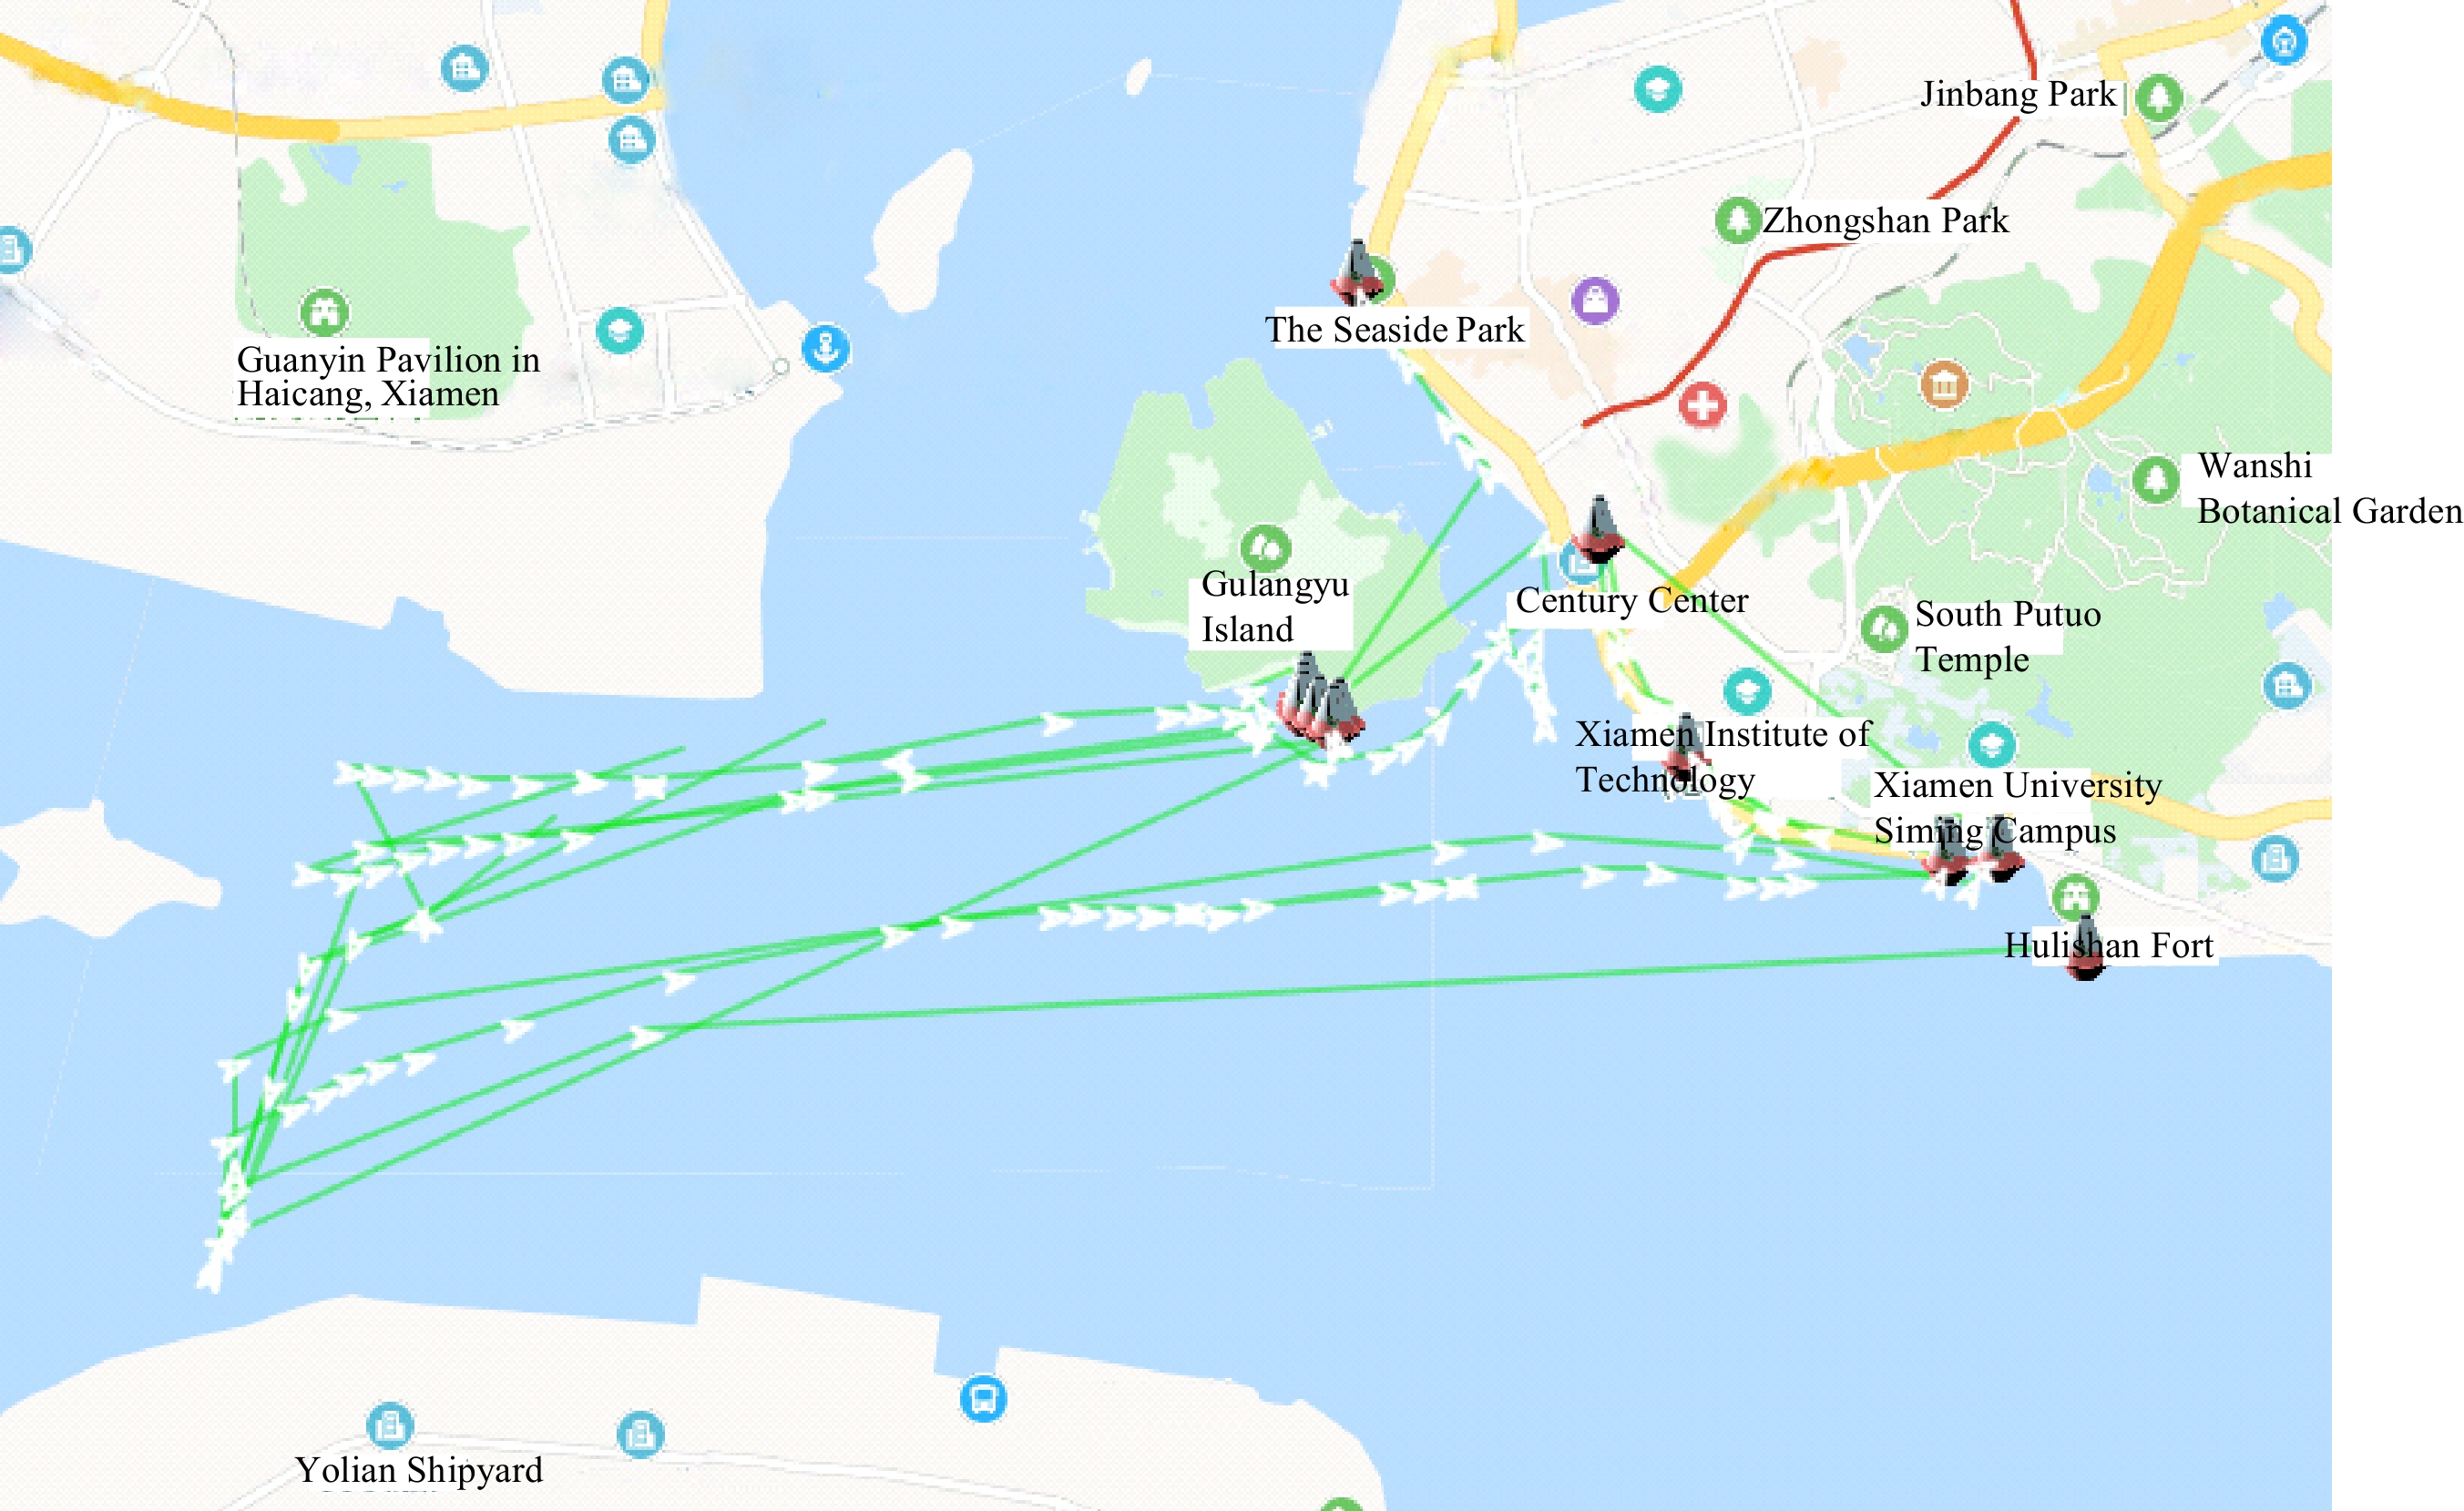
On July 13, 2019, it was cloudy, and the tide height was 513 cm. In the Jiulong River Estuary, 20 buoys were released in line, floating with the tide and sending a set of data to a cloud server every minute. The software platform marks the buoy position and track in the GIS system as shown in Fig. 4, that a set of trajectory curves with arrows indicating the direction of flow. The test results show that all buoys float to the regions around Gulangyu Island and Baicheng Beach of Xiamen University, proving that most of the garbage in the waters around Gulangyu Island and Baicheng Beach of Xiamen University comes from the floating objects of Jiulong River.

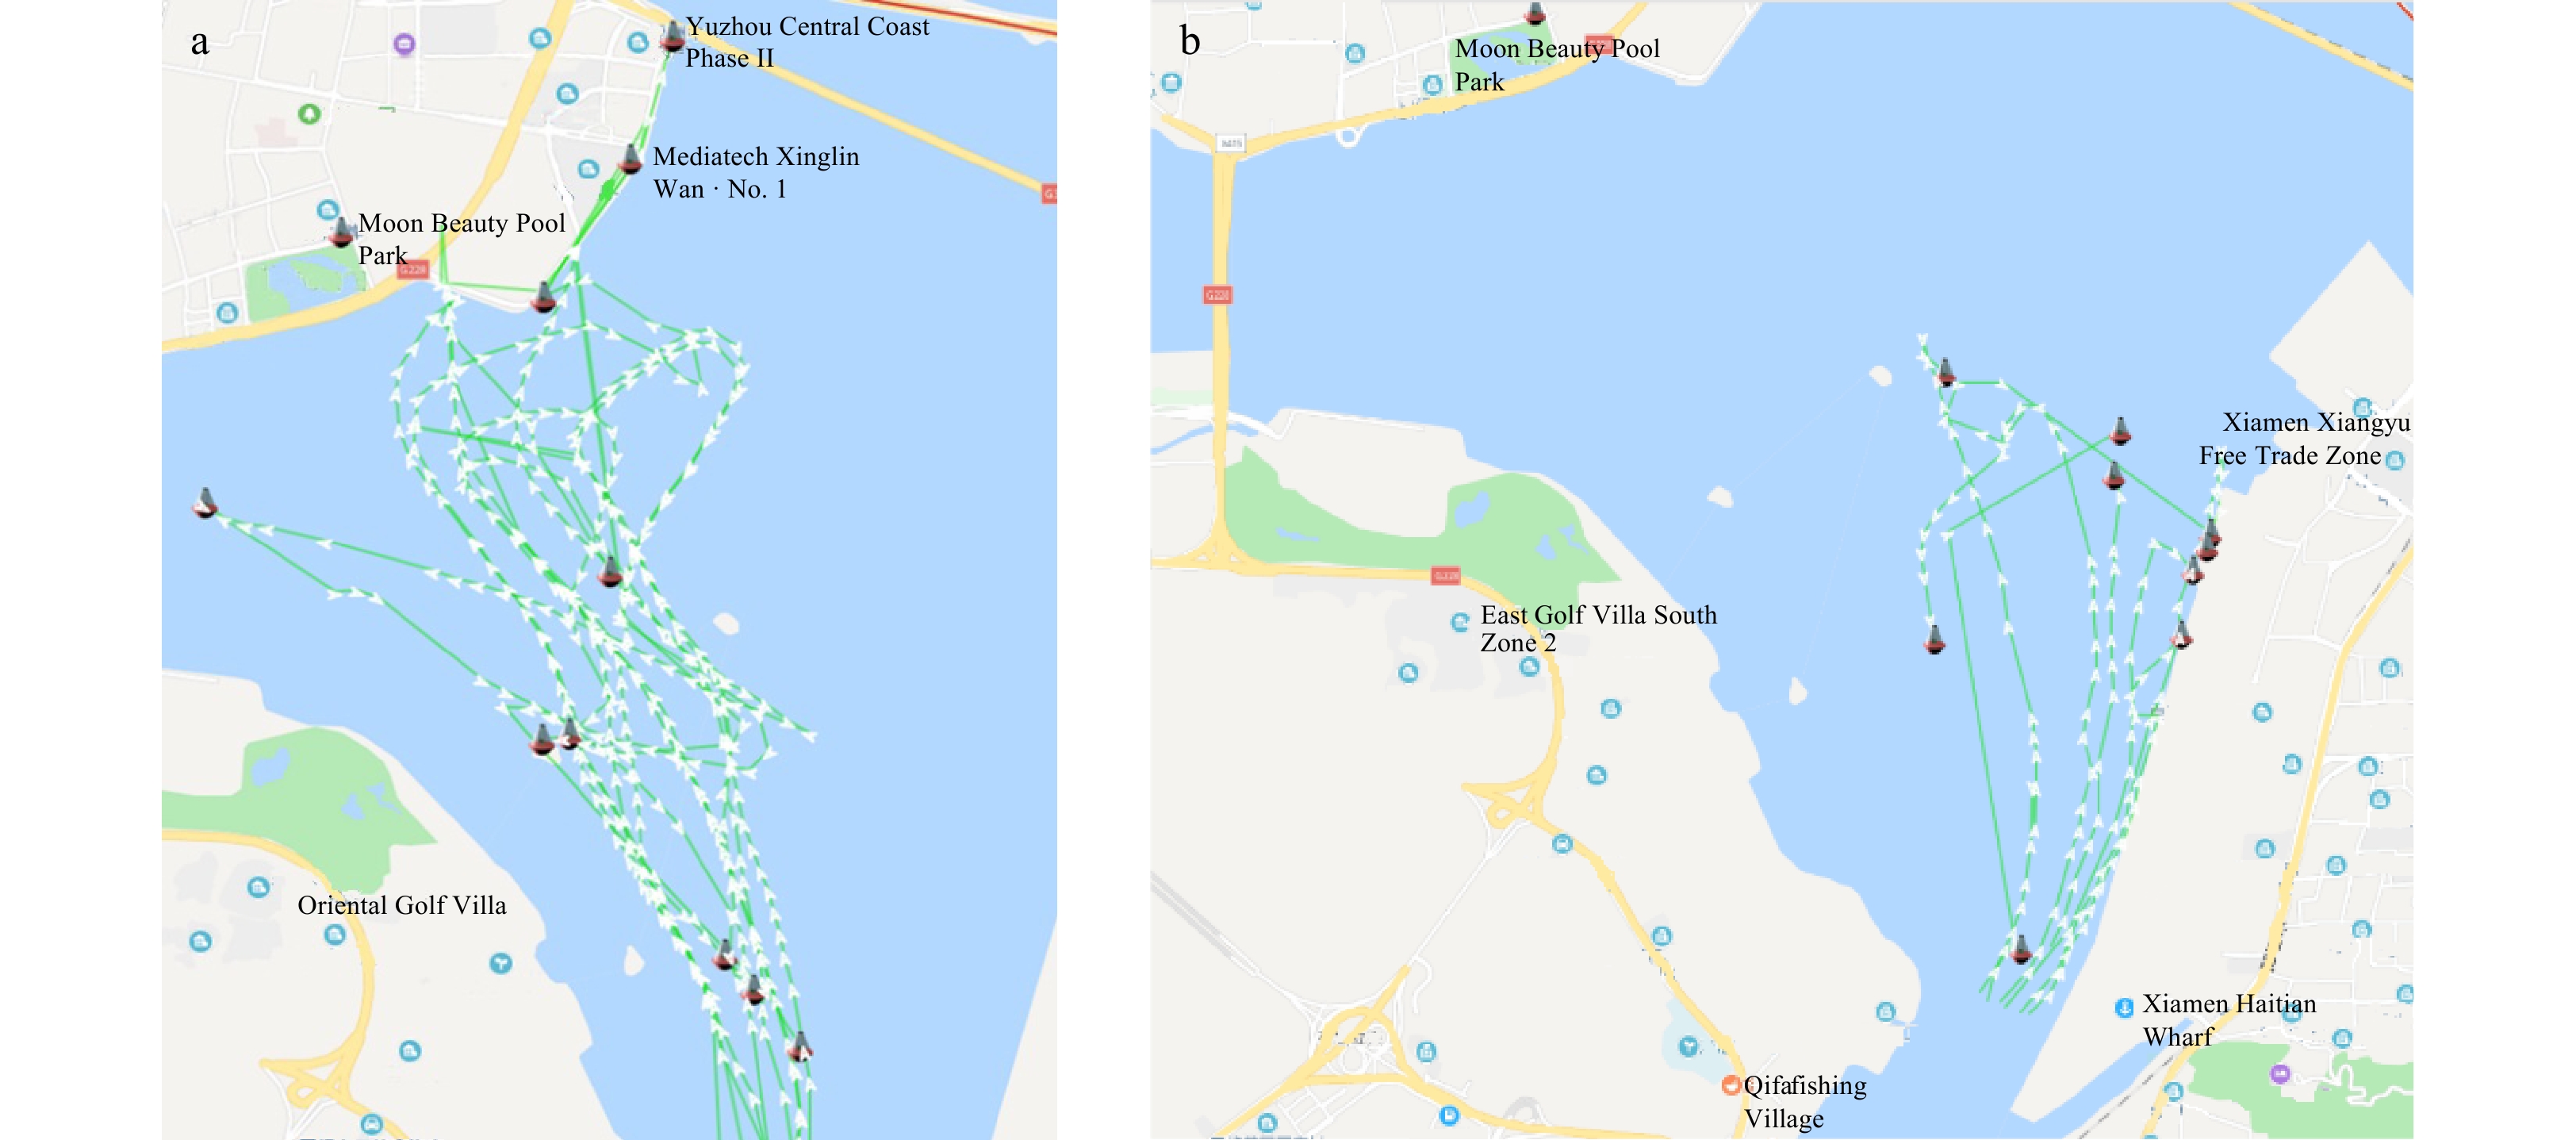
To a large extent, loating garbage flows reflects the direction of sediment flow in the Jiulong River Estuary. In order to continuously track the Jiulong River sediment, buoys are placed under the Haicang Bridge near Gulangyu Island.
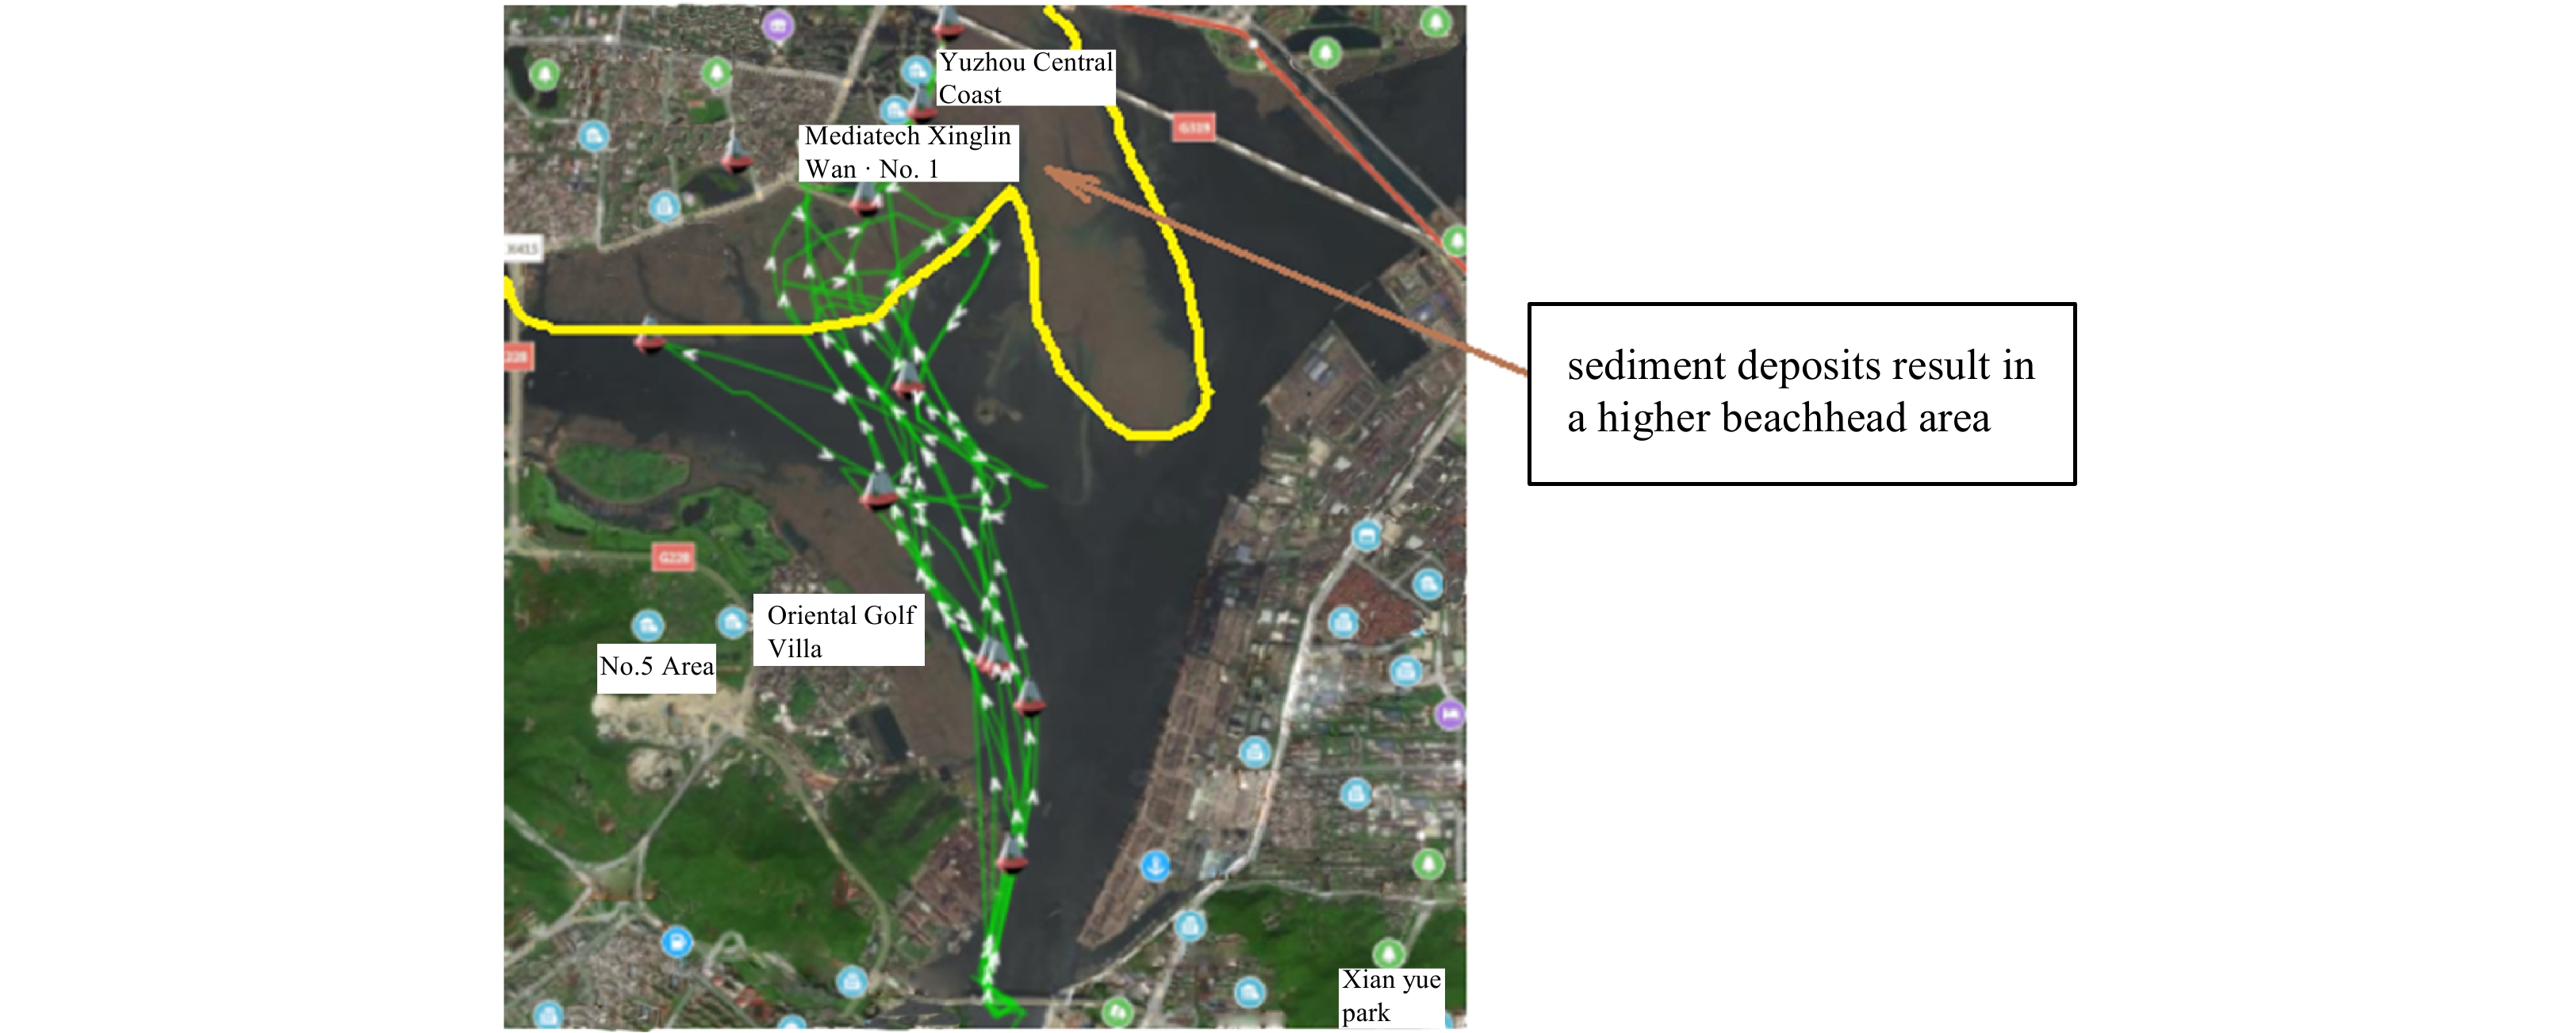
A series of buoys were released near Haicang Bridge in Xiamen on the spring tide on April 19 and the small tide on April 27, 2019. Figure 5a shows the tracking chart of real-time monitoring buoy during the spring flood tide. And the Fig. 5b shows the trajectory during the neap flood tide. Buoys’ trajectory reveal that the buoys return at spring tide in the sea area of Gaopu Village in Xinglin on high tide day, and return at neap tide in the sea area between Dongdu Port and Baozhu Island on low tide day. While the buoys turn back at the stand tide, the current slows down and the sediment deposition. Satellite remote sensing image shows a “7” high beachhead area from Gaopu Village to Baozhu Island, as shown in Fig. 6. It is highly consistent with the test results, which also explains the reason for the large workload of dredging the waters from Baozhu Island to Dongdu Port.


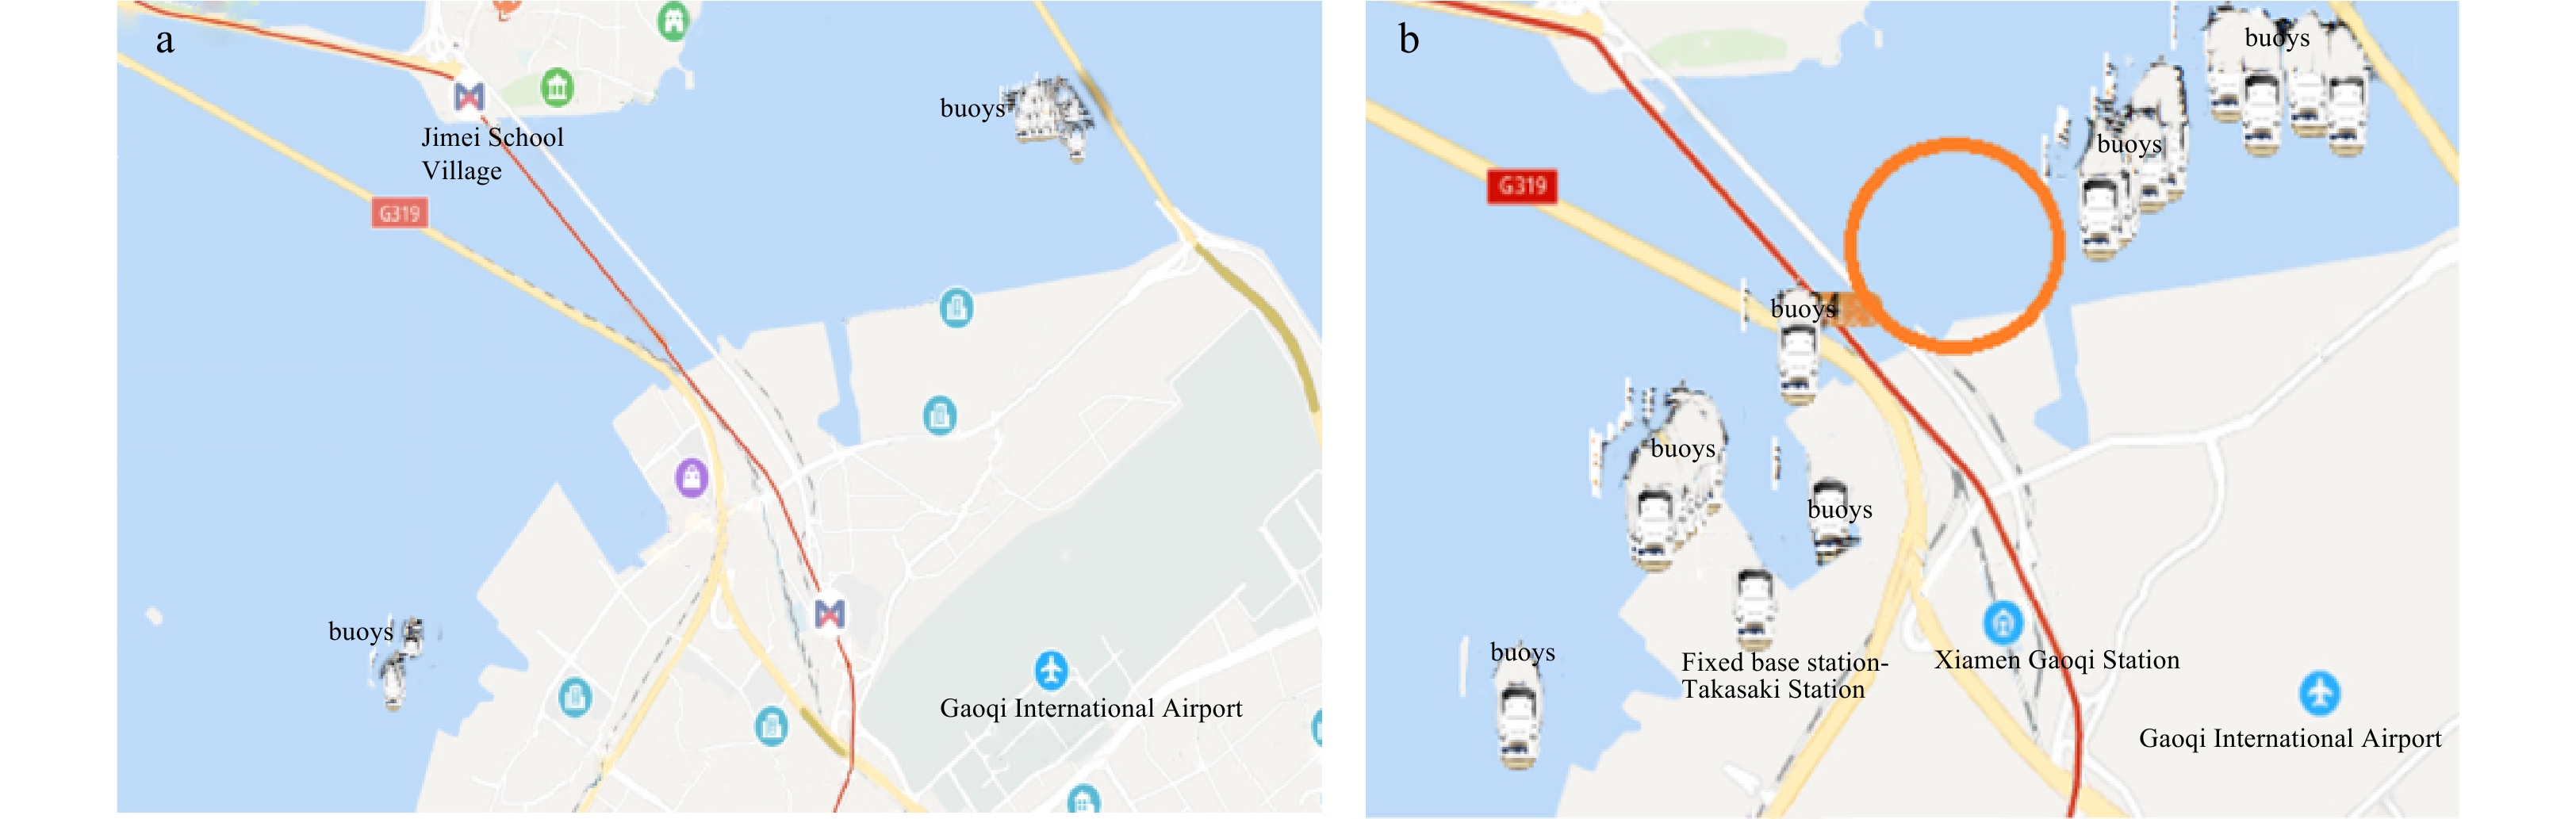
On November 26, 2018, it was light rain, and the tide height was 615 cm. This experiment placed 30 buoys at the beginning of flood tide in the sea area of 3 km from the east and west sides of the Xiamen Bridge from Gaoqi to Jimei. From the position shown in Fig. 7a, the buoys start to follow the tide and drift towards the Xiamen Bridge from the both sides. Figure 7b shows the position of the float during slack tide. After many tests, the data proves that the buoys on both sides did not drift over the Xiamen Seawall, that is shown by the red circle near the Xiamen Bridge in Fig. 7b.

The monitoring data of microbuoys can also be used to verify the numerical simulation model of hydrodynamics. Figure 8 shows the numerical simulation results of hydrodynamics in the sea area around Xiamen Bridge using Regional Oceanic Modelling System. The two red dots in the figure are the initial positions of the throwing buoy, with Xiamen Bridge in the middle. The calculated results are consistent with the monitoring results of buoy experiments, and the hydrodynamic balance of tidal current is found near Xiamen Bridge.

The north end of the Xiamen Bay tide flows in from Tong’an Bay, and the south end flows from the Jiulong River Estuary through the Gulangyu waters. Then the two currents will meet near the Xiamen Bridge. The dynamic balance of the tidal current formed by this intersection makes the tidal pressure difference small or even zero, which is called “dynamic dike”. The experiment prove that the Xiamen seawall is in the hydrodynamic balance area, which prove that the seawall has little influence on the tidal circulation of Xiamen Island, and the impact of tidal power on the seawall is also small. Therefore, it is appropriate to build a seawall at this location.
Narrow band Internet of things has the advantages of convenient networking, portability, low power consumption and long distance coverage. It is a brand-new real-time dynamic monitoring method of ocean hydrodynamics. Compared with the satellite remote sensing image data, the buoy based on narrow-band Internet of things is more effective for the fine monitoring of surface flow hydrodynamics in small-scale offshore waters. In addition, the narrow band Internet of things can also be used in other marine monitoring applications.
| [1] |
Du Wencai, Ma Zhengxin, Bai Yong, et al. 2010. Integrated wireless networking architecture for maritime communications. In: Proceedings of the 11th ACIS International Conference on Software Engineering, Artificial Intelligence, Networking and Parallel/Distributed Computing. London: IEEE, 134–138
|
| [2] |
Gao Qiang. 2018. Ocean buoy wireless communication protocol research and systemim plementation (in Chinese)[dissertation]. Harbin: Harbin Institute of Technology
|
| [3] |
Moffatt C D. 2005. High-data-rate, line-of-site network radio for mobile maritime communications (using Harris WetNetTM technology). In: Proceedings of OCEANS 2005 MTS/IEEE. Washington: IEEE, 1–8
|
| [4] |
Srinivasan R, Rajendran V, Zacharia S, et al. 2019. A study of ocean parameters in Bay of Bengal (BoB) using indigenised drifting buoys. Journal of Earth System Science, 128(7): 196. doi: 10.1007/s12040-019-1242-2
|
| [5] |
Wang Bo, Li Min, Liu Shixuan, et al. 2014. Current status and trend of ocean data buoy observation technology applications (in Chinese). Chinese Journal of Scientific Instrument, 35(11): 2401–2414
|
| [6] |
Wang Quan, Liu Qingbo, Wang Yue, et al. 2019. Application research of space-based communications system in wisdom ocean. Spacecraft Engineering (in Chinese), 28(2): 126–133
|
| [7] |
Xia Minghua, Zhu Youmin, Chen Erhu, et al. 2017. The state of the art and challenges of marine communications. Scientia Sinica: Informationis (in Chinese), 47(6): 677–695. doi: 10.1360/N112017-00016
|
| [8] |
Zhuang Hongru. 2006. Application of automatic monitoring system of water quality on short-term prediction of red tide in Tongan Bay, Xiamen. Marine Environmental Science (in Chinese), 25(2): 58–61
|
| 1. | Yunzhou Li, Juncheng Wang. Technical development of operational in-situ marine monitoring and research on its key generic technologies in China. Acta Oceanologica Sinica, 2023. doi:10.1007/s13131-023-2207-5 | |
| 2. | Xuewei Peng, Yinggang Xie, Yangpeng Xiao, et al. IOT farming system for pelagic fisheries based on blind satellite communication. 2022 15th International Congress on Image and Signal Processing, BioMedical Engineering and Informatics (CISP-BMEI), doi:10.1109/CISP-BMEI56279.2022.9980042 |

Figures(8) / Tables(1)

Supported by:
Beijing Renhe Information Technology Co. Ltd

Yiqun Xu, Jia Wang, Li Guan. Application research of narrow band Internet of things buoy and surface hydrodynamics monitoring[J]. Acta Oceanologica Sinica, 2021, 40(8): 176-181. doi: 10.1007/s13131-021-1884-1

| Number | Aspect ratio λ | Float time/s | Velocity measured by buoy /(m·s−1) | Vbuoy−Vactually /(m·s−1) | Average error /(m·s−1) |
| 1 | 0.5 | 65.12 | 0.245 7 | 0.144 888 | 0.158 925 |
| 70.16 | 0.228 05 | 0.162 538 | |||
| 72.32 | 0.221 239 | 0.169 349 | |||
| 2 | 1 | 64.33 | 0.248 718 | 0.141 87 | 0.135 762 |
| 62.24 | 0.257 069 | 0.133 519 | |||
| 61.85 | 0.258 69 | 0.131 898 | |||
| 3 | 1.5 | 64.12 | 0.249 532 | 0.141 056 | 0.137 839 |
| 66.03 | 0.242 314 | 0.148 274 | |||
| 60.06 | 0.266 4 | 0.124 188 | |||
| 4 | 2 | 61.18 | 0.261 523 | 0.129 065 | 0.136 976 |
| 62.93 | 0.254 251 | 0.136 337 | |||
| 65.29 | 0.245 06 | 0.145 528 | |||
| 5 | 0.5 (with foam) | 63.05 | 0.253 767 | 0.136 821 | 0.146 644 |
| 66.47 | 0.240 71 | 0.149 878 | |||
| 67.41 | 0.237 354 | 0.153 234 | |||
| 6 | 1 (with foam) | 65.67 | 0.243 642 | 0.146 946 | 0.150 22 |
| 64.87 | 0.246 647 | 0.143 941 | |||
| 69.32 | 0.230 814 | 0.159 774 | |||
| 7 | 1.5 (with foam) | 65.50 | 0.244 275 | 0.146 313 | 0.137 763 |
| 61.56 | 0.259 909 | 0.130 679 | |||
| 62.92 | 0.254 291 | 0.136 297 | |||
| 8 | 2 (with foam) | 67.34 | 0.237 6 | 0.152 988 | 0.151 803 |
| 68.40 | 0.233 918 | 0.156 67 | |||
| 65.35 | 0.244 836 | 0.145 752 | |||
| 9 | without rudder blades | 70.03 | 0.228 474 | 0.162 114 | 0.148 012 |
| 65.22 | 0.245 324 | 0.145 264 | |||
| 63.01 | 0.253 928 | 0.136 66 | |||
| 10 | without rudder blades and with foam | 70.96 | 0.225 479 | 0.165 109 | 0.150 247 |
| 67.28 | 0.237 812 | 0.152 776 | |||
| 62.08 | 0.257 732 | 0.132 856 |
DownLoad:
CSV
 DownLoad: