Jing Li, Lin Mu, Linhao Zhong. Frequent central Pacific La Niña events may accelerate Arctic warming since the 1980s[J]. Acta Oceanologica Sinica, 2021, 40(11): 62-69. doi: 10.1007/s13131-021/1843-x
Citation:
Jing Li, Lin Mu, Linhao Zhong. Frequent central Pacific La Niña events may accelerate Arctic warming since the 1980s[J]. Acta Oceanologica Sinica, 2021, 40(11): 62-69. doi: 10.1007/s13131-021/1843-x
Jing Li, Lin Mu, Linhao Zhong. Frequent central Pacific La Niña events may accelerate Arctic warming since the 1980s[J]. Acta Oceanologica Sinica, 2021, 40(11): 62-69. doi: 10.1007/s13131-021/1843-x
Citation:
Jing Li, Lin Mu, Linhao Zhong. Frequent central Pacific La Niña events may accelerate Arctic warming since the 1980s[J]. Acta Oceanologica Sinica, 2021, 40(11): 62-69. doi: 10.1007/s13131-021/1843-x
College of Life Sciences and Oceanography, Shenzhen University, Shenzhen 518060, China
2.
College of Marine Science and Technology, China University of Geosciences, Wuhan 430074, China
3.
Southern Marine Science and Engineering Guangdong Laboratory (Guangzhou), Guangzhou 511458, China
4.
CAS Key Laboratory of Regional Climate-Environment for Temperate East Asia, Institute of Atmospheric Physics, Chinese Academy of Sciences, Beijing 100029, China
Funds:
The Shenzhen Fundamental Research Program under contract No. JCYJ20200109110220482; the National Natural Science Foundation of China under contract No. U2006210; the Key Special Project for Introduced Talents Team of Southern Marine Science and Engineering Guangdong Laboratory (Guangzhou) under contract No. GML2019ZD0604.
Including significant warming trend, Arctic climate changes also exhibit strong interannual variations in various fields, which is suggested to be related to El Niño and Southern Oscillation (ENSO) events. Previous studies have demonstrated the different impacts on the Arctic of central Pacific (CP) and eastern Pacific (EP) ENSO events, and suggested these impacts are largely of opposite sign for ENSO warm and cold phases. Our results illustrate asymmetrical changes for the cold and warm ENSO events, especially for the La Niña events. Compared to the past frequent basin-wide cooling La Niña events, since the 1980s the cooling center for the La Niña event has strengthened and moved westward along with the increasing frequency for the canonical and CP La Niña events. Contrary to the basin-wide cooling and canonical La Niña events, the frequent CP La Niña events induce significant warming from the Beaufort Sea to Greenland via the convection center moving northward over the western Pacific. Observation analysis and numerical experiments both suggest that the changes in La Niña type may also accelerate Arctic warming.
Considering these positive feedbacks, the Arctic warming or cooling can be triggered by the circulation disturbance, which can be originated from the tropical forcing through atmospheric teleconnections, particular the forcing from the El Niño and Southern Oscillation (ENSO) (Neelin et al., 1998; Lee, 2012; Hu et al., 2016; Timmermann et al., 2018). As a dominant source of global interannual climate variability, ENSO can induce interannual fluctuations in Arctic climate (Bjerknes, 1969; Wyrtki, 1975; Schopf and Suarez, 1988; Jin, 1997). ENSO-associated tropical sea surface temperature anomalies (SSTAs) and latent heat fluxes can excite poleward-propagating atmospheric Rossby waves, then regulate the Arctic climate (Hoskins and Karoly, 1981; Sardeshmukh and Hoskins, 1988; Lee and Yoo, 2014). Previous studies have reported that the El Niño usually coincides with anomalous cooling over the East Siberian Sea, while La Niña often coincides with anomalous warming of the Kara Sea during boreal winter (Lee, 2012).
However, considering the changes in ENSO diversity, these linkages between ENSO and Arctic climate are not stable. In particular, the so-called central Pacific (CP) El Niño events have prevailed since the 1980s, which stimulates a lot of research to be devoted to the changes and impacts of the ENSO diversity (Larkin and Harrison, 2005; Ashok et al., 2007; Zhang et al., 2015, 2019). At present, few studies focus on the relationship between ENSO and Arctic climate from the perspective of ENSO diversity. Recently, two studies have investigated the different impacts of the CP and eastern Pacific (EP) events on the Arctic climate during boreal summer and boreal winter. Hu et al. (2016) indicated that compared to the EP El Niño, the CP El Niño events have an opposite effect on the Arctic, which can inhibit the Arctic warming and sea-ice melting in summer. Li et al. (2019) investigated the different responses of Arctic surface air temperature to EP and CP ENSO types during boreal winter, and they found the EP ENSO events are accompanied by SAT responses over the Barents-Kara seas in February, while the CP events coincide with significant responses over the northeastern Canada and Greenland. And they also concluded that these impacts are largely of opposite sign for ENSO warm and cold phases.
The ENSO flavors are usually monitored by the sea surface temperature anomaly (SSTA) spatial patterns. Our previous studies have indicated that more than only CP and EP ENSO events, ten SSTA spatial patterns are obtained by a novel method, which combines the empirical orthogonal function (EOF) analysis and K-means clustering algorithm (Li et al., 2021). The changes of the warm and cold ENSO events are asymmetrical. And the changes in La Niña seems more distinct. Hence a question arises: Are there any changes of the impacts from the changing La Niña flavors?
To address the question, we identify the ENSO types based on our previous result. Section 2 provides the introduction of the datasets and methods. The changes in ENSO diversity are described in Section 3. The impacts of different La Niña events on the Arctic climate and the underlying mechanisms are investigated in Section 4. Finally, conclusions and discussions are highlighted.
2.
Data and methods
The present study uses monthly sea surface temperature (SSTs) from the Met Office Hadley Centre's sea ice and sea surface temperature (SST) data set version 1 (HadISST1) with a 1°×1° grid (Rayner, 2003) and the National Oceanic and Atmospheric Administration (NOAA) interpolated outgoing longwave radiation (OLR) dataset (Liebmann and Smith, 1996). The OLR available since 1979 represents tropical convection. The atmospheric components are taken from the National Centers for Environmental Prediction/National Center for Atmospheric Research (NCEP/NCAR) reanalysis products (Kalnay et al., 1996). These variables are available from 1948 to the present, with a 2.5°×2.5° horizontal resolution. In addition, a simple dry model named the linear baroclinic model (LBM) was used in our present study to examine the influence of the SSTAs-related convection on the Arctic climate. The LBM employed in this study is a time-dependent model based on primitive equations. The model had a resolution of T42 in the horizontal direction and 20 sigma levels in the vertical direction. More details can be found in Watanabe and Jin (2003).
3.
Changes in ENSO diversity
The ENSO diversity is made up of a rich variety of SSTA patterns among ENSO events. The recent accumulated CP El Niño events have been regarded as a possible harbinger of changes in ENSO due to global warming (Yeh et al., 2009). With the widespread attention to the different ENSO types, several methods have been proposed to identify the SSTA patterns. Besides the CP and EP ENSO events, much more ENSO types are identified via the details of the SSTAs spatial distribution (Ashok et al., 2012; Cai et al., 2014, 2015; Capotondi et al., 2015).
Inspired by these studies, we have proposed a novel method combining the EOF analysis and the K-means clustering method to identify the tropical SSTA flavors. The SSTA fields of all months are reasonably grouped into 10 categories (Li et al., 2021), and the cluster result can be found in Fig. S1. Since the ENSO events usually peak during the boreal winter, we combine the SSTA fields of each category during December, January, and February to illustrate the changes in ENSO diversity.
The composited SSTA spatial patterns during boreal winter are nearly consistent with our previous work (Li et al., 2021). Among the ten categories, three La Niña-like SSTA patterns (cluster 4, cluster 6, and cluster 7) and three El Niño-like patterns (cluster 2, cluster 5, and cluster 9) are contained (Fig. 1). Our current study is mainly focused on these three La Niña type events. Cluster 4 shows a basin-wide cooling spatial pattern, cluster 6 represents the canonical La Niña, and cluster 7 exhibits a typical central Pacific La Niña event. The last two types of La Niña events have a cooling center near the dateline, and the extreme La Niña events usually belong to cluster 6.
Figure
1.
Composited sea surface temperature anomaly (SSTA) spatial distribution for ten clusters in boreal winter month (December, January and February) during 1950−2016, where the dots indicate 95% significance.
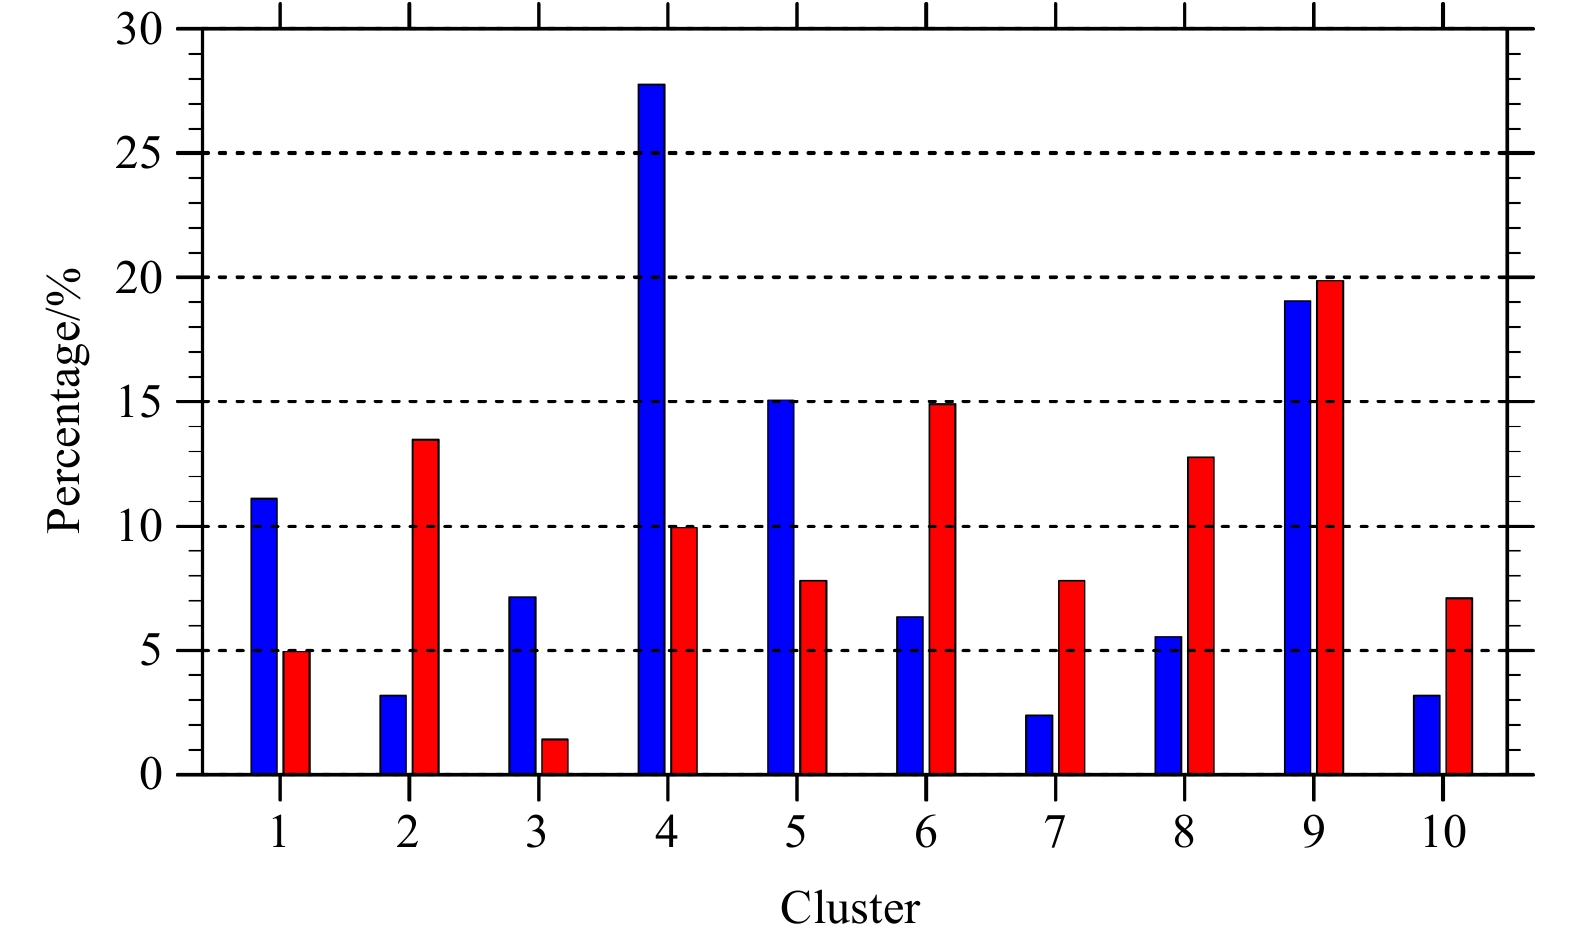
Then to depict the changes of the ENSO diversity clearly, the occurrence frequency differences for different ENSO events are compared before and after 1980 (Fig. 2). Before 1980, the basin-wide cooling event (cluster 4) acts as the dominant cold event with the highest frequency. After 1980, the frequency for this dominant cold event has dropped to a low level. In contrast, the frequencies for the other two kinds of La Niña events with central Pacific cooling have increased, which also supports the westward air-sea interaction center under global warming. Therefore, we will check the different impacts on Arctic climate due to the La Niña type changing.
Figure
2.
The percentage of occurrence frequency (months) of ten clusters respectively in winter (December, January, and February) during 1950−1979 (blue bars) and 1980−2016 (red bars).
4.
Opposite impacts of different La Niña events on Arctic SAT
The ENSO events usually influence the interannual Arctic climate via the poleward-propagating atmospheric Rossby waves (Lee and Yoo, 2014). Therefore, the La Niña-related atmospheric waves are first examined to confirm the physical linkage between ENSO and the Arctic climate.
These three La Niña types all exhibit significant extratropical Rossby wave propagation pathways. The large-scale circulation anomalies (200 hPa geopotential height and wave activity flux) for the three type events are shown in Fig. 3. For the basin-wide cooling events (cluster 4), significant negative height anomalies are evident mainly over the tropics and northern Canada (Fig. 3a). The canonical La Niña events (cluster 6) excite a similar teleconnection pattern (Fig. 3b). Around the Arctic region, significant negative height anomalies extend from the Beaufort Sea to Greenland. In contrast to these two La Niña types, the recent frequent CP La Niña events (cluster 7) triggered positive height anomalies around the Arctic from the Barents-Kara seas to Greenland (Fig. 3c).
Figure
3.
Composited 200 hPa geopotential height anomalies (shading) and the wave activity flux anomalies (black vectors, unit: W/m2) for the events of cluster 4 (a), cluster 6 (b) and cluster 7 (c), respectively, and the dots indicate 95% significance.
Consistent with the opposite anomalous geophysical height anomalies over the Arctic, the low-level temperature anomalies for the recent frequent CP La Niña events (cluster 7) are also opposed to those of the canonical and basin-wide cooling La Niña events (Fig. 4). Both the canonical La Niña events and the basin-wide cooling La Niña events seem to induce anomalous cooling from the Beaufort Sea to Greenland (Figs 4a and b), while the CP La Niña events seem to induce anomalous warming over northern Canada and southern Greenland (Fig. 4c). Since the areas from the Beaufort Sea to Greenland are the key regions for Arctic warming (e.g., Screen and Simmonds, 2010), it seems that in contrast to previous La Niña events, the recent frequent CP cold ENSO events may warm northern Canada and Greenland accelerating Arctic warming.
Figure
4.
Composited temperature anomalies at 925 hPa for the events of cluster 4 (a), cluster 6 (b) and cluster 7 (c), respectively, and the dots indicate 95% significance.
The canonical La Niña-related atmospheric teleconnections are nearly consistent with those of the basin-wide cooling events, and the canonical La Niña events also occur frequently since the 1980s. Considering the limitation of the OLR dataset, the canonical La Niña events and the frequent CP La Niña events are compared to illustrate the changes for the impacts on Arctic climate. Since the tropical ENSO-related convections act as the energy source driving the atmospheric circulation, the changes in these La Niña-related SSTA spatial patterns may change the convection distribution over the tropical Pacific basin, then can trigger different atmospheric teleconnections inducing different Arctic responses.
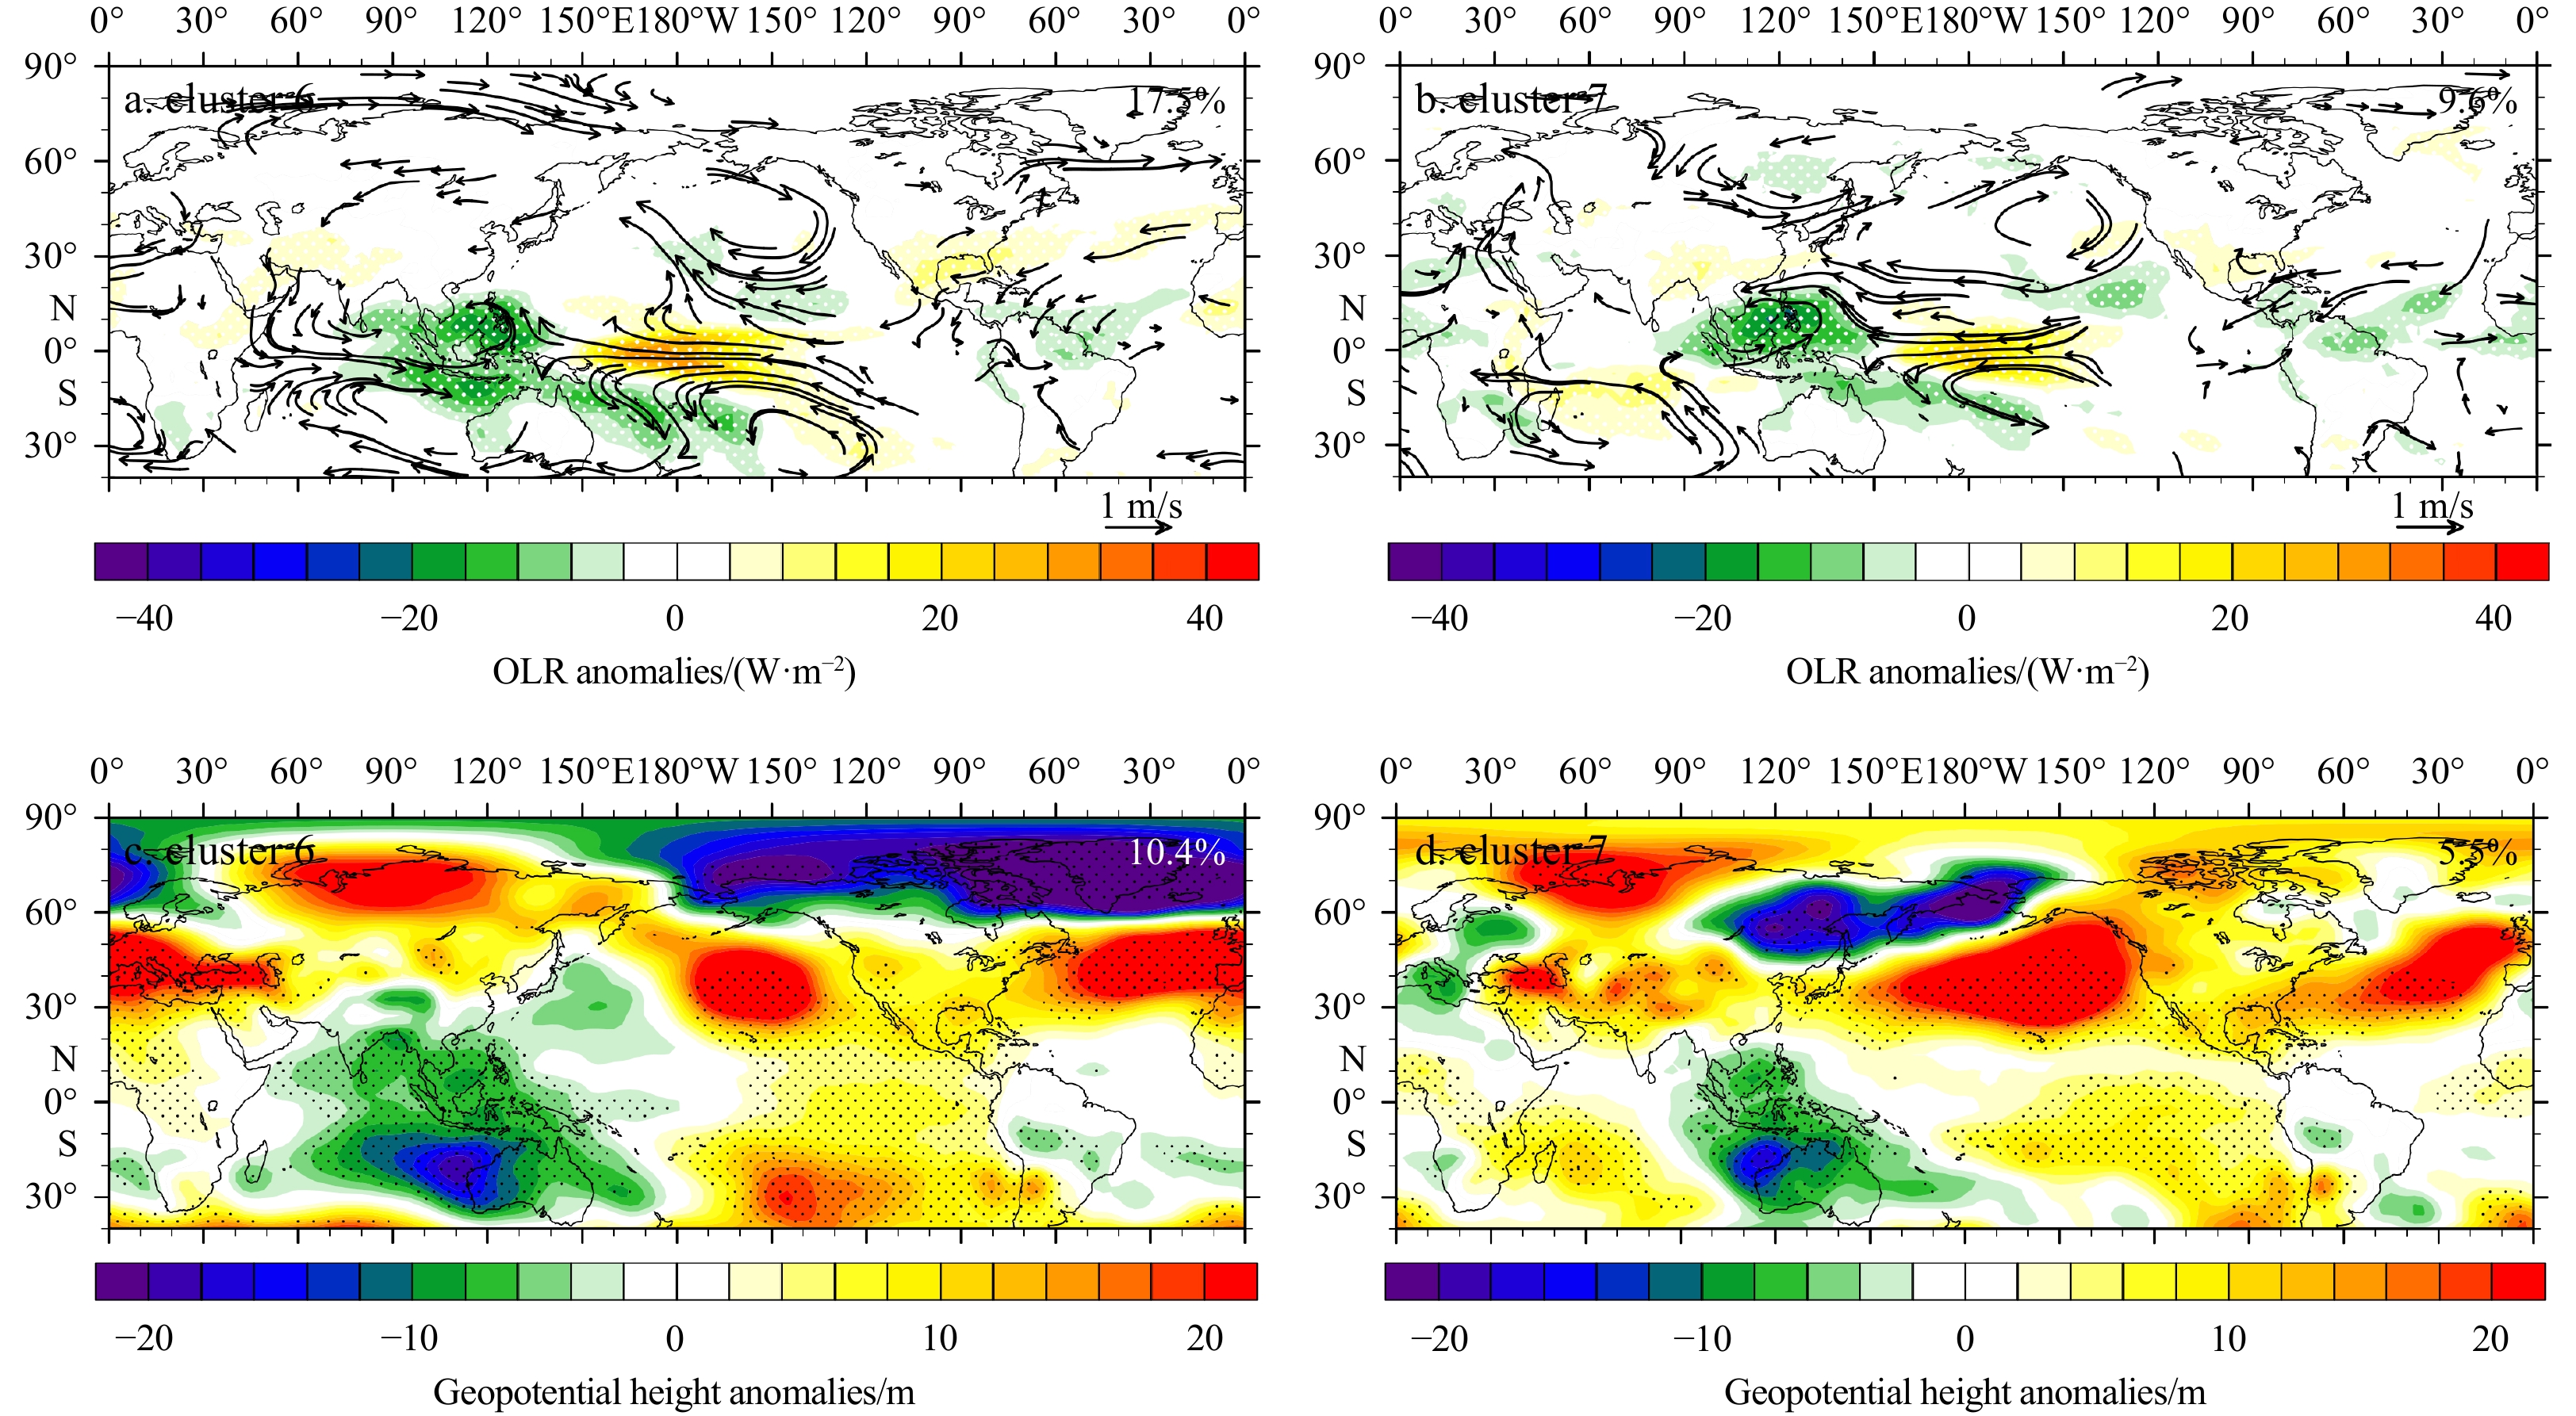
The convection distributions and the low-level circulation for the canonical La Niña events and the CP La Niña events are compared in Fig. 5. A dipole convection pattern in the tropics and strengthened Walker Circulation can be found in both La Niña events, with enhanced convection over the western Pacific and suppressed convection over the eastern Pacific. The enhanced convection distributions over the western Pacific show significant differences for these two La Niña types. The enhanced convections for the canonical La Niña events over the western Pacific are nearly symmetrical about the equator (Fig. 5a), however, the CP La Niña-related enhanced convections are over the north of the equator (Fig. 5b). A typical Matsuno-Gill response can be found for the canonical La Niña events (Fig. 5a), and the related teleconnections to the extratropics are triggered by the enhanced tropical convection, inducing large-scale subsidence within an anticyclone over the northeast Pacific near the Aleutian Islands with positive 850 hPa height anomalies (Fig. 5c). Within the subtropical anticyclones, anomalous upper tropospheric convergence is the most important source of Rossby wave forcing and these waves can eventually propagate to the mid-latitudes and high latitudes (Brands, 2017). On the other hand, the northward enhanced deep convections for the CP La Niña events over the western Pacific induce a basin-wide anticyclone over the North Pacific, which tilts from southwest to northeast (Fig. 5b). The anticyclone related positive 850 hPa height anomalies even extends to Greenland with a negative center over the northeast Asia. In contrast to the induced cooling around the north of Canada by the canonical La Niña events (Fig. 4b), significant warming extends from the Beaufort Sea to Greenland for the frequent CP La Niña events (Fig. 4c), which is related with the positive 850 hPa height anomalies (Fig. 5d). Considering the influences of topography, the composition for the height anomalies at 850 hPa is not statistically significant. However, the compositions at the up levels (Fig. 3c) have passed the significance test, indicating a significant equivalent barotropic feature. The positive height anomalies are corresponding to the surface warming as a result of subsidence.
Figure
5.
Composited outgoing longwave radiation (OLR) anomalies (shading; the dots indicate 95% significance) and anomalous wind at 850 hPa (vector) for the events of cluster 6 (a) and cluster 7 (b), respectively; and composited 850 hPa geopotential height anomalies for cluster 6 (c) and cluster 7 (d), respectively.
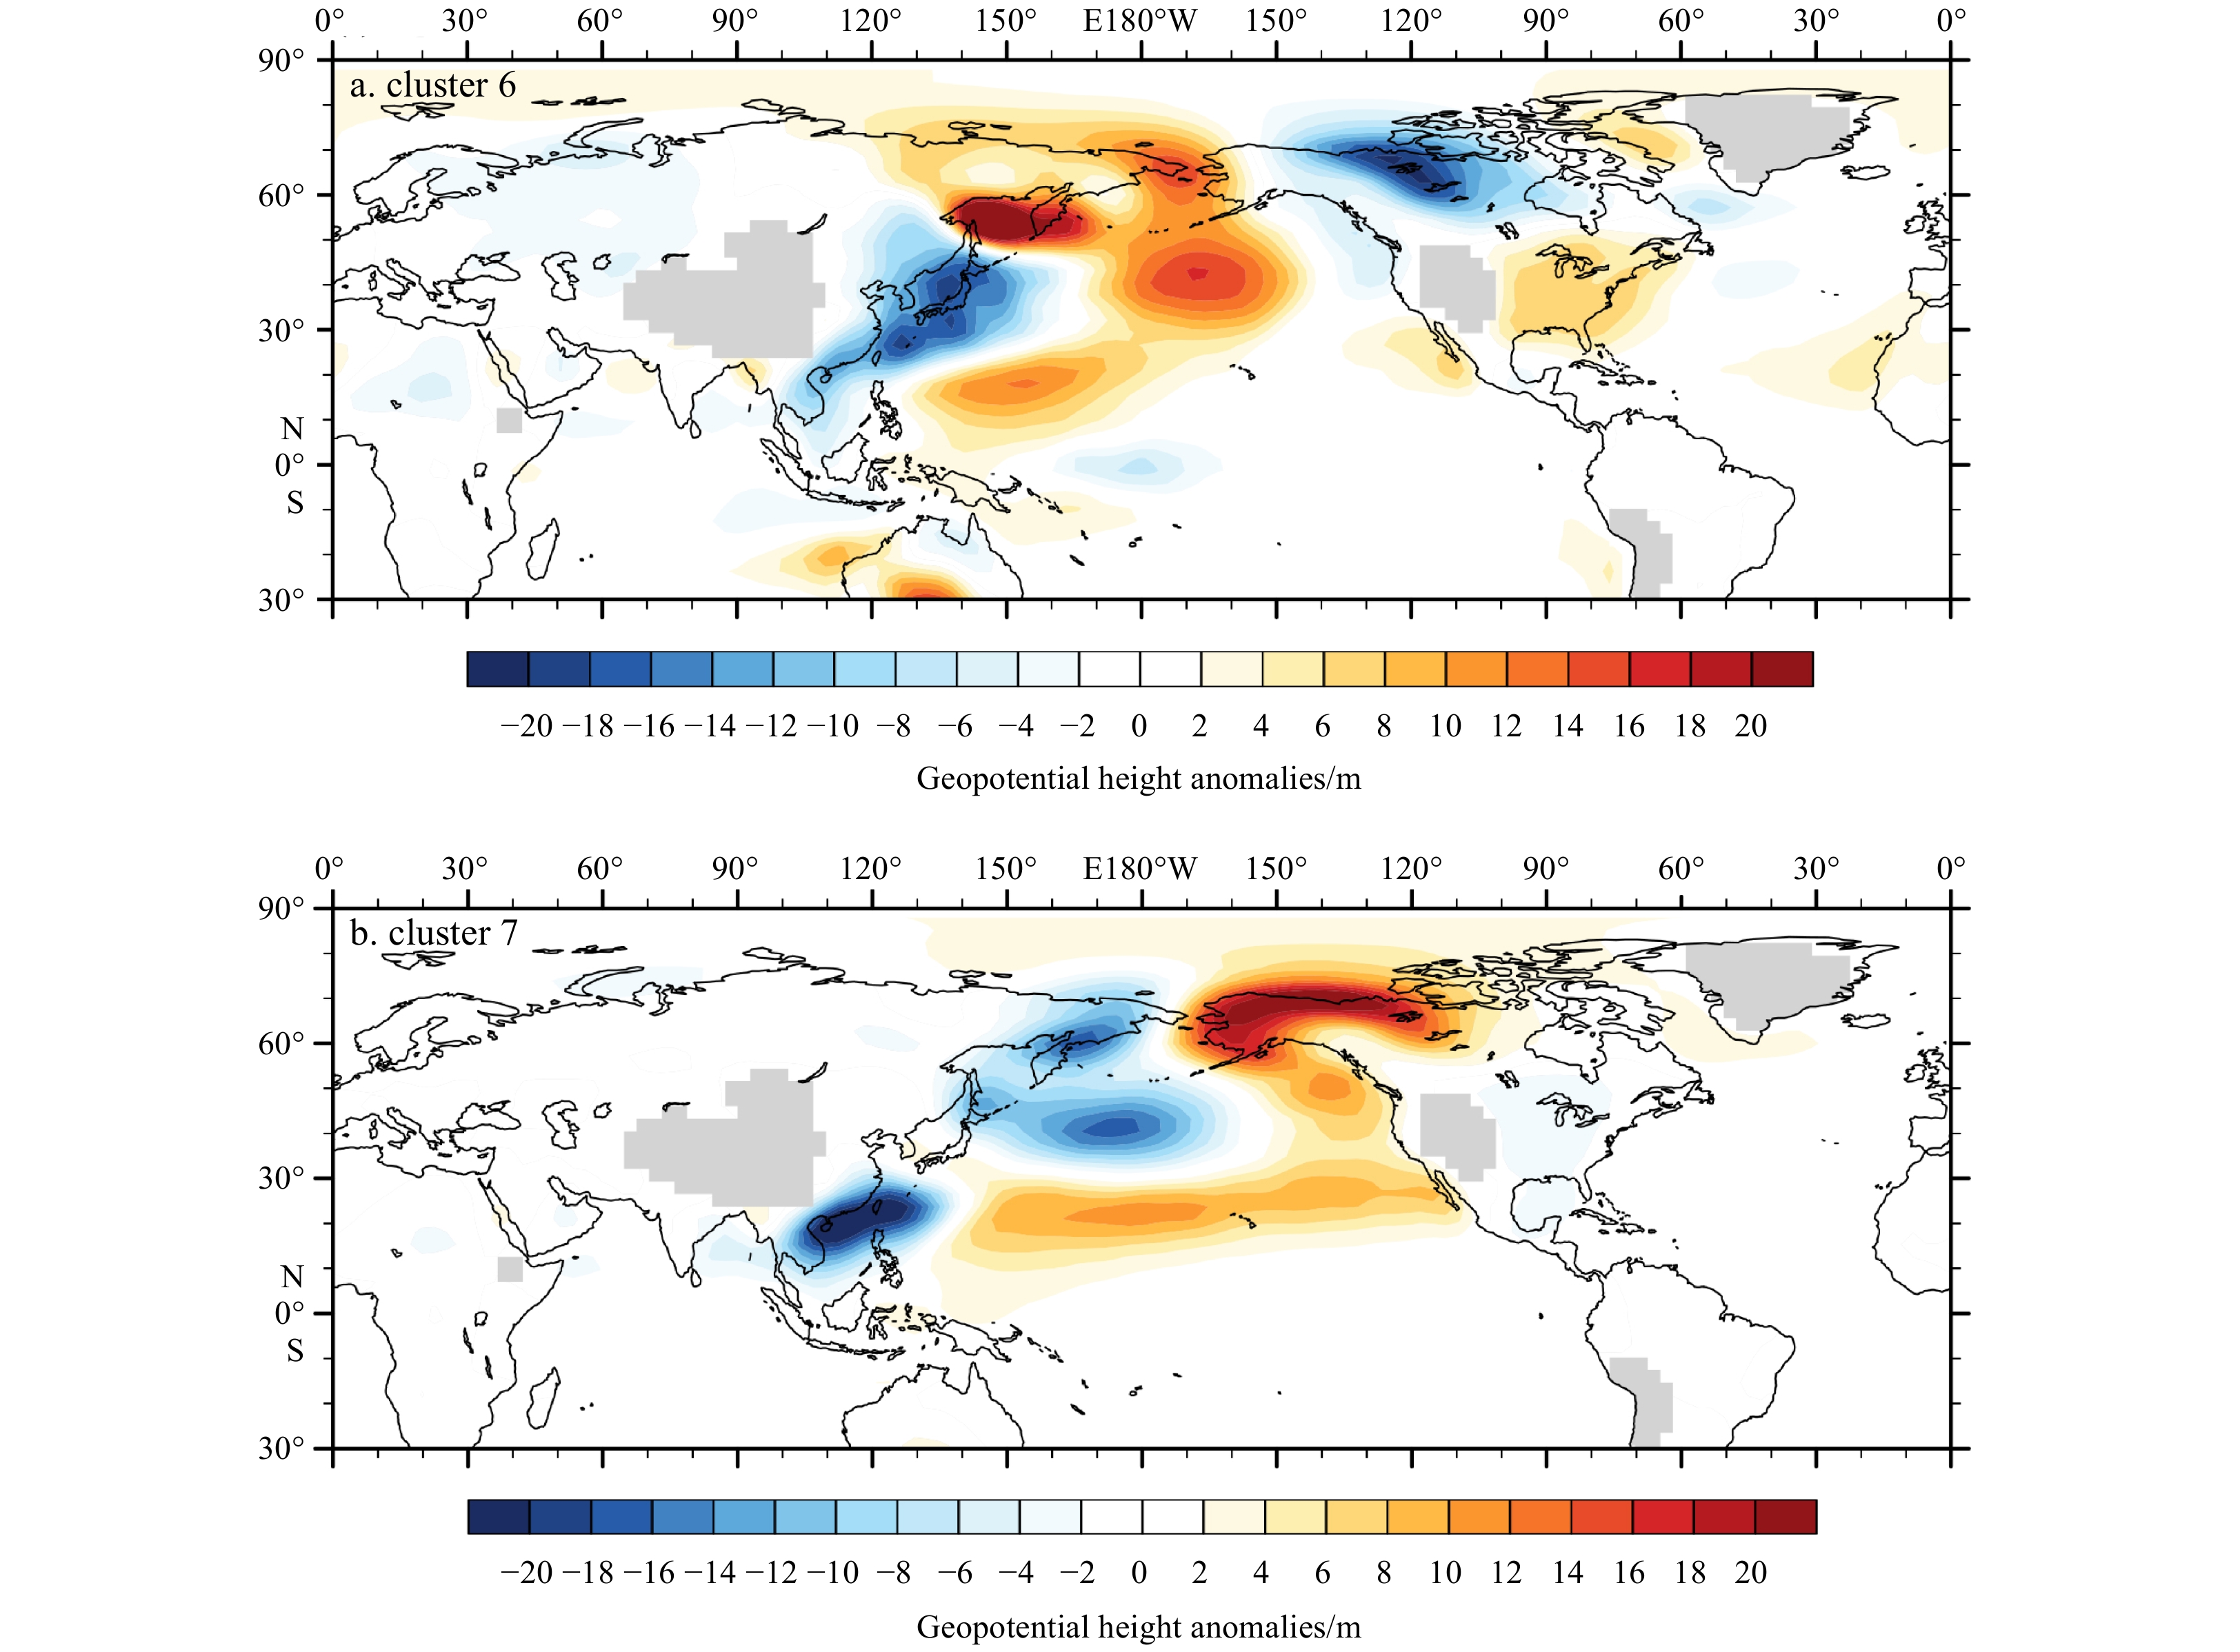
Based on the above analysis, we speculated that the northward deep convections over the western Pacific may change the impacts on the Arctic, particularly from the Beaufort Sea to Greenland. To confirm our hypothesis, two sensitive numerical experiments by the linear baroclinic model (LBM) are carried. Since the convection mainly drives the atmospheric circulation through the diabatic heating, the different elliptical areas of additional heating are added for the sensitive experiments according to the convection distributions of the ENSO events (Fig. S2). In this study, the sensitive numerical experiment is set up according to the convection distributions for the canonical La Niña events and CP La Niña events, respectively (Fig. 6) by changing the location of the sensible heating center (Fig. S2). Results from the experiments support the effectiveness of the northward convections for the CP La Niña events (Fig. 6b). The heating over the north of the equator induces positive 850 hPa height anomalies over the north of Canada, which is opposite to the results induced by the symmetric heating about the equator. Considering the local positive feedbacks over the Arctic, the canonical La Niña events could trigger the north of Canada cooling, while the CP La Niña events can warm northern Canada and part of Greenland through the meridional movement of the convection center.
Figure
6.
Geopotential height anomalies at 850 hPa resulted from heat forcing sensitive experiments that are set according to Figs 4b and c, respectively.
Considering the great impacts of the Arctic amplification, the Arctic climate has received increasing attention under global warming. Meanwhile, ENSO events exhibit considerable diversity in their frequency, location, intensity, and meridional scale. However, few studies investigate the linkage between ENSO and Arctic climate from the perspective of ENSO diversity. The recent studies have investigated the different impacts on Arctic climate of the CP and EP ENSO events and concluded that these impacts are largely of opposite sign for ENSO warm and cold phases. Following our previous results, the changes for the warm and clod ENSO events show significant asymmetrical features, particularly the La Niña events. Therefore, the impacts on the Arctic climate by the changing La Niña types are investigated.
Compared to the past frequent basin-wide cooling La Niña events, since the 1980s the cooling center for the La Niña event has strengthened and moved westward along with the increasing frequency for the canonical and CP La Niña events. The impacts of the recent frequent CP La Niña events induce significant warming from the Beaufort Sea to Greenland, which is opposite to those of the basin-wide cooling and canonical La Niña events and is in favor of the Arctic warming.
In contrast to the other La Niña types, the deep convection centers for the CP La Niña events are located over the north of the equator instead of nearly symmetrical about the equator. The changes in the meridional movement of the ENSO-related convection center cause variations in atmospheric teleconnections inducing different responses in the Arctic via local positive feedbacks, such as the ice-albedo feedback (Budyko, 1969; Sellers, 1969; Hall, 2004; Ogi and Wallace, 2012; Stroeve et al., 2012), water vapor-cloud cover feedbacks (Francis and Hunter, 2006; Abbot and Tziperman, 2008; Kay et al., 2008; Screen and Simmonds, 2010; Ghatak and Miller, 2013) and the local lapse rate feedback (Pithan and Mauritsen, 2014; Stuecker et al., 2018). The observed Arctic responses are also supported by the numerical experiments. The changes in ENSO diversity are suggested to be regulated by changes in the tropical Pacific mean state under global warming. Our results suggest that besides the direct impacts from the greenhouse gas, the changes in La Niña type may also accelerate the Arctic warming.
Abbot D S, Tziperman E. 2008. Sea ice, high-latitude convection, and equable climates. Geophysical Research Letters, 35(3): L03702
[2]
Ashok K, Behera S K, Rao S A, et al. 2007. El Niño Modoki and its possible teleconnection. Journal of Geophysical Research: Oceans, 112: C11007. doi: 10.1029/2006JC003798
[3]
Ashok K, Sabin T P, Swapna P, et al. 2012. Is a global warming signature emerging in the tropical Pacific?. Geophysical Research Letters, 39(2): L02701
Brands S. 2017. Which ENSO teleconnections are robust to internal atmospheric variability?. Geophysical Research Letters, 44(3): 1483–1493. doi: 10.1002/2016GL071529
[6]
Budyko M I. 1969. The effect of solar radiation variations on the climate of the Earth. Tellus, 21(5): 611–619. doi: 10.3402/tellusa.v21i5.10109
[7]
Cai Ming. 2005. Dynamical amplification of polar warming. Geophysical Research Letters, 32: L22710
[8]
Cai Ming. 2006. Dynamical greenhouse-plus feedback and polar warming amplification: Part I. A dry radiative-transportive climate model. Climate Dynamics, 26(7): 661–675
[9]
Cai Wenju, Borlace S, Lengaigne M, et al. 2014. Increasing frequency of extreme El Niño events due to greenhouse warming. Nature Climate Change, 4: 111–116. doi: 10.1038/nclimate2100
[10]
Cai Wenju, Santoso A, Wang Guojian, et al. 2015. ENSO and greenhouse warming. Nature Climate Change, 5(9): 849–859. doi: 10.1038/nclimate2743
[11]
Capotondi A, Wittenberg A T, Newman M, et al. 2015. Understanding ENSO diversity. Bulletin of the American Meteorological Society, 96(6): 921–938. doi: 10.1175/BAMS-D-13-00117.1
[12]
Cohen J. 2016. An observational analysis: Tropical relative to Arctic influence on midlatitude weather in the era of Arctic amplification. Geophysical Research Letters, 43(10): 5287–5294. doi: 10.1002/2016GL069102
[13]
Cohen J, Screen J A, Furtado J C, et al. 2014. Recent Arctic amplification and extreme mid-latitude weather. Nature Geoscience, 7(9): 627–637. doi: 10.1038/ngeo2234
[14]
Coumou D, Di Capua G, Vavrus S, et al. 2018. The influence of Arctic amplification on mid-latitude summer circulation. Nature Communications, 9: 2959. doi: 10.1038/s41467-018-05256-8
[15]
Ding Qinghua, Wallace J M, Battisti D S, et al. 2014. Tropical forcing of the recent rapid Arctic warming in northeastern Canada and Greenland. Nature, 509(7499): 209–212. doi: 10.1038/nature13260
[16]
Francis J A, Hunter E. 2006. New insight into the disappearing Arctic sea ice. Eos, 87(46): 509–511
[17]
Francis J A, Vavrus S J. 2012. Evidence linking Arctic amplification to extreme weather in mid-latitudes. Geophysical Research Letters, 39(6): L06801
[18]
Ghatak D, Miller J. 2013. Implications for Arctic amplification of changes in the strength of the water vapor feedback. Journal of Geophysical Research: Atmospheres, 118(14): 7569–7578. doi: 10.1002/jgrd.50578
[19]
Graversen R G. 2006. Do changes in the midlatitude circulation have any impact on the Arctic surface air temperature trend?. Journal of Climate, 19(20): 5422–5438. doi: 10.1175/JCLI3906.1
Holland M M, Bitz C M. 2003. Polar amplification of climate change in coupled models. Climate Dynamics, 21(3–4): 221–232. doi: 10.1007/s00382-003-0332-6
[22]
Hoskins B J, Karoly D J. 1981. The steady linear response of a spherical atmosphere to thermal and orographic forcing. Journal of the Atmospheric Sciences, 38(6): 1179–1196. doi: 10.1175/1520-0469(1981)038<1179:TSLROA>2.0.CO;2
[23]
Hu Chundi, Yang Song, Wu Qigang, et al. 2016. Shifting El Niño inhibits summer Arctic warming and Arctic sea-ice melting over the Canada Basin. Nature Communications, 7: 11721. doi: 10.1038/ncomms11721
[24]
Huber M. 2008. A hotter greenhouse?. Science, 321(5887): 353–354. doi: 10.1126/science.1161170
[25]
Jin Feifei. 1997. An equatorial ocean recharge paradigm for ENSO: Part I. Conceptual model. Journal of the Atmospheric Sciences, 54(7): 811–829. doi: 10.1175/1520-0469(1997)054<0811:AEORPF>2.0.CO;2
[26]
Kalnay E, Kanamitsu M, Kistler R, et al. 1996. The NCEP/NCAR 40-year reanalysis project. Bulletin of the American Meteorological Society, 77(3): 437–472. doi: 10.1175/1520-0477(1996)077<0437:TNYRP>2.0.CO;2
[27]
Kay J E, L’Ecuyer T, Gettelman A, et al. 2008. The contribution of cloud and radiation anomalies to the 2007 Arctic sea ice extent minimum. Geophysical Research Letters, 35(8): L08503
[28]
Krishnamurti T N, Krishnamurti R, Das S, et al. 2015. A pathway connecting the monsoonal heating to the rapid Arctic ice melt. Journal of the Atmospheric Sciences, 72(1): 5–34. doi: 10.1175/JAS-D-14-0004.1
[29]
Larkin N K, Harrison D E. 2005. On the definition of El Niño and associated seasonal average U.S. weather anomalies. Geophysical Research Letters, 32(13): L13705. doi: 10.1029/2005GL022738
[30]
Lee S. 2012. Testing of the tropically excited arctic warming mechanism (TEAM) with traditional El Niño and La Niña. Journal of Climate, 25(12): 4015–4022. doi: 10.1175/JCLI-D-12-00055.1
[31]
Lee S, Feldstein S, Pollard D, et al. 2011. Do planetary wave dynamics contribute to equable climates?. Journal of Climate, 24(9): 2391–2404. doi: 10.1175/2011JCLI3825.1
[32]
Lee S, Yoo C. 2014. On the causal relationship between poleward heat flux and the equator-to-pole temperature gradient: A cautionary tale. Journal of Climate, 27(17): 6519–6525. doi: 10.1175/JCLI-D-14-00236.1
[33]
Li Jing, Mu Lin, Zhong Linhao. 2021. Distinct tropical Pacific sea surface temperature anomaly regimes enhanced under recent global warming. International Journal of Climatology, 41(2): 970–979. doi: 10.1002/joc.6712
[34]
Li Zhiyu, Zhang Wenjun, Stuecker M F, et al. 2019. Different effects of two ENSO types on arctic surface temperature in boreal winter. Journal of Climate, 32(16): 4943–4961. doi: 10.1175/JCLI-D-18-0761.1
[35]
Liebmann B, Smith C A. 1996. Description of a complete (Interpolated) outgoing longwave radiation dataset. Bulletin of the American Meteorological Society, 77(6): 1275–1277
[36]
Lu Jianhua, Cai Ming. 2010. Quantifying contributions to polar warming amplification in an idealized coupled general circulation model. Climate Dynamics, 34(5): 669–687. doi: 10.1007/s00382-009-0673-x
[37]
Neelin J D, Battisti D S, Hirst A C, et al. 1998. ENSO theory. Journal of Geophysical Research: Oceans, 103(C7): 14261–14290. doi: 10.1029/97JC03424
[38]
Ogi M, Wallace J M. 2012. The role of summer surface wind anomalies in the summer Arctic sea ice extent in 2010 and 2011. Geophysical Research Letters, 39: L09704
[39]
Overland J E, Dethloff K, Francis J A, et al. 2016. Nonlinear response of mid-latitude weather to the changing Arctic. Nature Climate Change, 6(11): 992–999. doi: 10.1038/nclimate3121
[40]
Overland J E, Wang Muyin. 2010. Large-scale atmospheric circulation changes are associated with the recent loss of Arctic sea ice. Tellus A: Dynamic Meteorology and Oceanography, 62(1): 1–9. doi: 10.1111/j.1600-0870.2009.00421.x
[41]
Overland J E, Wood K R, Wang Muyin. 2011. Warm Arctic-cold continents: Climate impacts of the newly open Arctic sea. Polar Research, 30: 15787. doi: 10.3402/polar.v30i0.15787
[42]
Pithan F, Mauritsen T. 2014. Arctic amplification dominated by temperature feedbacks in contemporary climate models. Nature Geoscience, 7(3): 181–184. doi: 10.1038/ngeo2071
[43]
Rayner A N, Parker D E, Horton E B, et al. 2003. Global analyses of sea surface temperature, sea ice, and night marine air temperature since the late nineteenth century. Journal of Geophysical Research: Atmospheres, 108(D14): 4407. doi: 10.1029/2002JD002670
[44]
Sardeshmukh P D, Hoskins B J. 1988. The generation of global rotational flow by steady idealized tropical divergence. Journal of the Atmospheric Sciences, 45(7): 1228–1251. doi: 10.1175/1520-0469(1988)045<1228:TGOGRF>2.0.CO;2
Screen J A, Simmonds I. 2010. The central role of diminishing sea ice in recent Arctic temperature amplification. Nature, 464(7293): 1334–1337. doi: 10.1038/nature09051
[47]
Sellers W D. 1969. A global climatic model based on the energy balance of the earth-atmosphere system. Journal of Applied Meteorology and Climatology, 8(3): 392–400. doi: 10.1175/1520-0450(1969)008<0392:AGCMBO>2.0.CO;2
[48]
Serreze M C, Barry R G. 2011. Processes and impacts of Arctic amplification: A research synthesis. Global and Planetary Change, 77(1–2): 85–96. doi: 10.1016/j.gloplacha.2011.03.004
[49]
Spicer R A, Ahlberg A, Herman A B, et al. 2008. The Late Cretaceous continental interior of Siberia: A challenge for climate models. Earth & Planetary Science Letters, 267(1–2): 228–235
[50]
Stroeve J C, Serreze M C, Holland M M, et al. 2012. The Arctic’s rapidly shrinking sea ice cover: a research synthesis. Climatic Change, 110(3-4): 1005–1027. doi: 10.1007/s10584-011-0101-1
[51]
Stuecker M F, Bitz C M, Armour K C, et al. 2018. Polar amplification dominated by local forcing and feedbacks. Nature Climate Change, 8(12): 1076–1081. doi: 10.1038/s41558-018-0339-y
[52]
Timmermann A, An S I, Kug J S, et al. 2018. El Niño-Southern Oscillation complexity. Nature, 559(7715): 535–545. doi: 10.1038/s41586-018-0252-6
[53]
Watanabe M, Jin Feifei. 2003. A moist linear baroclinic model: Coupled dynamical-convective response to El Niño. Journal of Climate, 16(8): 1121–1139. doi: 10.1175/1520-0442(2003)16<1121:AMLBMC>2.0.CO;2
Wyrtki K. 1975. El Niño—The dynamic response of the equatorial Pacific Ocean to atmospheric forcing. Journal of Physical Oceanography, 5(4): 572–584. doi: 10.1175/1520-0485(1975)005<0572:ENTDRO>2.0.CO;2
[56]
Yeh S W, Kug J S, Dewitte B, et al. 2009. El Niño in a changing climate. Nature, 461(7263): 511–514. doi: 10.1038/nature08316
[57]
Zhang Wenjun, Wang Ziqi, Stuecker M F, et al. 2019. Impact of ENSO longitudinal position on teleconnections to the NAO. Climate Dynamics, 52(1–2): 257–274. doi: 10.1007/s00382-018-4135-1
[58]
Zhang Wenjun, Wang Lei, Xiang Baoqiang, et al. 2015. Impacts of two types of La Niña on the NAO during boreal winter. Climate Dynamics, 44(5–6): 1351–1366. doi: 10.1007/s00382-014-2155-z
Jing Li, Lin Mu, Linhao Zhong. Frequent central Pacific La Niña events may accelerate Arctic warming since the 1980s[J]. Acta Oceanologica Sinica, 2021, 40(11): 62-69. doi: 10.1007/s13131-021/1843-x
Jing Li, Lin Mu, Linhao Zhong. Frequent central Pacific La Niña events may accelerate Arctic warming since the 1980s[J]. Acta Oceanologica Sinica, 2021, 40(11): 62-69. doi: 10.1007/s13131-021/1843-x
Figure 1. Composited sea surface temperature anomaly (SSTA) spatial distribution for ten clusters in boreal winter month (December, January and February) during 1950−2016, where the dots indicate 95% significance.
Figure 2. The percentage of occurrence frequency (months) of ten clusters respectively in winter (December, January, and February) during 1950−1979 (blue bars) and 1980−2016 (red bars).
Figure 3. Composited 200 hPa geopotential height anomalies (shading) and the wave activity flux anomalies (black vectors, unit: W/m2) for the events of cluster 4 (a), cluster 6 (b) and cluster 7 (c), respectively, and the dots indicate 95% significance.
Figure 4. Composited temperature anomalies at 925 hPa for the events of cluster 4 (a), cluster 6 (b) and cluster 7 (c), respectively, and the dots indicate 95% significance.
Figure 5. Composited outgoing longwave radiation (OLR) anomalies (shading; the dots indicate 95% significance) and anomalous wind at 850 hPa (vector) for the events of cluster 6 (a) and cluster 7 (b), respectively; and composited 850 hPa geopotential height anomalies for cluster 6 (c) and cluster 7 (d), respectively.
Figure 6. Geopotential height anomalies at 850 hPa resulted from heat forcing sensitive experiments that are set according to Figs 4b and c, respectively.


 DownLoad: