Jian Zheng, Tianxiang Gao, Yunrong Yan, Na Song. Genetic variation of the small yellow croaker (Larimichthys polyactis) inferred from mitochondrial DNA provides novel insight into the fluctuation of resources[J]. Acta Oceanologica Sinica, 2022, 41(11): 88-95. doi: 10.1007/s13131-022-2039-8
Citation:
Jian Zheng, Tianxiang Gao, Yunrong Yan, Na Song. Genetic variation of the small yellow croaker (Larimichthyspolyactis) inferred from mitochondrial DNA provides novel insight into the fluctuation of resources[J]. Acta Oceanologica Sinica, 2022, 41(11): 88-95. doi: 10.1007/s13131-022-2039-8
Genetic variation of the small yellow croaker (Larimichthyspolyactis) inferred from mitochondrial DNA provides novel insight into the fluctuation of resources
The small yellow croaker (Larimichthys polyactis) belongs to the family Sciaenidae, which is an offshore warm fish species and widely distributed in the western Pacific. In this study, the variation of genetic diversity and genetic differentiation among L. polyactis populations was analyzed by mitochondrial DNA control region. A total of 110 polymorphic sites were checked, which defined 134 haplotypes. High level of haplotype diversity (h=0.993±0.002) was detected in the examined range. Population genetic structure analyse (analysis of molecular variance, Fst) showed there were high gene flow among L. polyactis populations. The result showed that there were relatively high genetic diversity and low genetic differentiation among the Yellow Sea and the East China Sea populations, which can be attributed to diverse habitats, wide distribution range and high mutation rate of control region. Using phylogenetic methods, coalescent analyses (neutrality tests, mismatch distribution analysis, Bayesian skyline analyses) and molecular dating interpreted in conjunction with paleoclimatic and physiographic evidence, we inferred that the genetic make-up of extant populations of L. polyactis was shaped by Pleistocene environmental impacts on the historical demography of this species. Besides, relatively constant genetic diversity and larger effective population size were detected in recent L. polyactis population. The result showed that the fishing policy certainly, such as the summer closed fishing, played a role in protecting resources of L. polyactis. This study can offer a wealth of biological novelties which indicates genetic structure of L. polyactis population and provides the foundation for resources protection and policy setting.
The small yellow croaker, Larimichthys polyactis, is an economic fish of the order Perciformes, mainly inhabiting estuaries and coastal waters (Wu et al., 2012; Xiao et al., 2009). It is known as famous seafood product in China, Japan, D. P. R. Korea and R. O. Korea (Zhang and Cheng, 2005). Since the 1950s, however, the resources and catch of L. polyactis have undergone huge fluctuations. In the 1950s, L. polyactis was in the fishery boom period, whose average annual production could reach 120 000 t. However, in the 1960s and 1970s, it has gradually decreased due to overfishing. With the continuous increase of fishing pressure, the resource of much marine fish has declined severely in the 1980s. Some protection policies have been developed to protect the fish stock since the 1990s (Lin et al., 2008), playing a key role in the recovery of L. polyactis resources, which have kept its market landing at a high level in recent years (Lin et al, 2011, Han et al., 2019). However, the individual miniaturization younger-age trend of L. polyactis is becoming more and more serious (Tang and Zhou, 1999). To adapt to the environment and fishing pressure, the following changes have been detected: the generation time of the species has shortened from 6 years old to 2 years old, the distribution area of the spawning stock has extended, the environmental characteristics of the spawning have ground changed obviously, the relative individual fecundity has increased significantly, and the egg diameter have decreased (Lin et al., 2009). To protect and fully utilize the resources of L. polyactis, many researchers have focused on the studies of its resources (Lin and Cheng, 2004), physiology (Zheng et al., 2020), biology (Xu and Cheng, 2009) and morphology (Lin et al., 2010).
The summer closed fishing in China was formulated based on the study of fish stock (Chen et al., 2009). This policy certainly played a role on protecting resources of L. polyactis. However, L. polyactis spawns before May, and the fishing targets were reported to almost be young individuals, which indicated it may suffer overfishing before the 4-month moratorium (Yan et al., 2019). Besides, because of high fishing stress after the open of fishing, the conservation effect accumulated in summer was almost exhausted (Lin and Cheng, 2004).
Genetic diversity is an important component of biodiversity, and could generally reflect effective population size of species (Giovannoni et al., 1990). High genetic diversity within species usually suggested a large population size and can provide its evolutionary potential for long-term survival. Some studies have analyzed the genetic diversity of L. polyactis populations collected a dozen years ago based on different markers such as random amplified polymorphic DNA (RAPD), amplified fragment length polymorphism (AFLP) and mitochondrial DNA (Meng et al., 2003; Han et al., 2009; Xiao et al., 2009; Kim et al., 2012; Li et al., 2013). However, since L. polyactis populations continued to be under high fishing pressure, it is necessary to analyze its current genetic diversity status.
Molecular markers, important method for studying the mechanism of resource restoration, have been used widely in research of L. polyactis. Mitochondrial DNA (mtDNA) is a type of molecular marker which can give insights into contemporary levels of gene flow (Moritz et al., 1987). The control region of the mtDNA has the fastest mutation rate, and it has been widely used in conservation genetics and population genetics because of the characteristics of clear mechanism, simple structures and low molecular weights (Wirgin et al., 2000; Tokuyama et al., 2020). In this study, we analyzed the genetic diversity and genetic differentiation of L. polyactis based on mitochondria DNA control region. This work, in addition to offering a wealth of biological novelties which can indicate genetic structure of L. polyactis populations, also can provide the foundation for resources protection and policy setting.
2.
Materials and methods
2.1
Study area and sampling
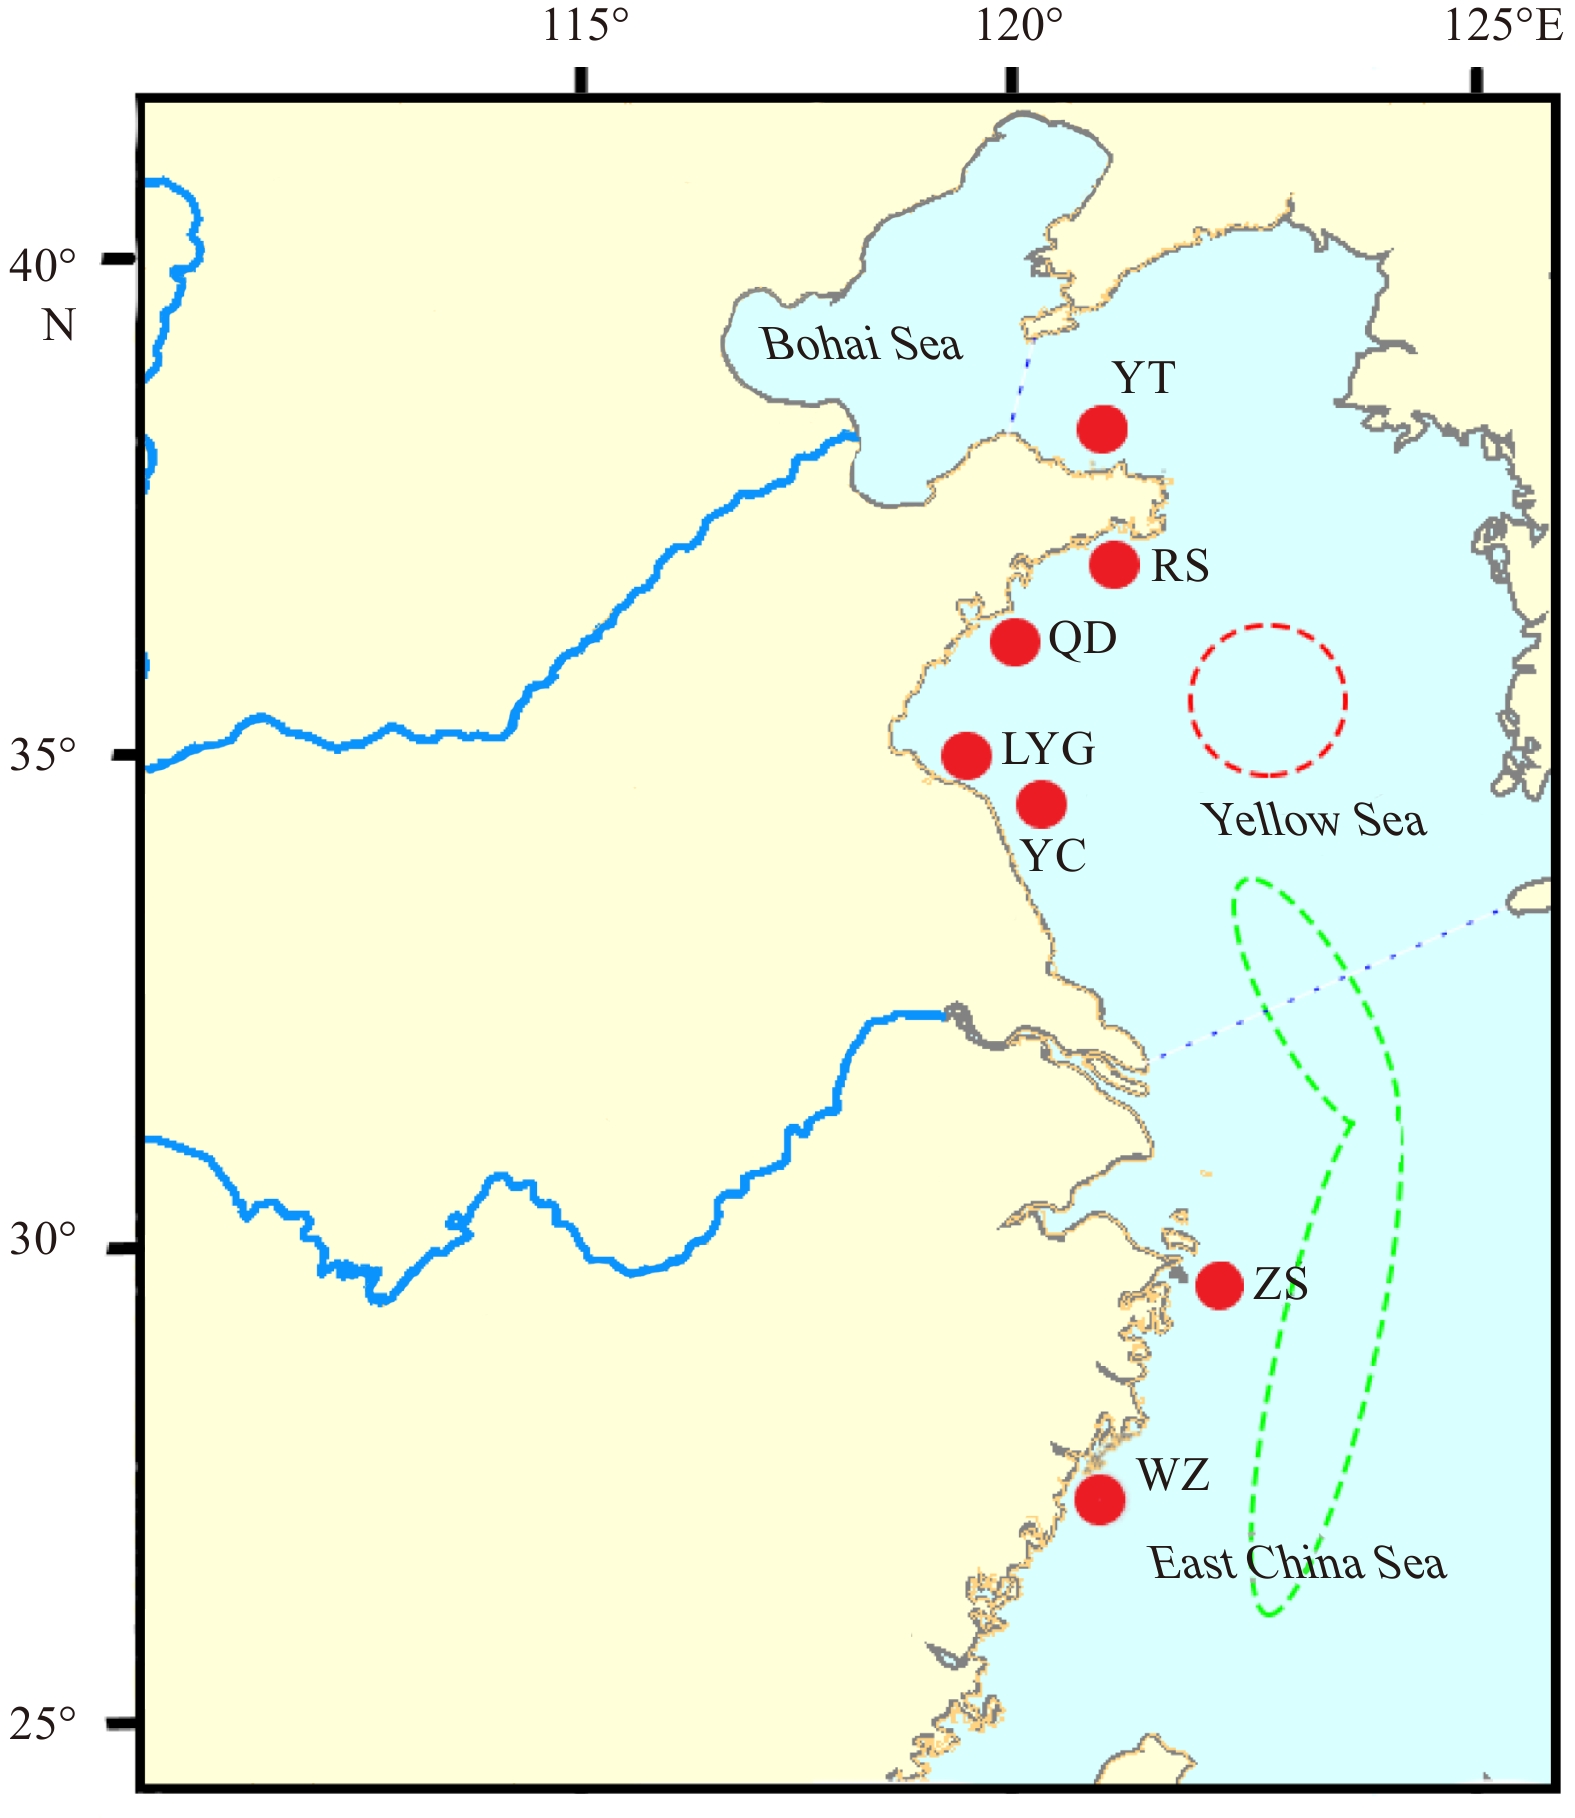
A total of 168 L. polyactis specimens collected from 7 sites (the Yellow Sea: YT, RS, QD, LYG, YC; the East China Sea: ZS, WZ) were used in this study (Fig. 1, Table 1). The muscle tissue of these individuals was stored in alcohol for total genomic DNA extraction using phenol/chloroform method (Sambrook et al., 1989).
Figure
1.
Sampling sites of Larimichthys polyactis. The dashed red circle represents the North Yellow Sea and Bohai Sea overwintering group, and the dashed green circle represents the South Yellow Sea and East China Sea overwintering group (Xu and Cheng, 2009).
2.2
Polymerase Chain Reaction (PCR) and sequencing
The primers were designed to amplify the fragment of the mtDNA control region in this study were F2-CGGACGTCGGGGGTTAAAT and R2- ATGGGGAGCAACCACAAGAA. The PCR was performed in A300 Fast Thermal Cycler (LongGene Scientific Instruments Co., Ltd., China). PCR amplifications were carried out in volume of 25 μL, the reaction system containing deionized water (17.35 µL), dNTPs (2 µL, 10 mmol/L), 10×PCR buffer (2.5 µL, 10 mmol/L Tris–HCl pH 8.3, 50 mmol/L KCl, 1.5 mmol/L MgCl2), forward and reverse primers (1 µL, respectively), Taq polymerase (0.15 µL), DNA template (1 µL). The amplification conditions as follows: 5 min denaturation at 94°C, 38 alternating cycles of 45 s at pre-denaturation 5 min (95°C), denaturation 45 s (94°C), annealing 45 s (50°C), extension 45 s (72°C), 38 cycles and extension 10 min (72°C). The amplification products were detected by 1% agarose gel electrophoresis. The products were sequenced commercially by Tsingke Biotech Co., Ltd. (China). All samples were sequenced with both directions to ensure the accuracy of these fragments.
2.3
Data analysis
DNASTAR software was used to align and edit all sequences (DNASTAR Inc., USA). Haplotypes based on sequence were obtained using DnaSP v.5.0 (Librado and Rozas, 2009). Phylogenetic relationships based on haplotypes were analyzed by MEGA v.5.0 (Tamura et al., 2011). Genetic diversity index such as polymorphic sites, nucleotide diversity (π), haplotype diversity (h) (Nei, 1987) was calculated using ARLEQUIN v.3.0 (Excoffier et al., 2007). The D test of Tajima and the Fs test of Fu indicating population demographic expansion condition were also carried out by ARLEQUIN v.3.0 (Tajima, 1989; Fu, 1997). Mismatch distribution analysis and neutrality tests were used to examine the historical dynamic of L. polyactis. F-statistics (Fst) and molecular variance (AMOVA) with Kimura-2-parameters model of substitution were calculated in ARLEQUIN v.3.0 in order to evaluate population structure (Kimura, 1980; Weir and Cockerham, 1984; Excoffier et al., 1992).
The effective population size was estimated using Lamarc v.2.0 (Kuhner, 2006). The parameter θ (θ=2Neμ, where Ne was the effective population size, μ was the mutation rate) which indicated the effective population size of each population was estimated by Lamarc v.2.0 (Kuhner, 2006; Felsenstein et al., 1999). This software was also used to calculate gene flow (M=m/μ, m was migration rate) and parameter g of growth rate.
The Bayesian skyline plot (BSP) was generated with BEAST v.2.3.0 (Bouckaert et al., 2014) and Tracer v.1.7.1 (Rambaut et al., 2018). The strict molecular clock and stepwise skyline were selected as a model, and the sequence divergence rate for the control region of L. polyactis was approximately set to 3%−12% every million years.
3.
Results
3.1
Sequence variation and genetic differentiation of L. polyactis
A total of 447-bp control region sequences were obtained for 168 samples from 7 geographic populations. There were 110 polymorphic sites, which defined 75 substitutions consisting of 74 transitions and 22 transversions. The average base composition content was 27.5% for A, 14.4% for C, 22.3% for G, 35.8% for T. The number of haplotypes was 134, which was more than the number of polymorphic sites, indicating that there was strong homoplasy among populations of L. polyactis. The diversity indices of each population were shown in Table 1. Besides, we analyzed the genetic diversity of the control region sequences of L. polyactis collected from the Yellow Sea (Qingdao) and the East China Sea (Zhoushan) based on the previous studies. The result showed that genetic diversity of two sites remained relatively constant in the present study compared with previous data (Table S1)
3.2
Phylogenetic relationships and population genetic structure
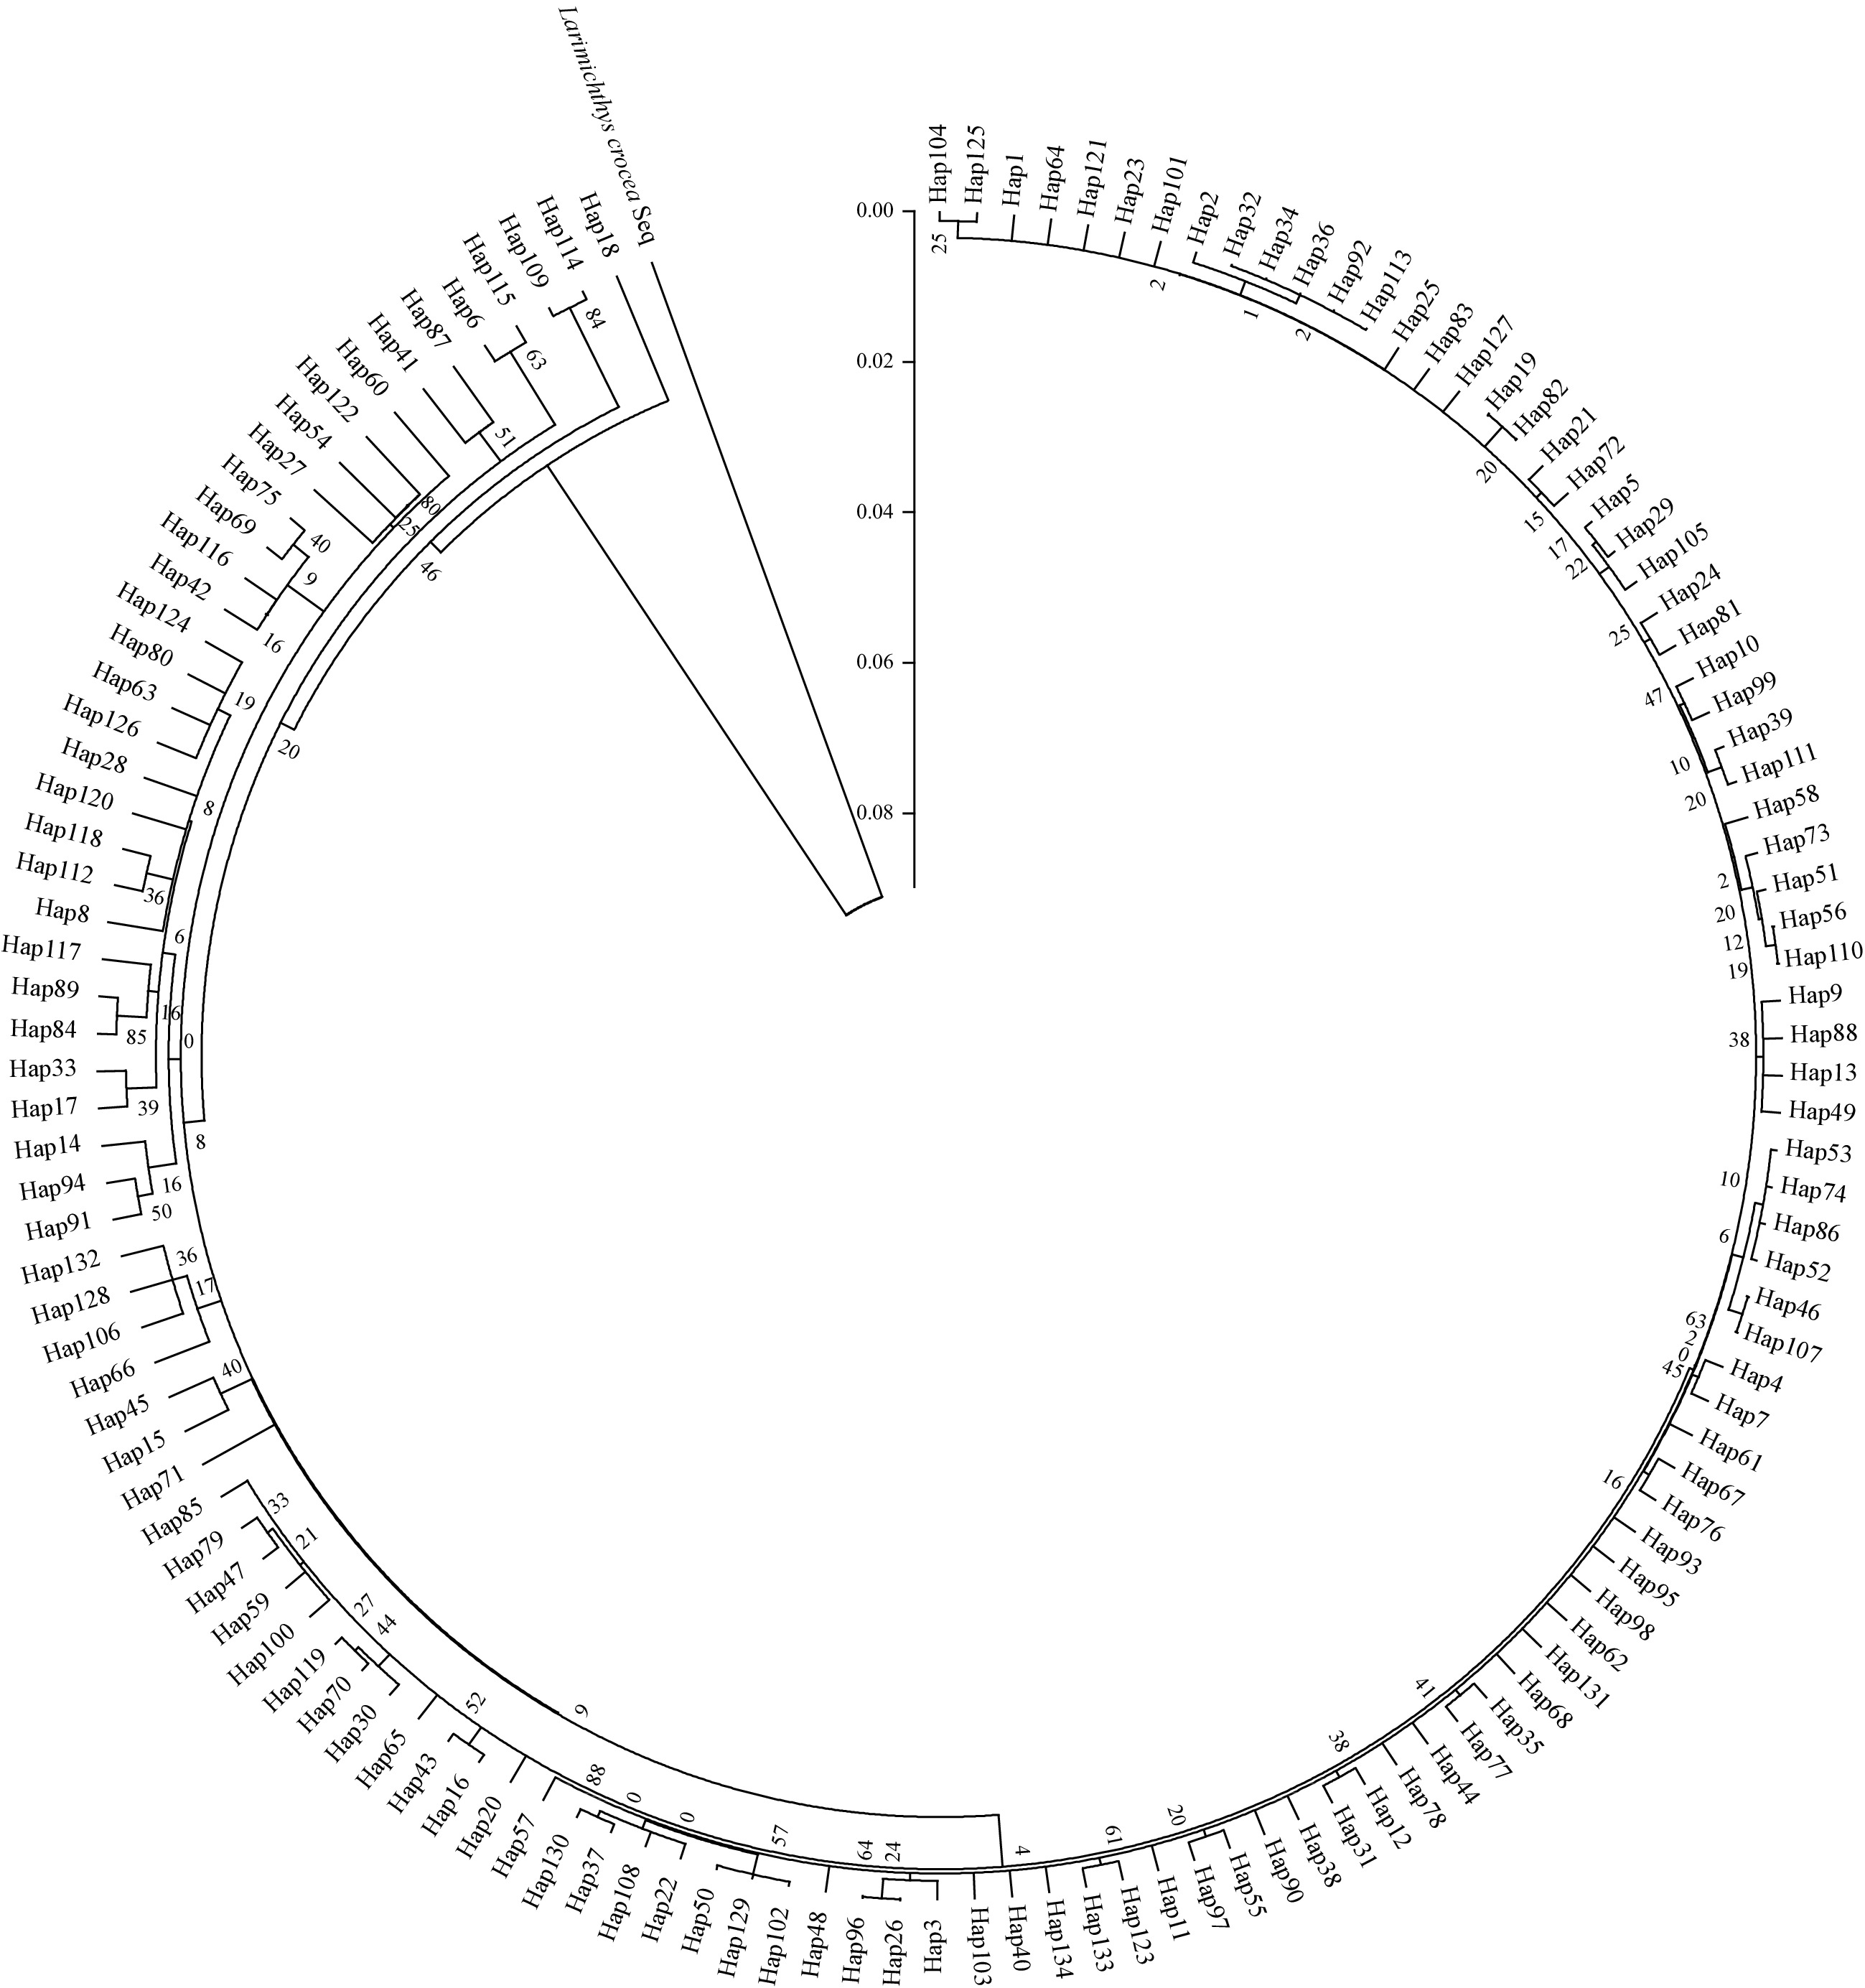
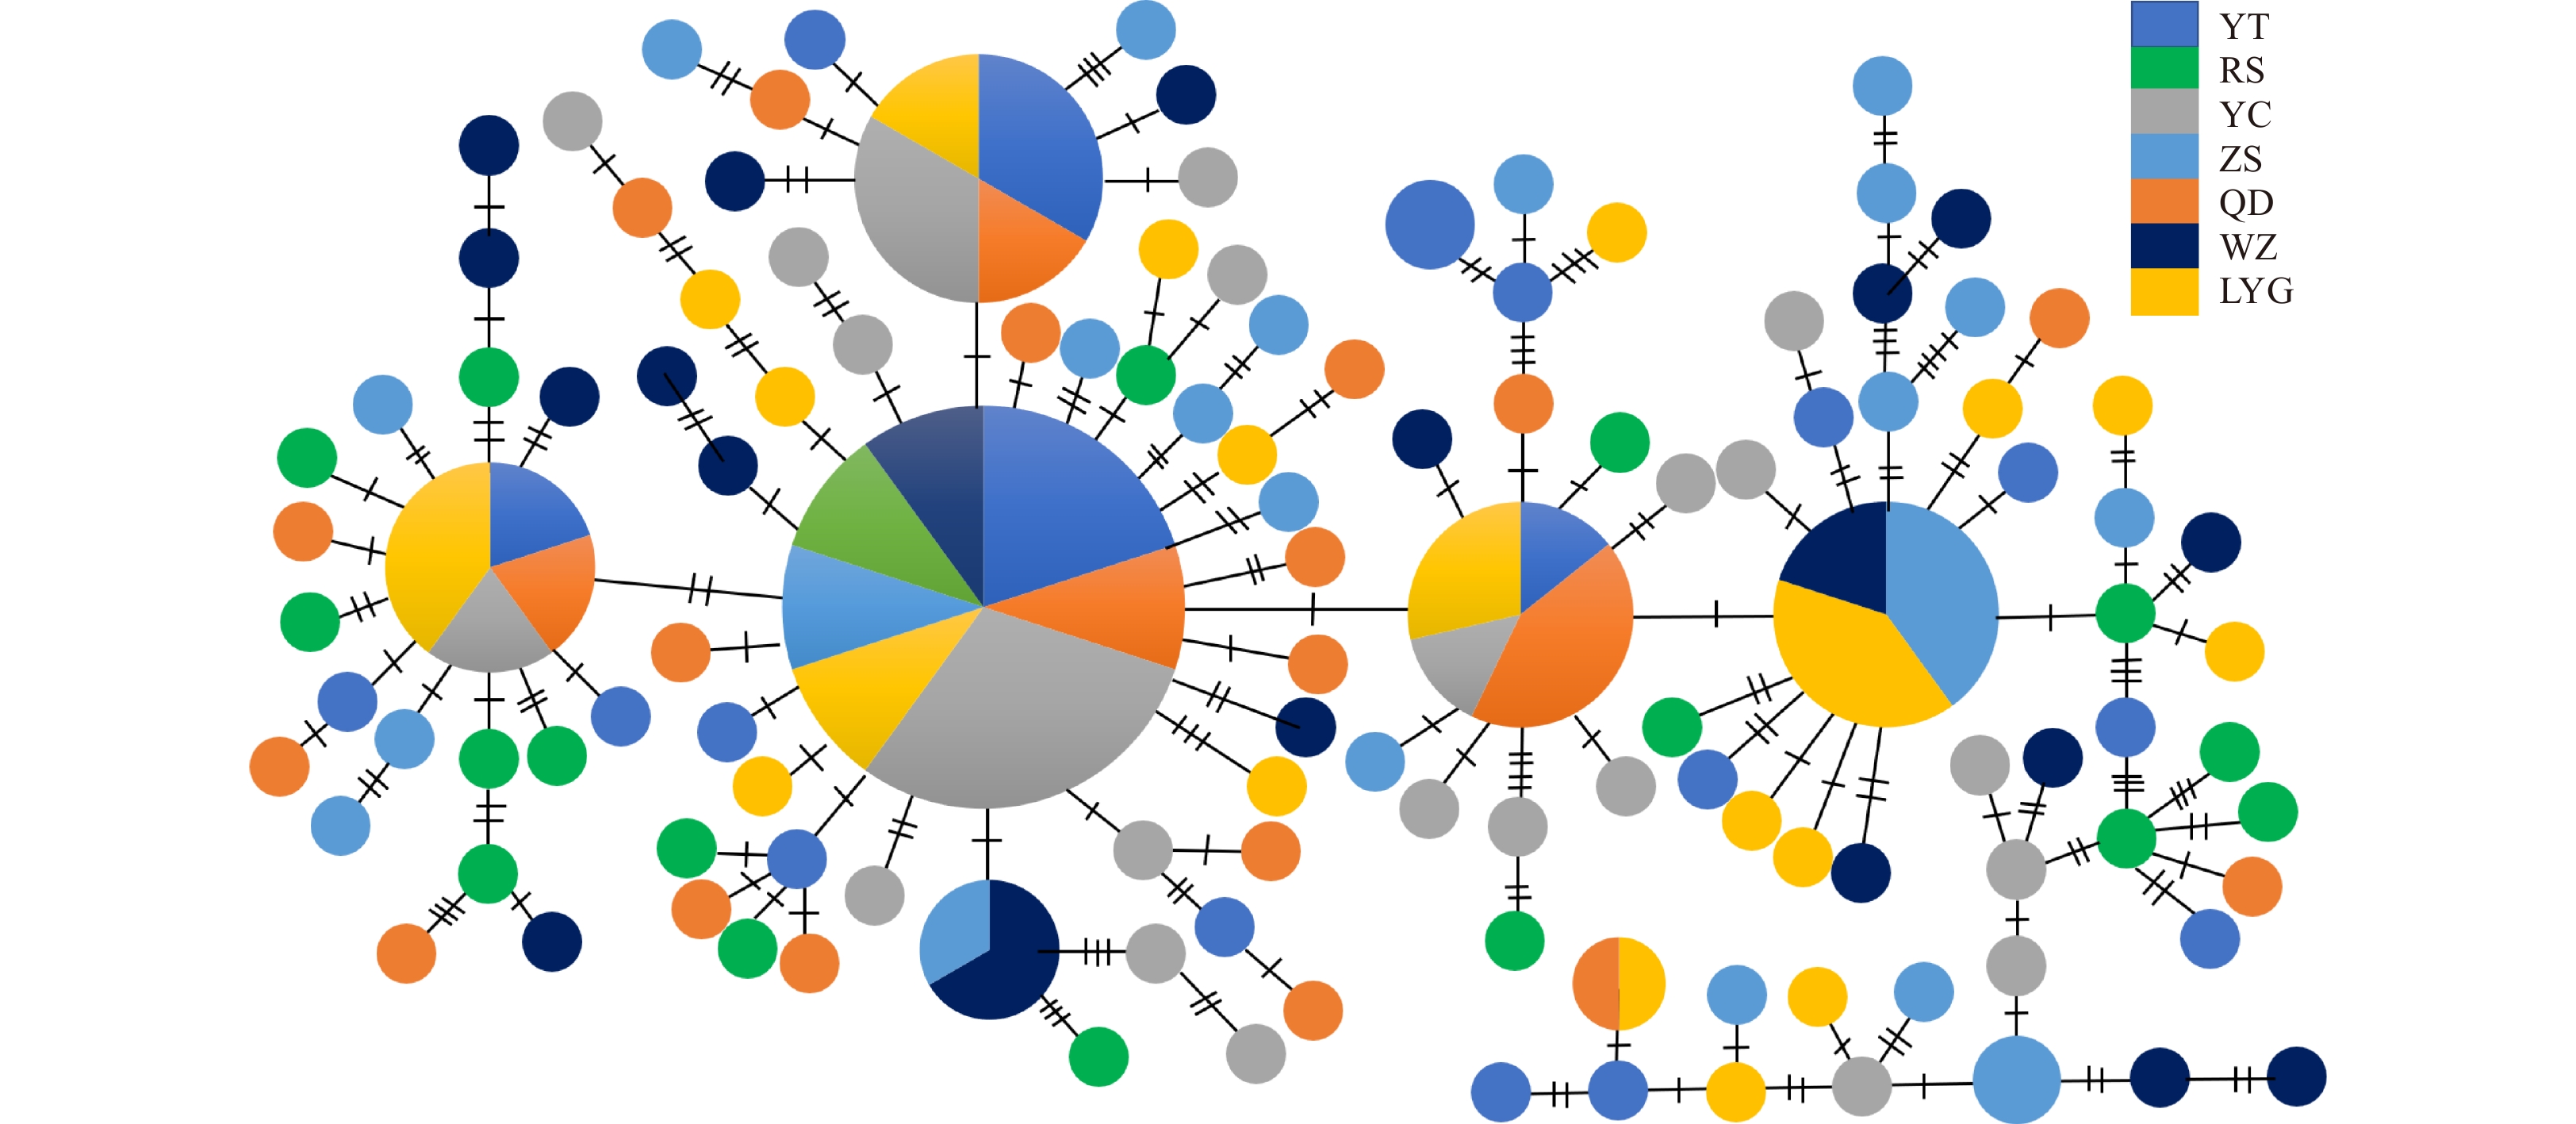
Clustering analysis of control region haplotypes was conducted by Neighbor-Joining method. The Neighbor-Joining tree was constructed using Larimichthys crocea as outgroup. From the tree topologies, we concluded that no obvious genealogical branch and geographical structure were found in control region haplotypes of 7 geographic populations, and haplotypes were scattered throughout the tree (Fig. 2). This result was further supported by the haplotype network (Fig. 3). The starburst structure also suggested a very recent origin for most haplotypes.
Figure
2.
The phylogenetic analyzes for Larimichthys polyactis investigated using Neighbor-joining tree. Larimichthys crocea sequence was used as an outgroup.
Figure
3.
Haplotype network showing genetic relationship among control region haplotypes for Larimichthys polyactis. The size of circles is proportional to haplotype frequency.
The genetic structure of L. polyactis populations was estimated based on pairwise F-statistics and AMOVA analyses. The Fst among different geographical populations was −0.008 (YT vs. WZ) to 0.050 (QD vs. YC). No genetic differentiation which consisted with the distribution pattern caused by geographically isolated distribution pattern was detected, revealing high genetic homoplasy of L. polyactis in the Yellow Sea and East China Sea. Three values of the pairwise Fst estimates were negative (Fig. 4) (YT vs. LYG, YT vs. WZ and LYG vs. ZS), indicating that the variation within populations was greater than that between population, and most of them were not statistically significant after correction for multiple tests.
Figure
4.
Population genetic structure analyse (F-statistics, Fst) of Larimichthys polyactis. * is significant genetic differentiation.
The result of AMOVA analysis demonstrated that the genetic variation among groups was 0.04%, while the 98.96% variation was detected within populations when the populations were divided into two groups (group from YT, RS, QD, LYG, YC; and group from ZS, WZ). The results implemented under two patterns of gene pools showed most of total genetic variances were attributed to differences among individuals within populations, indicating no population structure existed throughout the sample locations of L. Polyactis (Table 2).
Table
2.
AMOVA of Larimichthys polyactis populations of different locations
Neutrality test was used to estimate population historical dynamics of L. polyactis. Tajima’s D (D =−1.355 6, P=0.084) and Fu’s Fs (Fs=−13.572 3, P=0.000) statistics were all significantly negative, indicating that the population departure significantly from mutation-drift equilibrium (Table 3). Therefore, we inferred that the recent large quantity expansion took place in population of L. polyactis.
Table
3.
Results of Tajima’s D and Fu’s Fs statistics based on different locations
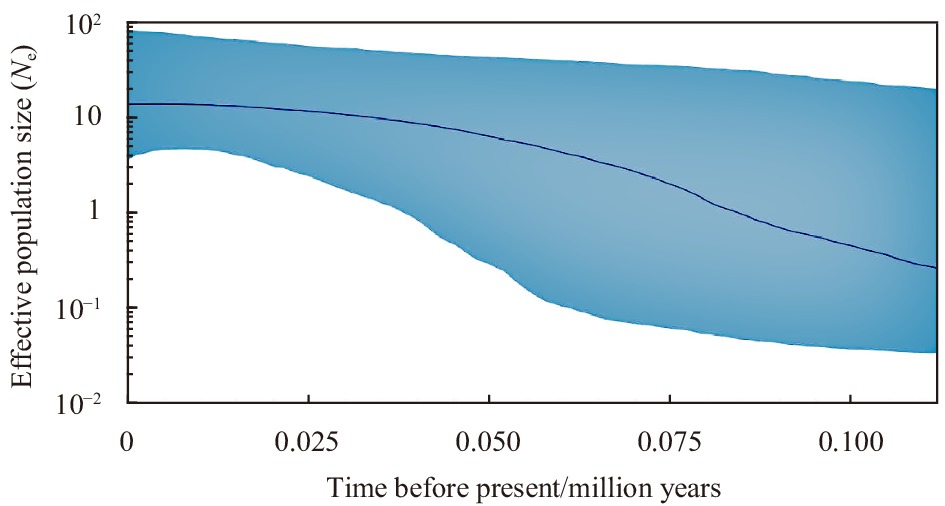
The mismatch distribution for L. polyactis showed distinct unimodality, which supported the conclusion of population sudden expansion (Fig. 4). The BSP was also consistent with the result of neutrality test, and further uncovered the timing of expansion of L. polyactis (Fig. 5). The results indicated that the effective population of L. polyactis along the Yellow Sea and East China Sea have increased from about 75 000 to 40 000 years ago and leveled off by 30 000 years ago (Fig. 4).
Figure
5.
The mismatch distribution under sudden expansion model (solid line).
The effective population size, g and gene flow was estimated by the program Lamarc. Some discrepancies of effective population size were detected among different geographic populations. The lowest effective population size in geographic populations was found in QD population (3.42×10⁵−1.37×10⁶), while the largest size was detected in LYG population (8.83×10⁵−3.53×10⁶) (Table 4).
Table
4.
Estimates of effective population size (Ne), grow parameter (g) and migration among Larimichthys polyactis populations
The g of all populations was positive (Table 4), indicating L. polyactis populations have been growing. The gene flow among populations was asymmetric and high value of gene flow was found among most geographical populations, which supports the result that there was strong homoplasy in populations of L. polyactis (Table 4).
4.
Discussion
The mtDNA fragments have been proven to be very effective and reusable for population genetic study and widely used in population genetics (Simons et al., 2001; Gao et al., 2020). It could be relatively accurate to calculate the genetic parameters of different populations and then to detect the genetic structure, genetic diversity and population historical dynamics of the populations (Simons et al., 2001; Song et al., 2014; Shan et al., 2020). Larimichthys polyactis is an economically important species in the northwestern Pacific Ocean. There are two main spawning grounds for L. polyactis in offshore area of China, the North Yellow Sea and Bohai Sea spawning ground and the South Yellow Sea and East China Sea spawning grounds. In this study, our sampling sites are near the main spawning grounds of L. polyactis, where the resource of this species is relatively concentrated. These sites are the most important and representative distribution areas (Lin et al., 2009). Mitochondrial DNA control region was used to analyze the current genetic diversity status and the genetic differentiation among these sites. Larimichthys polyactis from different geographic populations showed high haplotype diversity and low nucleotide diversity, which was a common phenomenon in marine fish (Ishikawa et al., 2001; Zheng et al., 2012). The result indicated that this species may have experienced a recent sudden expansion, which was supported by the results of neutrality test and mismatch distribution (Slatkin and Hudson, 1991). Small populations would lose partial low frequency of haplotype due to genetic drift, and the rapid growth of the population size within a short time may lead to decrease of genetic drift (Rogers and Harpending, 1992; Dann et al., 2013). Some rare haplotypes were thus preserved, resulting in high genetic diversity in population of L. polyactis.
The higher genetic diversity and larger effective population size of L. polyactis were detected in this study, which indicated that its resource had a tendency to gradually restore in recent years. Severe population declines can be recognized by decreased genetic diversity (Glenn et al., 1999). Our genetic assessment of L. polyactis provides a baseline from which L. polyactis populations can be appraised in the future. The average age of L. polyactis was 5.120 years old in the 1960s, whereas it was only 1.001 years old since the 1990s. The individual miniaturization younger-age trend is becoming more and more serious (Tang and Zhou, 1999). The control region sequences of L. polyactis collected from the coastal waters of China from May 2003 to April 2005 (GenBank: KF412650-KF412764) (Xiao et al., 2015) were downloaded for the comparative analysis. The results showed that h, π and effective population size in the present study were slightly higher than those data from Xiao et al (2009). The predators with larger size may have declined due to overfishing which might cause the increase of L. polyactis resources (Lin et al., 2011). Some laws and regulations protecting the spawning grounds and breeding period of L. polyactis have been formulated since the 1990s, which also effectively preserved its resources (Cheng et al., 2004). Moreover, in recent years, formulation of strict ban on fishing resulted in the gradually declined in the annual catch of L. polyactis (Chen et al., 2020). These measures have played an important role in the recovery of L. polyactis resources. Even so, recently, miniaturization and younger-age trend of L. polyactis were still acute (Lin et al., 2008). To restore the resource of L. polyactis, it is essential to promulgate more reasonable laws and regulations on fishery protection. The small mesh size of the net prevents the small size individuals escaping from the opening meshes. Increasing the mesh size of the net can release small size or juvenile individuals than the control net while keeping the large size catch (Zhang et al., 2014). Additionally, fishery spawning ground and adjacent sea area of L. polyactis should be protected as a priority. It is necessary to create fishery spawning ground protection area based on biological characteristics, fishery survey data and geographical environment (Wang et al., 2021).
The Fst is an effective parameter to estimate differentiation among populations (Teacher et al., 2013). In this study, the conventional population statistic Fst also revealed no significant genetic structure throughout the examined range of L. polyactis and detected strong gene flow existed among the populations. Ikeda (1964) found that recruitment phenomenon existed from north to south in L. polyactis populations among the East China and the Yellow seas, which was consistent with this result. Similarly, the AMOVA conducted on two patterns of gene pools was used to illustrate the species population genetic structure and showed that most variations existed within populations in both one gene pool and two gene pool patterns. The previous studies using mitochondrial DNA markers, microsatellite markers and Restriction-site Associated DNA Sequencing all showed no significant differentiation among L. polyactis populations in the coastal waters of China, which supported the result in this study (Xiao et al., 2009; Kim et al., 2012; Zhang and Cheng, 2005). Low genetic differentiation in L. polyactis populations can be attributed to its strong dispersal ability. The pelagic eggs may float with the ocean current, resulting in gene flow among populations (Lin et al., 2011). Moreover, for spawning, feeding and wintering, L. polyactis populations will migrate in a large range every year (Kim et al., 2006). Theoretically, if Ne×m>1, gene flow among populations can block genetic differentiation caused by genetic drift (Palumbi, 1994). High gene flow was detected among L. polyactis populations in this study, which also indicated that there was no significant genetic differentiation in populations. This may also account for the high genetic diversity. The assessment of population structure can be vital for maintaining a productive fishery (Giovannoni et al., 1990). There was no evidence for genetic subdivision of L. polyactis in this study. However, it is premature to conclude that L. polyactis is composed of a single panmictic stock based on only mtDNA. Therefore, recommendations for future evaluation and management research of fishery resources are studies based on fishery survey combined with molecular markers of higher coverage and larger data sets, such as whole-genome resequencing.
The results of mismatch distribution, neutrality test all showed that L. polyactis populations had a recent expansion, which was support by the result of BSP. Besides, we estimated the population expansion time of L. polyactis using the software of BEAST. The population expansion time of L. polyactis in offshore area of China dated to be approximately in 75 000−40 000 years ago. The population expansion time estimated in the previous study (about 49 300 years ago) was basically consistent with this study (Xiao et al., 2009). This time was in the late Pleistocene and the global climate has changed dramatically, which exerted great influence on survival distribution pattern of global organisms (Herbert et al., 2001; Gao et al., 2020). The effective population size of L. polyactis maybe had a sudden expansion after they experienced severe bottleneck effect because of environmental degradation. Therefore, L. polyactis populations may also be not at equilibrium yet between genetic drift and population migration because of sudden expansion (Palumbi, 1994).
5.
Conclusions
The present study analyzed the variation in genetic diversity and population structure of L. polyactis based on mitochondrial DNA which can provide novel insight into the fluctuation of resources. In summary, L. polyactis populations had high genetic diversity and effective population size, which indicated that its resource had a tendency to gradually restore in recent years. No significant genetic differentiation was detected among populations. Besides, like many marine fish, the effective population size of L. polyactis had a sudden expansion recently. This study can provide a significant basis for the formulation of laws and regulations on fishery protection.
Acknowledgements:
We thank Pengfei Li, Zhicheng Sun, Yehui Wang and Xiang Zhao for collecting the samples.
Bouckaert R, Heled J, Kühnert D, et al. 2014. BEAST 2: A software platform for Bayesian evolutionary analysis. PLoS Computational Biology, 10(4): e1003537. doi: 10.1371/journal.pcbi.1003537
Chen Yongjun, Mao Jun, Senanan W, et al. 2020. Identification of a large dataset of SNPs in Larimichthys polyactis using high-throughput 2b-RAD sequencing. Animal Genetics, 51(6): 964–967. doi: 10.1111/age.13000
Chen Zuozhi, Xu Shannan, Qiu Yongsong, et al. 2009. Modeling the effects of fishery management and marine protected areas on the Beibu Gulf using spatial ecosystem simulation. Fisheries Research, 100(3): 222–229. doi: 10.1016/j.fishres.2009.08.001
Cheng Jiahua, Lin Longshan, Ling Jianzhong, et al. 2004. Effects of summer close season and rational utilization on redlip croaker (Larimichthys polyactis Bleeker) resource in the East China Sea Region. Journal of Fishery Sciences of China, 11(6): 554–560
Dann T H, Habicht C, Baker T T, et al. 2013. Exploiting genetic diversity to balance conservation and harvest of migratory salmon. Canadian Journal of Fisheries and Aquatic Sciences, 70(5): 785–793. doi: 10.1139/cjfas-2012-0449
Excoffier L, Laval G, Schneider S. 2007. Arlequin (version 3.0): an integrated software package for population genetics data analysis. Evolutionary Bioinformatics Online, 1: 47–50
Excoffier L, Smouse P E, Quattro J M. 1992. Analysis of molecular variance inferred from metric distances among DNA haplotypes: Application to human mitochondrial DNA restriction data. Genetics, 131(2): 479–491. doi: 10.1093/genetics/131.2.479
Felsenstein J, Kuhner M K, Yamato J, et al. 1999. Likelihoods on coalescents: a Monte Carlo sampling approach to inferring parameters from population samples of molecular data. Lecture Notes-Monograph Series, 33: 163–185
Fu Yunxin. 1997. Statistical tests of neutrality of mutations against population growth, hitchhiking and background selection. Genetics, 147(2): 915–925. doi: 10.1093/genetics/147.2.915
Gao Tianxiang, Ying Yiping, Yang Qiaoli, et al. 2020. The mitochondrial markers provide new insights into the population demographic history of Coilia nasus with two ecotypes (anadromous and freshwater). Frontiers in Marine Science, 7: 576161. doi: 10.3389/fmars.2020.576161
Giovannoni S J, Britschgi T B, Moyer C L, et al. 1990. Genetic diversity in Sargasso Sea bacterioplankton. Nature, 345(6270): 60–63. doi: 10.1038/345060a0
Glenn T C, Stephan W, Braun M J. 1999. Effects of a population bottleneck on whooping crane mitochondrial DNA variation. Conservation Biology, 13(5): 1097–1107. doi: 10.1046/j.1523-1739.1999.97527.x
Han Zhiqiang, Lin Longshan, Shui Bonian, et al. 2009. Genetic diversity of small yellow croaker Larimichthys polyactis revealed by AFLP markers. African Journal of Agricultural Research, 4(7): 605–610
Han Qingpeng, Shan Xiujuan, Wan Rong, et al. 2019. Spatiotemporal distribution and the estimated abundance indices of Larimichthys polyactis in winter in the Yellow Sea based on geostatistical delta-generalized linear mixed models. Journal of Fisheries of China, 43(7): 1603–1614
Herbert T D, Schuffert J D, Andreasen D, et al. 2001. Collapse of the California current during glacial maxima linked to climate change on land. Science, 293(5527): 71–76. doi: 10.1126/science.1059209
Huang Hao. 2011. Morphological variation and genetic diversity of five populations of small yellow croaker (Larimichthys polyactis)(in Chinese)[dissertation]. Wuxi: Nanjing Agricultural University
Ikeda I. 1964. Studies on the fisheries biology of the yellow croaker in the East China and the Yellow Seas. Seikai Reg Fish Resource Library, 31: 1–81
Ishikawa S, Aoyama J, Tsukamoto K, et al. 2001. Population structure of the Japanese eel Anguilla japonica as examined by mitochondrial DNA sequencing. Fisheries Science, 67(2): 246–253. doi: 10.1046/j.1444-2906.2001.00227.x
Kim J K, Kim Y H, Kim M J, et al. 2010. Genetic diversity, relationships and demographic history of the small yellow croaker, Larimichthys polyactis (Pisces: Sciaenidae) from Korea and China inferred from mitochondrial control region sequence data. Animal Cells & Systems, 14(1): 45–51
Kim Y H, Lee S K, Lee J B, et al. 2006. Age and growth of small yellow croaker, Larimichthys polyactis in the South Sea of Korea. Korean Journal of Ichthyology, 18(1): 45–54
Kim J K, Min G S, Yoon M, et al. 2012. Genetic structure of Larimichthys polyactis (Pisces: Sciaenidae) in the Yellow and East China Seas inferred from microsatellite and mitochondrial DNA analyses. Animal Cells and Systems, 16(4): 313–320. doi: 10.1080/19768354.2011.652668
Kimura M. 1980. A simple method for estimating evolutionary rates of base substitutions through comparative studies of nucleotide sequences. Journal of Molecular Evolution, 16(2): 111–120. doi: 10.1007/BF01731581
Kuhner M K. 2006. LAMARC 2.0: maximum likelihood and Bayesian estimation of population parameters. Bioinformatics, 22(6): 768–770. doi: 10.1093/bioinformatics/btk051
Li Yuan, Han Zhiqiang, Song Na, et al. 2013. New evidence to genetic analysis of small yellow croaker (Larimichthys polyactis) with continuous distribution in China. Biochemical Systematics and Ecology, 50: 331–338. doi: 10.1016/j.bse.2013.05.003
Librado P, Rozas J. 2009. DnaSP v5: a software for comprehensive analysis of DNA polymorphism data. Bioinformatics, 25(11): 1451–1452. doi: 10.1093/bioinformatics/btp187
Lin Longshan, Cheng Jiaye. 2004. An analysis of the current situation of fishery biology of small yellow croaker in the East China Sea. Periodical of Ocean University of China, 34(4): 565–570
Lin Longshan, Cheng Jiaye, Jiang Yazhou, et al. 2008. Spatial distribution and environmental characteristics of the spawning grounds of small yellow croaker in the southern Yellow Sea and the East China Sea. Acta Ecologica Sinica, 28(8): 3485–3494
Lin Longshan, Jiang Yazhou, Liu Zunlei, et al. 2010. Analysis of the distribution difference of small yellow croaker between the southern Yellow Sea and the East China Sea. Periodical of Ocean University of China, 40(3): 1–6
Lin Longshan, Jiang Yazhou, Yan Liping, et al. 2009. Study on the distribution characteristics and fecundity of spawning stock of Larimichthys polyactis in the southern Yellow Sea and the East China Sea. Journal of Shanghai Ocean University, 18(4): 453–459
Lin Longshan, Liu Zunlei, Jiang Yazhou. 2011. Current status of small yellow croaker resources in the southern Yellow Sea and the East China Sea. Chinese Journal of Oceanology and Limnology, 29(3): 547–555. doi: 10.1007/s00343-011-0182-8
Meng Zining, Zhuang Zhimeng, Jin Xianshi, et al. 2003. Genetic diversity in small yellow croaker (Pseudosciaena polyactis) by RAPD analysis. Biodiversity Science, 11(3): 197–203. doi: 10.17520/biods.2003026
Moritz C, Dowling T E, Brown W M. 1987. Evolution of animal mitochondrial DNA: Relevance for population biology and systematics. Annual Review of Ecology and Systematics, 18: 269–292. doi: 10.1146/annurev.es.18.110187.001413
Nei M. 1987. Molecular Evolutionary Genetics. New York: Columbia University Press
Palumbi S R. 1994. Genetic divergence, reproductive isolation, and marine speciation. Annual Review of Ecology and Systematics, 25(1): 547–572. doi: 10.1146/annurev.es.25.110194.002555
Rambaut A, Drummond A J, Xie Dong, et al. 2018. Posterior summarization in Bayesian phylogenetics using tracer 1.7. Systematic Biology, 67(5): 901–904. doi: 10.1093/sysbio/syy032
Rogers A R, Harpending H. 1992. Population growth makes waves in the distribution of pairwise genetic differences. Molecular Biology and Evolution, 9(3): 552–569
Sambrook J, Fritsch E F, Maniatis T. 1989. Molecular Cloning: A Laboratory Manual. 2nd ed. Cold Spring Harbor, NY: Cold Spring Harbor Laboratory Press
Shan Binbin, Liu Yan, Song Na, et al. 2020. Genetic diversity and population structure of black sea bream (Acanthopagrus schlegelii) based on mitochondrial control region sequences: the genetic effect of stock enhancement. Regional Studies in Marine Science, 35: 101188. doi: 10.1016/j.rsma.2020.101188
Simons A M, Wood R M, Heath L S, et al. 2001. Phylogenetics of Scaphirhynchus based on mitochondrial DNA sequences. Transactions of the American Fisheries Society, 130(3): 359–366. doi: 10.1577/1548-8659(2001)130<0359:POSBOM>2.0.CO;2
Slatkin M, Hudson R R. 1991. Pairwise comparisons of mitochondrial DNA sequences in stable and exponentially growing populations. Genetics, 129(2): 555–562. doi: 10.1093/genetics/129.2.555
Song Na, Ma Guoqiang, Zhang Xiumei, et al. 2014. Genetic structure and historical demography of Collichthys lucidus inferred from mtDNA sequence analysis. Environmental Biology of Fishes, 97(1): 69–77. doi: 10.1007/s10641-013-0124-8
Tajima F. 1989. Statistical method for testing the neutral mutation hypothesis by DNA polymorphism. Genetics, 123(3): 585–595. doi: 10.1093/genetics/123.3.585
Tamura K, Peterson D, Peterson N, et al. 2011. MEGA5: Molecular evolutionary genetics analysis using maximum likelihood, evolutionary distance, and maximum parsimony methods. Molecular Biology and Evolution, 28(10): 2731–2739. doi: 10.1093/molbev/msr121
Tang Jianhua, Zhou Jin. 1999. Resource and management of the small yellow croaker in the East China Sea. Marine Fisheries, 21(4): 173–174,180
Teacher A G, André C, Jonsson P R, et al. 2013. Oceanographic connectivity and environmental correlates of genetic structuring in Atlantic herring in the Baltic Sea. Evolutionary Applications, 6(3): 549–567. doi: 10.1111/eva.12042
Tokuyama T, Shy J Y, Lin Huichen, et al. 2020. Genetic population structure of the fiddler crab Austruca lactea (De Haan, 1835) based on mitochondrial DNA control region sequences. Crustacean Research, 49: 141–153. doi: 10.18353/crustacea.49.0_141
Wang Yali, Hu Cuilin, Li Zhenhua, et al. 2021. Population structure and resource change of Larimichthys polyactis in spring in Zhoushan fishery spawning ground protection area, China. Chinese Journal of Applied Ecology, 32(9): 3349–3356
Weir B S, Cockerham C C. 1984. Estimating F-statistics for the analysis of population structure. Evolution, 38(6): 1358–1370
Wirgin I, Waldman J R, Rosko J, et al. 2000. Genetic structure of Atlantic sturgeon populations based on mitochondrial DNA control region sequences. Transactions of the American Fisheries Society, 129(2): 476–486. doi: 10.1577/1548-8659(2000)129<0476:GSOASP>2.0.CO;2
Wu Renxie, Liu Shufang, Zhuang Zhimeng, et al. 2012. Population genetic structure and demographic history of small yellow croaker, Larimichthys polyactis (Bleeker, 1877), from coastal waters of China. African Journal of Biotechnology, 11(61): 12500–12509
Xiao Yongshuang, Song Na, Li Jun, et al. 2015. Significant population genetic structure detected in the small yellow croaker Larimichthys polyactis inferred from mitochondrial control region. Mitochondrial DNA, 26(3): 409–419. doi: 10.3109/19401736.2013.843076
Xiao Yongshuang, Zhang Xiumei, Gao Tianxiang, et al. 2009. Genetic diversity in the mtDNA control region and population structure in the small yellow croaker Larimichthys polyactis. Environmental Biology of Fishes, 85(4): 303–314. doi: 10.1007/s10641-009-9497-0
Xu Zhaoli, Cheng Jiajie. 2009. Analysis on migratory routine of Larimichthy polyactis. Journal of Fishery Sciences of China, 16(6): 931–940
Yan Liping, Liu Zunlei, Jin Yan, et al. 2019. Effects of prolonging the trawl net summer fishing moratorium period in the East China Sea on the conservation of fishery resources. Journal of Fishery Sciences of China, 26(1): 118–123. doi: 10.3724/SP.J.1118.2019.18243
Zhang Hanye, Cheng Jiahua. 2005. Geostatistical analysis on spatial patterns of small yellow croaker (Larimichthys polyactis) in the East China Sea. Journal of Fishery Sciences of China, 12(4): 419–423
Zhang Jian, Jin Yufeng, Peng Yongzhang. 2014. On construction improvement in net mouth of traditional stow net. Marine Fisheries, 36(1): 63–67
Zhang Baidong, Xue Dongxiu, Wang Juan, et al. 2016. Development and preliminary evaluation of a genomewide single nucleotide polymorphisms resource generated by RAD-seq for the small yellow croaker (Larimichthys polyactis). Molecular Ecology Resources, 16(3): 755–768. doi: 10.1111/1755-0998.12476
Zheng Xuebin, Du Chen, Wang Jingqian, et al. 2020. Physiological characteristics and cryopreservation effect of Larimichthys polyactis sperm. Oceanologia et Limnologia Sinica, 51(1): 193–205
Zheng Wenjuan, Lai Yuhong, You Xinyu, et al. 2012. Genetic diversity of Pseudosciaena polyactis in Zhoushan based on mitochondrial DNA D-loop region sequences. Zoological Research, 33(3): 329–336
Figure 1. Sampling sites of Larimichthys polyactis. The dashed red circle represents the North Yellow Sea and Bohai Sea overwintering group, and the dashed green circle represents the South Yellow Sea and East China Sea overwintering group (Xu and Cheng, 2009).
Figure 2. The phylogenetic analyzes for Larimichthys polyactis investigated using Neighbor-joining tree. Larimichthys crocea sequence was used as an outgroup.
Figure 3. Haplotype network showing genetic relationship among control region haplotypes for Larimichthys polyactis. The size of circles is proportional to haplotype frequency.
Figure 4. Population genetic structure analyse (F-statistics, Fst) of Larimichthys polyactis. * is significant genetic differentiation.
Figure 5. The mismatch distribution under sudden expansion model (solid line).
Figure 6. The Bayesian skyline plots for Larimichthys polyactis populations.


 DownLoad:
 DownLoad:


 DownLoad: