Shuo Chen, Donghui Jiang, Renhai Pu, Yunwen Guan, Xiaochuan Wu, Tianyu Ji, Chuang Liu. Genesis, evolution and reservoir identification of a Neogene submarine channel in the southwestern Qiongdongnan Basin, South China Sea[J]. Acta Oceanologica Sinica, 2023, 42(5): 57-78. doi: 10.1007/s13131-022-2071-8
Citation:
Shuo Chen, Donghui Jiang, Renhai Pu, Yunwen Guan, Xiaochuan Wu, Tianyu Ji, Chuang Liu. Genesis, evolution and reservoir identification of a Neogene submarine channel in the southwestern Qiongdongnan Basin, South China Sea[J]. Acta Oceanologica Sinica, 2023, 42(5): 57-78. doi: 10.1007/s13131-022-2071-8
Shuo Chen, Donghui Jiang, Renhai Pu, Yunwen Guan, Xiaochuan Wu, Tianyu Ji, Chuang Liu. Genesis, evolution and reservoir identification of a Neogene submarine channel in the southwestern Qiongdongnan Basin, South China Sea[J]. Acta Oceanologica Sinica, 2023, 42(5): 57-78. doi: 10.1007/s13131-022-2071-8
Citation:
Shuo Chen, Donghui Jiang, Renhai Pu, Yunwen Guan, Xiaochuan Wu, Tianyu Ji, Chuang Liu. Genesis, evolution and reservoir identification of a Neogene submarine channel in the southwestern Qiongdongnan Basin, South China Sea[J]. Acta Oceanologica Sinica, 2023, 42(5): 57-78. doi: 10.1007/s13131-022-2071-8
State Key Laboratory of Continental Dynamics (Northwest University), Xi’an 710069, China
2.
Institute of Shanghai Offshore Petroleum Branch, China Petroleum & Chemical Corporation, Shanghai 200120, China
3.
Research Institute of Petroleum Exploration and Development, PetroChina, Beijing 100083, China
Funds:
The National Natural Science Foundation of China’s Major Project “Research on Geophysical Theories and Methods of Unconventional Oil and Gas Exploration and Development”, Task I: “China’s Tight Oil and Gas Reservoir Geological Characteristics, Classification and Typical Geological Model Establishment” under contract No. 41390451; the Science and Technology Project of Sinopec Shanghai Offshore Petroleum Company under contract No. KJ-2021-7.
A rarely reported middle−late Miocene−Pliocene channel (incised valley fill), the Huaguang Channel (HGC), has been found in the deep-water area of the southwestern Qiongdongnan Basin (QDNB). This channel is almost perpendicular to the orientation of another well-known, large, and nearly coeval submarine channel in this area. Based on the interpretation of high-resolution 3D seismic data, this study describes and analyzes the stratigraphy, tectonics, sedimentation, morphology, structure and evolution of HGC by means of well-seismic synthetic calibration, one- and two-dimensional forward modeling, attribute interpretation, tectonic interpretation, and gas detection. The HGC is located on the downthrown side of an earlier activated normal fault and grew northwestward along the fault strike. The channel is part of a slope that extends from the western Huaguang Sag to the eastern Beijiao Uplift. The HGC underwent four developmental stages: the (1) incubation (late Sanya Formation, 20.4–15.5 Ma), (2) embryonic (Meishan Formation, 15.5–10.5 Ma), (3) peak (Huangliu Formation, 10.5–5.5 Ma) and (4) decline (Yinggehai Formation, 5.5–1.9 Ma) stages. The channel sandstones have a provenance from the southern Yongle Uplift and filled the channel via multistage vertical amalgamation and lateral migration. The channel extended 42.5 km in an approximately straight pattern in the peak stage. At 10.5 Ma, sea level fell relative to its lowest level, and three oblique progradation turbidite sand bodies filled the channel from south to north. A channel sandstone isopach map demonstrated a narrow distribution in the early stages and a fan-shaped distribution in the late stage. The formation and evolution of the HGC were controlled mainly by background tectonics, fault strike, relative sea level change, and mass supply from the Yongle Uplift. The HGC sandstone reservoir is near the Huaguangjiao Sag, where hydrocarbons were generated. Channel-bounding faults and underlying faults link the source rock with the reservoir. A regionally extensive mudstone caprock overlies the channel sandstone. Two traps likely containing gas were recognized in a structural high upstream of the channel from seismic attenuation anomalies. The HGC will likely become an important oil and gas accumulation setting in the QDNB deep-water area.
Many submarine channels occurred in the Neogene in the South China Sea (SCS), and the Central Canyon Channel in the Qiongdongnan Basin (QDNB) is the most well known. The Central Canyon is slightly “S-shaped” and parallel to the present continental shelf break. It is a maximum of approximately 425 km long and nearly 50 km wide (Wang, 2012). The Central Canyon has extremely abundant gas pools. Since 2014, several large-scale gas fields, such as LS17-2, LS25-1, LS22-1, LS18-1, and LS18-2, have been discovered in deep-water channels (Huang et al., 2017), which shows the large exploration potential of channel sandstone reservoirs (Zhu et al., 2009, 2012). Many controversies remain about its genetic mechanism, provenance, developmental stages and controlling factors. Yuan et al. (2009) proposed that the massive Red River provenance supply since the Miocene caused the continental shelf slope margin of the Yinggehai Basin to move in the SEE direction and form a large-scale progradation wedge, and the inversion of the Red River strike-slip fault led to the collapse of sediments and the formation of the deep-sea Central Canyon Channel in the QDNB. Gong et al. (2011) studied the sedimentary process of the Central Canyon. The Central Canyon experienced four stages of axial and lateral erosion-fill processes. The development and sedimentary evolution of the canyon were affected primarily by submarine paleogeomorphology, the structural inversion of the Red River fault, the Coriolis force, relative sea level change (RSC), and a high deposition rate. Wang (2012) proposed two main provenances in the Central Canyon: the western section is primarily composed of turbidite channels, turbidite sheet sand and natural levees, and all of the Red River provenance; and the eastern section primarily has a provenance from Hainan Island on the northern continental slope, which is dominated by mass transport deposits (MTDs). Gravity flows from the west and north interdeposited in the canyon and formed a complex sedimentary system with multiple sources and stages. Li et al. (2013) believed that the Central Canyon was shaped by an erosion event at 5.5 Ma (corresponding to the T3 seismic interface), which was formed by large-scale gravity flow cutting, collapse and filling. The fill materials of the incised valley consist of massive slumps, debris flows, thick turbidite sandstone and abyssal mudstone, which are alternately deposited to form several upward-thinning sedimentary cycles. Su et al. (2014) divided the canyon into three sections, the head, west and east, according to differences in morphology, sedimentary characteristics and genetic mechanism. The sedimentary process of the turbidite channel at the head of the canyon was controlled by the western provenance and fault activities, and the morphological filling characteristics of the western section of the canyon were controlled by the western provenance and the northern continental slope system. The eastern section was primarily affected by tectonic activity at 11.6 Ma.
Lu et al. (2018) also reported that the Zhongjian Canyon (ZJC) developed between the Xisha and Leguang carbonate platforms and studied its morphology, filling structure and evolution. The ZJC experienced four sedimentary evolution stages from the middle Miocene to the Pleistocene and was filled with carbonate rocks, igneous rock detritus and mudstone. The formation of the channel was related to submarine landslides.
The present study found a rarely reported channel in the deep-water area of the southwestern QDNB and the northwestern ZJC. Gong et al. (2020) called it the “Straight Channel” according to its morphology and performed quantitative studies on the complex growth trajectory of the channel, stratigraphic mobility number, Froude number, layer-average flow velocity, flow thickness and water entrainment coefficient. Wang et al. (2021) named it “Huaguang Canyon” due to its proximity to the Huaguang sag and studied the internal structure, formation, evolution and controlling factors of the canyon. The present paper calls it the Huaguang Channel (HGC) due to its relatively small scale. The HGC formed during the sea level drop in the early late Miocene (approximately 10.5 Ma) as a gravity flow system from the provenance of the Xisha carbonate platform. The channel was filled with interbedded sandstones and mudstones with strong amplitude reflection, with great potential for oil and gas exploration.
The Yinggehai Channel and the Central Canyon Channel found in the northern SCS are closely related to regional tectonic movement, low and high paleostructural patterns, provenance supply, and sea-level rise and fall. Does the HGC have a similar genesis as the above-mentioned channels? The relationship, similarities and differences between the various channels are very important geological problems. As an important reservoir unit in this area, the presence of oil and gas in the submarine channel is also important content discussed in this paper.
Limited by the lack of data on deep-water basins, previous studies on the HGC primarily focused on the single-stage channel of the Huangliu Formation (T3–T4). Few studies examined the developmental stages, sand body types, evolution, controlling factors and trap potential of the HGC. Available high-precision 3D and 2D seismic data and multiple sets of deep-water drilling and logging data in the adjacent area provide an excellent opportunity (1) to clarify the development ages and stages of the HGC, (2) discuss in detail the evolutionary process of and factors controlling sandstone in the channel, (3) compare the relationship, similarities and differences of submarine channels in the northern SCS, and (4) identify and characterize the possible gas-bearing reservoirs.
The current research results help strengthen our understanding of regional tectonics, sea level change, provenance and sedimentary evolution in the SCS and supply useful evidence for future gas exploration in the deep-water area of the northern SCS. The results also provide a reference for the study of the sedimentation, evolution and genesis of similar paleosubmarine channels worldwide.
2.
Geological setting
The SCS is the largest marginal sea in the western Pacific Ocean, covering an area of approximately 3.5×10⁶ km2. It lies between three major plates (Eurasian Plate, Indo-Australian Plate and Pacific Plate) and is surrounded by continents, peninsulas and islands (Lüdmann and Wong, 1999; Sun et al., 2003; Hall et al., 2008). The northern SCS is part of a passive continental margin (Khain and Polyakova, 2008) next to similar passive continental margin basins, including the Beibuwan Basin, Yinggehai Basin (YGHB), QDNB and Zhujiang River Mouth Basin (ZRMB) (Tsai et al., 2004; Zhu et al., 2012) (Fig. 1a). The basins are filled with thick Cenozoic fluvial lacustrine facies, marine-continental transitional facies and marine facies deposits and developed Paleogene source rocks, which record the evolutionary history of rifts and oceanic basin expansion on the margin of the SCS (Qiu et al., 2001; Yang et al., 2012; Tang et al., 2014).
Figure
1.
Map of the regional location of the study area, the location of the relevant area and the division of tectonic units in the Qiongdongnan Basin. a. The background map is the current bathymetric map of the South China Sea, the yellow area is the location of the study area, and the yellow dotted line is the Central Canyon Channel. b. Seafloor isochronic map of the 3D seismic survey and the Huaguang Channel distribution of the Huangliu Formation. c. Structural unit map of the Qiongdongnan Basin, with the distribution of typical submarine channels and gas fields in the South China Sea. BJ: Beijiao Uplift, BJS: Beijiao Sag, CC: Changchang Sag, HGJ: Huaguangjiao Sag, LDLS: Ledong-Lingshui Sag, LN: Lingnan Low Uplift, LS: Lingshui Uplift, ZRMB: Zhujiang River Mouth Basin, QDNB: Qiongdongnan Basin, SD: Songdong Sag, SN: Songnan Uplift, ST: Songtao Uplift, SX: Songxi Sag, YB: Yabei Sag, YC: Yacheng Uplift, YGHB: Yinggehai Basin, YL: Yongle Sag, YN: Yanan Low Uplift, YNS: Yanan Sag, YZJ: Yuzhuojiao Sag, ZJ: Zhongjian Uplift.
The QDNB is located in the northwestern SCS, with a NE–SW orientation and a basin area of approximately 6.3×10⁴ km2 (Huang et al., 2017). The QDNB is separated from the YGHB in the west by fault No. 1 and is bounded by the Shenhu Uplift to the east, the ZRMB and Hainan Island to the north, and the Xisha Uplift to the south. From north to south, the basin may be divided into four first-order tectonic units, the Northern Depression, the Central Uplift, the Central Depression and the Southern Uplift, which is further divided into more than 20 second-order structural units (Li et al., 1999) (Fig. 1c). Since the Cenozoic, the YGHB and QDNB have undergone approximately three tectonic evolution stages: the Eocene−Oligocene fault depression (Tg–T7), early−middle Miocene postrift depression (T6–T4) and late Miocene to present passive continental margin thermal subsidence (Xie et al., 2006). Four tectonic movements also occurred in the Cenozoic, the SCS movement, the Baiyun movement, the Dongsha movement and the Nansha movement, which correspond to four significant global sea level decreases and formation of four seismic reflection unconformities of T8, T6, T4 and T2. The main faults and fault-related tectonic activities in the basin primarily occurred in the Paleogene fault depression and depression stages before the T6 seismic interface.
The study area is located in the southwestern QDNB (Fig. 1a), with a 3D seismic survey partially covering the Lingnan Uplift, Huaguangjiao Sag, Yuzhuojiao Sag and Yongle Uplift (Fig. 1c). The water depth is 200 m to 2 000 m (Wang et al., 2021). The HGC is located in the middle of the study area and extends in the NNW direction (Fig. 1b). It primarily occurred in the stage of passive continental margin thermal subsidence (T52–T2).
3.
Data and methods
The 3D seismic survey of the study area was approximately 1 000 km2. The 2D seismic network was 4 km×4 km. The vertical seismic sampling interval was 2 ms, and the main frequency (f) of the target layer was approximately 35 Hz. There are no drilling wells in the 3D seismic area. YC35-1-2, LS22-1-1, LS33-1-1 and other wells are distributed within 15–50 km to the north of the 3D area. Well LS33-1-1, which is nearest to the 3D northern boundary, revealed Paleogene Yacheng and Lingshui formations, Neogene Sanya, Meishan, Huangliu and Yinggehai formations, and Quaternary Ledong Formation. Seismic reflection interfaces T8 (or Tg), T7, T6, T5, T4, T3 and T2 are the bottom boundaries of these formations (Fig. 2), and their ages are 33.9 Ma, 30 Ma, 23.3 Ma, 15.5 Ma, 10.5 Ma, 5.5 Ma and 1.9 Ma, respectively (Wu et al., 2009; Gong et al., 2011).
Figure
2.
Lithologic column, Well LS33-1-1 and cross-well seismic profile in the northern part of the study area (modified from Liu et al. (2018)).
According to unconformity reflections, seismic reflection configuration and geometry, the filling lithologies, stages and evolution of the HGC were interpreted with reference to the Central Canyon Channel, where known wells have been drilled. The relationship between seismic amplitude and lithology was analyzed using (1) seismic correlation of Well LS33 in adjacent areas (Fig. 2), (2) 2D forward model analysis (see Section 5.2.2) and (3) a similar understanding from previous studies (Li et al., 2020, 2021; Wang et al., 2020). The strong amplitude reflection represented the existence of sandstone in the sedimentary background of deep-water thick mudstone in this area. Therefore, the amplitude and waveform attributes were extracted to form sedimentary facies maps of the channel in different stages. Sandstone thickness and channel morphologic maps were constructed using relevant seismic attributes.
Three NNW progradational reflection events were identified in seismic sections for the peak stage of HGC development. Sandstone thickness maps of the three stages of progradation were produced using detailed tracking, interpretation and closure of the seismic progradational reflection based on root mean square (RMS) amplitudes. The related faults near the channel were analyzed using the coherence attribute along the layer. The low and high paleostructural patterns and evolution in 3D seismic surveys were recovered using the stratigraphic thickness method, and the controlling effects of fault activities and global relative sea level changes on channel development are discussed (Chen et al., 2014; Yang et al., 2019). Two dimensional seismic forward models were used to illustrate the layer number and thickness of channel sandstones. The gas-bearing possibility of channel sandstone reservoirs was detected using seismic wave attenuation, which analyzed the hydrocarbon system and promising traps.
4.
Results
4.1
Distribution characteristics of the HGC
There are three Neogene channels in the northwestern SCS, a SSE-trending channel in the YGHB, the NEE-trending Central Canyon Channel in the central QDNB, and the NNW-trending HGC in the southwestern QDNB (Fig. 1).
The axial gravity flow channel in the YGHB was developed near fault No. 1 in the southern section of the Yingdong slope belt (Fig. 1), and the main body developed in the sedimentary period of the Huangliu Formation (Chen et al., 2019). Affected by the dual provenance of the Red River in the northwest and Hainan Island in the east, the channel is characterized by the confluence of NW and NE double channels, and internal turbidite sand bodies are well developed. Several exploration wells revealed this channel, and natural gas was discovered (Pan et al., 2012), which shows the good gas field potential. Only the Central Canyon Channel has been deeply studied, and it has an “S-shaped” morphology, is oriented SSW, is approximately 425 km long and 9–23 km wide and has a seismic reflection time window from 400 ms to 800 ms. The Central Canyon Channel developed in the early sedimentary stage of the Pliocene Yinggehai Formation (5.7–3.7 Ma). The cutting depth of the canyon channel gradually increases eastward (500–800 ms), but the width of the canyon channel gradually narrows downstream (the average width is 16 km in the Ledong-LingShui section, 11 km in the Songnan-Baodao section, and 10 km in the Changchang section) (Fig. 3).
Figure
3.
Morphological map of the Central Canyon Channel and seismic profiles across the different positions of the channel in the Qiongdongnan Basin.
The provenance and sedimentary characteristics of the eastern and western sections of the Central Canyon Channel are different (Zhu et al., 2009; Gong et al., 2011; Wang, 2012; Li et al., 2013; Su et al., 2014; Huang et al., 2017). The Ledong-Lingshui section in the western part of the canyon primarily contains turbidite channels and turbidite sheet sand deposits from the Red River and Lanjiang system in the west, and it contains primarily the interactive deposition of turbidite channels and large-scale MTDs from the northern continental slope (Hainan Island provenance) in the eastern section. However, the continental slope near the Changchang Depression in the easternmost area is relatively gentle, and MTDs are not developed and primarily composed of canyon wall slumps and turbidite channel deposits. Controlled by a deep fault, the canyon channel to the east of the Changchang section has not been filled and shows the characteristics of a “starved canyon” (Fig. 3). Overall, the Central Canyon Channel is a complex canyon sedimentary system with lateral segmentation, vertical staging, and the interaction of various provenances and sedimentary types.
Compared to the Central Canyon, the HGC in the present study is nearly perpendicular to the Central Canyon Channel, which is located to the southwest of the QDNB, and advances NNW-ward along the throw side of the Yuzhuojiao Fault on the west wing of the low Beijiao Uplift (Fig. 4a). The HGC formed in the early Miocene Meishan to Pliocene Yinggehai formations (T5–T2), which were earlier than the Central Canyon. The HGC formed by the lateral migration and vertical superposition of multistage channel sand, which lasted approximately 18 Ma (Fig. 4). The upper stream of the HGC is close to the Yongle Uplift of the Xisha Islands and surrounded by the Huaguangjiao Sag and Yuzhuojiao Sag.
Figure
4.
Superposition map of the Huaguang Channel (HGC) at different stages and with seismic profiles of the upper, middle and lower reaches of the cross-channel in the southwestern Qiongdongnan Basin. N1s: Sanya Formation; N1m: Meishan Formation; N1h: Huangliu Formation; N2y: Yinggehai Formation.
The 3D seismic data revealed that the axial length of the channel was approximately 42.5 km, which is approximately one-tenth of the Central Canyon. Different from the S-shaped distribution of the Central Canyon and controlled by paleotectonics, faults and sufficient provenance supply, the HGC has a “straight flow” shape. The width of the valley in the upper, middle and lower reaches ranges from 2.7 km to 4.3 km, with an average of 3.3 km, which diverges and widens slightly downstream (Fig. 4). The overall filling thickness of the channel ranged from 142 ms to 795 ms (approximately 200–1 000 m), with the largest in the sag between the high positions (Fig. 5). The HGC sediments are from a single provenance, primarily from the Yongle Uplift in the south. The strong amplitude reflection showed the interbedded sandstone and mudstone fill (Wang et al., 2021).
Figure
5.
Seismic profiles of the cross-channel in the southwestern Qiongdongnan Basin. The positions of the sections are shown in Fig. 4a. N1s: Sanya Formation; N1m: Meishan Formation; N1h: Huangliu Formation; N2y: Yinggehai Formation; Mz: Mesozoic basement.
Well LS33-1-1 is located in the Lingnan Uplift on the southern uplift of the QDNB, adjacent to the northern margin of the study area. Well LS33-1-1 reveals the Meishan Formation, and its upper formations are terrestrial fine-grained clastic neritic-bathyal deposits overall that are locally interbedded with mixed shelf deposits. The main lithologies generally consist of mudstone, calcareous mudstone with a thin layer of siltstone, and argillaceous siltstone that is locally interbedded with thin marls. The Lingshui Formation and its lower formations are interbedded with sandstone, mudstone and calcilutite in the fault-depression basin. The weak-medium amplitude reflections in the cross-well seismic profile correspond to the thickly layered mudstone containing a small amount of thinly layered siltstone. Typically, the large-scale weak amplitude reflections represent deep-water thick mudstones, and local strong amplitude reflections exist in thicker sandstones with mudstone backgrounds (Fig. 2). The strong amplitude channel indicated that more sand was deposited in the deep-water shelf and bathyal backgrounds for a long time.
To study the stages and evolution of channel development, the thickness, content and staging information of channel sandstone were obtained based on the comprehensive interpretation of 3D seismic amplitude, including well calibration, forward model, attribute analysis, and tectonic analysis. On this basis, the evolution of the channel was divided into stages by analyzing the changes in geometric characteristics related to sedimentation, such as the morphology, structure, scale, undercutting depth and extension direction of the channel (Table 1). Extracting the RMS amplitudes along each stratigraphic period of the 3D seismic data and their sandstone isopach maps may be depicted based on the relationship between sandstone thickness and amplitude. The amplitude anomaly extension or sandstone isopach maps approximately show the morphology, distribution and evolution of the HGC in different epochs, which displayed the following four stages (Fig. 6).
Table
1.
Classification basis and characteristic comparison of four development stages of the Huaguang Channel
Stages
Morphology
Distribution
scale/km2
Axial
length/km
Average incised
depth/m
Incubation stage (early Miocene)
C- or trumpet-shaped, diverged westward and fanned out
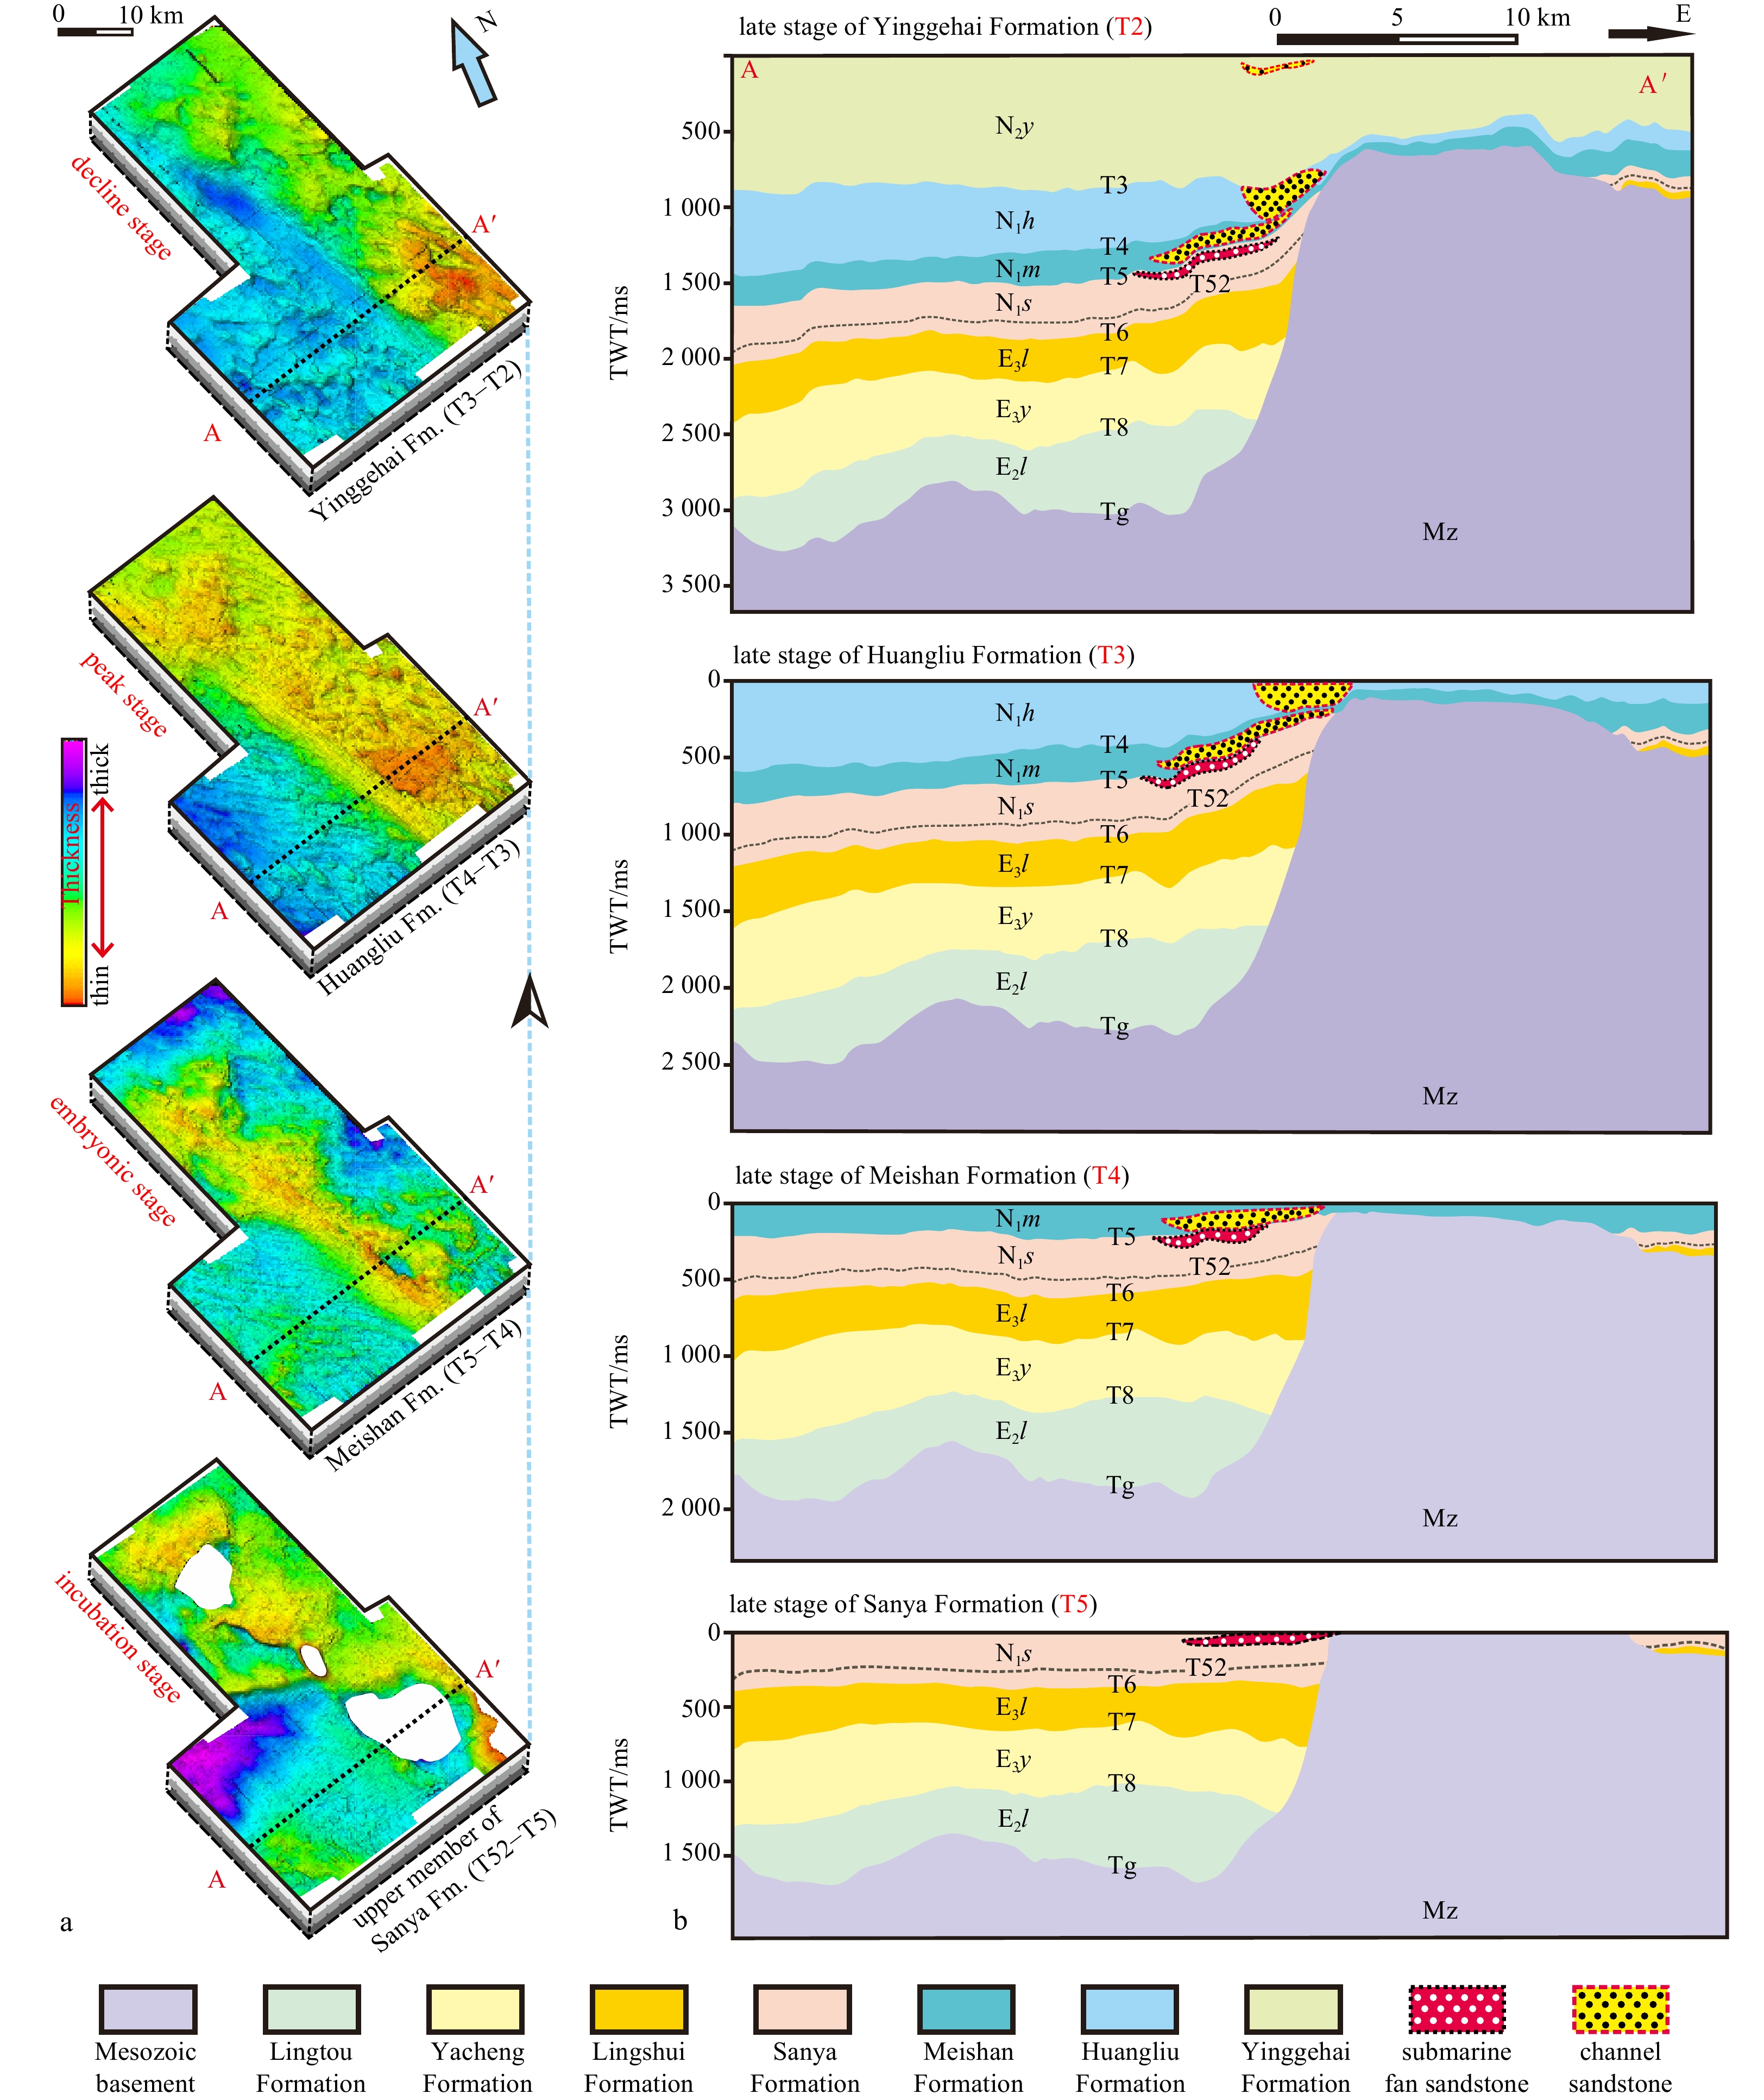
(1) During the incubation stage (upper Sanya Formation, T52−T5), the submarine fan deposits primarily extended along the SE–EW trumpet-shaped area, diverged westward and fanned out. The resulting submarine fan is approximately 136 km2, 3.5 km wide upstream, 6.8 km wide downstream, and approximately 30.3 km long and is primarily distributed in the lower part of the Huaguangjiao Sag in the southwestern part of the study area. During this period, it was a trumpet-shaped submarine fan rather than a narrow banded channel (Fig. 6a).
(2) During the embryonic stage (Meishan Formation, T5−T4), the submarine fan deposits were gradually transformed into the NW-ward spreading “tree-trunk-like” protochannel. This period was the transition from submarine fan to channel, and debris came from the Yongle Uplift in the southeast. The resulting channel extends approximately 22 km, and the sandstone area is approximately 160 km2. The sand body distribution is wide and shallow and primarily concentrated in the middle and upper reaches of the channel (Fig. 6b).
(3) The peak stage (the Huangliu Formation, T4−T3) resulted in the most obvious channel features, the longest distance (43 km), and the greatest depth of incision (average of 250 ms and approximately 340 m). The channel has a NW-trending narrow straight band with an area of approximately 94.3 km2 and an unchanged width of 3.3 km from SE to NW, which is different from the slightly curved “S-shaped” extension of the Central Canyon (Fig. 6c).
(4) In the decline stage (the upper Yinggehai Formation, T3−T2), the extent of the channel became significantly smaller and was primarily distributed in the upper reach of the channel in the middle of the study area. The axial length was shortened to approximately 14.5 km, and the width of the channel was also reduced to half of its original size and covers an area of approximately 48.9 km2. Wells in the neighboring area reveal that the Quaternary sediments in the later stage were large mudstones represented by weak seismic profile reflections, which indicates that the channel almost disappeared (Fig. 6d).
4.3
Characteristics of channel progradation in the “peak stage”
From the middle Miocene incubation stage to the Pliocene decline stage, the channel lasted for approximately 18 Ma, and the fill thickness of sandstone varied in each stage (Fig. 7). In the strata representing the peak stage of channel incision and filling (10.5–5.5 Ma) during deposition of the Huangliu Formation (T4–T3), three NW-ward progradational events were identified on the seismic profile along the channel direction (Fig. 8), which suggests a maximum rate of debris supply, while the global sea level fell to the lowest level at the age of 10.5 Ma (Fig. 8a).
Figure
7.
Stratigraphic thickness (paleotectonics) and structural evolution profiles of each period of channel evolution. The position of Section AA′ is shown in Fig. 1b. a. The stratigraphic thickness map of different periods related to the development of the channel. The yellow low-value area in the middle of the thickness map of the Meishan Formation is not a paleotectonic uplift but a small residual thickness caused by channel incision. b. The Cenozoic tectonic evolution profiles of the NE-trending cross-section in the study area drawn using the “top-surface-flattening” method, in which the red sand body suggests a submarine fan in the Sanya Formation, and the yellow suggests the channel sand body in the embryonic stage of the Meishan Formation, the peak stage of the Huangliu Formation and the decline stage of the Yinggehai Formation. E2l: Lingtou Formation; E3y: Yacheng Formation; E3l: Lingshui Formation; Mz: Mesozoic basement; N1s: Sanya Formation; N1m: Meishan Formation; N1h: Huangliu Formation; N2y: Yinggehai Formation.
Figure
8.
Interpretation of three progradational seismic reflections developed in the channel of the late Huangliu Formation (T31−T3). a. Seismic profile of the T3 horizon flattened along the NW channel direction. b. Profile and sequence division of three progradational bodies in T31−T3. c. Superimposition map of three progradation bodies, in which yellow is Progradation I, pink is Progradation II, green is Progradation III, and the location of Section BB′ is shown inFig. 1b.
The progradational bodies from downlap surface T31 to toplap surface T3 lasted for approximately 1.7 Ma and formed a set of upwardly shallowing progradational third-order sequences (Fig. 8b). Each progradational event of seismic reflection was tracked, and corresponding RMS amplitude maps were generated (Fig. 9). If the target interval velocity was assumed to be 3 000 m/s and the main frequency of the seismic wave was 30 Hz, the seismic wavelength was approximately 100 m, and the tuning thickness of one quarter of the wavelength was approximately 25 m. Based on the relationship between the amplitude and the tuning thickness, it was presumed that the maximum thickness of the single progradational body was approximately 20–30 m, and the total maximum thickness of the three sandstone bodies was approximately 60–90 m. The superimposed area of the three progradational channel sandstones is approximately 42.3 km2, approximately 26.2 km long, 3.7–4.2 km wide, and concentrated in the lower part of the HGC.
Figure
9.
RMS amplitude and sand body thickness evolution maps of three progradational events identified in the peak stage of channel development in the late Huangliu Formation (T31–T3).
The distribution of the sandstone bodies and the thickest sandstones of each progradation body are circled according to the median and high values of RMS amplitude, respectively, in Fig. 9.
Progradation event I is “spindle-shaped” with narrow ends and a wide middle (Figs 9a, b), and the widest part is approximately 1.6 km, which accounts for 39% of the channel width. The axial length of the sandstone body is 18.1 km, and the area is 16.8 km2. The area of the sandstone body with a thickness greater than 30 m is only 0.5 km2, and approximately 90% of the sandstone body has a thickness less than 20 m.
The width of progradation event II gradually narrows from upstream to downstream (Figs 9c, d), with the widest part reaching 2.33 km, which accounted for 54% of the channel width during this period, and it narrows downstream to 0.33 km. The sandstone body has an axial length of 15.7 km and an area of 22.4 km2, which is shorter and wider than event I, and the area increased by approximately one-third, with an overall advancement of 2–4 km in the NW direction. The area of sandstone bodies with thicknesses greater than 30 m (RMS values≥50) increased to 7.2 km2 and accounted for approximately 32.1% of the overall area.
Progradational event III is a “dumbbell-shaped” event with wide ends and a slightly narrow middle (Figs 9e, f). It has the largest area of approximately 30.8 km2 and the longest axial distance of nearly 19 km, which is approximately 37.5% larger than the previous event. During this period, progradation continued to advance 6.5 km NW-ward overall. The widest part of the sandstone body is 2.32 km and accounted for 55% of the channel width, which is comparable to progradational event Ⅱ. The area of the sandstone body with a thickness greater than 30 m (RMS value≥50) increased to 8.2 km2.
Generally, all three progradational bodies are mudstone interbedded with sandstone deposits and show linear extensional morphology. First, the difference between the three bodies is that the strong amplitude sandstone bodies in progradation I are all distributed in narrow strips and have nearly parallel shapes (Fig. 9b), but the thick sandstone bodies in progradations II and III are fan-shaped and contiguous in distribution (Figs 9d, f). Second, the thick sandstone deposition area corresponding to the strong amplitude gradually migrates downstream across stages. Third, the scale or lateral connectivity of a single sandstone body improved with the development of the sandstone bodies. These differences may be related to the influence of paleotopography. The early sand body was a small strip and not connected, which is related to the uneven palaeotopography. After filling and smoothing in the late stage, the ancient channel accumulated larger and more connected sandstones. On a slice along the T4 and T3 coherent layers, many small faults are visible at the bottom of the channel. Small fault troughs may have caused the parallel isolated strip distributions of progradation I sandstone bodies.
5.
Discussion
5.1
Factors controlling the HGC
The incision and filling of large-scale submarine gravity flows (slumps and turbidity flows) are the main mechanisms for the formation of submarine canyons or channels (Tinterri et al., 2003; Amy et al., 2005; Mayall et al., 2006; Wynn et al., 2007; Yuan et al., 2009), and the development and evolution of channels are often controlled by multiple factors, such as paleogeomorphology, relative sea level change and provenance supply (Bouma, 2007).
McHugh et al. (2002) studied the genesis of Berkeley Canyon on the continental margin of New Jersey and found that the internal fillings were composed of slumps, debris flows and turbidites. The cutting and filling event of the canyon in the middle Miocene occurred very rapidly (approximately 2.5 Ma) and was related to a significant glacioeustatic sea level fall event ((13.5±0.5) Ma). When studying the formation and evolution of the Alhama submarine canyon in the Granada Basin, southern Spain, Puga-Bernabéu et al. (2008) believed that the channel was formed by sea level fluctuations in the early stage. The erosive flow in the later stage was generated after offshore and storm current deposits captured by the channel, which further promoted the development of the canyon. Li et al. (2013) believed that the late Miocene basement erosion surface (corresponding to the T3 seismic reflection surface) of the Central Canyon Channel in the QDNB was the comprehensive result of the rapid uplift of the Qinghai-Tibet Plateau, massive replenishment of the Red River provenance, sea level drop, shelf erosion and other factors.
To explore the genesis and factors controlling the HGC, horizontal slices of the variance/coherence volume were made for Tg (the basement surface), T6 (the transitional surface from the rift to the depression stage), T52 (seismic reflection interfaces of the bottom upper member of the Sanya Formation), T5 (top of the Sanya Formation), T4 (top of the Meishan Formation) and T3 (top of the Huangliu Formation), which are related to the development of the channel (Fig. 10). Time domain structural maps and stratigraphic thickness maps of each formation in the 3D area were drawn (Fig. 11), and global RSCs since the Cenozoic (Chen et al., 2014) were analyzed (Fig. 13).
Figure
10.
Fault distribution maps of the top basement and top fault depression and the relative seismic section. The location of the section is shown in Figs 1b and 10c.
Figure
11.
Fault maps, isochronous structural maps and isopach maps of channel-related stratigraphy showing the evolution from the late stage of the early Miocene Sanya Formation to the late Miocene Huangliu Formation (T52−T3) in the deep-water 3D area of southern Qiongdongnan Basin.
5.1.1
Fault activities controlling the position and extension of the HGC
The QDNB is located in South China and was a fault depression from the Eocene to the Oligocene (Xie et al., 2006; Li et al., 2015). The basement of the 3D seismic survey in the southern part of the basin was divided into multiple fault blocks by NE-, NW- (Yuzhuojiao fault) and ENE-trending faults (Figs 10a, d). Bounded by the NW-trending fault in the central part, the burial depth of the fault block in the west is greater and resulted in a westward-dipping paleotectonic pattern. Faults were continuously active during the Eocene to early Oligocene (T8–T7), and a new fault in the E−W direction appeared in the middle of the study area (Fig. 10b). During the postrift depression stage, the basement-inherited NW-trending, E–W-trending and NE-trending faults remained active and broke through the Sanya Formation (T6–T5), and the activities of other faults gradually weakened (Fig. 11c). The distribution and extension of the channel are closely related to NW- and EW-trending fault activities.
For the late stage of the Sanya Formation (T52–T5), a comparison of the hiatus area in Figs 10b and 11a revealed that the ancient subuplifts of BJ 4, 6 and 9 in the eastern part of the NW-trending basement fault significantly uplifted and caused the east to be higher and the west to be lower. The NW-trending fault (fault ①) and E−W-trending fault (fault ④) were continuously active. The fault troughs distributed near the lowest point of the downthrown side of the normal fault played a role in the inflow and diversion of clastic materials (Fig. 10c). The channel passed from south to north along the sag between two subuplifts (Fig. 11a). The clastic materials from the Xisha Yongle Uplift drained into the Huaguangjiao Sag to form a “trumpet-shaped” submarine fan of the Sanya Formation (Figs 6a, 7a, 10d, and 11a).
The E−W-trending fault ④ in the central part of the study area ceased activity after the deposition of the Meishan Formation, and no longer controlled the distribution of the channel (Fig. 10). As shown in Fig. 11, NW-trending basement fault ① was continuously active from the Meishan to the late stage of the Huangliu Formation, and multistage channels extended along the downthrown side of fault ①. According to the time-domain structural map and stratigraphic thickness map of each stage, only the earliest (Fig. 11a) and latest (Fig. 11d) submarine fans and channels occurred at the lowest position, and channels in the other two stages were not distributed along the lowest position of the sag. These channels instead flowed along the fault strike on the west-dipping downthrown side (Figs 11b, c). Therefore, the NW-striking fault in the 3D survey significantly controlled the channel formation and distribution.
The NE-directed seismic Section AA′ that crosscuts the channel in the middle of the study area (Fig. 12a) was selected, and the plane position is shown in Fig. 1b. A large normal NW-striking west-dipping fault is shown in this section. The stratigraphic thickness of the upthrown and downthrown sides of the Sanya Formation to Yinggehai Formation (T6–T2) was counted, and the thickness difference was calculated to analyze the change in fault activity (Fig. 12b).
Figure
12.
Changes in NW-striking Yuzhuojiao fault activity in the middle of the study area. a. NE-directed seismic profile of the cross-cutting channel. b. Difference in the stratigraphic thickness of the Sanya Formation and Yinggehai Formation between the upper and lower sides. The thickness difference between the upthrown and downthrown sides of the Yuzhuojiao fault shows that the fault activity gradually weakened over time and is not related to the thickest and longest channel sandstone during the deposition of the Huangliu Formation.
The results showed that (Fig. 12) since the deposition of the Sanya Formation, the thickness difference between the upthrown and downthrown sides gradually decreased, and the activity of the NW-strike fault gradually weakened. During the Yinggehai Formation, the fault completely ceased activity. According to a previous study, the Huangliu Formation represented the peak development stage of the HGC (Fig. 6c), and there was no correlation between the channel development intensity, sandstone development degree and fault activity.
5.1.2
Control of RSCs on the development intensity of the HGC
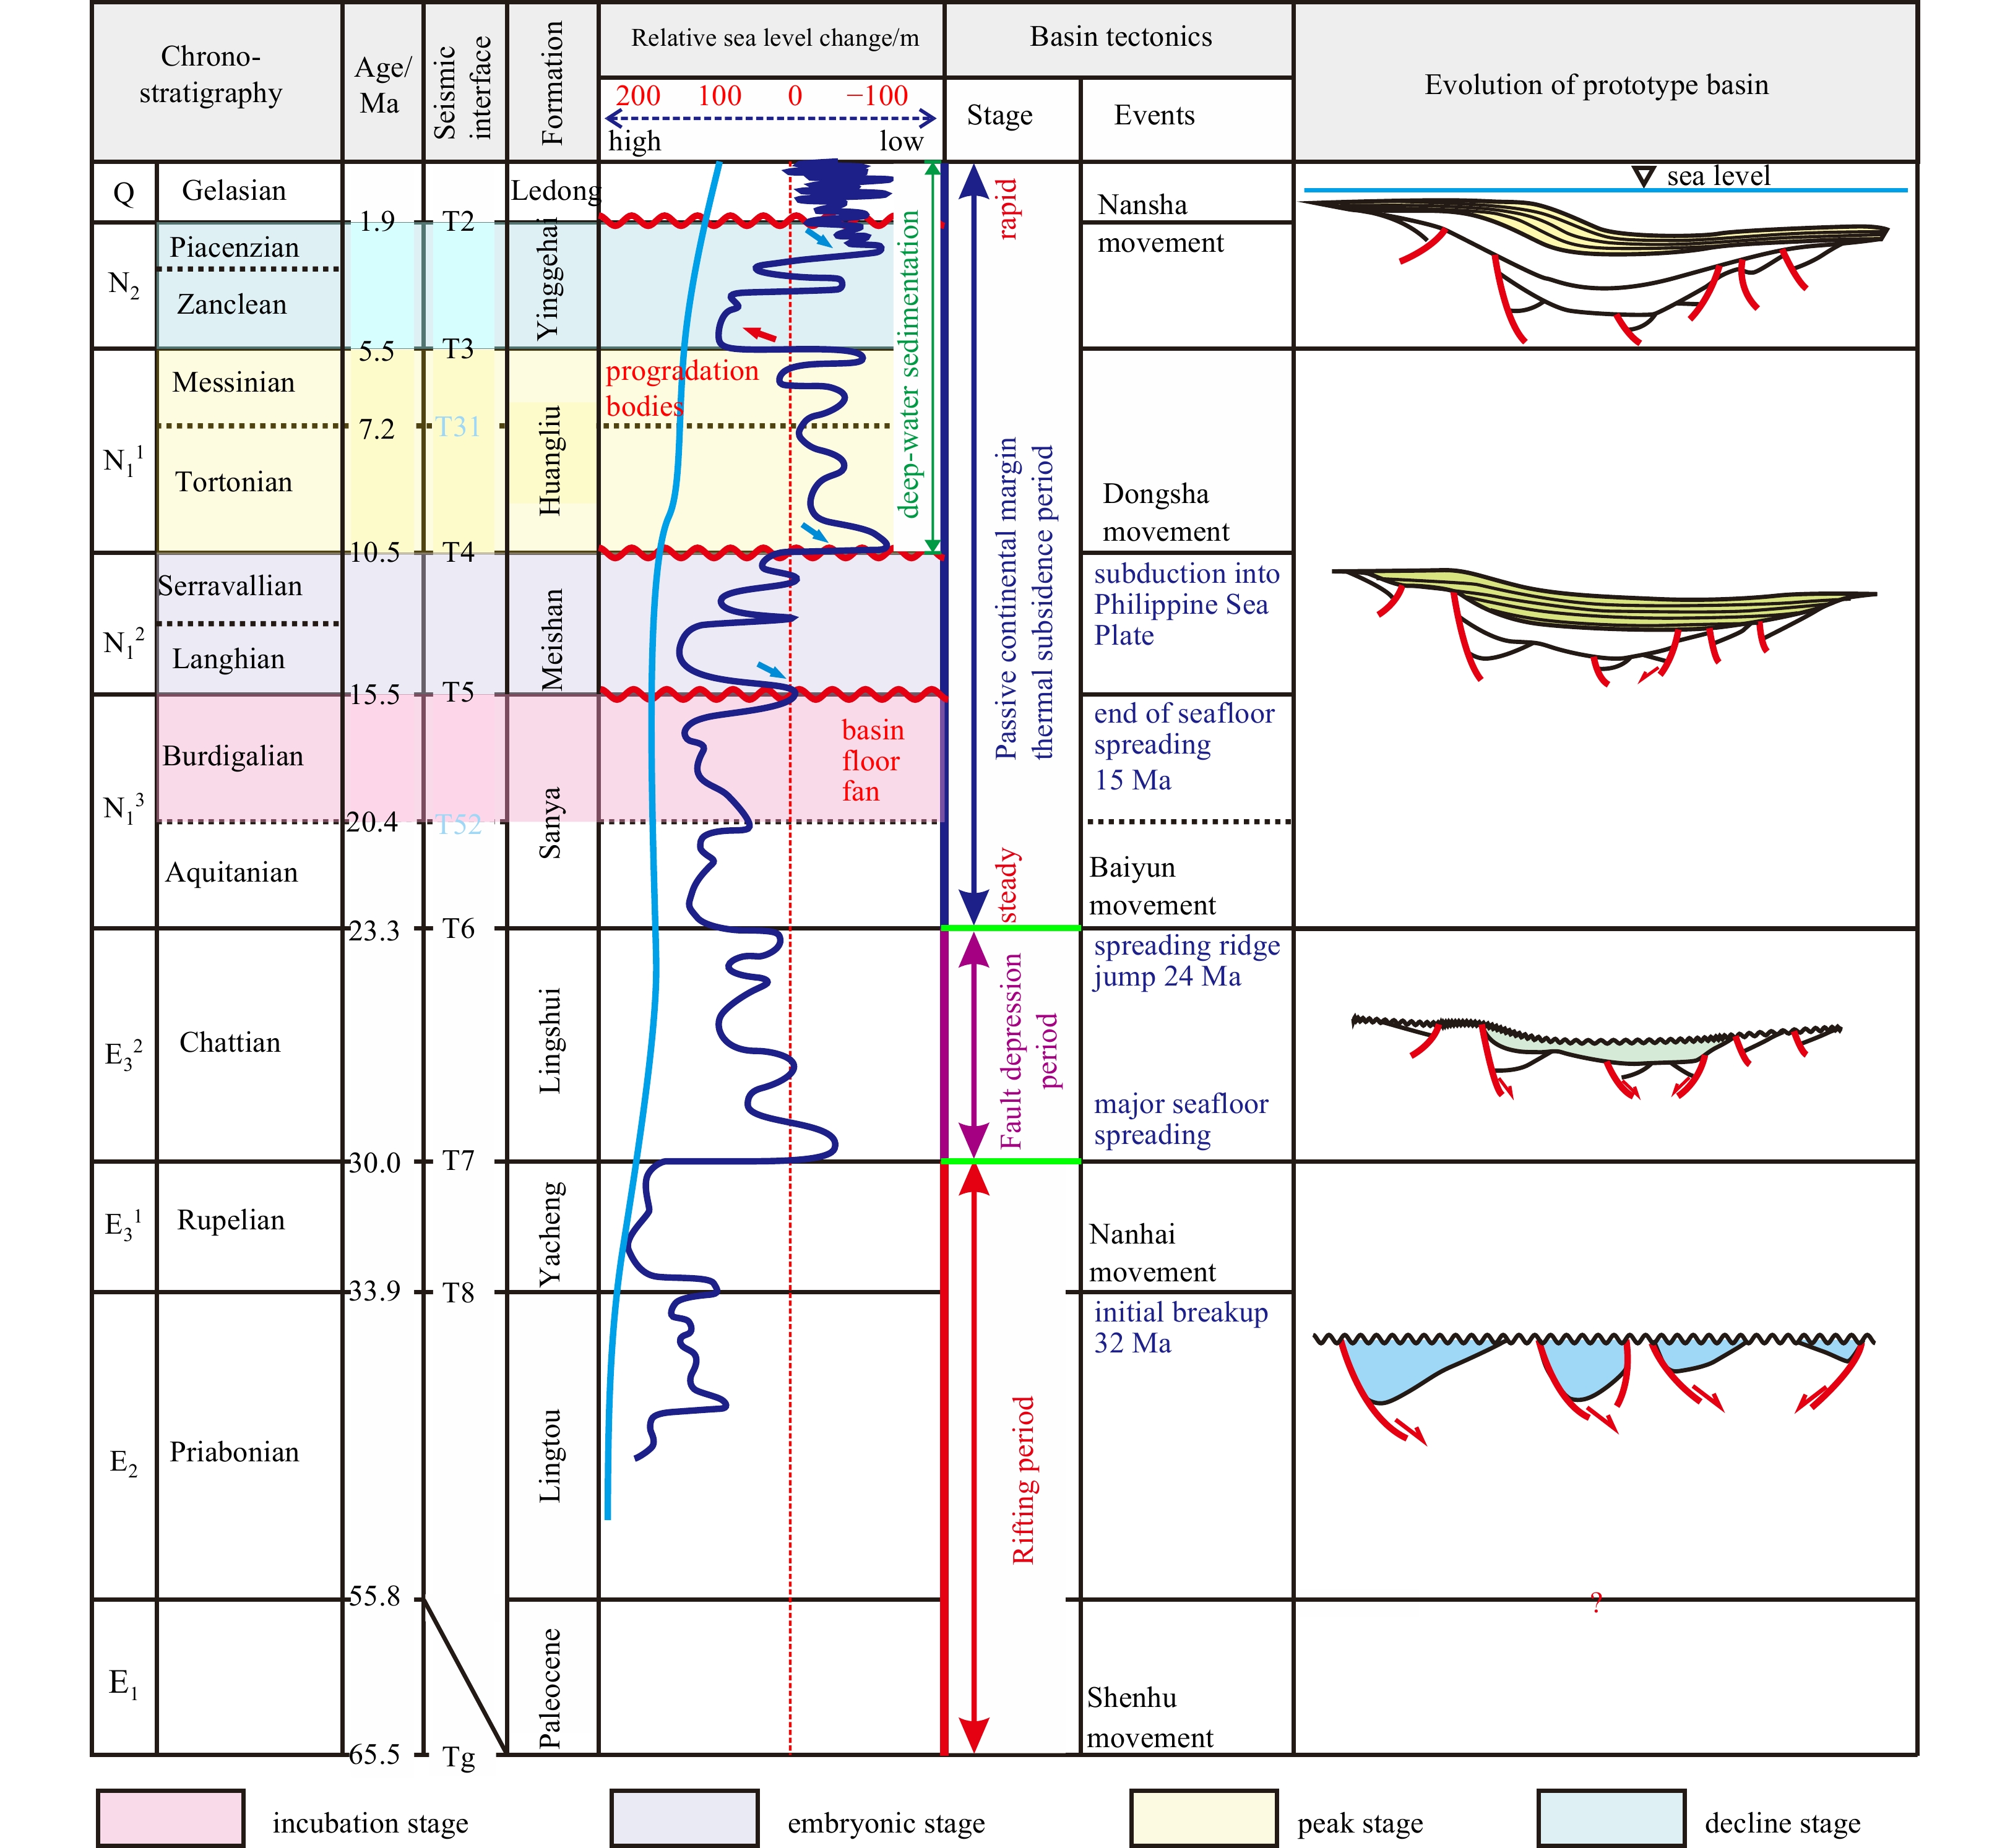
Because the stages and evolution of channels are determined based on the amplitude, shape and area changes in the channel seismic reflections, the intensity of channel development here primarily refers to the content and scale of sandy fillings in the channel that are related to amplitude (Fig. 13).
A comparison of the formation and evolution stages of the channel with the global RSC curve revealed that the most developed stage of the HGC was in the lowest period of global sea level fall, and the channel tended to decline as the global sea level abruptly rose.
Since the Cenozoic, the world has experienced several RSCs (Haq et al., 1987), which strongly correlated with the development intensity of the four-stage HGC in the QDNB (Fig. 13).
During the Tortonian-Messinian in the Miocene (corresponding to the Huangliu Formation T4−T3), the Himalayan Movement caused the uplift of the Earth’s crust, and the global sea level decreased significantly, especially in the early Tortonian (10.5 Ma, corresponding to the T4 regional unconformity, equivalent to the Dongsha movement). The sea level fell more than 100 m and was the lowest since the Cenozoic (Fig. 13). The Central Canyon in the QDNB and Yinggehai Channel also formed in this period, and wells drilled in the shallow sea area in the northern part of the basin revealed the hiatus of this set of strata.
At the early stage of T4–T31, the paleotectonics of the study area were high in the east and low in the west (Fig. 14a), and the relative sea level remained at a low level during this period (Fig. 13). The outcropping of the eastern highland was subjected to denudation and formed the T4 unconformity. The western part was primarily filled by argillaceous deposits with lower topography but less provenance supply. At the later stage (T31–T3), the central part of the study area was the lowest point of paleotectonics and paleogeomorphology (Fig. 14b). The Xisha Uplift was exposed and acted as a sufficient provenance for the study area (Wu et al., 2014). With the gradual rise of the relative sea level, the accommodation space was formed, but its growth rate was far less than the sediment supply. The lowest point of the paleofault trough above the unconformity began receiving deposition, and the Huaguang channel extending NW in its peak was developed. During this period, the characteristics of undercutting and filling were also the most obvious, as visible in the Huangliu Formation (Figs 4–6) and where the three progradational sand bodies occurred along the channel (Figs 8 and 9).
Figure
14.
Comparisons before and after channel development and genetic mechanism model of the Huangliu Formation. The paleostructures of T4 and T31 were studied using the equilibrium profile method of flattening T31 and T3, respectively. See Fig. 4a for the position of the profile. The peak period HGC developed in the lowest position of the regional paleostructure when the sea level of T31–T4 gradually rose and the provenance of the southern uplift was in large supply.
The Zanclean in the early Pliocene (5.5 Ma, corresponding to the T3 interface) was accompanied by a rapid and significant global relative sea level rise (Fig. 13), and the southern QDNB entered a bathyal continental slope sedimentary environment. Although the T3−T2 paleotectonic map (Fig. 11d) shows the lower paleotectonics in the central part of the study area and two sags along the middle and lower reaches of the channel, with conditions for storing sediments, the growth rate of accommodation space was much larger than the sediment supply. Well drillings in the QDNB revealed the development of large mudstones in the Yinggehai Formation (Fig. 14c). At the end of the Yinggehai Formation (1.9 Ma, equivalent to the Nansha movement), the Huaguang Channel entered a period of decline due to a relatively small-scale sea level fall, and a small sand body with an axial length less than 10 km was formed upstream of the channel (Figs 6d and 11d).
The sag between two subuplifts, which is the lowest position of the normal fault downthrown side, generally controlled the distribution, geometry and evolution of the channel. The channel was a “trumpet-shaped” submarine fan in the incubation period, a wide and shallow “trunk-shaped” channel in the embryonic stage, a “straight flow” undercutting channel in the peak stage and a small-scale channel in the decline period. The intensity of channel development is closely related to the RSC, especially the large-scale sea level fall corresponding to the peak stage and the large-scale sea level rises corresponding to the decline period. Fault troughs provided accommodation space for the channel sands and controlled the distribution and extension of channels, and the RSC and provenance affected the injection of terrigenous debris and supply intensity for channel sands. The mutual coupling and interaction between the two factors controlled the formation, development and decline of the channel.
5.2
Gas detection in the HGC
5.2.1
Seismic attenuation anomaly and gas detection
Dispersion and attenuation are generally caused by gas-bearing or special low-velocity lithologies (Brouwer et al., 2008). Gas-bearing reservoirs may be detected according to the relative increase in low-frequency energy, the relative decrease in high-frequency energy and the decrease in the dominant frequency (Chen and Jeng, 2011; Lu et al., 2013; Carcione et al., 2018). The generalized low-frequency shadow hydrocarbon detection method was used to examine the 3D seismic area where the HGC is located (Wu et al., 2019; Pu et al., 2021), and the results showed that attenuation anomalies occurred in the Huangliu Formation and Meishan Formation in the upper reaches of the HGC (Figs 15a, c). The attenuation anomalies of the channel in the Meishan Formation (T4–T5) covered an area of approximately 18.9 km2 along the channel distribution. The attenuation anomalies of the channel in the Huangliu Formation (T3–T4) are approximately 6.9 km2 and show a contiguous “wide upstream and narrow downstream” lobate geometry.
Figure
15.
Abnormal attenuation maps of gas detection and the reservoir thickness map calculated by abnormal amplitudes greater than 16 000 (dimensionless) in the Huangliu (T3−T4) and Meishan (T4−T5) formations in the upper reaches of the Huaguang Channel.
5.2.2
Forward modeling method for reservoir thickness identification
To determine the thickness and layer number of possible gas-bearing sandstone reservoirs in the upper reaches of the channel in the Huangliu Formation and Meishan Formation, a typical seismic section, CC′, crossing the anomalous attenuation area was selected to establish a 2D forward model (Fig. 16), and the position of the section is shown in Fig. 1b. Based on the logging data of the adjacent area, the velocities of sandstone and mudstone of each target horizon in the study area were preferentially sorted to construct a geological model (Table 2).
Figure
16.
Forward modeling and seismic response profile of the channel in the Yinggehai to Sanya formations. The forward modeling results indicate that the Huangliu Formation develops three layers of 20 m thick gas-bearing sandstone, the Meishan Formation develops one layer of 35 m and one layer of 15 m thick gas-bearing sandstone, and the Sanya Formation develops one layer of 15 m thick gas-bearing sandstone.
Using the Huangliu Formation as an example, the velocities of mudstone and gas-bearing sandstone were 2 480 m/s and 2 700 m/s, respectively, and a 35-Hz positive polarity Ricker wavelet was selected. The low-frequency strong amplitude reflections of “two valleys and one peak” for a single layer and “four valleys and three peaks” for three layers (blue is the peak) in the Huangliu Formation were formed at the position of the corresponding gas-bearing sandstone (Fig. 16). The velocity of gas-bearing sandstone was slightly higher than mudstone in this model. Different thicknesses and numbers of sandstone reservoirs in the model were tested in relation to the actual seismic sections. The final model of many repeated tests was very close to the actual situation (Fig. 17a). The results showed that the attenuation anomaly in the upper reaches of the Huangliu Formation suggested three layers of sandstone reservoirs with a cumulative thickness of approximately 60 m. The attenuation anomaly of the Meishan Formation also suggested two layers of sandstone reservoirs with a cumulative thickness of approximately 50 m, and approximately 15 m of sandstone in the Sanya Formation that possibly contained gas.
Figure
17.
A NW-directed conventional seismic profile with a channel (a); corresponding attenuation anomaly profile (b); corresponding geological profile (c). The attenuation of the channel sandstone represents an approximately 110 m gas reservoir in total based on the forward model. The location of the Section CC′ is shown in Fig. 1b, and the abnormal range for aa′ and bb′ is shown in Figs 15a and c.
By adjusting the color scale range of the anomalous attenuation body, the section anomaly (Fig. 17b) was the closest to the forward modeling sandstone layer number and thickness (Fig. 16), and the amplitude of the attenuation anomaly at this time was read as 16 000 (dimensionless). The time-domain thickness of an abnormal body with an amplitude greater than 16 000 (dimensionless) was extracted as the distribution range of the gas reservoir (Figs 15b, d). The thickness values were basically consistent with the forward model results, i.e., 60 m for the Huangliu Formation and 50 m for the Sanya Formation (Fig. 17c).
5.2.3
Types of traps related to channels
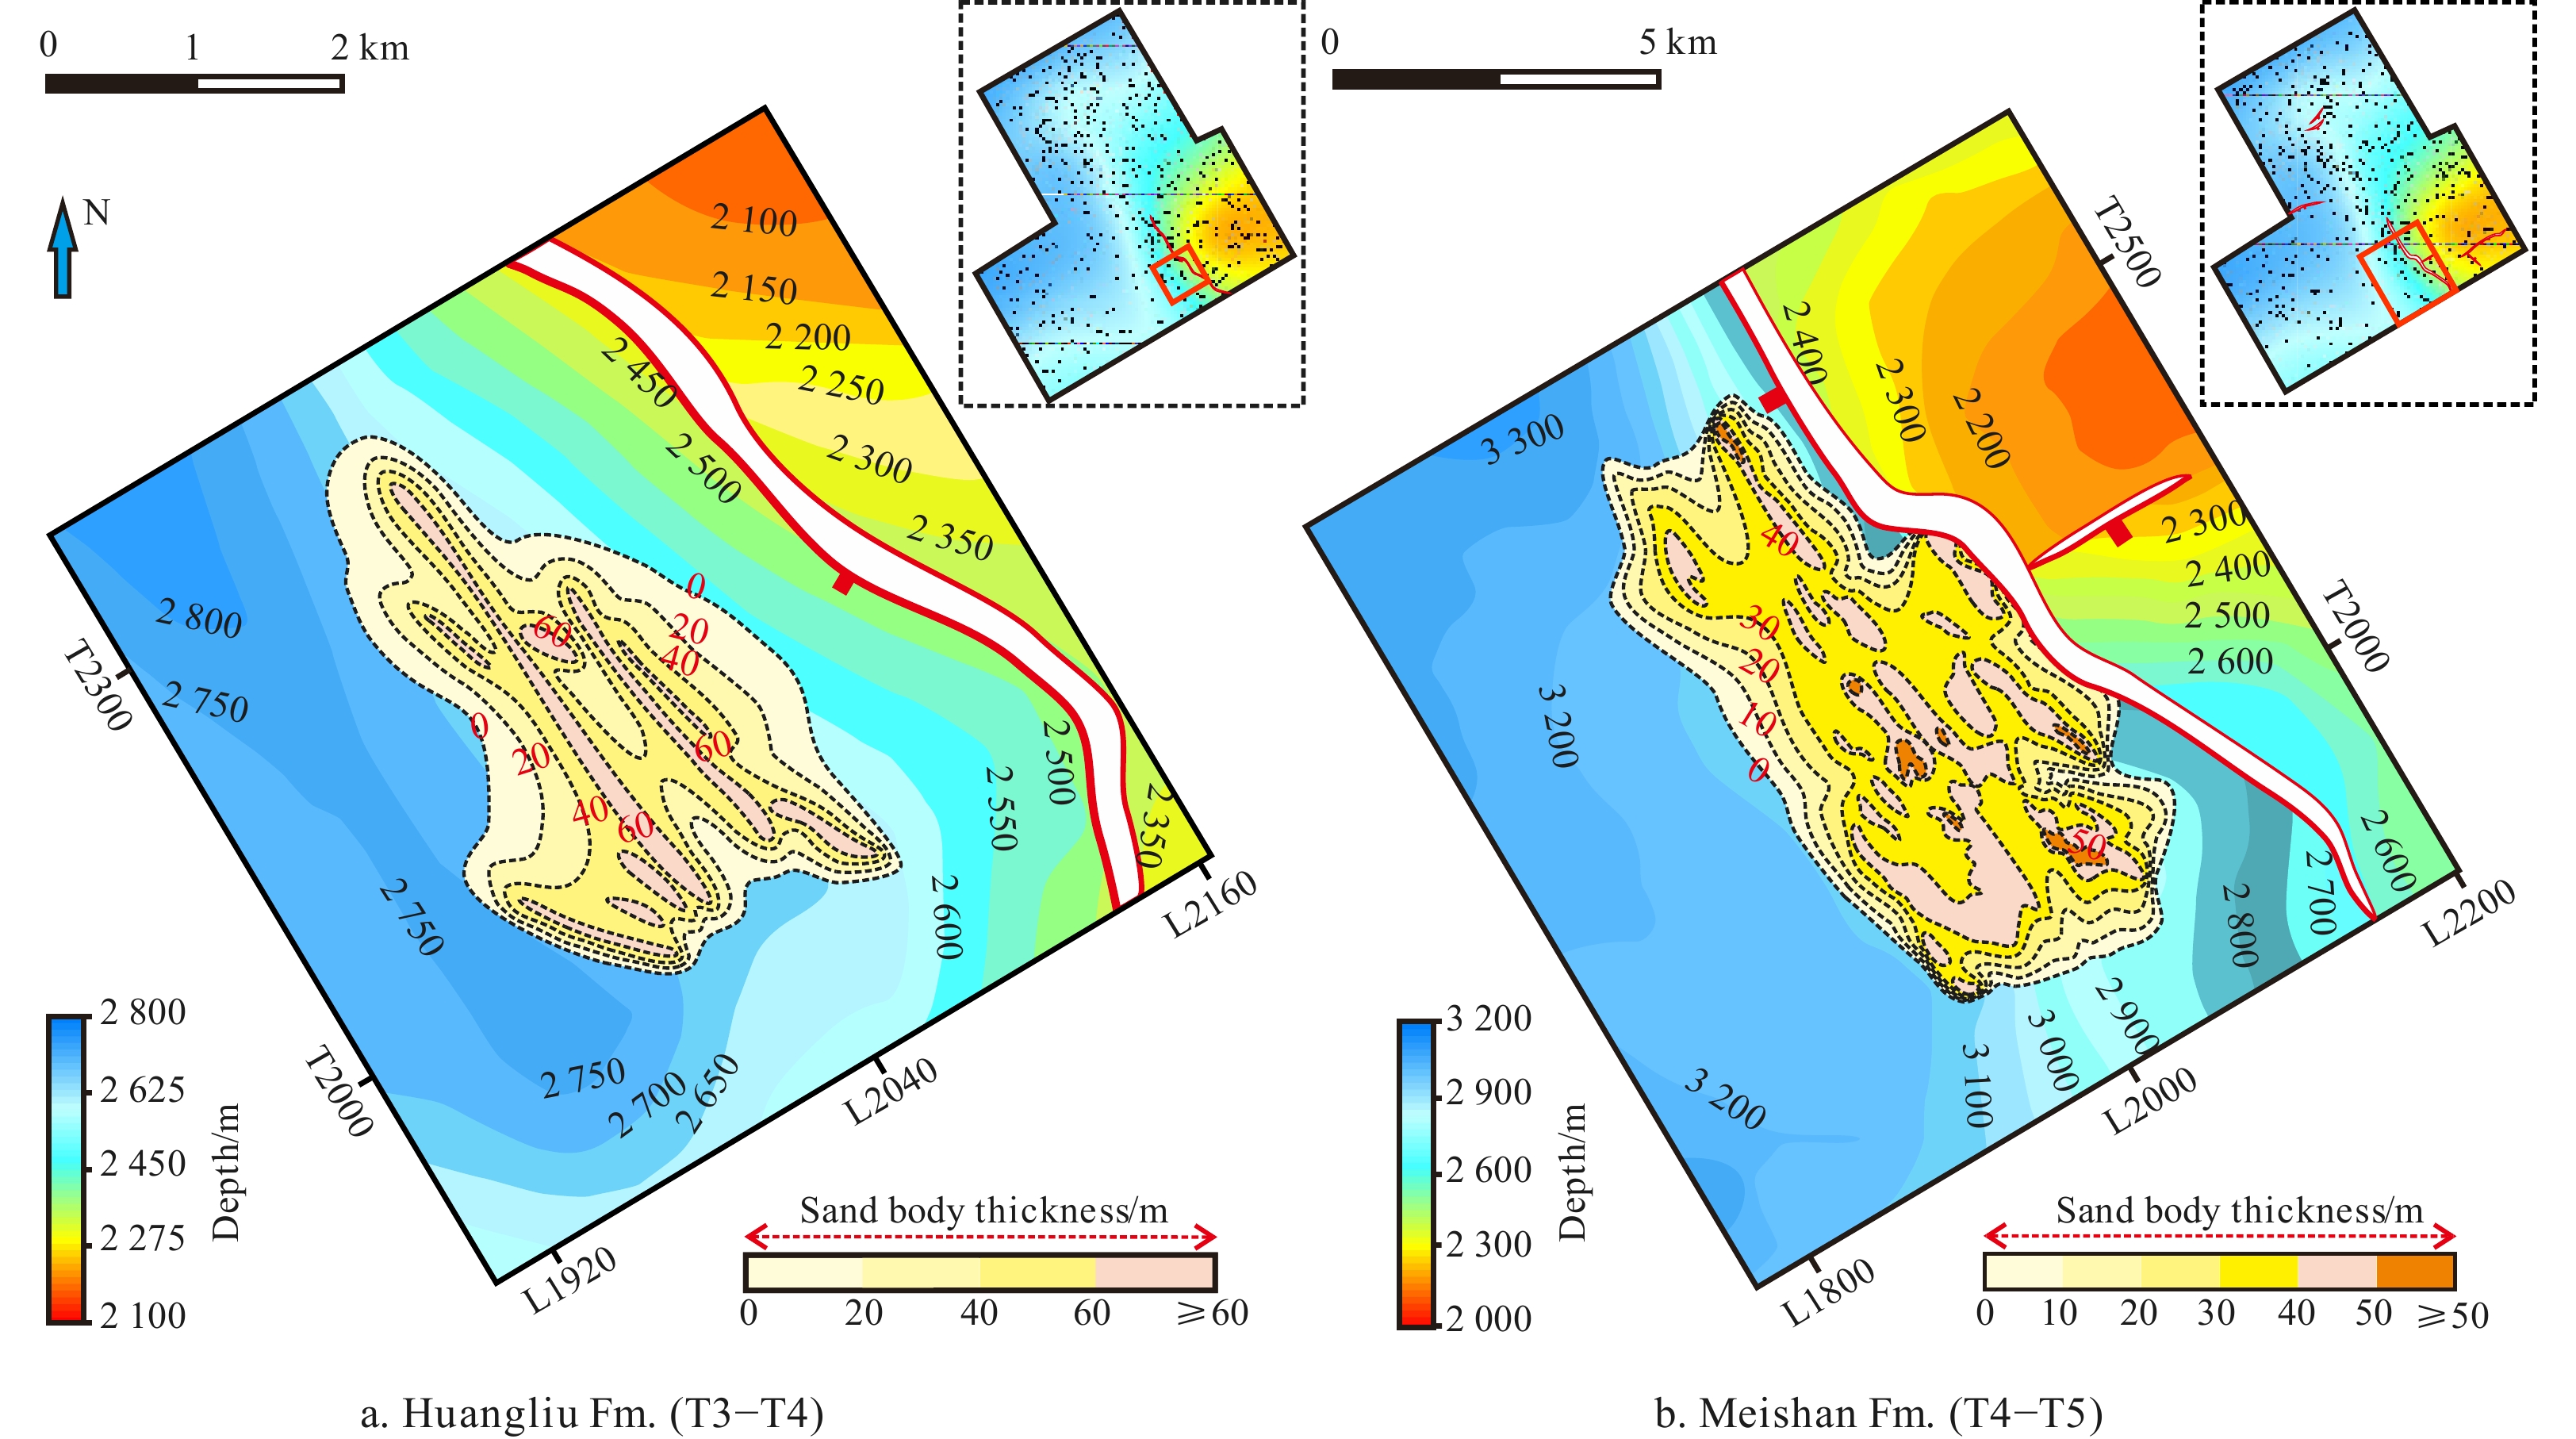
Thickness maps of the gas reservoirs were drawn according to the equal interval interpolation method (Fig. 18). Superposing the abnormal attenuation sandstone reservoir thickness map with the sandstone top surface structural map in the upper reaches of the channel revealed that the gas reservoir boundaries of the Meishan Formation and Huangliu Formation intersected with the structural contours and were located at the high position of the fault-nosing structure on the west side of the Yuzhuojiao Fault and the upper reaches of the channel. The channel sand bodies of the Huangliu Formation are pinched out in all directions and belong to the lithologic lens trap (Fig. 18a). The channel sand bodies of the Meishan Formation are pinched out in the north, west and south directions, and the eastward updip direction is limited by the NNW-trending fault, which indicates that the trap type may be a composite trap controlled by fault nosing and the boundaries of channel sand bodies (Fig. 18b).
Figure
18.
Superposition map of gas reservoir thickness and top surface structure of the Huangliu Formation (a) and Meishan Formation (b) for the upper reaches of the Huaguang Channel.
These results indicate that (1) the HGC controls the distribution of sand bodies, (2) multistage channel sandstones (Meishan Formation and Huangliu Formation) show gas-bearing attenuation anomalies, and (3) the possible channel gas reservoirs are controlled by the high nose structure in the upper reaches, similar to the LS22 low-amplitude anticline trap in the Central Canyon Channel (Wang, 2012; Wang et al., 2016). The channel-related traps are close to the Huaguangjiao and Yuzhuojiao sags with good hydrocarbon sources. The boundary fault links the hydrocarbon source rocks and the channel reservoirs, and the overlying large weak reflection mudstone serves as the regional caprock.
5.3
Relationship between submarine channels in the western QDNB
During the Himalayan Movement, the collision between the Indian Plate and the Paleo-Asian Plate led to the rapid uplift of the Qinghai-Tibet Plateau and exposure of the Yongle Uplift, which provided a large supply of terrigenous detritus from the Red River and Lanjiang River in the north and Xisha in the south to the SCS deepwater basin during the passive continental margin stage of the Miocene. The crustal uplift caused by the collision also led to a significant drop in sea level and shelf erosion in the region (Li et al., 2013). The combined action of these factors controlled the formation and development of the Yinggehai Channel in the northwestern SCS, the QDNB Central Canyon channel in the north and HGC in the south in the late Miocene, which became the “golden age” of submarine channel formation.
The upper reaches of the HGC are adjacent to the Yongle Uplift of the Xisha Islands, and the upper reaches of the Central Canyon Channel are the Red River Delta. The three channels extend along the lowest point of paleotectonics and paleogeomorphology. The HGC extends along the axis of the lowest point of the paleofault trough, the Central Canyon Channel runs parallel to the shoreline along the foot of the continental slope, and the Yinggehai Channel extends along the secondary paleogroove on the Yingdong slope. The Central Canyon Channel and HGC are deep-water gravity flow deposits and the upstream transition into the (fan) delta. All of the channels are filled with sand and mud interbeds, and large channel sandstone reservoirs developed. However, there are the following differences in scale, development period, provenance direction and controlling factors:
(1) The length of HGC in the peak period is approximately one tenth of the Central Canyon Channel, the average width is approximately one fifth of the Central Canyon Channel, and the average filling depth is less than the Central Canyon (Figs 1 and 3–5).
(2) The Central Canyon Channel developed from the late Miocene Huangliu Formation to the early Pliocene Yinggehai Formation, and the HGC developed from the late Middle Miocene Meishan Formation to the late Pliocene Yinggehai Formation, which is earlier and longer than the Central Canyon Channel. Their developmental periods overlapped in the late Miocene. During this period, the decline in global relative sea level was the most severe (corresponding to the T4 seismic interface), and the channel undercutting feature was also the most obvious.
(3) The provenance of the Central Canyon Channel is complex and large-scale, primarily from the Red River and Lanjiang systems in the west, supplemented by the provenance from Hainan Island on the northern continental slope (Zhu et al., 2009; Gong et al., 2011; Wang, 2012; Li et al., 2013; Su et al., 2014; Huang et al., 2017). The sediment source of HGC was relatively singular and small in scale, primarily from the Xisha Yongle Uplift in the south (Wang et al., 2021).
(4) The Central Canyon Channel is distributed south of the continental slope and the low-lying areas of the deep-water basin, which is similar to the typical turbidite channel, and its distribution is primarily controlled by gravity and topography (Fig. 1). The distribution and extension of multistage HGC are closely related to fault (or fault trough) activities (Figs 10 and 11). The NW-trending fault trough formed at the lowest part of the downthrown side provides accommodation space for the distribution of HGC sand bodies, which significantly controls the distribution and extension of the channel.
6.
Conclusions
(1) The HGC is located in the west-dipping middle Miocene to Pliocene strata in the deep-water area of the southwestern QDNB, and it flows along the downthrown side of the NNW-striking normal fault from the provenance of the Yongle Uplift in the south. The strong amplitude reflection of the channel indicates the interbedded fillings of sandstone and mudstone, which were formed by the lateral migration and vertical amalgamation of multistage channel turbidite sandstones.
(2) The HGC is nearly perpendicular to the Central Canyon but much smaller in scale and earlier in age. It is not a branch of the Central Canyon. Controlled by the coupling of tectonic movements, fault activation, RSCs and provenance supply of the Xisha Yongle Uplift, the channel experienced four stages: the incubation stage at the end of the Sanya Formation (T52–T5), the embryonic stage of the Meishan Formation (T5–T4), the peak stage of the Huangliu Formation (T4–T3) and the decline stage of the Yinggehai Formation (T3–T2). The channel migrated laterally approximately 4.5 km northward. In its peak stage, the channel extended straight approximately 42.5 km. As the relative sea level fell during deposition of the early Huangliu Formation (10.5 Ma) and there was an abundant supply of the Xisha Uplift provenance, the channel was filled with three progradational sand bodies. These sand bodies show narrow and approximately parallel strip distributions in the early stage and fan-shaped and continuous distributions in the later stage.
(3) Two lithologic and composite traps formed on a fault-nosing structure in the upper reaches of the HGC. Seismic attenuation gas detection indicates the existence of an approximately 110 m gas reservoir in which 60 m belongs to the Huangliu Formation and the other 50 m belongs to the Meishan Formation. They are adjacent and fault-linked to mature hydrocarbon-generating sags covered by large weak reflection mudstone caprocks, which suggests promising gas exploration potential.
Allen C R, Gillespie A R, Yuan Han, et al. 1984. Red River and associated faults, Yunnan Province, China: quaternary geology, slip rates, and seismic hazard. GSA Bulletin, 95(6): 686–700. doi: 10.1130/0016-7606(1984)95<686:rraafy>2.0.co;2
Amy L A, Peakall J, Talling P J. 2005. Density- and viscosity-stratified gravity currents: insight from laboratory experiments and implications for submarine flow deposits. Sedimentary Geology, 179(1–2): 5–29,
Anderson K S, Graham S A, Hubbard S M. 2006. Facies, architecture, and origin of a reservoir-scale sand-rich succession within submarine canyon fill: insights from Wagon Caves Rock (Paleocene), Santa Lucia Range, California, U. S. A. Journal of Sedimentary Research, 76(5): 819–838. doi: 10.2110/jsr.2006.066
Bouma A H. 2007. Key controls on the characteristics of turbidite systems. Geological Society, London, Special Publications, 222(1): 9–22,
Brouwer F G C, Welsh A, Connolly D L, et al. 2008. High frequencies attenuation and low frequency shadows in seismic data caused by gas chimneys, Onshore Ecuador. In: Proceedings of the 70th EAGE Conference and Exhibition Incorporating SPE EUROPEC 2008. Rome: European Association of Geoscientists & Engineers
Carcione J M, Qadrouh A N, Perroud H, et al. 2018. Seismic attenuation, normal moveout stretch, and low-frequency shadows underlying bottom simulating reflector events. Geophysical Prospecting, 66(5): 857–871. doi: 10.1111/1365-2478.12623
Chen Chih-Sung, Jeng Yih. 2011. Nonlinear data processing method for the signal enhancement of GPR data. Journal of Applied Geophysics, 75(1): 113–123. doi: 10.1016/j.jappgeo.2011.06.017
Chen Hui, Xie Xinong, Van Rooij D, et al. 2014. Depositional characteristics and processes of alongslope currents related to a seamount on the northwestern margin of the Northwest Sub-Basin, South China Sea. Marine Geology, 355: 36–53. doi: 10.1016/j.margeo.2014.05.008
Chen Yang, Zhang Jianxin, Huang Can, et al. 2019. Filling evolution characteristics of the axial gravity channel in Huangliu Formation in Yinggehai Basin. Journal of Northeast Petroleum University (in Chinese), 43(6): 23–32, 61
Clark J D, Pickering K T. 1996. Architectural elements and growth patterns of submarine channels: application to hydrocarbon exploration. AAPG Bulletin, 80(2): 194–220. doi: 10.1306/64ed878c-1724-11d7-8645000102c1865d
Feng Congjun, Yao Xingzong, Yang Haizhang, et al. 2021. Source-sink System and Sedimentary Model of Progradational Fan Delta Controlled by Restricted Ancient Gully: An Example in the Enping Formation in the Southern Baiyun Sag, Pearl River Mouth Basin, Northern South China Sea. Acta Geologica Sinica (English edition), 95(1): 232–247. doi: 10.1111/1755-6724.14627
Gong Chenglin, Li Dongwei, Qi Kun, et al. 2020. Flow processes and sedimentation in a straight submarine channel on the Qiongdongnan margin, northwestern South China Sea. Journal of Sedimentary Research, 90(10): 1372–1388. doi: 10.2110/jsr.2020.68
Gong Chenglin, Wang Yingmin, Zhu Weilin, et al. 2011. The central submarine canyon in the Qiongdongnan Basin, northwestern South China Sea: architecture, sequence stratigraphy, and depositional processes. Marine and Petroleum Geology, 28(9): 1690–1702. doi: 10.1016/j.marpetgeo.2011.06.005
Green A N. 2009. Palaeo-drainage, incised valley fills and transgressive systems tract sedimentation of the northern KwaZulu-Natal continental shelf, South Africa, SW Indian Ocean. Marine Geology, 263(1–4): 46–63,
Green A N, Dladla N, Garlick G L. 2013. Spatial and temporal variations in incised valley systems from the Durban continental shelf, KwaZulu-Natal, South Africa. Marine Geology, 335: 148–161. doi: 10.1016/j.margeo.2012.11.002
Hall R, van Hattum M W A, Spakman W. 2008. Impact of India-Asia collision on SE Asia: the record in Borneo. Tectonophysics, 451(1–4): 366–389,
Hampson G J, Davies S J, Elliott T, et al. 2005. Incised valley fill sandstone bodies in Upper Carboniferous fluvio-deltaic strata: recognition and reservoir characterization of southern North Sea analogues. Geological Society, London, Petroleum Geology Conference Series, 5(1): 771–788,
Haq B U, Hardenbol J, Vail P R. 1987. Chronology of fluctuating sea levels since the Triassic. Science, 235(4793): 1156–1166. doi: 10.1126/science.235.4793.1156
Harris P T, Whiteway T. 2011. Global distribution of large submarine canyons: geomorphic differences between active and passive continental margins. Marine Geology, 285(1–4): 69–86,
He Yunlong, Xie Xinong, Kneller B C, et al. 2013. Architecture and controlling factors of canyon fills on the shelf margin in the Qiongdongnan Basin, northern South China Sea. Marine and Petroleum Geology, 41: 264–276. doi: 10.1016/j.marpetgeo.2012.03.002
Huang Heting, Huang Baojia, Huang Yiwen, et al. 2017. Condensate origin and hydrocarbon accumulation mechanism of the deepwater giant gas field in western South China Sea: a case study of Lingshui 17–2 gas field in Qiongdongnan Basin. Petroleum Exploration and Development, 44(3): 409–417. doi: 10.1016/S1876-3804(17)30047-2
Khain V E, Polyakova I D. 2008. Oil and gas potential of continental margins of the Pacific Ocean. Lithology and Mineral Resources, 43(1): 81–92. doi: 10.1134/S0024490208010082
Lei Chao, Ren Jianye, Pei Jianxiang, et al. 2011. Tectonic framework and multiple episode tectonic evolution in deepwater area of Qiongdongnan Basin, northern continental margin of South China Sea. Earth Science—Journal of China University of Geosciences (in Chinese), 36(1): 151–162. doi: 10.3799/dqkx.2011.016
Li Chao, Chen Guojun, Zhou Qianshan, et al. 2021. Seismic geomorphology of three types of deepwater fans and their relationship with slope morphology: Qiongdongnan Basin, northern South China Sea. Marine and Petroleum Geology, 124: 104814. doi: 10.1016/j.marpetgeo.2020.104814
Li Xiangquan, Fairweather L, Wu Shiguo, et al. 2013. Morphology, sedimentary features and evolution of a large palaeo submarine canyon in Qiongdongnan basin, northern South China Sea. Journal of Asian Earth Sciences, 62: 685–696. doi: 10.1016/j.jseaes.2012.11.019
Li Chunfeng, Li Jiabiao, Ding Weiwei, et al. 2015. Seismic stratigraphy of the central South China Sea basin and implications for neotectonics. Journal of Geophysical Research, 120(3): 1377–1399. doi: 10.1002/2014JB011686
Li Sitian, Lin Changsong, Zhang Qiming, et al. 1999. Episodic rifting of continental marginal basins and tectonic events since 10 Ma in the South China Sea. Chinese Science Bulletin, 44(1): 10–23. doi: 10.1007/bf03182877
Li Anqi, Yang Xibing, Fan Caiwei, et al. 2020. Sandy debris flow sedimentary characteristics and patterns in the Meishan Formation of northern Lingshui Sag, Qiongdongnan Basin. Journal of Physics: Conference Series, 1549: 022009. doi: 10.1088/1742-6596/1549/2/022009
Li Qianyu, Zhong Guangfa, Tian Jun. 2009. Stratigraphy and sea level changes. In: Wang Pinxian, Li Qianyu, eds. The South China Sea: Paleoceanography and Sedimentology. Dordrecht: Springer, 75–170,
Liu Xiaofeng, Sun Zhipeng, Liu Xinyu, et al. 2018. Chronostratigraphic framework based on Micro-paleontological data from drilling LS33a in deep water area of northern South China Sea. Acta Sedimentologica Sinica (in Chinese), 36(5): 890–902. doi: 10.14027/j.issn.1000-0550.2018.069
Lu Hongying, Cheng Bingjie, Shen Zhongmin, et al. 2013. Gas and water reservoir differentiation by time-frequency analysis: a case study in southwest China. Acta Geodaetica et Geophysica, 48(4): 439–450. doi: 10.1007/s40328-013-0031-7
Lu Yintao, Li Wei, Wu Shiguo, et al. 2018. Morphology, architecture, and evolutionary processes of the Zhongjian Canyon between two carbonate platforms, South China Sea. Interpretation, 6(4): SO1–SO15. doi: 10.1190/INT-2017-0222.1
Lüdmann T, Wong H K. 1999. Neotectonic regime on the passive continental margin of the northern South China Sea. Tectonophysics, 311(1–4): 113–138,
Mayall M, Jones E, Casey M. 2006. Turbidite channel reservoirs—key elements in facies prediction and effective development. Marine and Petroleum Geology, 23(8): 821–841. doi: 10.1016/j.marpetgeo.2006.08.001
McHugh C M G, Damuth J E, Mountain G S. 2002. Cenozoic mass-transport facies and their correlation with relative sea-level change, New Jersey continental margin. Marine Geology, 184(3–4): 295–334,
Oliveira A, Santos A I, Rodrigues A, et al. 2007. Sedimentary particle distribution and dynamics on the Nazaré canyon system and adjacent shelf (Portugal). Marine Geology, 246(2–4): 105–122,
Pan Guangchao, Han Guangming, Song Ruiyou, et al. 2012. New seismic facies style of channels in Yinggehai Basin and gas-bearing prediction. Oil Geophysical Prospecting (in Chinese), 47(6): 984–989
Pu Renhai, Han Qiang, Xu Pengye. 2021. Cases of generalized low-frequency shadows of tight gas reservoir. Interpretation, 9(4): B65–B76. doi: 10.1190/int-2020-0243.1
Puga-Bernabéu Á, Martín J M, Braga J C. 2008. Sedimentary processes in a submarine canyon excavated into a temperate-carbonate ramp (Granada Basin, southern Spain). Sedimentology, 55(5): 1449–1466. doi: 10.1111/j.1365-3091.2008.00952.x
Qiu Xuelin, Ye Sanyu, Wu Shimin, et al. 2001. Crustal structure across the Xisha trough, northwestern South China Sea. Tectonophysics, 341(1–4): 179–193,
Ryseth A, Fjellbirkeland H. 1995. Differentiation of incised valley systems from mobile streams: some examples from the oseberg field, Norwegian North Sea. Norwegian Petroleum Society Special Publications, 5: 51–73. doi: 10.1016/S0928-8937(06)80063-9
Su Ming, Xie Xinong, Xie Yuhong, et al. 2014. The segmentations and the significances of the Central Canyon System in the Qiongdongnan Basin, northern South China Sea. Journal of Asian Earth Sciences, 79: 552–563. doi: 10.1016/j.jseaes.2012.12.038
Sun Zhen, Zhou Di, Zhong Zhihong, et al. 2003. Experimental evidence for the dynamics of the formation of the Yinggehai Basin, NW South China Sea. Tectonophysics, 372(1–2): 41–58,
Tang Xiaoyin, Hu Shengbiao, Zhang Gongcheng, et al. 2014. Geothermal characteristics and hydrocarbon accumulation of the northern marginal basins, South China Sea. Chinese Journal of Geophysics, 57(1): 64–78. doi: 10.1002/cjg2.20084
Tapponnier P, Peltzer G, Armijo R. 2007. On the mechanics of the collision between India and Asia. Geological Society Special Publication, 19(1): 115–157. doi: 10.1144/GSL.SP.1986.019.01.07
Tinterri R, Drago M, Consonni A, et al. 2003. Modelling subaqueous bipartite sediment gravity flows on the basis of outcrop constraints: first results. Marine and Petroleum Geology, 20(6–8): 911–933,
Tsai Ching-Hui, Hsu Shu-Kun, Yeh Yi-Ching, et al. 2004. Crustal thinning of the northern continental margin of the South China Sea. Marine Geophysical Researches, 25(1–2): 63–78,
Wang Zhenfeng. 2012. Important deepwater hydrocarbon reservoirs: the Central Canyon system in the Qiongdongnan Basin. Acta Sedimentologica Sinica (in Chinese), 30(4): 646–653
Wang Bin, Lü Fuliang, Li Shuang, et al. 2021. A buried submarine canyon in the northwestern South China Sea: architecture, development processes and implications for hydrocarbon exploration. Acta Oceanologica Sinica, 40(2): 29–41. doi: 10.1007/s13131-021-1751-0
Wang Zhenfeng, Sun Zhipeng, Zhang Yingzhao, et al. 2016. Distribution and hydrocarbon accumulation mechanism of the giant deepwater Central Canyon gas field in Qiongdongnan Basin, northern South China Sea. China Petroleum Exploration (in Chinese), 21(4): 54–64
Wang Weiwei, Wang Dawei, Sun Jin, et al. 2020. Evolution of deepwater turbidite bedforms in the Huaguang channel–lobe transition zone revealed by 3D seismic data in the Qiongdongnan Basin, South China Sea. Geomorphology, 370: 107412. doi: 10.1016/j.geomorph.2020.107412
Wu Xiaochuan, Pu Renhai, Xue Huaiyan, et al. 2019. Detection and analysis to gas-bearing of seafloor fans in the Zhuhai Formation of the Jieyang Sag, Pearl River Mouth Basin. Chinese Journal of Geophysics (in Chinese), 62(7): 2732–2747
Wu Shiguo, Yang Zhen, Wang Dawei, et al. 2014. Architecture, development and geological control of the Xisha carbonate platforms, northwestern South China Sea. Marine Geology, 350: 71–83. doi: 10.1016/j.margeo.2013.12.016
Wu Shiguo, Yuan Shengqiang, Zhang Gongcheng, et al. 2009. Seismic characteristics of a reef carbonate reservoir and implications for hydrocarbon exploration in deepwater of the Qiongdongnan Basin, northern South China Sea. Marine and Petroleum Geology, 26(6): 817–823. doi: 10.1016/j.marpetgeo.2008.04.008
Wynn R B, Cronin B T, Peakall J. 2007. Sinuous deep-water channels: genesis, geometry and architecture. Marine and Petroleum Geology, 24(6–9): 341–387,
Xie Xinong, Müller R D, Li Sitian, et al. 2006. Origin of anomalous subsidence along the northern South China Sea margin and its relationship to dynamic topography. Marine and Petroleum Geology, 23(7): 745–765. doi: 10.1016/j.marpetgeo.2006.03.004
Xie Xinong, Müller R D, Ren Jianye, et al. 2008. Stratigraphic architecture and evolution of the continental slope system in offshore Hainan, northern South China Sea. Marine Geology, 247(3–4): 129–144,
Yang Xibing, Fu Heng, He Xiaohu, et al. 2019. Cenozoic sedimentary systems and their tectonic-sedimentary evolution in southern uplift zone of the Qiongdongnan Basin. Sedimentary Geology and Tethyan Geology (in Chinese), 39(3): 1–10
Yang Fengli, Sun Zhuan, Zhou Zuyi, et al. 2012. The evolution of the South China Sea Basin in the Mesozoic–Cenozoic and its significance for oil and gas exploration: a review and overview. In: Gao Dengliang, ed. Tectonics and Sedimentation: Implications for Petroleum Systems. Tulsa: American Association of Petroleum Geologists, 397–418,
Yuan Shengqiang, Lü Fuliang, Wu Shiguo, et al. 2009. Seismic stratigraphy of the Qiongdongnan deep sea channel system, northwest South China Sea. Chinese Journal of Oceanology and Limnology, 27(2): 250–259. doi: 10.1007/s00343-009-9177-0
Zhang Gongcheng, Feng Congjun, Yao Xingzong, et al. 2021. Petroleum Geology in Deepwater Settings in a Passive Continental Margin of a Marginal Sea: A Case Study from the South China Sea. Acta Geologica Sinica (English edition), 95(1): 1–20. doi: 10.1111/1755-6724.14621
Zhu Weilin, Huang Baojia, Mi Lijun, et al. 2009. Geochemistry, origin, and deep-water exploration potential of natural gases in the Pearl River Mouth and Qiongdongnan basins, South China Sea. AAPG Bulletin, 93(6): 741–761. doi: 10.1306/02170908099
Zhu Weilin, Zhong Kai, Li Youchuan, et al. 2012. Characteristics of hydrocarbon accumulation and exploration potential of the northern South China Sea deepwater basins. Chinese Science Bulletin, 57(24): 3121–3129. doi: 10.1007/s11434-011-4940-y
Shuo Chen, Donghui Jiang, Renhai Pu, Yunwen Guan, Xiaochuan Wu, Tianyu Ji, Chuang Liu. Genesis, evolution and reservoir identification of a Neogene submarine channel in the southwestern Qiongdongnan Basin, South China Sea[J]. Acta Oceanologica Sinica, 2023, 42(5): 57-78. doi: 10.1007/s13131-022-2071-8
Shuo Chen, Donghui Jiang, Renhai Pu, Yunwen Guan, Xiaochuan Wu, Tianyu Ji, Chuang Liu. Genesis, evolution and reservoir identification of a Neogene submarine channel in the southwestern Qiongdongnan Basin, South China Sea[J]. Acta Oceanologica Sinica, 2023, 42(5): 57-78. doi: 10.1007/s13131-022-2071-8
Figure 1. Map of the regional location of the study area, the location of the relevant area and the division of tectonic units in the Qiongdongnan Basin. a. The background map is the current bathymetric map of the South China Sea, the yellow area is the location of the study area, and the yellow dotted line is the Central Canyon Channel. b. Seafloor isochronic map of the 3D seismic survey and the Huaguang Channel distribution of the Huangliu Formation. c. Structural unit map of the Qiongdongnan Basin, with the distribution of typical submarine channels and gas fields in the South China Sea. BJ: Beijiao Uplift, BJS: Beijiao Sag, CC: Changchang Sag, HGJ: Huaguangjiao Sag, LDLS: Ledong-Lingshui Sag, LN: Lingnan Low Uplift, LS: Lingshui Uplift, ZRMB: Zhujiang River Mouth Basin, QDNB: Qiongdongnan Basin, SD: Songdong Sag, SN: Songnan Uplift, ST: Songtao Uplift, SX: Songxi Sag, YB: Yabei Sag, YC: Yacheng Uplift, YGHB: Yinggehai Basin, YL: Yongle Sag, YN: Yanan Low Uplift, YNS: Yanan Sag, YZJ: Yuzhuojiao Sag, ZJ: Zhongjian Uplift.
Figure 2. Lithologic column, Well LS33-1-1 and cross-well seismic profile in the northern part of the study area (modified from Liu et al. (2018)).
Figure 3. Morphological map of the Central Canyon Channel and seismic profiles across the different positions of the channel in the Qiongdongnan Basin.
Figure 4. Superposition map of the Huaguang Channel (HGC) at different stages and with seismic profiles of the upper, middle and lower reaches of the cross-channel in the southwestern Qiongdongnan Basin. N1s: Sanya Formation; N1m: Meishan Formation; N1h: Huangliu Formation; N2y: Yinggehai Formation.
Figure 5. Seismic profiles of the cross-channel in the southwestern Qiongdongnan Basin. The positions of the sections are shown in Fig. 4a. N1s: Sanya Formation; N1m: Meishan Formation; N1h: Huangliu Formation; N2y: Yinggehai Formation; Mz: Mesozoic basement.
Figure 6. Root mean square (RMS) amplitude maps and sedimentary facies evolution map of the four developed stages (T52–T2) of the Huaguang Channel.
Figure 7. Stratigraphic thickness (paleotectonics) and structural evolution profiles of each period of channel evolution. The position of Section AA′ is shown in Fig. 1b. a. The stratigraphic thickness map of different periods related to the development of the channel. The yellow low-value area in the middle of the thickness map of the Meishan Formation is not a paleotectonic uplift but a small residual thickness caused by channel incision. b. The Cenozoic tectonic evolution profiles of the NE-trending cross-section in the study area drawn using the “top-surface-flattening” method, in which the red sand body suggests a submarine fan in the Sanya Formation, and the yellow suggests the channel sand body in the embryonic stage of the Meishan Formation, the peak stage of the Huangliu Formation and the decline stage of the Yinggehai Formation. E2l: Lingtou Formation; E3y: Yacheng Formation; E3l: Lingshui Formation; Mz: Mesozoic basement; N1s: Sanya Formation; N1m: Meishan Formation; N1h: Huangliu Formation; N2y: Yinggehai Formation.
Figure 8. Interpretation of three progradational seismic reflections developed in the channel of the late Huangliu Formation (T31−T3). a. Seismic profile of the T3 horizon flattened along the NW channel direction. b. Profile and sequence division of three progradational bodies in T31−T3. c. Superimposition map of three progradation bodies, in which yellow is Progradation I, pink is Progradation II, green is Progradation III, and the location of Section BB′ is shown inFig. 1b.
Figure 9. RMS amplitude and sand body thickness evolution maps of three progradational events identified in the peak stage of channel development in the late Huangliu Formation (T31–T3).
Figure 10. Fault distribution maps of the top basement and top fault depression and the relative seismic section. The location of the section is shown in Figs 1b and 10c.
Figure 11. Fault maps, isochronous structural maps and isopach maps of channel-related stratigraphy showing the evolution from the late stage of the early Miocene Sanya Formation to the late Miocene Huangliu Formation (T52−T3) in the deep-water 3D area of southern Qiongdongnan Basin.
Figure 12. Changes in NW-striking Yuzhuojiao fault activity in the middle of the study area. a. NE-directed seismic profile of the cross-cutting channel. b. Difference in the stratigraphic thickness of the Sanya Formation and Yinggehai Formation between the upper and lower sides. The thickness difference between the upthrown and downthrown sides of the Yuzhuojiao fault shows that the fault activity gradually weakened over time and is not related to the thickest and longest channel sandstone during the deposition of the Huangliu Formation.
Figure 14. Comparisons before and after channel development and genetic mechanism model of the Huangliu Formation. The paleostructures of T4 and T31 were studied using the equilibrium profile method of flattening T31 and T3, respectively. See Fig. 4a for the position of the profile. The peak period HGC developed in the lowest position of the regional paleostructure when the sea level of T31–T4 gradually rose and the provenance of the southern uplift was in large supply.
Figure 15. Abnormal attenuation maps of gas detection and the reservoir thickness map calculated by abnormal amplitudes greater than 16 000 (dimensionless) in the Huangliu (T3−T4) and Meishan (T4−T5) formations in the upper reaches of the Huaguang Channel.
Figure 16. Forward modeling and seismic response profile of the channel in the Yinggehai to Sanya formations. The forward modeling results indicate that the Huangliu Formation develops three layers of 20 m thick gas-bearing sandstone, the Meishan Formation develops one layer of 35 m and one layer of 15 m thick gas-bearing sandstone, and the Sanya Formation develops one layer of 15 m thick gas-bearing sandstone.
Figure 17. A NW-directed conventional seismic profile with a channel (a); corresponding attenuation anomaly profile (b); corresponding geological profile (c). The attenuation of the channel sandstone represents an approximately 110 m gas reservoir in total based on the forward model. The location of the Section CC′ is shown in Fig. 1b, and the abnormal range for aa′ and bb′ is shown in Figs 15a and c.
Figure 18. Superposition map of gas reservoir thickness and top surface structure of the Huangliu Formation (a) and Meishan Formation (b) for the upper reaches of the Huaguang Channel.


 DownLoad:


 DownLoad:


 DownLoad: