College of Marine Geosciences, Ocean University of China, Qingdao 266100, China
2.
Laboratory of Ocean and Coast Geology, Third Institute of Oceanography, Ministry of Natural Resources, Xiamen 361005, China
3.
Fujian Provincial Key Laboratory of Marine Ecological Conservation and Restoration, Xiamen 361005, China
Funds:
The National Natural Science Foundation of China under contract No. 41930538; the Scientific Research Foundation of the Third Institute of Oceanography, Ministry of Natural Resources under contract No. 2019029.
Extreme storm events in coastal zones play significant roles in shaping the morphology of boulder beaches. However, boulder displacement and the geomorphological evolution of boulder beaches driven by different extreme storm events, especially typhoon events, remain poorly understood. Thus, boulder displacement and the geomorphic response on a boulder beach in Fujian, southeastern China, were explored before, during and after a cold wave event (Dec. 1–7, 2020) and before and after Typhoon In-Fa (Jul. 19–27, 2021), a large tropical storm. This was achieved by tracking 42 tagged boulders distributed in the intertidal and supratidal zones using Radio Frequency Identification (RFID) and topographic surveys using real-time kinematic techniques, respectively. The results showed obvious disparities in boulder displacement in different geomorphic zones due to cold wave and typhoon events that were mainly characterized by migration magnitude, range, direction, and mode of transport. The typhoon event led to rapid and substantial changes in the overall morphology of the boulder beach, while the cold wave event impacted the intertidal morphology of the boulder beach to only a small extent. The surrounding structure of boulders, beach slope and beach elevation had a combined dominant effect on boulder displacement under the same extreme event. Hydrodynamic factors (effective wave energy fluxes, incident wave direction, storm surge and water level) had dominant effects on boulder displacement during different extreme events. In terms of a single event, the magnitude of the boulder displacement driven by the typhoon was much greater than that driven by the cold wave. However, considering the frequency and duration of cold waves in winter, the impact of multiple consecutive cold waves on the geomorphology of the boulder beach cannot be ignored in this study area. Alternating and repeated interactions between these two processes constitute the complete geomorphic evolution of the boulder beach. This study contributes to improved predictions of the morphodynamic response of boulder beaches to future storms, especially large tropical storms, and facilitates better coastal management.
In the context of potentially increasing storminess caused by global climate change, coastal erosion is expected to increase globally (Leatherman et al., 2000; Paris et al., 2011; Shu et al., 2019), which will increase the environmental burden in coastal zones and restrict the development of the marine economy (Zhang et al., 2004; Cai et al., 2009; Williams et al., 2018). Boulder beaches, with mean particle sizes over the entire beach greater than 256 mm (Oak, 1984), are mainly distributed along rocky coasts in middle- to high-latitude areas (Hayes, 1967; Emery, 1968; Flemming, 2011). They typically form at the base of sea cliffs (Lorang, 2000) and can be used as natural barriers similar to engineering structures for effectively mitigating storm impacts and coastal erosion (Oak, 1986; Lorang, 2000; Chen et al., 2011).
Clasts on boulder beaches are difficult to move under non-storm conditions (Oak, 1981), whereas extreme storm events, including winter storms, typhoons/hurricanes or tsunamis, play a major role in shaping these beaches (Chen et al., 2011; Green et al., 2016). Existing studies on boulder beaches have focused either on boulder displacement characteristics and morphodynamics of boulder beaches at monthly to yearly timescales (Chen et al., 2011; Gómez-Pazo et al., 2021) or on boulder transport under the influence of a single extreme storm event (Naylor et al., 2016). However, boulder displacement and the morphodynamics of boulder beaches influenced by different extreme events, especially typhoon events, have been poorly understood. Investigations on boulder displacement and geomorphic changes influenced by different extreme storm events can shed light on the geomorphological evolution of boulder beaches. This improved understanding can contribute to more accurate predictions of the morphodynamic response of boulder beaches to future storms (Naylor et al., 2016) and facilitate better coastal management (Hastewell et al., 2020), especially in the context of the predicted increase in storms.
Radio Frequency Identification (RFID) provides a powerful tool for the effective tracking of individual coarse particles (Allan et al., 2006; Dickson et al., 2011; Grottoli et al., 2015, 2019; Sun, 2019; Hastewell et al., 2019, 2020; Gómez-Pazo et al., 2021). This tracing technology can be used to explore the displacements of individual boulders on boulder beaches influenced by different extreme events. In China, natural boulder beaches, mainly located on the southeastern coast (Sun, 2019), are frequently affected by different types of extreme events, including typhoons and cold waves (Zhao and Jiang, 2011). Cold waves, which are a typical strong cold air activity, are characterized by low temperature and strong wind (Qu et al., 2015). Specifically, cold waves that are developed in Bohai Sea and northern Yellow Sea can be considered as unique storms (Feng, 1998). However, cold waves that are captured in other areas of China’s seas, with their weaker intensity, are different from the “winter storms” commonly studied by the international community.
This study aims to understand the differences and similarities in clast displacement and morphological responses of a boulder beach to cold wave and typhoon events and to further reveal the possible controlling factors under the environmental conditions of the southeastern China coast. Accordingly, a boulder beach located in southeastern China was selected to track boulder displacement and investigate beach morphological responses both before and after cold wave and typhoon events using the RFID method. This study provides insight into the understanding of boulder displacement and beach morphological responses driven by different extreme conditions, especially large typhoon events. Serving as a reference for disaster prevention and mitigation, the findings from this study will contribute to the protection of boulder beaches and help improve the management of rocky coasts.
2.
Study area
The Cendu boulder beach is located on Caoyu Island, adjacent to Pingtan Island, off the southeastern coast of China (Figs 1a, b). The bedrock of the study area is igneous and metamorphic rocks of Mesozoic age, of which intrusive rocks of the Yanshan period (predominantly granitic amphibolite) are most widely distributed (Huang et al., 1992). The studied beach, with headlands on both sides (Fig. 1c), is approximately 180 m long and 80 m wide, and its orientation is NW–SE (Fig. 1b). The boulders that compose the boulder beach have intermediate (b-axis) dimensions ranging from 300 mm to 700 mm and are mainly of granitic origin. The slope and sediment types on the transverse section of the beach vary greatly, and the beach is accordingly subdivided into three geomorphic zones. The bottom section has a gentle slope (0°–5°), and the boulders are closely-packed, extremely well-rounded and mainly oval in shape, with a long axis direction nearly parallel to the orientation of the beach (Fig. 2b); this section is called the low boulder-boulder zone (hereafter referred to as the LBBZ). The middle section has a moderate slope (5°–12°) and sporadically scattered boulders surrounded by small gravel or coarse sand (Fig. 2c) and is called the boulder-gravel zone (hereafter referred to as the BGZ). The upper section has a steep slope (8°–20°), and the boulders are well sorted and have a nondirectional arrangement, with little surrounding fine-grained material (Fig. 2c); this section is called the high boulder-boulder zone (hereafter referred to as the HBBZ).
Figure
1.
Location of the study area. a. Study site location denoting tracks of Typhoon In-Fa (red line), Pingtan wave buoy (pink star) and hydrodynamic observation site (pink circle). b. Satellite photograph of Caoyu Island showing the scope of Figs 2a, 5, 6 and 7 (cited from Google Earth). c. Aerial view of Cendu boulder beach from an unmanned aerial vehicle.
Figure
2.
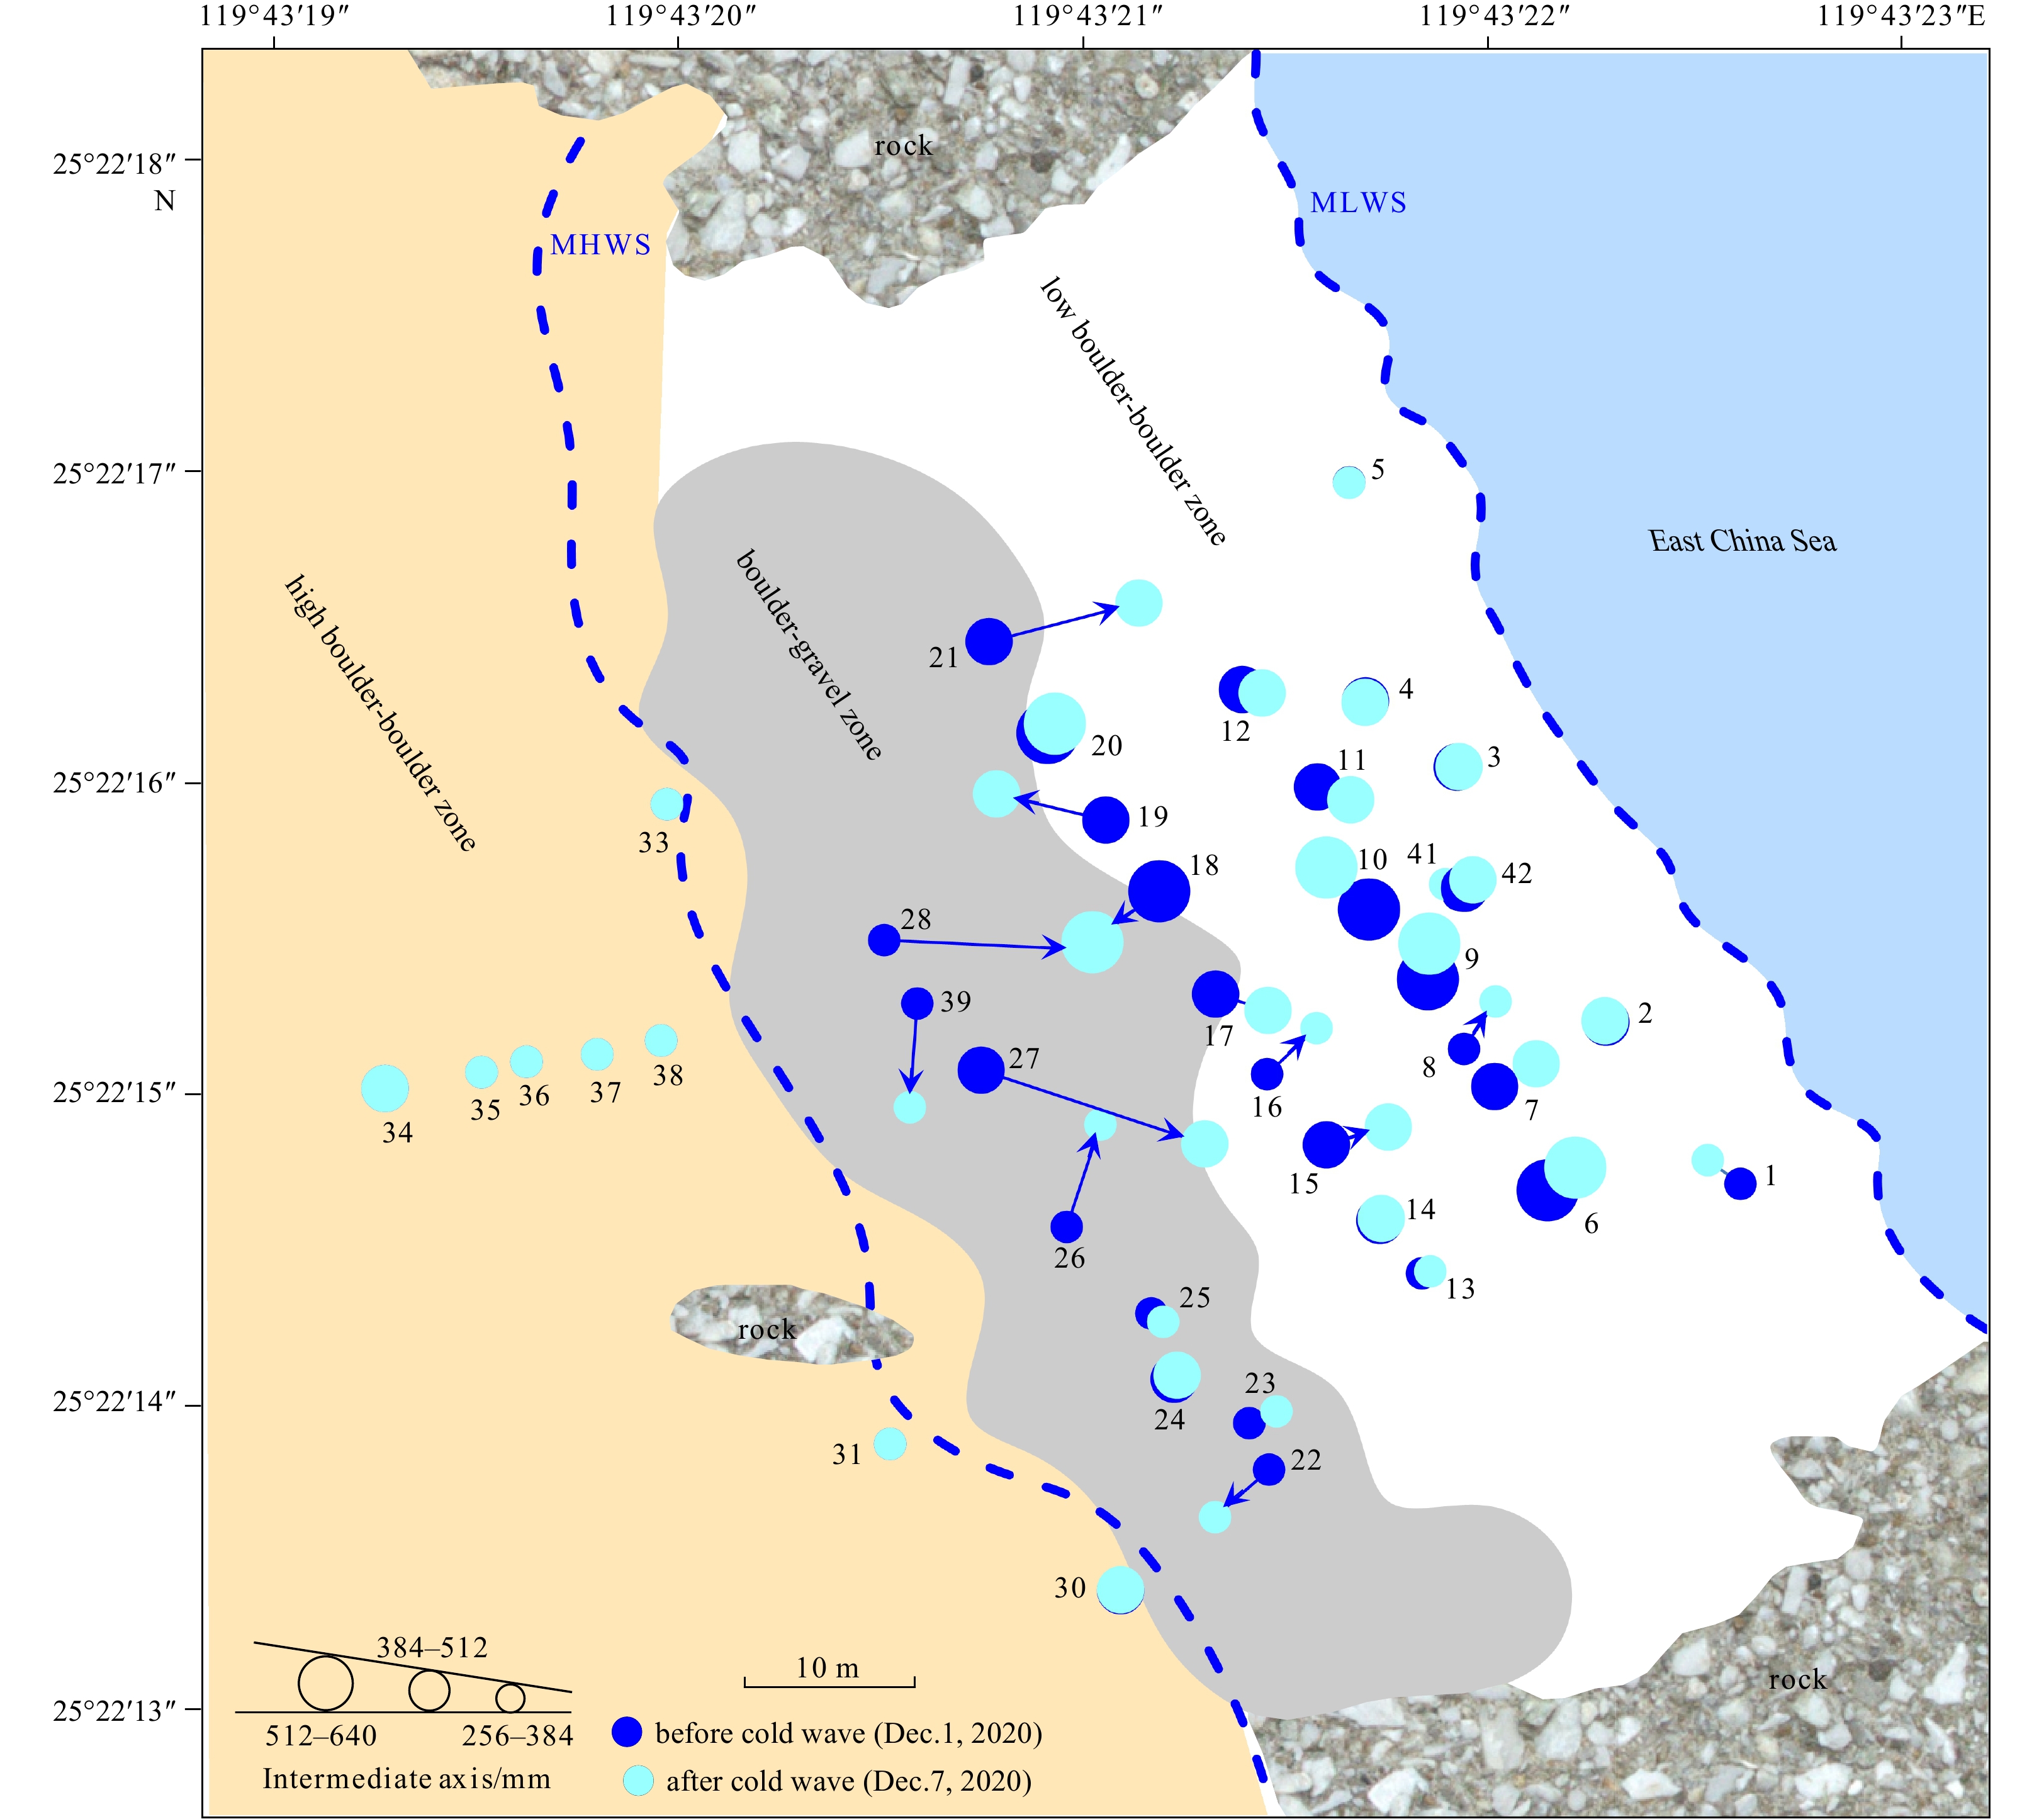
Sketch of the study site with three different geomorphic zones. a. The selected tagged boulders and profiles. Solid circles represent the selected tagged boulders, with 23 pink solid circles in the low boulder-boulder zone, 10 blue solid circles in the boulder-gravel zone and 9 red solid circles in the high boulder-boulder zone. The blue lines represent the selected profiles. b. Boundaries between low boulder-boulder zone and boulder-gravel zone. c. Boundaries between boulder-gravel zone and high boulder-boulder zone. The pink dashed lines indicate the boundaries of different geomorphic zones. MLWS: mean low water spring; MHWS: mean high water spring.
The dominant waves in the study area are from the ESE direction. The average wave height is 1.0–4.0 m, and the average wave period is 4.3–7.3 s. The maximum wave height is 4.4–8.3 m, and the maximum wave period is 7.6–11.9 s (according to data obtained from 1980–2008 from the Pingtan Ocean Observation Station). The tides of the region, with an average tidal range of approximately 4.63 m, are regularly semidiurnal (according to data obtained from 1960–2003 from the Pingtan Ocean Observation Station).
The cold wave captured in this study started at 0:00 on Dec. 1, 2020 and ended at 12:00 on Dec. 7, 2020, during which the wave height was greater than that of normal waves. Typhoon In-Fa, captured in this study, was generated in the northwestern Pacific Ocean on Jul. 18, 2021 and made landfall in Zhoushan, Zhejiang Province on Jul. 25, 2021 (Fig. 1a). This typhoon, with its slow moving speed and long residence time, broke numerous records for extreme precipitation over the last century and caused a large number of casualties and economic losses along the southeastern coast of China (Wu et al., 2022). It also caused an abnormal increase in wave height in the study area during the period from 7:00 on Jul. 21, 2021 to 2:00 on Jul. 25, 2021, which had a significant impact on the dynamic geomorphology of the study area.
3.
Materials and methods
3.1
Boulder tracing
In this research, RFID was used for boulder tracing following Hastewell et al. (2019). The tags used were manufactured by Texas Instruments and have a diameter of 2 mm, a length of 32 mm, and a frequency of 134.2 kHz. Tagged boulders were prepared in situ. First, boreholes (including tag holes and orientation holes) approximately 40 mm long were drilled into the boulders, with the orientation parallel to the long axis of the boulder (Fig. 3a) to facilitate subsequent searches (Hastewell et al., 2019). Tags with unique codes were then implanted into the tag holes and sealed with waterproof epoxy resin (Fig. 3b). The searching (Fig. 3c) and relocation (Fig. 3d) of tagged boulders were carried out during the low-tide period. The 42 tagged boulders selected for this study were located in the main part of the beach, which is less affected by the headlands, and were randomly selected in the intertidal and supratidal zones to represent a variety of boulder characteristics and dynamic environments (Fig. 2a).
Figure
3.
Boulder tracing process using Radio Frequency Identification technology. a. Drill boreholes; b. tag implantation followed by epoxy resin sealing, denoting the relative locations of tag holes and orientation holes; c. field detection and tracking of tagged boulders; d. relocation of tagged boulders.
The method for estimating the size, shape and mass of the tagged boulders referred to Gómez-Pazo et al. (2021). The shape of tagged boulders was expressed by the Corey Shape Factor (CSF) proposed by Corey (1949),
$$ {\rm{CSF}}=\frac{c}{\sqrt{ab}} , $$
(1)
where a, b and c are the long, intermediate and short axes of the boulders, respectively. The transport mode of boulders was determined with repeated photographs according to Hastewell et al. (2019, 2020). The orientation hole was drilled below the tag hole to help determine the mode of transport (Fig. 3b), where if the orientation hole was found to be above the tag hole after relocation, the boulder was assumed to have been overturned at least once during transport; thus, it was considered to have either a rolling or saltation transport mode. In addition, considering both the grain size of the boulders and slight differences in each relocation position, 0.5 m was used as a criterion for determining whether boulder displacement had or had not occurred. Based on this, migration distances between two measurements are defined as follows: A migration distance <0.5 m indicates no obvious migration, 0.5–5 m means slight migration, 5–10 m implies considerable migration, and >10 m represents significant migration. Boulder transport pathways were defined as either landward or seaward relative to the orientation of the shoreline.
The recovery of tagged boulders using RFID technology was carried out before and after the cold wave and typhoon (Table 1). Six daily additional high-resolution surveys to relocate the boulders were conducted during the cold wave (Table 1).
Table
1.
Date of each boulder relocation and topographic survey
Date
Detection content
Dec. 1, 2020
boulder location and topographic survey before cold wave
Dec. 2–6, 2020
daily recovery surveys during cold wave period
Dec. 7, 2020
boulder recovery and topographic survey after cold wave
Sept. 19, 2021
boulder recovery and topographic survey before typhoon
Sept. 27, 2021
boulder recovery and topographic survey after typhoon
Cross-shore profiles and topographic surveys were conducted before and after the cold wave and the typhoon (Table 1). The topographic survey and location of the tagged boulders were performed using a Stonex S9 GPS real-time kinematic receiver with horizontal and vertical precisions of ±5 mm and ±10 mm, respectively. The topographic surveys were conducted using the “continuous topography” method through a walking measurement approach. The elevation and slope of the tagged boulders were extracted by interpolation and calculation of the measured topographic data.
The mean profile change (MPC) proposed by Qi et al. (2010) was used to reflect the geomorphological response of the boulder beach to extreme events. MPC is the absolute value of the average variation in a profile before and after a storm and can accurately represent beach changes due to extreme events (Qi et al., 2010). Meanwhile, the volume change per unit length was used to specifically reflect the erosion and accretion of the profile.
3.3
Wave and water level data
Wave and water level data were obtained during the cold wave and typhoon events. Hourly time series of wave data were taken from the Pingtan buoy (Fig. 1a), 16 km northeast of the survey site, at a water depth of approximately 4 m; these data were acquired from the Fujian Ocean Forecasting Station (
http://www.fjhyyb.cn/). Two-hour intervals of water level data were taken from the hydrodynamic observation site (Fig. 1a), 15 km from the study area, with a water depth of approximately 3 m.
Hourly time series of wave data were used to calculate the total amount of wave energy transferred to the beach during the periods of the cold wave and typhoon events. Through linear wave theory (Komar, 1998; Fellowes et al., 2022), the wave energy flux (P) is calculated as
where ρ is the seawater density (1 020 kg/m3), g is the acceleration of gravity (9.8 m/s2), Hs is the significant wave height (m), and Cg is the wave group velocity (m/s), and the finite water wave group velocity Cg is expressed as
where h is the water depth (m) and T is the effective wave period (s).
4.
Results
4.1
Wave and tide data during the cold wave and typhoon events
The significant wave height at the survey site from Dec. 1, 2020 to Feb. 28, 2021 in winter varied from 0.1 m to 4.1 m (Fig. 4a), with an average value of 1.3 m. A larger significant wave height in winter appeared during five cold wave events, most of which were higher than 1.7 m (Fig. 4a). One of these cold wave events was selected as the research event segment in this paper, during which the significant wave height varied from 1.3 m to 3.3 m; the significant wave period varied from 7.3 s to 10.5 s (Fig. 4e). This cold wave event coincided with the astronomical spring tide, during which the water level ranged from −2.3 m to 2.9 m, and the storm surge ranged from −0.1 m to 1.4 m, with an average value of 0.6 m (Fig. 4b). The significant wave height under non-storm conditions in summer varied from 0.1 m to 2 m, with an average value of 0.6 m (Fig. 4c). The maximum value of wave height in summer occurred during the typhoon event, during which the significant wave height ranged from 1.5 m to 4.2 m (Fig. 4d) and the significant wave period varied from 8.6 s to 13.1 s (Fig. 4e). This typhoon event also coincided with the astronomical spring tide, during which the water level ranged from −2.6 m to 3.7 m, and the storm surge ranged from 0.1 m to 1.4 m, with an average value of 0.8 m (Fig. 4d). According to the wave data from the hydrodynamic observation site, the wind wave direction and the surge wave direction during both the cold wave and the typhoon were NNE and ESE, respectively.
Figure
4.
Wave, water level and storm surge near the study site. a. Significant wave height of the study area in winter. The red dotted line represents the approximate initial significant wave height of boulder entrainment in the study area (this will be specified in Section 5.2.1). b. Significant wave height, water level and storm surge in the study area during the cold wave period. The blue dotted lines represent each relocation survey during the cold wave. c. Significant wave height of the study area in summer. d. Significant wave height, water level and storm surge of the study area during the typhoon period. The blue dotted lines represent relocation surveys before and after the typhoon. e. Significant wave period of the study area between the cold wave and typhoon.
4.2
Boulder displacement before, during and after the cold wave event
Before and after the cold wave, 39 of 42 tagged boulders were recovered, providing a recovery rate of 93%. In contrast to the boulder tracking study of Gómez-Pazo et al. (2021), which had a recovery rate of 49%–79%, the recovery rate in this study was relatively high. A total of 24 boulders (accounting for 62% of recovered boulders) had obvious displacement, among which 75% of boulders were transported seaward. Only 3 boulders (12.5% of the boulders with obvious displacement) were overturned during the cold wave event. There were remarkable differences in boulder displacement in different geomorphic zones (Fig. 5). Specifically, tagged boulders in the LBBZ showed slight seaward migration, with an average distance of 2.2 m (Table 2). However, boulders in the BGZ showed considerable seaward migration, with an average distance of 6.4 m (Table 2), among which the largest displacement was 13.5 m for Boulder #27 (Fig. 5). Simultaneously, boulders in the HBBZ showed no obvious displacement (Table 2).
Figure
5.
Migration of tagged boulders influenced by the cold wave. MLWS: mean low water spring; MHWS: mean high water spring.
Table
2.
Boulder displacement in different geomorphic zones influenced by the cold wave and the typhoon
Event
Geomorphic zone
Number of recovered boulders
Number of mobilized
boulders
Mean migration
distance/m
Dominant migration
direction
Cold wave
low-tide and mid-tide (LBBZ)
22
16
2.2
seaward
high-tide (BGZ)
9
8
6.4
seaward
supratidal (HBBZ)
8
0
/
/
Typhoon
low-tide and mid-tide (LBBZ)
13
13
6.8
landward
high-tide (BGZ)
6
6
22.7
seaward
supratidal (HBBZ)
6
6
24.1
seaward
Note: Mobilized boulders indicate boulders with a displacement exceeding 0.5 m. Mean migration distance and dominant migration direction are derived from mobilized boulders. The eastern boundary of the boulder-gravel zone (BGZ) approximately aligns with the division between mid-tide and high-tide. LBBZ: low boulder-boulder zone; HBBZ: high boulder-boulder zone.
During the cold wave event, most of the tagged boulders had diverse amplitudes of daily displacement. Boulders #9, #10, #19, #22, #26, #27 and #28 especially showed irregular nonlinear movement (Fig. 6). In addition, the displacement of boulders showed a certain regional clustering; for example, the migration range and trend of Boulders #7 and #8, #9 and #10, and #15 and #16 were similar.
Figure
6.
Daily migration of tagged boulders during the cold wave event. MLWS: mean low water spring; MHWS: mean high water spring.
4.3
Boulder displacement before and after the typhoon event
Before and after the typhoon event, 25 of 42 tagged boulders were recovered, providing a recovery rate of 60%. This was probably, in part, due to the burial of tagged boulders caused by strong dynamic conditions. All recovered boulders had obvious displacement, among which 14 boulders (accounting for 56% of boulders with obvious migration) were transported seaward (Fig. 7). In total, 17 boulders (68% of the boulders with obvious displacement) were overturned during the typhoon event. Tagged boulders in the LBBZ showed considerable migration, 79% of which were transported landward, with an average distance of 6.8 m (Table 2), and the largest displacement was 23.9 m for Boulder #21. In contrast, tagged boulders in the BGZ showed significant migration; all of these boulders were transported seaward, with an average distance of 22.7 m (Table 2), among which the largest displacement was 35.2 m for Boulder #19 (Fig. 7). Simultaneously, tagged boulders in the HBBZ also showed significant seaward migration, with an average distance of 24.1 m (Table 2), and three boulders (50% of the total) were transported more than 30 m, with the largest displacement of 34 m for Boulder #35 (Fig. 7).
Figure
7.
Migration of tagged boulders influenced by the typhoon. MLWS: mean low water spring; MHWS: mean high water spring.
Before and after the cold wave event, the geomorphology of the Cendu boulder beach changed relatively little, with dominant small-scale erosion and accretion changes in intertidal zones (Figs 8a–e). The MPC of the 5 profiles ranged from 0.06 m to 0.14 m, with an average of 0.09 m (Fig. 8f), showing little beach morphology change due to the cold wave event. Meanwhile, the volume change per unit length of the 5 profiles ranged from −0.57 m3/m to 4.72 m3/m (Table 3), indicating relatively little accretion profile change. In particular, the MPC of P5 was the largest (Fig. 8f), with obvious accretion in the supratidal and high-tide zones (Fig. 8e). The profile change and increase in beach volume in the upper beach is most likely due to the wave action that pushes smaller clasts up the beach.
Figure
8.
Profile changes influenced by the cold wave and typhoon events. a–e. Profile changes before and after the cold wave; f. mean profile change (MPC) influenced by the cold wave; g–k. profile changes before and after the typhoon; l. MPC influenced by the typhoon. MLWS: mean low water spring; MHWS: mean high water spring; MSL: mean sea level.
In contrast, before and after the typhoon event, the geomorphology of the Cendu boulder beach changed dramatically, with a dominant erosional profile change (Figs 8g–k). The MPC of the 5 profiles ranged from 0.18 m to 0.35 m, with an average of 0.25 m (Fig. 8l), showing dramatic beach morphology changes due to the typhoon event. Meanwhile, the volume change per unit length of the 5 profiles ranged from −17.74 m3/m to 12.61 m3/m (Table 3), indicating a dominantly erosional profile change. In particular, the profile changes along P2 and P5 were similar, tending to show significant erosion in the supratidal zone, stability in the high-tide and mid-tide zones and small-scale erosion and accretion change in the low-tide zone (Figs 8h, k). However, obvious accretion was observed in the supratidal zone of P1 (Fig. 8g).
4.5
Differences in boulder displacement influenced by cold wave and typhoon events
The above results highlight the dissimilarities of the boulder displacement in different geomorphic zones and along respective profiles that are influenced by cold wave and typhoon events, which will be analyzed and summarized in the following two paragraphs.
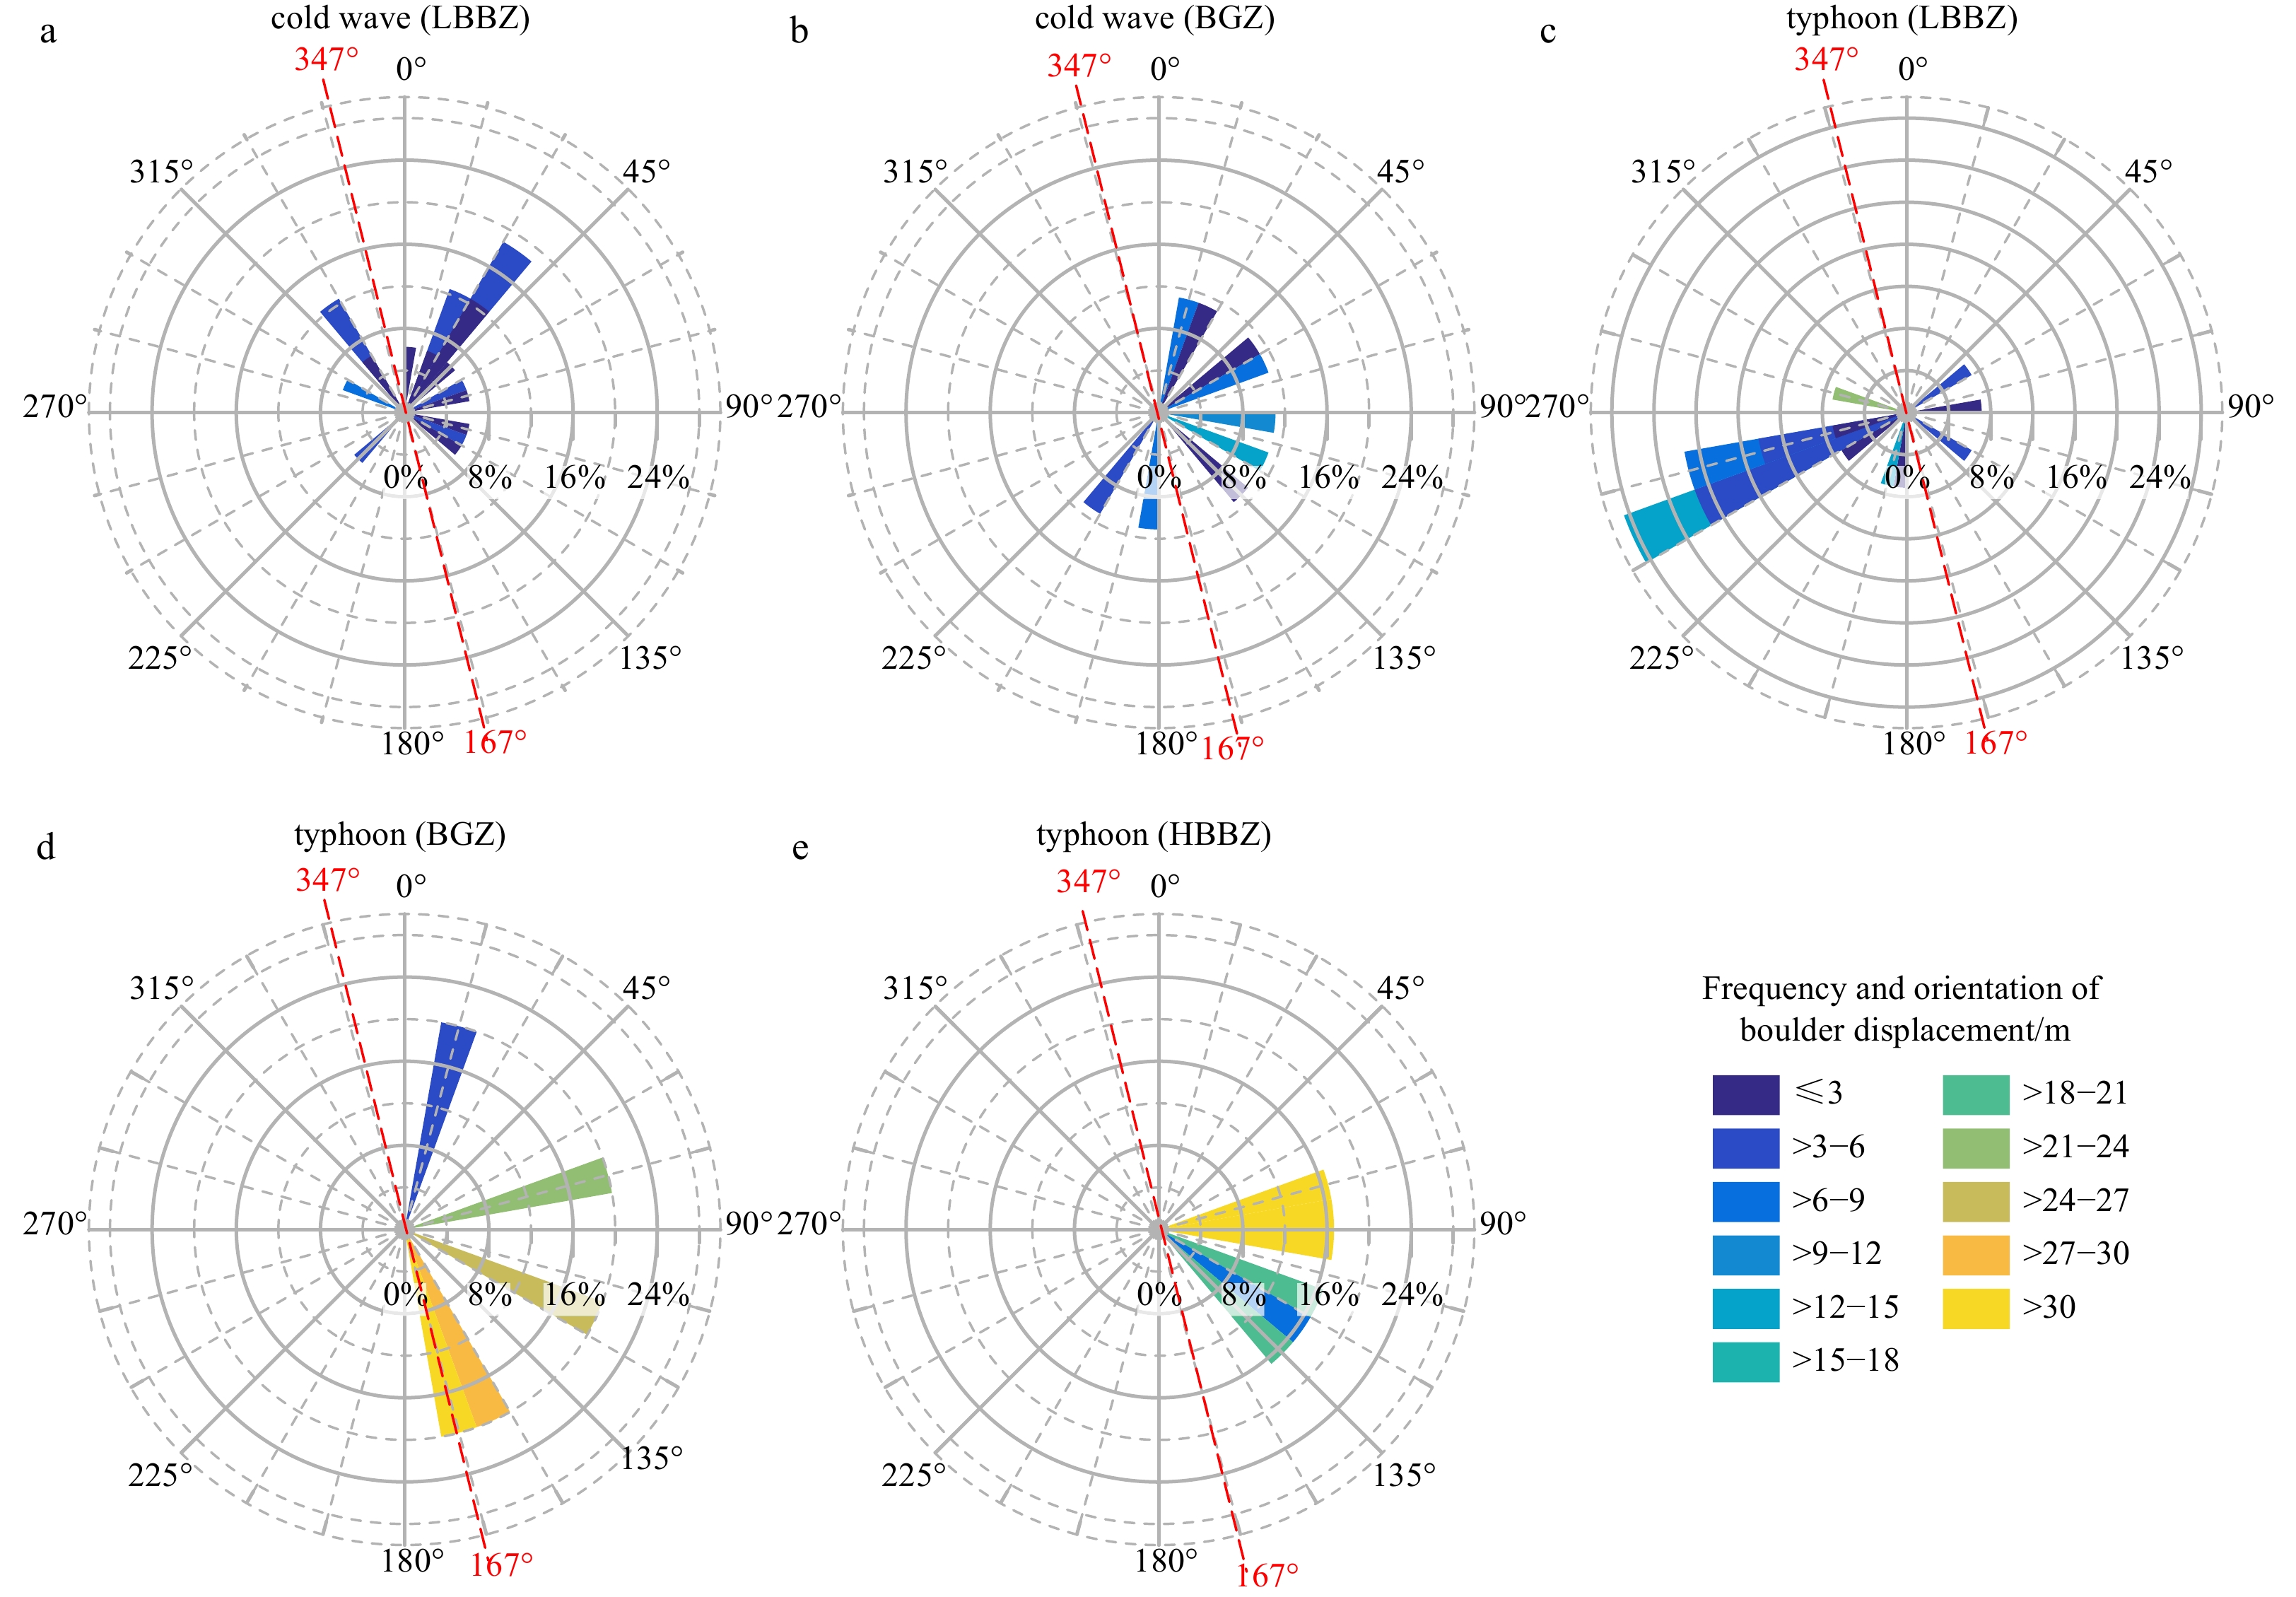
In terms of the same event, boulder displacement in different geomorphic zones varied distinctly, mainly characterized by the difference in migration magnitude and direction (Fig. 9). In terms of migration magnitude, before and after the cold wave, boulders in the BGZ showed longer transport distances than boulders in the LBBZ (Figs 9a, b), while before and after the typhoon, boulders in the BGZ and HBBZ showed significant migration (Figs 9d, e), which was distinctly larger than that of boulders in the LBBZ (Fig. 9c). In terms of migration direction, boulders in the LBBZ and boulders in the BGZ and HBBZ showed opposite migration trends before and after the typhoon, with landward and seaward characteristics, respectively (Figs 9c–e).
Figure
9.
Polar rose chart of the frequency and orientation of boulder displacement in different geomorphic zones influenced by the cold wave and typhoon events. a and b represent the migration characteristics of boulders in the low boulder-boulder zone (LBBZ) and boulder-gravel zone (BGZ) influenced by the cold wave, respectively, and c–e represent the migration characteristics of boulders in the LBBZ, BGZ and high boulder-boulder zone (HBBZ) influenced by the typhoon, respectively. The red dotted lines represent the orientation of the beach.
In terms of different events, boulder displacement in the same geomorphic zone differed distinctly, mainly in the migration magnitude, extent, direction and mode of transport. The migration magnitudes of the tagged boulders in the LBBZ, BGZ and HBBZ before and after the typhoon event were all distinctly greater than those of the cold wave event. Boulders in the HBBZ significantly moved only during the typhoon event (Fig. 9e) and remained stable during the cold wave event. The migration directions of boulders in the LBBZ were opposite before and after the cold wave and typhoon (Figs 9a, c). For boulder transport mode before and after the typhoon, tagged boulders were certainly transported predominantly by rolling or saltation; before and after the cold wave, although only 3 tagged boulders appeared to have been overturned, the possibility cannot be ruled out that they had turned over several times and then returned to their original state.
The dissimilarity of boulder displacement during the cold wave and typhoon may be related to the boulder morphological characteristics, slope and elevation of the location, surrounding structure of boulders and dynamic conditions, which will be discussed in the following sections.
5.
Discussion
5.1
The influence of boulder morphological characteristics, beach slope, elevation and surrounding structure of boulders on boulder displacement
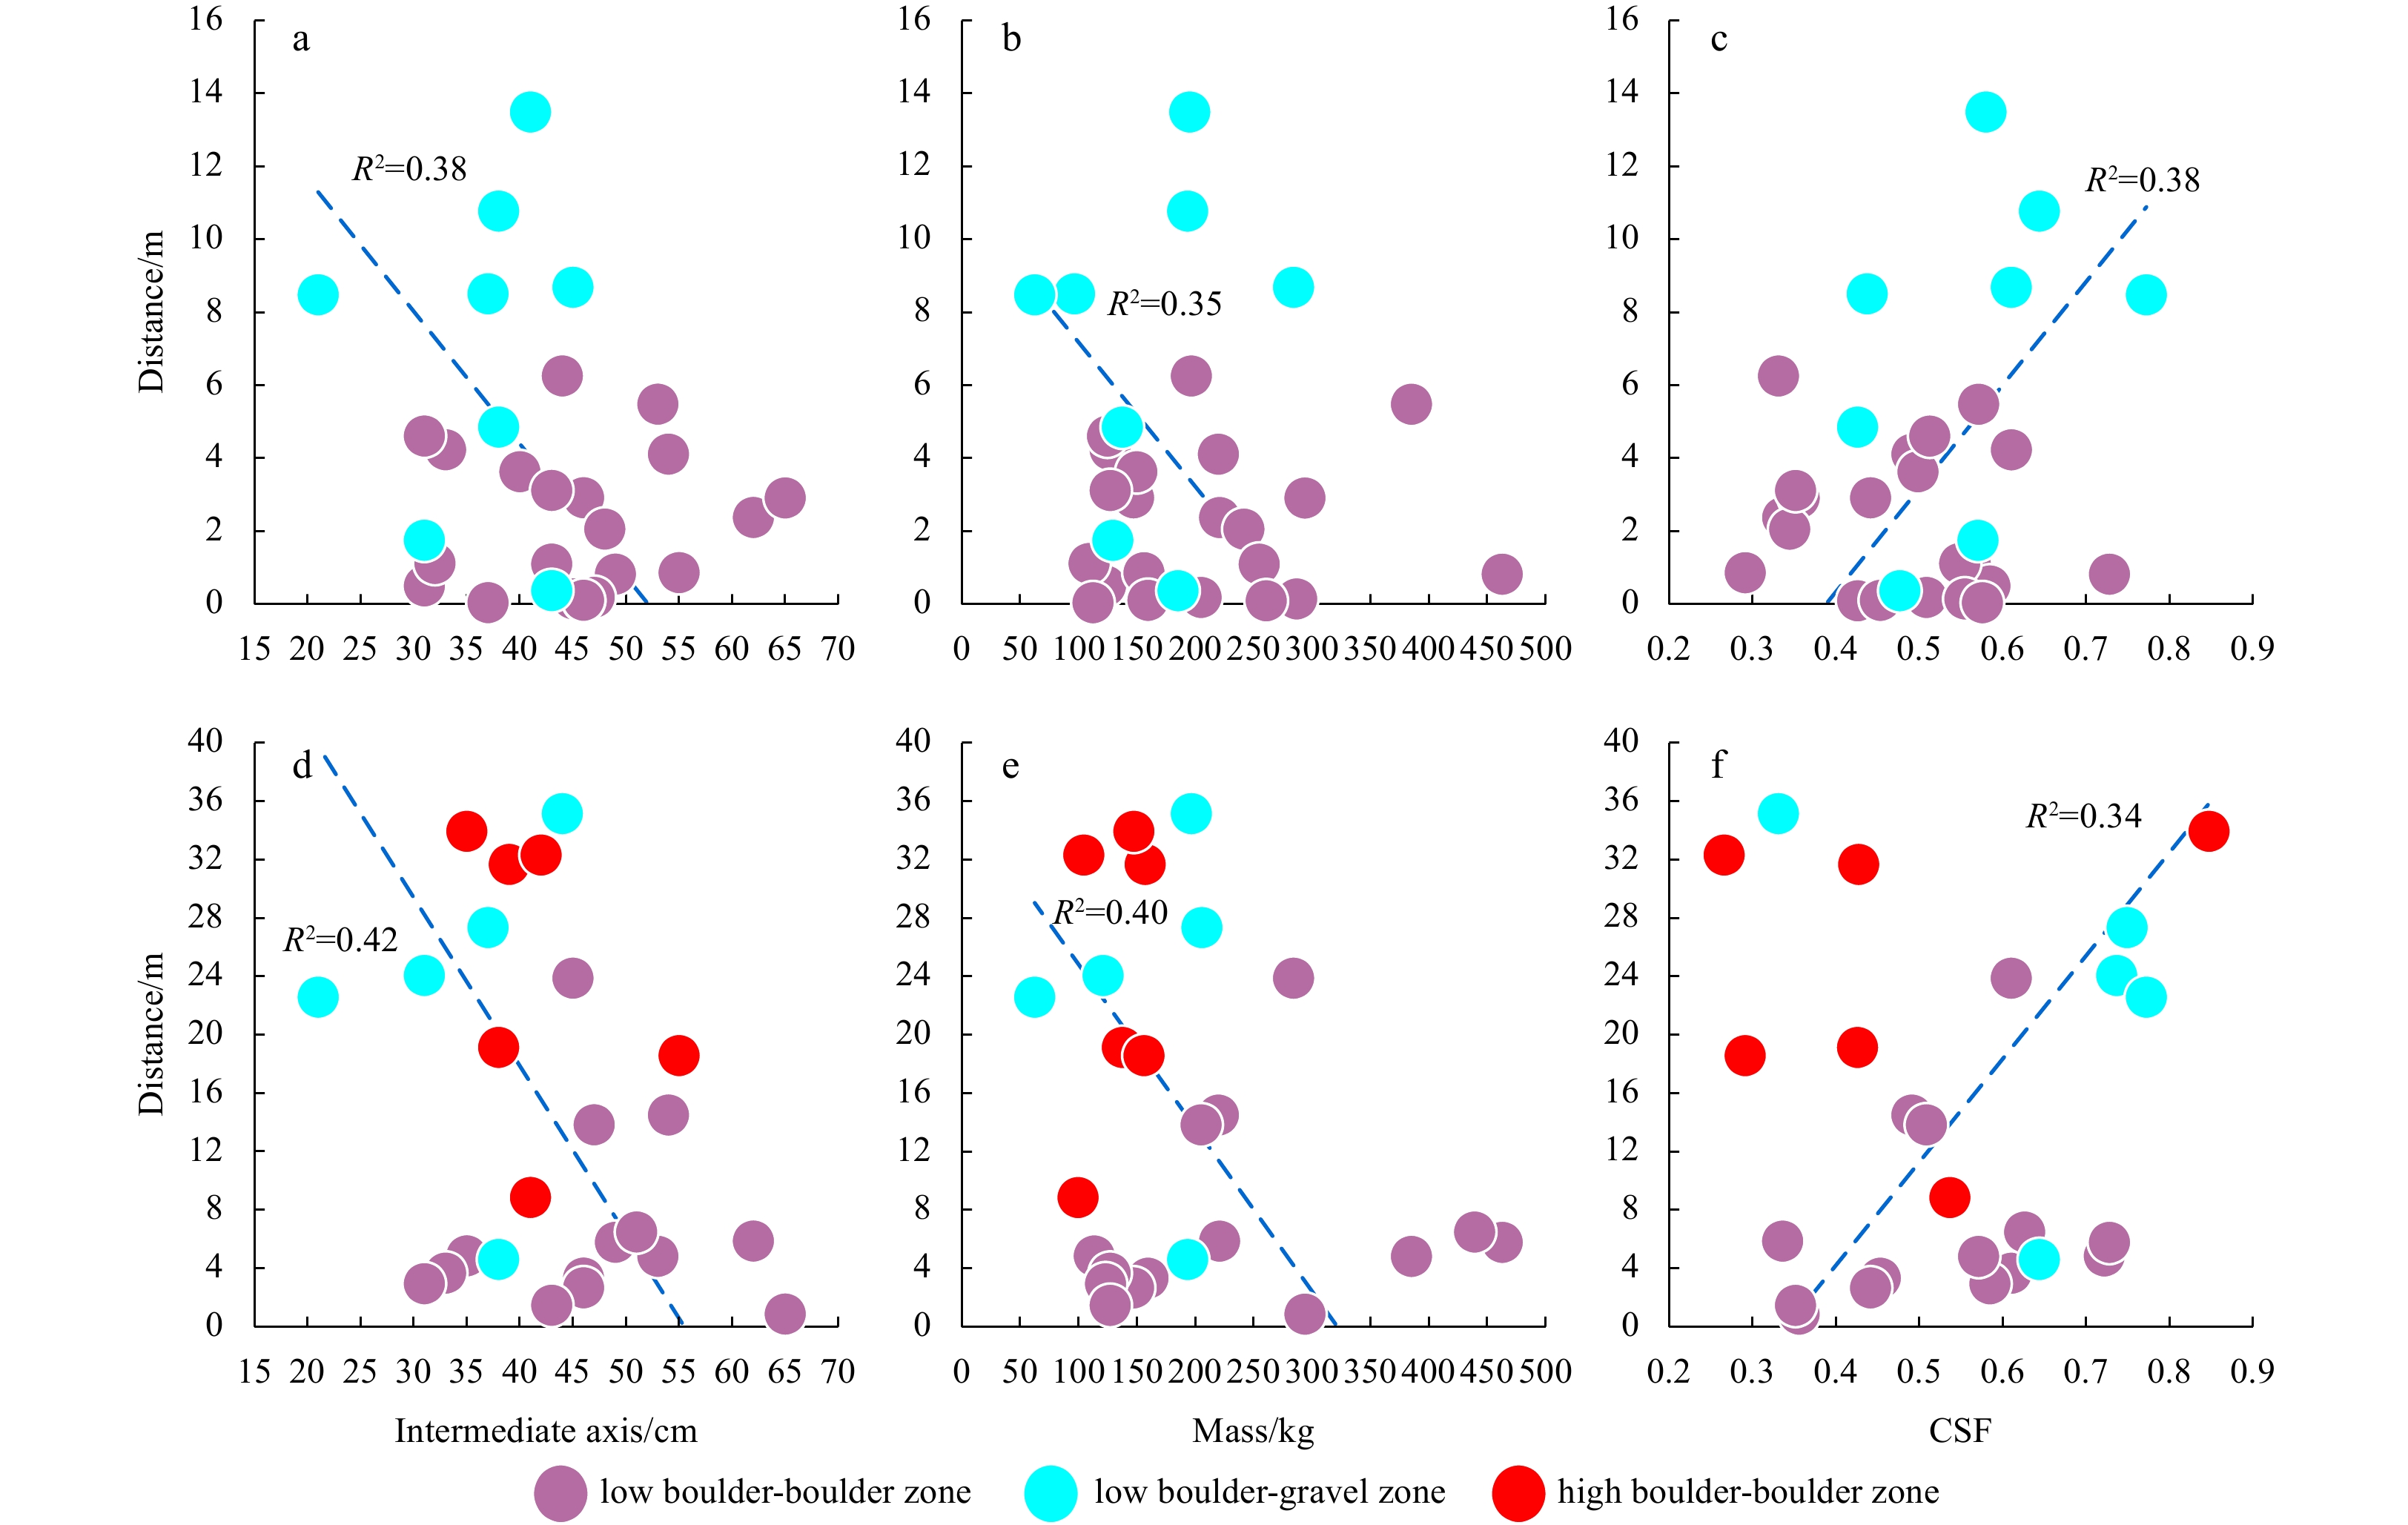
A certain trend was exhibited between boulder morphological characteristics (intermediate grain size, mass and CSF) and the net transport distance, but the correlation was relatively low (Fig. 10), as also confirmed by Naylor et al. (2016) and Gómez-Pazo et al. (2021).
Figure
10.
Boulder displacement within different geomorphic zones in relation to boulder morphological characteristics (intermediate grain size, mass and Corey Shape Factor (CSF)): cold wave event (a–c), typhoon event (d–f).
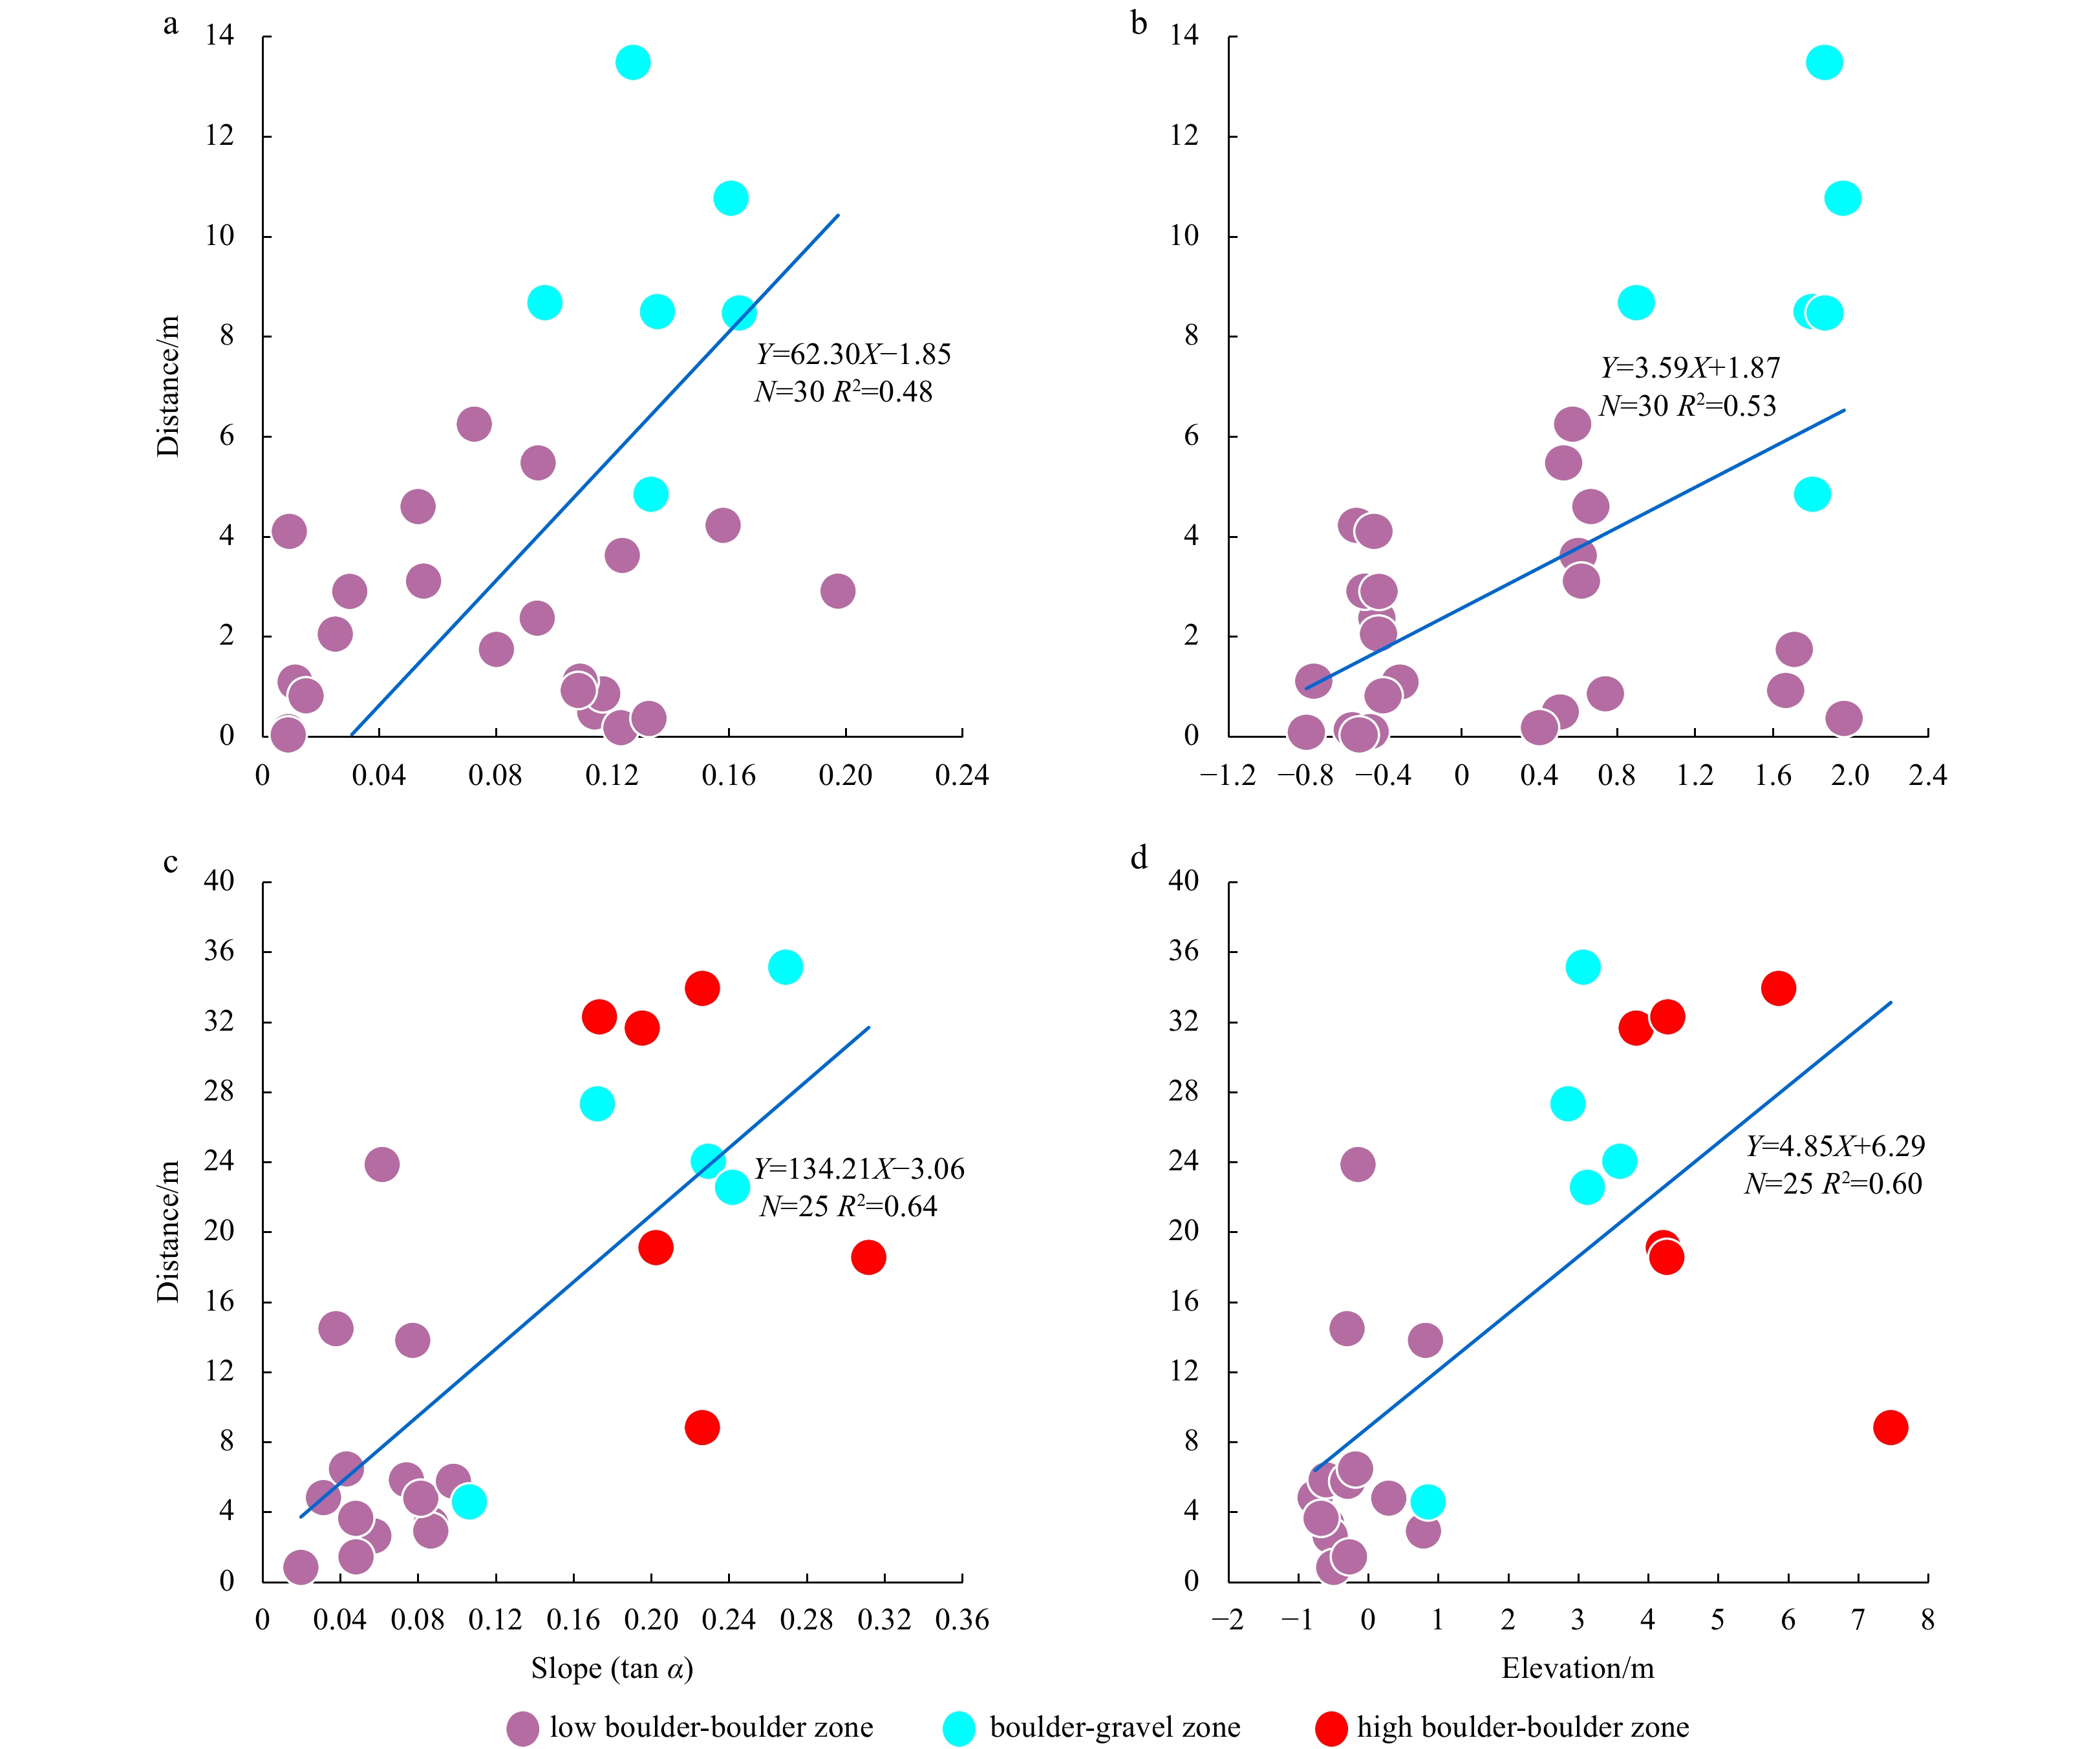
The beach slope and elevation of the boulder location affect the magnitude of boulder displacement on Cendu boulder beach differently during the cold wave and typhoon events. There are positive correlations among slope, elevation and transport distance during the typhoon event, with R2 values of 0.64 and 0.60, respectively (Figs 11c, d). However, the correlations among slope, elevation and transport distance during the cold wave event are relatively low, with R2 values of 0.48 and 0.53, respectively (Figs 11a, b). As Weiss and Diplas (2015) indicated, the slope angle is a critically important parameter influencing the dislodgement of boulders by extreme events. Consequently, during the typhoon event, with the increased wave activity and associated shear stresses, boulders on steeper slopes and at higher elevations can migrate significantly under the effect of greater gravitational potential energy, ignoring other controlling factors. However, during the cold wave event, with relatively weak wave activity and shear stresses, boulder displacement is vulnerable to factors other than slope and elevation.
Figure
11.
Boulder displacement within different geomorphic zones in relation to slope and elevation: cold wave event (a, b), typhoon event (c, d).
The surrounding structure of boulders plays an important role in the amplitude of boulder displacement on the Cendu boulder beach during cold wave and typhoon events. During the cold wave event, Boulders #21, #22, #26, #27, #28 and #39 with large displacements are all located in the BGZ (Fig. 5). Despite variations in boulder morphological characteristics, slope, and elevation, the above boulders are all surrounded by smaller clasts. That is, entrainment and displacement thresholds are relatively low due to a reduced amount of clast sheltering and interlocking (Lorang, 2000; Pérez-Alberti and Trenhaile, 2015a, b; Gómez-Pazo et al., 2021), allowing for large displacements. Consequently, the surrounding structure of boulders controls the amplitude of boulder displacement during the cold wave event. During the typhoon event, although boulder displacement in the BGZ is still much larger than that in the LBBZ, the magnitude of boulder displacements in the HBBZ is nearly the same (Table 2), as these boulders are also affected by surrounding boulders (Fig. 2c). Therefore, the surrounding structure of boulders affects the amplitude of boulder displacement only to some extent during the typhoon event.
Driven by wave breaking and swash energy (Oak, 1981), boulders initially show landward migration; then, they may protrude above the beach surface and are no longer limited by clast sheltering and interlocking effects (Gómez-Pazo et al., 2021), after which they continue to migrate seaward under the effect of backwash and gravitational energy. Depending on the beach slope and location of large boulders or other obstructions in their paths (Gómez-Pazo et al., 2021), boulders eventually come to rest in landward or seaward positions relative to their initial position. In this study, the closely aligned boulders in the LBBZ are more easily blocked by surrounding clasts during seaward migration. In other words, there is a greater restriction around them in this zone compared with the others. Additionally, the force provided by gravitational energy is relatively weak due to the gentle slope (0°–5°). Boulders in this area mainly migrate landward. In contrast, the sporadically distributed boulders in the BGZ are less likely to encounter large obstructions in the seaward migration process. Moreover, with the steeper slope of this area (5°–12°), gravitational energy is relatively high. Therefore, boulders mainly migrate seaward relative to their initial positions. Simultaneously, boulders in the HBBZ are also easily blocked by surrounding obstacles during seaward migration; due to the steepest slope (8°–20°), the driving force provided by gravitational energy may offset the influence of the above processes. Boulders in this area mainly migrate seaward relative to their initial positions. Thus, the surrounding structure of boulders and slope relative to the boulder location jointly control the direction of displacement on Cendu boulder beach during this typhoon event.
5.2
The relationship between hydrodynamic conditions and boulder displacement
5.2.1
Magnitude of boulder displacement
The difference in the effective wave energy flux per hour is the main factor that determines the obvious difference in the magnitude of boulder displacement during the cold wave and typhoon events. To calculate the effective wave energy per hour during the events, the initial wave height of boulder entrainment first needs to be obtained. Then, the time integration of the wave energy flux above the initial wave height during the event period is calculated. Hitherto, we can obtain the cumulative total effective wave energy fluxes (Pcum) and normalize them by the effective duration (Phourly) for each event.
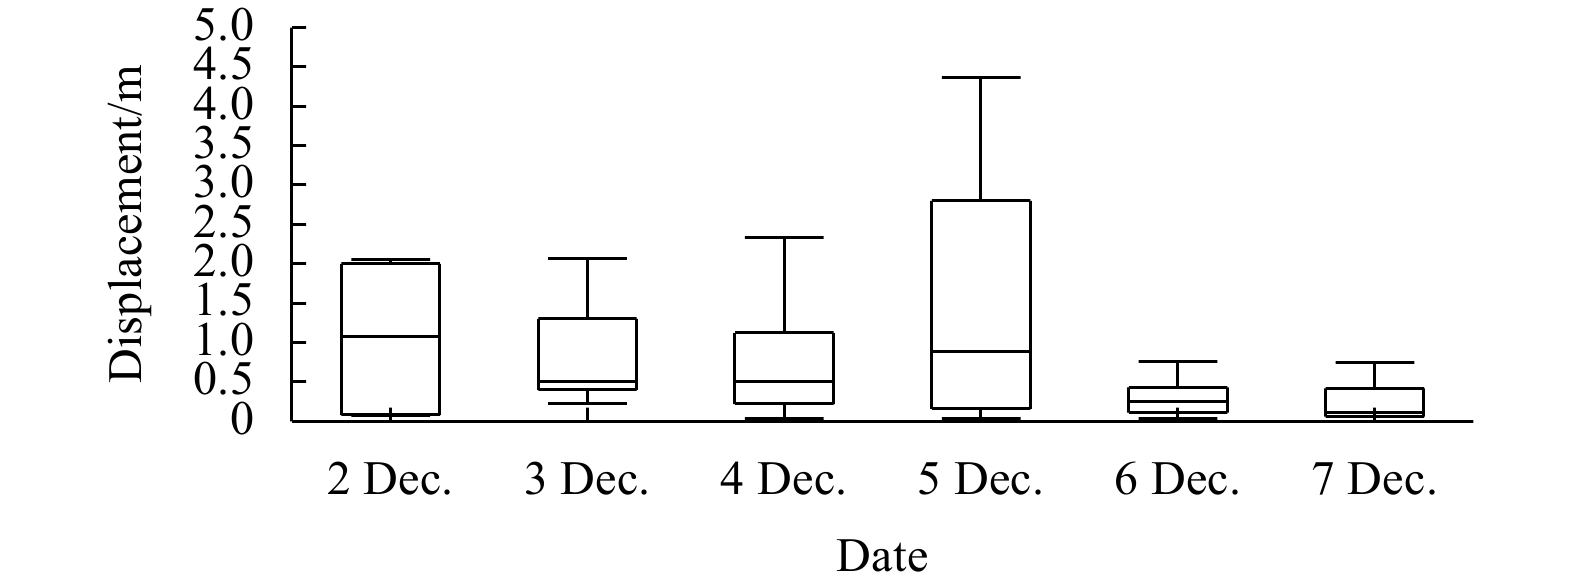
Existing hydrodynamic equations for boulder transport (Nott, 1997, 2003a, b; Noormets et al., 2004; Nandasena et al., 2011) are applicable only to isolated boulders on shore platforms or at the tops of cliffs. They do not take into account the effects of boulder interactions (Oetjen et al., 2021). Therefore, this study does not use traditional empirical formulas to calculate the initial wave height of boulder entrainment. Day-by-day observations of tagged boulders during the cold wave period show that boulders undergo an active to stable process under different wave energy conditions (Fig. 12). Especially during Dec. 6–7, most of the tagged boulders moved less than 1 m. That is, boulders forming the boulder beach are not significantly displaced under this energy-driven condition. The significant wave height during the time interval from 13:00 on Dec. 6 to 12:00 on Dec. 7 was 1.7 m. This value was taken as the approximate initial wave height of boulder entrainment in the study area.
Figure
12.
Box diagram of daily boulder displacement during the cold wave event.
The cumulative total effective wave energy fluxes normalized by the effective durations for the cold wave and typhoon events are calculated. The results show that Pcum and Phourly during the cold wave period are approximately 6.8×10⁶ kW/m and 5.8×10⁴ kW/(m∙h), respectively, and the values of the two parameters during the typhoon are approximately 6.7×10⁶ kW/m and 7.6×10⁴ kW/(m∙h), respectively (Table 4). The cumulative total effective wave energy fluxes of the two events are similar, mainly due to the longer effective duration of the cold wave relative to the typhoon (Table 4). However, the effective wave energy fluxes per hour during the typhoon event are much larger than those during the cold wave event, which means that the energy density of the former is more concentrated, which can trigger boulder displacements with larger magnitudes (Table 4).
Table
4.
Boulder displacement and effective wave energy flux during the cold wave and typhoon events
Event
Effective
duration/h
Smax/m
Savg/m
Pcum/
(kW·m−1)
Phourly/
(kW·(m∙h)−1)
Cold wave
122
13.5
2.7
6.8×10⁶
5.8×10⁴
Typhoon
87
34
12.4
6.7×10⁶
7.6×10⁴
Note: Smax and Savg represent the max and average displacements of boulders influenced by extreme events, respectively.
Storm event effects include storm surge and storm waves (Weiss, 2012), and storm surges combined with astronomical high tides lead to dramatic increases in total water levels, which can inundate areas not affected by normal waves, such as the supratidal and high-tide zones, and then storm waves drive the displacement of boulders in the inundation zone. For the study area, the maximum values of storm surge influenced by typhoon and cold wave are all approximately 1.4 m. However, in terms of average values of storm surge, that of the typhoon (0.8 m) is larger than that of the cold wave (0.6 m) (Figs 4b, d). Therefore, the storm surge value maintained a high level across the typhoon event. Based on this, after the superposition of the storm surge and astronomical high tide, the maximum value of the water level during the typhoon event (3.7 m) is much larger than that during the cold wave event (2.9 m) (Figs 4b, d), causing a wider range of boulder transport and geomorphological change on the beach (Figs 5, 7, 8). Thus, the difference in storm surge and water level throughout the duration of the two events is the main reason for the variability in the range of boulder displacement.
5.2.3
Direction of boulder displacement
During both the cold wave and the typhoon, the wind wave direction and the surge wave direction are NNE and ESE, respectively. According to the simple linear effect wave action, the landward displacement range of boulders should be between 202.5° and 292.5°, and the seaward displacement range should be between 22.5° and 112.5°. The main displacement direction of boulders before and after the two events in the study area is indeed concentrated in the abovementioned intervals (Fig. 9), and the migration directions of a small number of boulders outside these intervals may be caused by wave refraction effects (Gómez-Pazo et al., 2021). During the cold wave event, patterns of boulder displacement appeared to be relatively chaotic. The dominant transport movement is seaward and nearly perpendicular to the shoreline. Driven by a relativity weak wave activity with a NNE direction, boulders may initially move over slight gradients at small scales in a nearly parallel direction to the incident wave direction. Subsequently, driven by gravity, boulders moved seaward down the slope in a nearly perpendicular direction to the shoreline. However, during the typhoon event, the displacement of boulders appeared to be more regular, mainly in an ESE direction (parallel to the wave direction), especially for the boulders in the HBBZ zones. Similarly, boulders may initially move upslope, driven by relativity strong wave activity with an ESE direction. However, under the relatively strong, dominant backwash, the boulders moved seaward down-slope, mainly in a parallel direction to the wave. Thus, the incident wave direction and dynamic differences jointly control the direction of boulder displacement during the event.
Furthermore, with the water level surging dramatically during the typhoon event, the shore breaker zone and surf zone consequently migrated landward. The attenuated backwash influenced by infiltration (Bagnold, 1940) and gravitational energy may not be sufficient to drive the seaward displacement of boulders, resulting in predominantly landward displacement of boulders at low tide during the typhoon event, in contrast to the seaward trend of boulders in the same zone during the cold wave event.
5.2.4
Mode of transport
In general, it is assumed that the initial wave force acting on the boulder is sufficient to initiate overturning of the boulder (Stolle et al., 2019). Once tilting occurs, uplift forces acting on the underside of the boulder result in rolling or saltation transport (Oetjen et al., 2021). For the study area, the greater energy density during the typhoon event is more likely to cause overturning of boulders. In total, 17 boulders (68% of the boulders with obvious displacement) were overturned during the typhoon event. The main mode of transport is rolling or saltation. In contrast, wave energy during the cold wave may not be sufficient to cause the initial overturning of boulders. Only 3 boulders (12.5% of the boulders with obvious displacement) were overturned during the cold wave event. The transport mode may be mainly sliding. Consequently, differences in wave energy control the mode of boulder transport during cold wave and typhoon events.
5.3
Contributions of cold waves and typhoons to the morphodynamics of boulder beaches
From a single event, boulder displacements and profile changes caused by the typhoon event are much greater than those for the cold wave event. However, relative to typhoon events, cold wave events are characterized by high frequencies and long durations (Qu et al., 2015). In terms of cumulative effects, the contributions of cold wave and typhoon events to the morphodynamics of the boulder beach are unknown. In the following section, an analysis is presented, and the dynamic geomorphological evolution of the boulder beach is discussed.
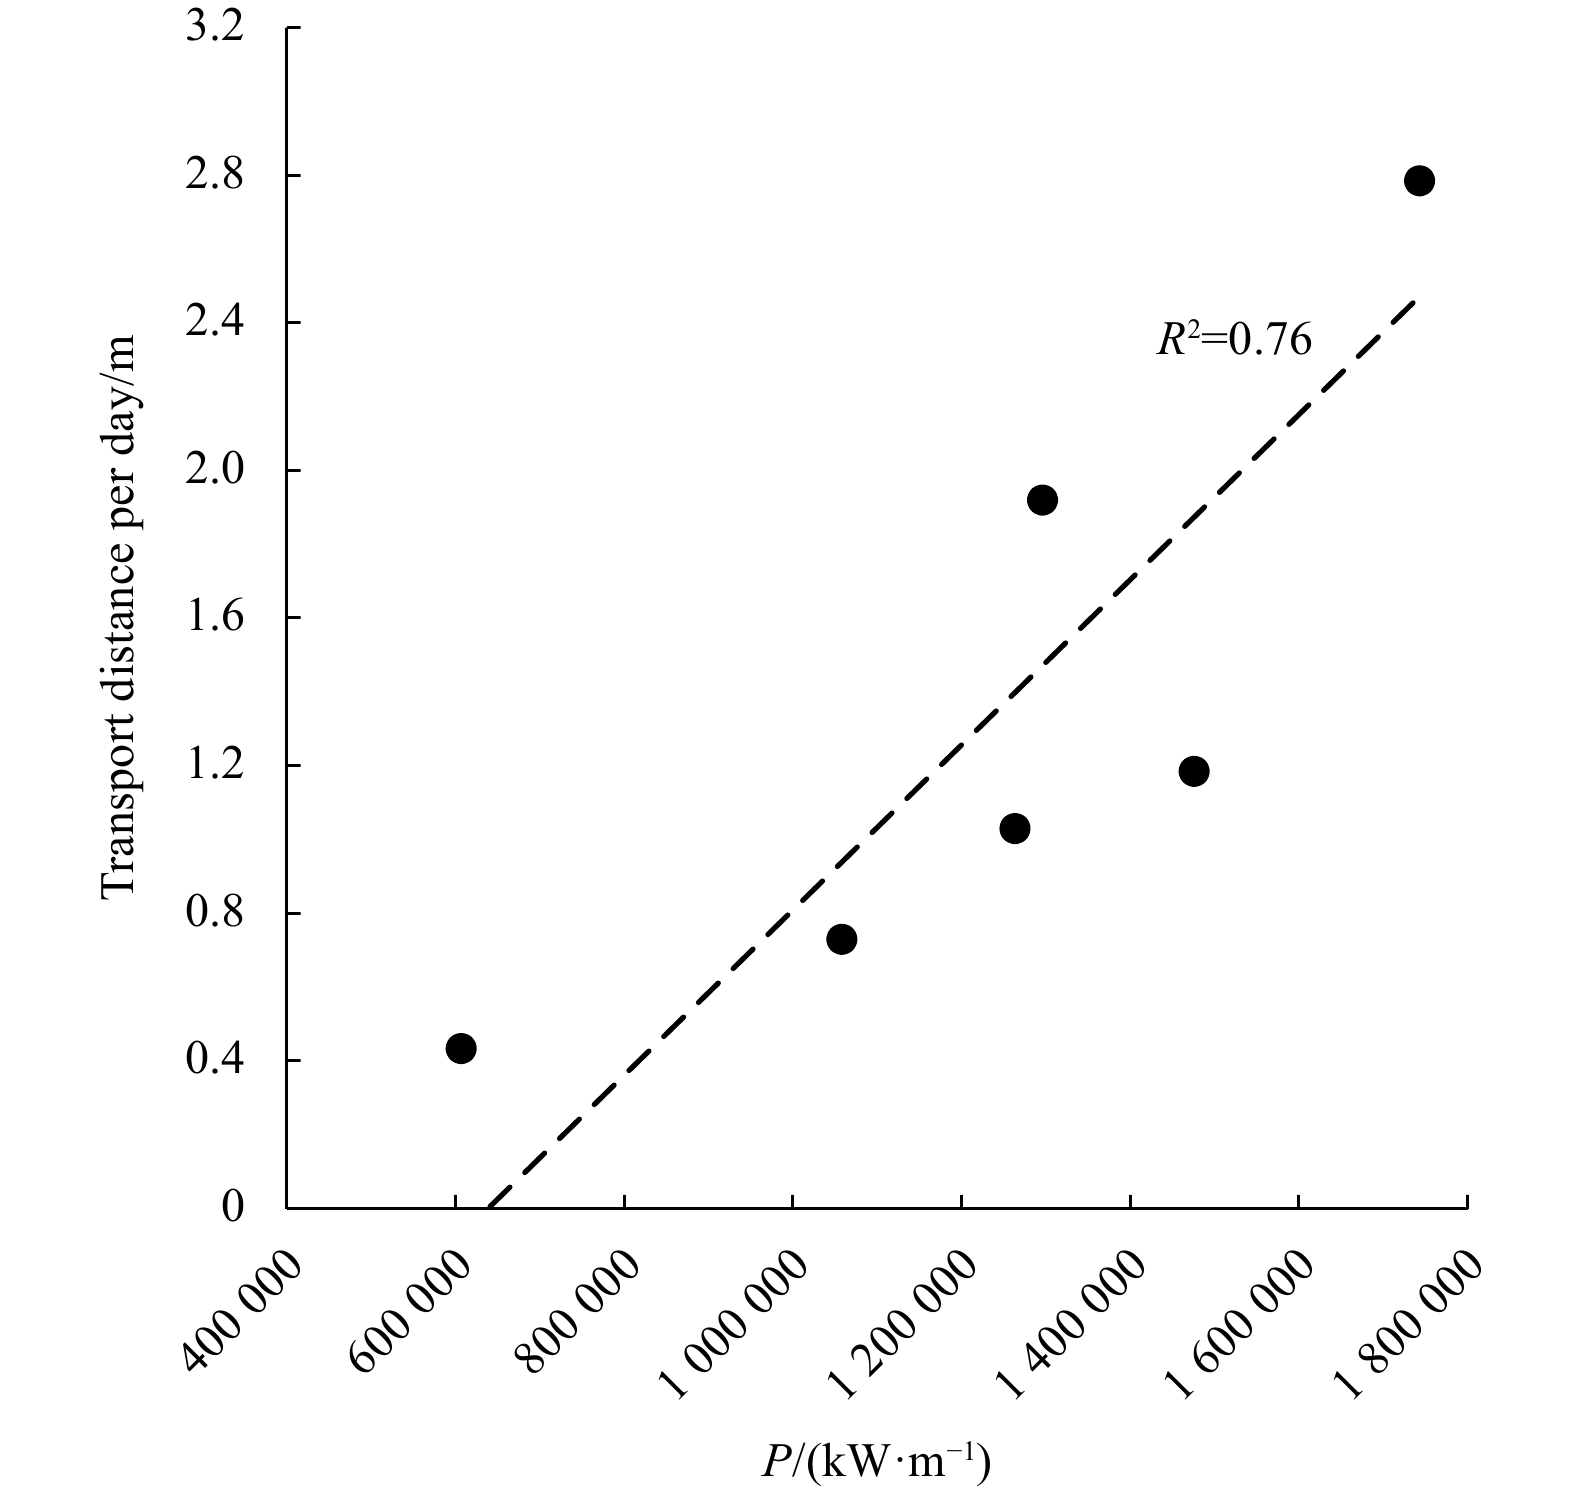
To explore the contributions of the studied cold wave and typhoon to the morphodynamics of the boulder beach in terms of cumulative effects, we need to first obtain the relationship between effective wave energy fluxes and transport distance and then estimate the cumulative values of boulder transport distance during the events. The effective cumulative wave energy fluxes and the transport distance per day during the cold wave show a positive correlation to some extent (R2 =0.76) (Fig. 13). Integrating the effective wave energy fluxes throughout the winter of 2020, the cumulative value is approximately 3.0×10⁷ kW/m. However, the wave height under non-storm conditions in the summer of 2021 is smaller than the initial wave height of boulder entrainment (Fig. 4c). The only event that is sufficient to drive boulder displacements and morphodynamic changes on the boulder beach throughout the summer is the typhoon event, with cumulative effective wave energy fluxes of approximately 6.7×10⁶ kW/m (Table 4). According to the positive correlation between the effective wave energy fluxes and the transport distance (R2 =0.76), considering the frequency and duration of cold waves in winter, the cumulative boulder displacement caused by cold wave processes throughout the winter is much larger than that caused by typhoon processes in this study area.
Figure
13.
Boulder displacement in relation to daily cumulative effective wave energy fluxes during the cold wave event.
However, considering the irregular, nonlinear movement of the boulders during the cold wave event, this paper estimates only the cumulative transport distance of the boulders without considering the displacement direction. RFID technology is indicated to be an effective and efficient way to trace and quantify boulder displacements on boulder beaches driven by extreme storm events. However, limited by the methodological means, only initial and final positions can be obtained (Chapuis et al., 2015). The intermediate movements of the tagged boulders remain unknown, which may cause uncertainty in the results. Motion loggers (Brayne, 2016; Brayne et al., 2020) may be useful to identify the intermediate movements of boulders. Furthermore, more frequent and detailed in situ observations are needed to track boulder displacement before, during and after extreme events. To quantify boulder displacement characteristics and subsequent changes in beach geomorphology at seasonal scales with more refinement, field video observations may be needed.
The geomorphic evolution of the boulder beach may be a dynamic reciprocal process. During typhoon events, boulders migrate seaward on a large scale mainly by rolling or saltation, especially supratidal boulders, which are not normally affected by waves. The geomorphology of the boulder beach subsequently changes on a large scale. In contrast, during cold wave events, with only intertidal boulders undergoing considerable migration, the geomorphology of the boulder beach is characterized by small-scale changes. During non-storm conditions, boulder beaches are likely to be in a relatively stable state, with changes only in the saltation of fine-grained clasts around boulders. The high frequency and long duration of cold waves sustainably drive boulder migration, and the geomorphological evolution of the intertidal zone until the next typhoon event affects the overall geomorphological pattern of the boulder beach.
6.
Conclusions
(1) The variability in boulder displacement before and after the cold wave and the typhoon is mainly reflected in the magnitude, range, direction and mode of transport. Before and after the cold wave, only intertidal boulders showed obvious migration, with irregular movement. Specifically, low-tide and mid-tide boulders showed slight seaward migration; high-tide boulders mainly moved seaward with considerable amplitude, while supratidal boulders did not show obvious migration. Before and after the typhoon, both intertidal and supratidal boulders showed obvious migration, with the main transport mode of rolling or saltation. Moreover, low-tide and mid-tide boulders showed considerable landward migration, while high-tide and supratidal boulders showed significant seaward migration.
(2) For extreme events, boulder displacement on the beach is controlled by multiple factors. The first factor involves hydrodynamic conditions (effective wave energy fluxes, incident wave direction, storm surge and water level), which jointly dominate displacement during different extreme events. The second factor includes the beach slope, elevation and surrounding structure of boulders, which jointly control displacement during the same extreme event. In this study, cold wave and typhoon events exhibited almost the same cumulative effective wave energy fluxes, but the boulder displacements varied distinctly.
(3) The geomorphic evolution of the boulder beach may be a dynamic reciprocal process. During a single typhoon event, the overall geomorphology of the boulder beach changes rapidly and substantially, while the intertidal geomorphology of the boulder beach changes to only a small extent during a single cold wave event. The alternating and repeated interactions between the two processes constitute the complete geomorphic evolution of the boulder beach.
Acknowledgements:
The authors thank two anonymous reviewers for their deep and thorough suggestions, which have greatly helped us to improve the quality of the manuscript. We also thank Haitao Xu, Zijian Mao and Zhiyong Zhang (Third Institute of Oceanography, Ministry of Natural Resources) for their assistance with the field experiments, and Yanyu He, Hang Yin and Shasha Liu (Third Institute of Oceanography, Ministry of Natural Resources) for their valuable comments on the revision of the paper.
Allan J C, Hart R, Tranquili J V. 2006. The use of Passive Integrated Transponder (PIT) tags to trace cobble transport in a mixed sand-and-gravel beach on the high-energy Oregon coast, USA. Marine Geology, 232(1–2): 63–86
Autret R, Dodet G, Suanez S, et al. 2018. Long–term variability of supratidal coastal boulder activation in Brittany (France). Geomorphology, 304: 184–200. doi: 10.1016/j.geomorph.2017.12.028
Bagnold R A. 1940. Beach formation by waves: some model experiments in a wave tank (includes photographs). Journal of the Institution of Civil Engineers, 15(1): 27–52
Brayne R P. 2016. The Relationship between nearshore wave conditions and coarse clastic beach dynamics [dissertation]. Falmouth: University of Exeter
Brayne R P, Lorang M S, Naylor L A, et al. 2020. Field-based observation of the entrainment threshold of cobbles with motion loggers. Journal of Coastal Research, 95(sp1): 392–397. doi: 10.2112/SI95-076.1
Cai Feng, Su Xianze, Liu Jianhui, et al. 2009. Coastal erosion in China under the condition of global climate change and measures for its prevention. Progress in Natural Science, 19(4): 415–426. doi: 10.1016/j.pnsc.2008.05.034
Chapuis M, Dufour S, Provansal M, et al. 2015. Coupling channel evolution monitoring and RFID tracking in a large, wandering, gravel-bed river: insights into sediment routing on geomorphic continuity through a riffle–pool sequence. Geomorphology, 231: 258–269. doi: 10.1016/j.geomorph.2014.12.013
Chen Bin, Chen Zhongyuan, Stephenson W, et al. 2011. Morphodynamics of a boulder beach, Putuo Island, SE China coast: the role of storms and typhoon. Marine Geology, 283(1–4): 106–115
Corey A T. 1949. Influence of shape on the fall velocity of sand grains [dissertation]. Fort Collins: Colorado State University
Cox R. 2019. Very large boulders were moved by storm waves on the west coast of Ireland in winter 2013–2014. Marine Geology, 412: 217–219. doi: 10.1016/j.margeo.2018.07.016
Dickson M E, Kench P S, Kantor M S. 2011. Longshore transport of cobbles on a mixed sand and gravel beach, southern Hawke Bay, New Zealand. Marine Geology, 287(1–4): 31–42
Emery K O. 1968. Relict sediments on continental shelves of the world. AAPG Bulletin, 52(3): 445–464
Etienne S, Buckley M, Paris R, et al. 2011. The use of boulders for characterising past tsunamis: lessons from the 2004 Indian Ocean and 2009 South Pacific tsunamis. Earth-Science Reviews, 107(1–2): 76–90
Fellowes T E, Vila-Concejo A, Gallop S L, et al. 2022. Wave shadow zones as a primary control of storm erosion and recovery on embayed beaches. Geomorphology, 399: 108072. doi: 10.1016/j.geomorph.2021.108072
Feng Shizuo. 1998. The advance of researches on storm surges. World Sci-Tech R& D (in Chinese), 20(4): 44–47
Flemming B W. 2011. Geology, morphology, and sedimentology of estuaries and coasts. In: Wolanski E, McLusky D, eds. Treatise on Estuarine and Coastal Science. Amsterdam: Elsevier Press, 7–38
Gómez-Pazo A, Pérez-Alberti A, Trenhaile A. 2021. Tracking clast mobility using RFID sensors on a boulder beach in Galicia, NW Spain. Geomorphology, 373: 107514. doi: 10.1016/j.geomorph.2020.107514
Goto K, Miyagi K, Kawamata H, et al. 2010. Discrimination of boulders deposited by tsunamis and storm waves at Ishigaki Island, Japan. Marine Geology, 269(1–2): 34–45
Green A, Cooper A, Salzmann L. 2016. Longshore size grading on a boulder beach. Journal of Sedimentary Research, 86(10): 1123–1128. doi: 10.2110/jsr.2016.71
Grottoli E, Bertoni D, Ciavola P, et al. 2015. Short term displacements of marked pebbles in the swash zone: focus on particle shape and size. Marine Geology, 367: 143–158. doi: 10.1016/j.margeo.2015.06.006
Grottoli E, Bertoni D, Pozzebon A, et al. 2019. Influence of particle shape on pebble transport in a mixed sand and gravel beach during low energy conditions: implications for nourishment projects. Ocean & Coastal Management, 169: 171–181
Hall A M, Hansom J D, Williams D M, et al. 2006. Distribution, geomorphology and lithofacies of cliff-top storm deposits: examples from the high-energy coasts of Scotland and Ireland. Marine Geology, 232(3–4): 131–155
Hastewell L, Inkpen R, Bray M, et al. 2020. Quantification of contemporary storm-induced boulder transport on an intertidal shore platform using radio frequency identification technology. Earth Surface Processes and Landforms, 45(7): 1601–1621. doi: 10.1002/esp.4834
Hastewell L J, Schaefer M, Bray M, et al. 2019. Intertidal boulder transport: a proposed methodology adopting Radio Frequency Identification (RFID) technology to quantify storm induced boulder mobility. Earth Surface Processes and Landforms, 44(3): 681–698. doi: 10.1002/esp.4523
Hayes M O. 1967. Relationship between coastal climate and bottom sediment type on the inner continental shelf. Marine Geology, 5(2): 111–132. doi: 10.1016/0025-3227(67)90074-6
Huang Yusheng, Cai Chuanrong, Zhou Hong. 1992. The volcanic rocks in Pintang Island, Fujian and their plate collision tectonics. Journal of Fuzhou University (Natural Science) (in Chinese), 20(4): 99–105
Kennedy A B, Mori N, Yasuda T, et al. 2017. Extreme block and boulder transport along a cliffed coastline (Calicoan Island, Philippines) during Super Typhoon Haiyan. Marine Geology, 383: 65–77. doi: 10.1016/j.margeo.2016.11.004
Komar P D. 1998. Beach Processes and Sedimentation. 2nd ed. Upper Saddle River: Prentice Hall Press, 544
Leatherman S P, Zhang Keqi, Douglas B C. 2000. Sea level rise shown to drive coastal erosion. Eos, Transactions American Geophysical Union, 81(6): 55–57
Lorang M S. 2000. Predicting threshold entrainment mass for a boulder beach. Journal of Coastal Research, 16(2): 432–445
Lorang M S. 2011. A wave-competence approach to distinguish between boulder and megaclast deposits due to storm waves versus tsunamis. Marine Geology, 283(1–4): 90–97
Nandasena N A K, Paris R, Tanaka N. 2011. Reassessment of hydrodynamic equations: Minimum flow velocity to initiate boulder transport by high energy events (storms, tsunamis). Marine Geology, 281(1–4): 70–84
Naylor L A, Stephenson W J, Smith H C M, et al. 2016. Geomorphological control on boulder transport and coastal erosion before, during and after an extreme extra-tropical cyclone. Earth Surface Processes and Landforms, 41(5): 685–700. doi: 10.1002/esp.3900
Noormets R, Crook K A W, Felton E A. 2004. Sedimentology of rocky shorelines: 3. : hydrodynamics of megaclast emplacement and transport on a shore platform, Oahu, Hawaii. Sedimentary Geology, 172(1–2): 41–65
Nott J. 1997. Extremely high-energy wave deposits inside the Great Barrier Reef, Australia: determining the cause—tsunami or tropical cyclone. Marine Geology, 141(1–4): 193–207
Nott J. 2003a. Waves, coastal boulder deposits and the importance of the pre-transport setting. Earth and Planetary Science Letters, 210(1–2): 269–276
Nott J. 2003b. Tsunami or storm waves?—Determining the origin of a spectacular field of wave emplaced boulders using numerical storm surge and wave models and hydrodynamic transport equations. Journal of Coastal Research, 19(2): 348–356
Oak H L. 1981. Boulder beaches: a sedimentological study [dissertation]. Sydney: Macquarie University
Oak H L. 1984. The boulder beach: a fundamentally distinct sedimentary assemblage. Annals of the Association of American Geographers, 74(1): 71–82. doi: 10.1111/j.1467-8306.1984.tb01435.x
Oak H L. 1986. Process inference from coastal-protection structures to boulder beaches. Geografiska Annaler: Series A, Physical Geography, 68(1–2): 25–31
Oetjen J, Engel M, Schüttrumpf H. 2021. Experiments on tsunami induced boulder transport—A review. Earth-Science Reviews, 220: 103714. doi: 10.1016/j.earscirev.2021.103714
Paris R, Naylor L A, Stephenson W J. 2011. Boulders as a signature of storms on rock coasts. Marine Geology, 283(1–4): 1–11
Pérez-Alberti A, Trenhaile A S. 2015a. An initial evaluation of drone-based monitoring of boulder beaches in Galicia, North-western Spain. Earth Surface Processes and Landforms, 40(1): 105–111. doi: 10.1002/esp.3654
Pérez-Alberti A, Trenhaile A S. 2015b. Clast mobility within boulder beaches over two winters in Galicia, northwestern Spain. Geomorphology, 248: 411–426. doi: 10.1016/j.geomorph.2015.08.001
Qi Hongshuai, Cai Feng, Lei Gang, et al. 2010. The response of three main beach types to tropical storms in South China. Marine Geology, 275(1–4): 244–254
Qu Wenjun, Wang Jun, Zhang Xiaoye, et al. 2015. Effect of cold wave on winter visibility over eastern China. Journal of Geophysical Research: Atmospheres, 120(6): 2394–2406. doi: 10.1002/2014JD021958
Shu Fangfang, Cai Feng, Qi Hongshuai, et al. 2019. Morphodynamics of an artificial cobble beach in Tianquan Bay, Xiamen, China. Journal of Ocean University of China, 18(4): 868–882. doi: 10.1007/s11802-019-3860-3
Stolle J, Takabatake T, Hamano G, et al. 2019. Debris transport over a sloped surface in tsunami-like flow conditions. Coastal Engineering Journal, 61(2): 241–255. doi: 10.1080/21664250.2019.1586288
Sun Quan. 2019. Study on the characteristics of particle movement and morphodynamic process on coastal gravel beach based on the RFID tracking (in Chinese) [dissertation]. Qingdao: Ocean University of China
Weiss R. 2012. The mystery of boulders moved by tsunamis and storms. Marine Geology, 295–298: 28–33
Weiss R, Diplas P. 2015. Untangling boulder dislodgement in storms and tsunamis: is it possible with simple theories?. Geochemistry, Geophysics, Geosystems, 16(3): 890–898
Williams A T, Rangel-Buitrago N, Pranzini E, et al. 2018. The management of coastal erosion. Ocean & Coastal Management, 156: 4–20
Wilson K, Mohrig D. 2021. Modern coastal tempestite deposition by a non-local storm: swell-generated transport of sand and boulders on Eleuthera, The Bahamas. Sedimentology, 68(5): 2043–2068. doi: 10.1111/sed.12842
Wu Zuhang, Zhang Yun, Zhang Lifeng, et al. 2022. A comparison of convective and stratiform precipitation microphysics of the record-breaking typhoon in-Fa (2021). Remote Sensing, 14(2): 344. doi: 10.3390/rs14020344
Zhang Keqi, Douglas B C, Leatherman S P. 2004. Global warming and coastal erosion. Climatic Change, 64(1–2): 41
Zhao Peng, Jiang Wensheng. 2011. A numerical study of storm surges caused by cold-air outbreaks in the Bohai Sea. Natural Hazards, 59(1): 1–15. doi: 10.1007/s11069-010-9690-7
Table
2.
Boulder displacement in different geomorphic zones influenced by the cold wave and the typhoon
Event
Geomorphic zone
Number of recovered boulders
Number of mobilized
boulders
Mean migration
distance/m
Dominant migration
direction
Cold wave
low-tide and mid-tide (LBBZ)
22
16
2.2
seaward
high-tide (BGZ)
9
8
6.4
seaward
supratidal (HBBZ)
8
0
/
/
Typhoon
low-tide and mid-tide (LBBZ)
13
13
6.8
landward
high-tide (BGZ)
6
6
22.7
seaward
supratidal (HBBZ)
6
6
24.1
seaward
Note: Mobilized boulders indicate boulders with a displacement exceeding 0.5 m. Mean migration distance and dominant migration direction are derived from mobilized boulders. The eastern boundary of the boulder-gravel zone (BGZ) approximately aligns with the division between mid-tide and high-tide. LBBZ: low boulder-boulder zone; HBBZ: high boulder-boulder zone.
Figure 1. Location of the study area. a. Study site location denoting tracks of Typhoon In-Fa (red line), Pingtan wave buoy (pink star) and hydrodynamic observation site (pink circle). b. Satellite photograph of Caoyu Island showing the scope of Figs 2a, 5, 6 and 7 (cited from Google Earth). c. Aerial view of Cendu boulder beach from an unmanned aerial vehicle.
Figure 2. Sketch of the study site with three different geomorphic zones. a. The selected tagged boulders and profiles. Solid circles represent the selected tagged boulders, with 23 pink solid circles in the low boulder-boulder zone, 10 blue solid circles in the boulder-gravel zone and 9 red solid circles in the high boulder-boulder zone. The blue lines represent the selected profiles. b. Boundaries between low boulder-boulder zone and boulder-gravel zone. c. Boundaries between boulder-gravel zone and high boulder-boulder zone. The pink dashed lines indicate the boundaries of different geomorphic zones. MLWS: mean low water spring; MHWS: mean high water spring.
Figure 3. Boulder tracing process using Radio Frequency Identification technology. a. Drill boreholes; b. tag implantation followed by epoxy resin sealing, denoting the relative locations of tag holes and orientation holes; c. field detection and tracking of tagged boulders; d. relocation of tagged boulders.
Figure 4. Wave, water level and storm surge near the study site. a. Significant wave height of the study area in winter. The red dotted line represents the approximate initial significant wave height of boulder entrainment in the study area (this will be specified in Section 5.2.1). b. Significant wave height, water level and storm surge in the study area during the cold wave period. The blue dotted lines represent each relocation survey during the cold wave. c. Significant wave height of the study area in summer. d. Significant wave height, water level and storm surge of the study area during the typhoon period. The blue dotted lines represent relocation surveys before and after the typhoon. e. Significant wave period of the study area between the cold wave and typhoon.
Figure 5. Migration of tagged boulders influenced by the cold wave. MLWS: mean low water spring; MHWS: mean high water spring.
Figure 6. Daily migration of tagged boulders during the cold wave event. MLWS: mean low water spring; MHWS: mean high water spring.
Figure 7. Migration of tagged boulders influenced by the typhoon. MLWS: mean low water spring; MHWS: mean high water spring.
Figure 8. Profile changes influenced by the cold wave and typhoon events. a–e. Profile changes before and after the cold wave; f. mean profile change (MPC) influenced by the cold wave; g–k. profile changes before and after the typhoon; l. MPC influenced by the typhoon. MLWS: mean low water spring; MHWS: mean high water spring; MSL: mean sea level.
Figure 9. Polar rose chart of the frequency and orientation of boulder displacement in different geomorphic zones influenced by the cold wave and typhoon events. a and b represent the migration characteristics of boulders in the low boulder-boulder zone (LBBZ) and boulder-gravel zone (BGZ) influenced by the cold wave, respectively, and c–e represent the migration characteristics of boulders in the LBBZ, BGZ and high boulder-boulder zone (HBBZ) influenced by the typhoon, respectively. The red dotted lines represent the orientation of the beach.
Figure 10. Boulder displacement within different geomorphic zones in relation to boulder morphological characteristics (intermediate grain size, mass and Corey Shape Factor (CSF)): cold wave event (a–c), typhoon event (d–f).
Figure 11. Boulder displacement within different geomorphic zones in relation to slope and elevation: cold wave event (a, b), typhoon event (c, d).
Figure 12. Box diagram of daily boulder displacement during the cold wave event.
Figure 13. Boulder displacement in relation to daily cumulative effective wave energy fluxes during the cold wave event.


 DownLoad:


 DownLoad:


 DownLoad: