

Figure
1.
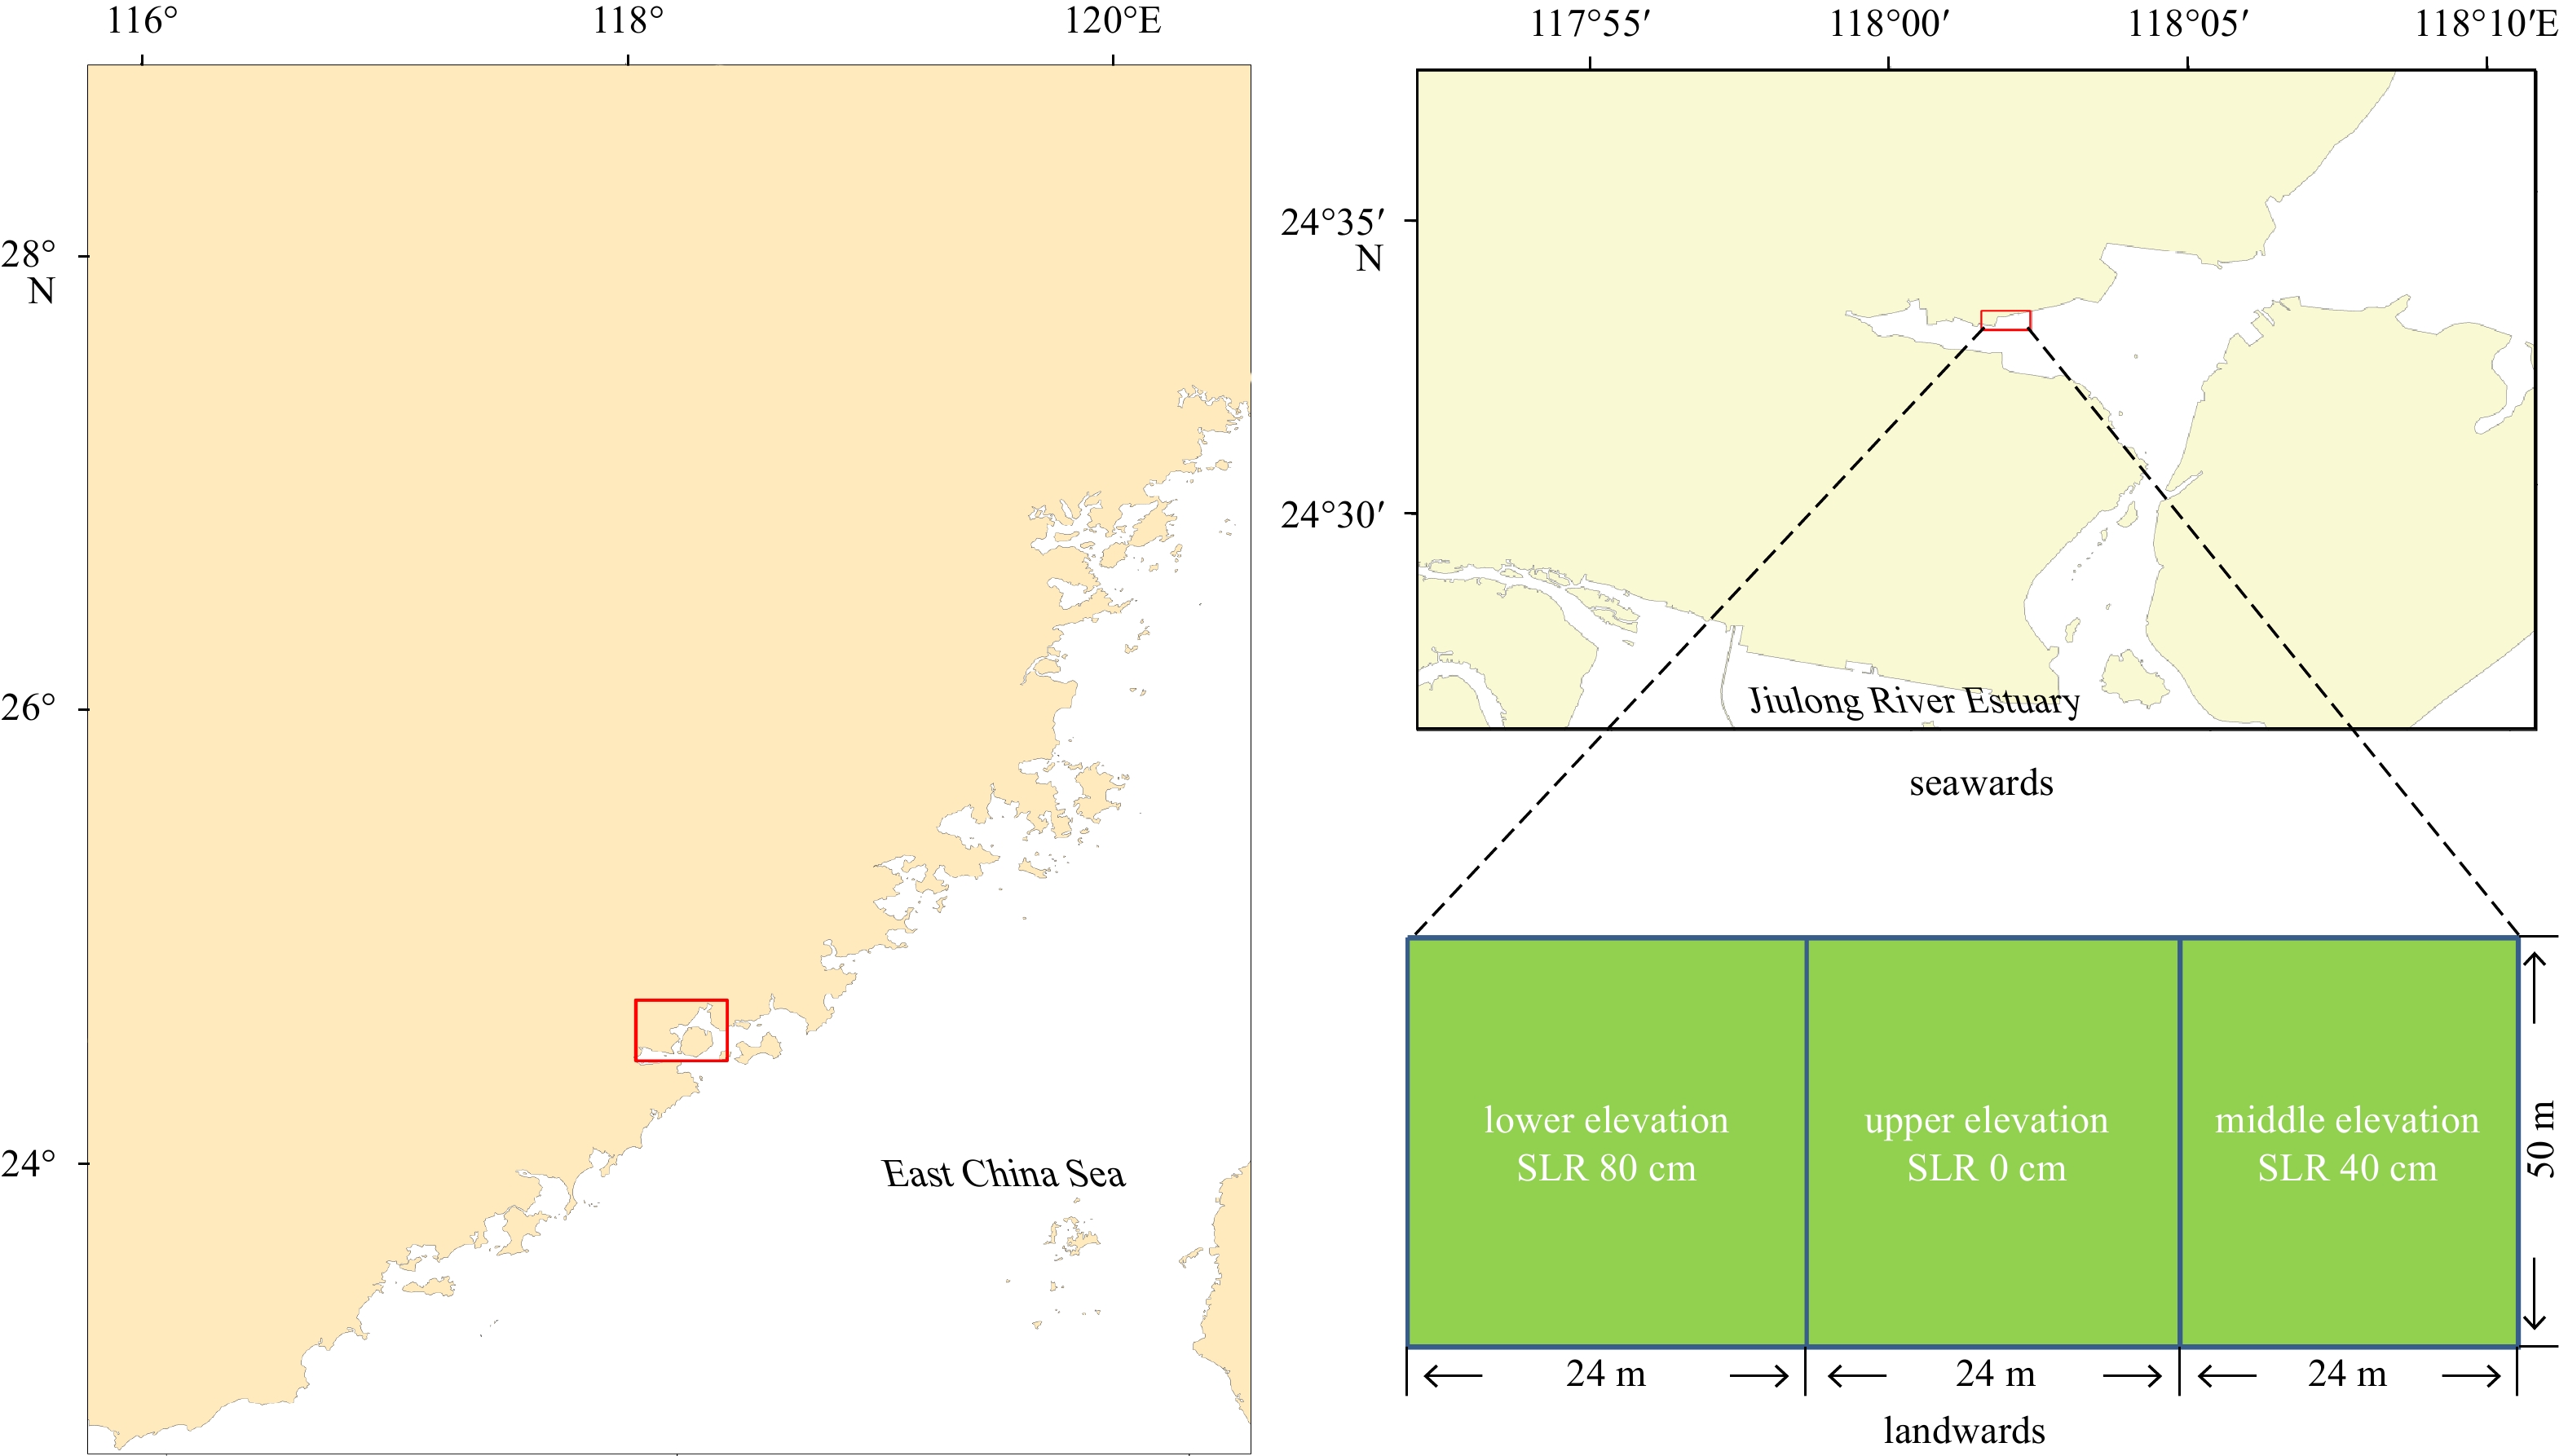
Maps of Zengying, the study area. SLR: sea level rise.
| Citation: | Jiahui Chen, Shichen Zeng, Min Gao, Guangcheng Chen, Heng Zhu, Yong Ye. Potential effects of sea level rise on the soil-atmosphere greenhouse gas emissions in Kandelia obovata mangrove forests[J]. Acta Oceanologica Sinica, 2023, 42(4): 25-32. doi: 10.1007/s13131-022-2087-0

|
The accelerating rate of sea level rise (SLR) is causing coastal ecosystem changes on a global scale (Meeder et al., 2021). The global mean sea level is projected to rise between 0.28 m and 0.98 m by the end of the 21st century based on the sea level of 2000 according to the Representative Concentration Pathway Scenarios, hence posing a major challenge for coastal regions worldwide (IPCC, 2013; Jayanthi et al., 2018; Perera et al., 2018; Mafi-Gholami et al., 2020). Mangrove forests as the only forests between land and sea are vulnerable to SLR (Krauss et al., 2014; Lovelock et al., 2015; Chen and Wang, 2017; Langston et al., 2017; Minick et al., 2019; Kirwan and Gedan, 2019). If soil accumulation rate is less than the rate of sea level rise, SLR will change water movement, alter tidal variation, and increase seawater intrusion into mangrove forests, resulting in both deeper flooding level, longer flooding duration and more anaerobic conditions (Ye et al., 2010; Wang et al., 2019). Therefore, SLR potentially has a substantial effect on the mangrove ecosystem.
The global wetland area accounts for 10% of the earth’s surface area, but stores 15% of earth’s total terrestrial carbon (Davidson et al., 2018; Sheng et al., 2021; Zhang et al., 2021). Although mangrove forests occupy a limited area compared with terrestrial forests, mangrove forests are increasingly seen as highly productive and most carbon-rich ecosystems among all coastal wetlands (Donato et al., 2011; McLeod et al., 2011). The average global carbon stock in the mangrove soils is approximately 720 t/hm2 (Alongi, 2014). Carbon stored in the mangrove ecosystems, along with salt marshes and seagrass beds, is termed “blue carbon” and has become a topic of global interest (Capooci et al., 2019). Meanwhile, mangrove ecosystems are known to constitute a net source of greenhouse gases including carbon dioxide (CO2), methane (CH4) and nitrous oxide (N2O) (Chen et al., 2010, 2012, 2015, 2016). Emissions of these three greenhouse gases exchanged between mangrove soils and the atmosphere, reduce soil carbon stock and the contribution of mangrove plants to the atmospheric cooling effect (Chen et al., 2015, 2016). For CO2, this emission rates from mangrove soil tended to be higher when soils were exposed to the atmosphere than when they were immersed by tides, due to the faster molecular diffusion for gases than fluids, as well as the increased surface area for aerobic respiration and chemical oxidation (Chen et al., 2012). For CH4, the increase in the
Therefore, in the present study, potential effects of SLR on the soil-atmosphere greenhouse gas emissions (CO2, CH4 and N2O) were quantified among three sites under different intertidal elevations in 9 years-old Kandelia obovata mangrove forests, representing tidal flooding situations of different SLR values. We posed the following research questions: (1) How higher sea levels could affect mangrove soil-atmosphere greenhouse gas emissions? (2) What are possible mechanisms of changes in mangrove soil-atmosphere greenhouse gas emissions with SLR?
The study area is located along the coastline of Zengying (24°33′9.24″N, 118°02′3.71″E) in Xiamen, Fujian, China (Fig. 1). This region is characterized by a subtropical marine monsoonal climate, with annual mean rainfall of 1097 mm and the rainy season from April to June. Mean annual air temperature is 20.8℃ and average annual insolation duration is 2276 h (Chen and Ye, 2013). March to May, June to August, September to November and December to February are categorized as spring, summer, autumn and winter months, respectively. Tides are semi-diurnal, with an average range of 4 m. Salinity of seawater adjacent to mangrove area ranges from 26 to 30 (Chen and Ye, 2013, 2014). Altitude of local mean sea level in Xiamen Bay is 365 cm (Ruan et al., 2010).
Many aquaculture ponds with boulder strips were used to breed crabs in this intertidal zone before 2002. These ponds were deserted and cofferdams around them were demolished after 2002. Soil with similar soil physico-chemical properties beside these ponds were used to transform three adjacent ponds for mangrove planting sites (Chen and Ye, 2013, 2014; Chen et al., 2020b). The final steady differences in elevation between two nearby sites were 40 cm, with sea level altitudes of 335 cm, 375 cm and 415 cm for the lower (SLR 80 cm), middle (SLR 40 cm) and upper (SLR 0 cm) elevation, respectively. According to the Ocean Blue Book on Climate Change in China (Liu et al., 2019), the average increase in sea level in China was 3.3 mm/a (33 cm per 100 a, 66 cm per 200 a) from 1980 to 2018. Elevation differences among the three sites were used to represent different tidal flooding situations that might be expected with rising sea level. Sea levels at Sites SLR 0 cm, SLR 40 cm and SLR 80 cm represented tidal flooding time of the current (Site SLR 0 cm), future ~100 a’s (Site SLR 40 cm) and future ~200 a’s SLR (Site SLR 80 cm) of mangrove forests along the Jiulong River Estuary, approximately 22 km away from the study area. Sites SLR 80 cm, SLR 40 cm and SLR 0 cm had mean inundation time of 10 h/d, 8 h/d and 6 h/d (i.e., 5 h, 4 h and 3 h per tide), respectively, measured during one whole tide cycle of 15 d in August 2004 (Chen and Ye, 2014). According to our previous study (Chen et al., 2020b), before mangrove planting, the soils among the three sites have similar soil physico-chemical properties including pH (p=0.452, one-way ANOVA), water content (p=0.566, one-way ANOVA), soil salinity (p=0.628, one-way ANOVA) and soil OC content (p=0.977, one-way ANOVA). In May 2004, the healthy mature K. obovata propagules were planted at the three sites and K. obovata among the three sites became the dominant species with 9 years-old at the sampling time of the present study. In the field observation, pollutants (e.g., wastewater from aquaculture) which affected mangrove soil-atmosphere greenhouse gas emissions were not found to enter into the three sites from land and sea.
Methods of collecting soil-atmosphere greenhouse gas fluxes have been reported in the previous studies (Chen et al., 2010, 2015, 2016). In brief, soil-atmosphere greenhouse gas fluxes were sampled monthly throughout the whole year from June 2013 to May 2014 at the three sites. Three replicates (each was approximately 10 m apart) for each site were applied in gas sampling using static closed chamber technique, and all samplings were conducted two hours before the lowest tide during the daytime. The static transparent chambers with a diameter of 17 cm (total area coverage of 0.023 m2) and a headspace volume over the soil of 1.47 L were applied in sampling. Each chamber was lightly inserted 2.5 cm into the soil at locations with no aboveground vegetation or litter fall. At 0 min, 15 min and 30 min after closure, a 5 mL gas sample was collected by passing a 10 mL glass syringe through the sampling outlet and was then immediately injected into dark airtight containers which were made of rubber stopper and aluminum foil.
During sample analysis, 1 mL gas sample was analyzed within 12 h using a gas chromatography system (Agilent 7890A, Santa, Clara, CA, USA) to determine concentrations of N2O, CH4 and CO2 and the standard was analyzed in every 6 samples (Chen et al., 2010, 2015, 2016). N2O concentration was determined with a 63Ni electron capture detector (μECD). CH4 and CO2 concentrations were analyzed with a flame ionization detector (FID). Gas concentrations were determined by comparing the sample peak areas against the standard curves (Agilent Greenhouse Gas Checkout Sample). Each soil-atmosphere greenhouse gas flux was calculated using the difference between the two points in the time series of concentration for each plot.
The soil-atmosphere flux (F, mol/(m2·h)) of each greenhouse gas was calculated by following formula:
| $$ F = (V\times \Delta M) / (A\times P), $$ | (1) |
where F was the interfacial gas flux (mol/(m2·h)), V was the internal air volume (m3) in the container after the pot was placed,
Soil samples (5 cm depth) were immediately collected for measurement of soil properties including organic carbon (OC), total nitrogen (TN) and total phosphorus (TP) after gas sampling was completed. Rapid dichromate oxidation procedure was used to determine soil OC content and a continuous flow analyzer (Futura II, Alliance Instruments, France) was used to determine soil TN and TP after Kjeldahl digestion (Allen et al., 1974). All data were expressed as the 105℃ dry weight. Moreover, air temperature which was used to calculate soil-atmosphere greenhouse gas fluxes was measured by atmosphere thermometer (digital thermometer, TP101) during sampling period.
Each annual greenhouse gas flux was further estimated based on the summation for monthly measurement during the entire year from June 2013 to May 2014. Annual gas fluxes were then converted to CO2-equivalent fluxes (Fe, g/(m2·a)) by the following equation according to Myhre et al. (2013):
| $$ F_{\rm{e}} = R_{{\rm{N}}_2{\rm{O}}} \times 298 + R_{{\rm{CH}}_4}\times 34 + R_{{\rm{CO}}_2} \times 1, $$ | (2) |
where
Normality of each variable was examined using Kolmogorov–Smirnov test, and homoscedasticity was examined with Kaiser-Meyer-Olkin index and Bartlett’s test of sphericity. Main and interactive effects of SLR and sampling months on each greenhouse gas flux and soil properties were analyzed using two-way analysis of variance (ANOVA), with pairwise comparisons of interactive effects conducted using post hoc Tukey’s HSD test. Pearson correlation was used to describe relationships between greenhouse gas fluxes and soil properties. All statistical analyses were performed using SPSS 22.0 for Windows (SPSS, Chicago, IL, USA).
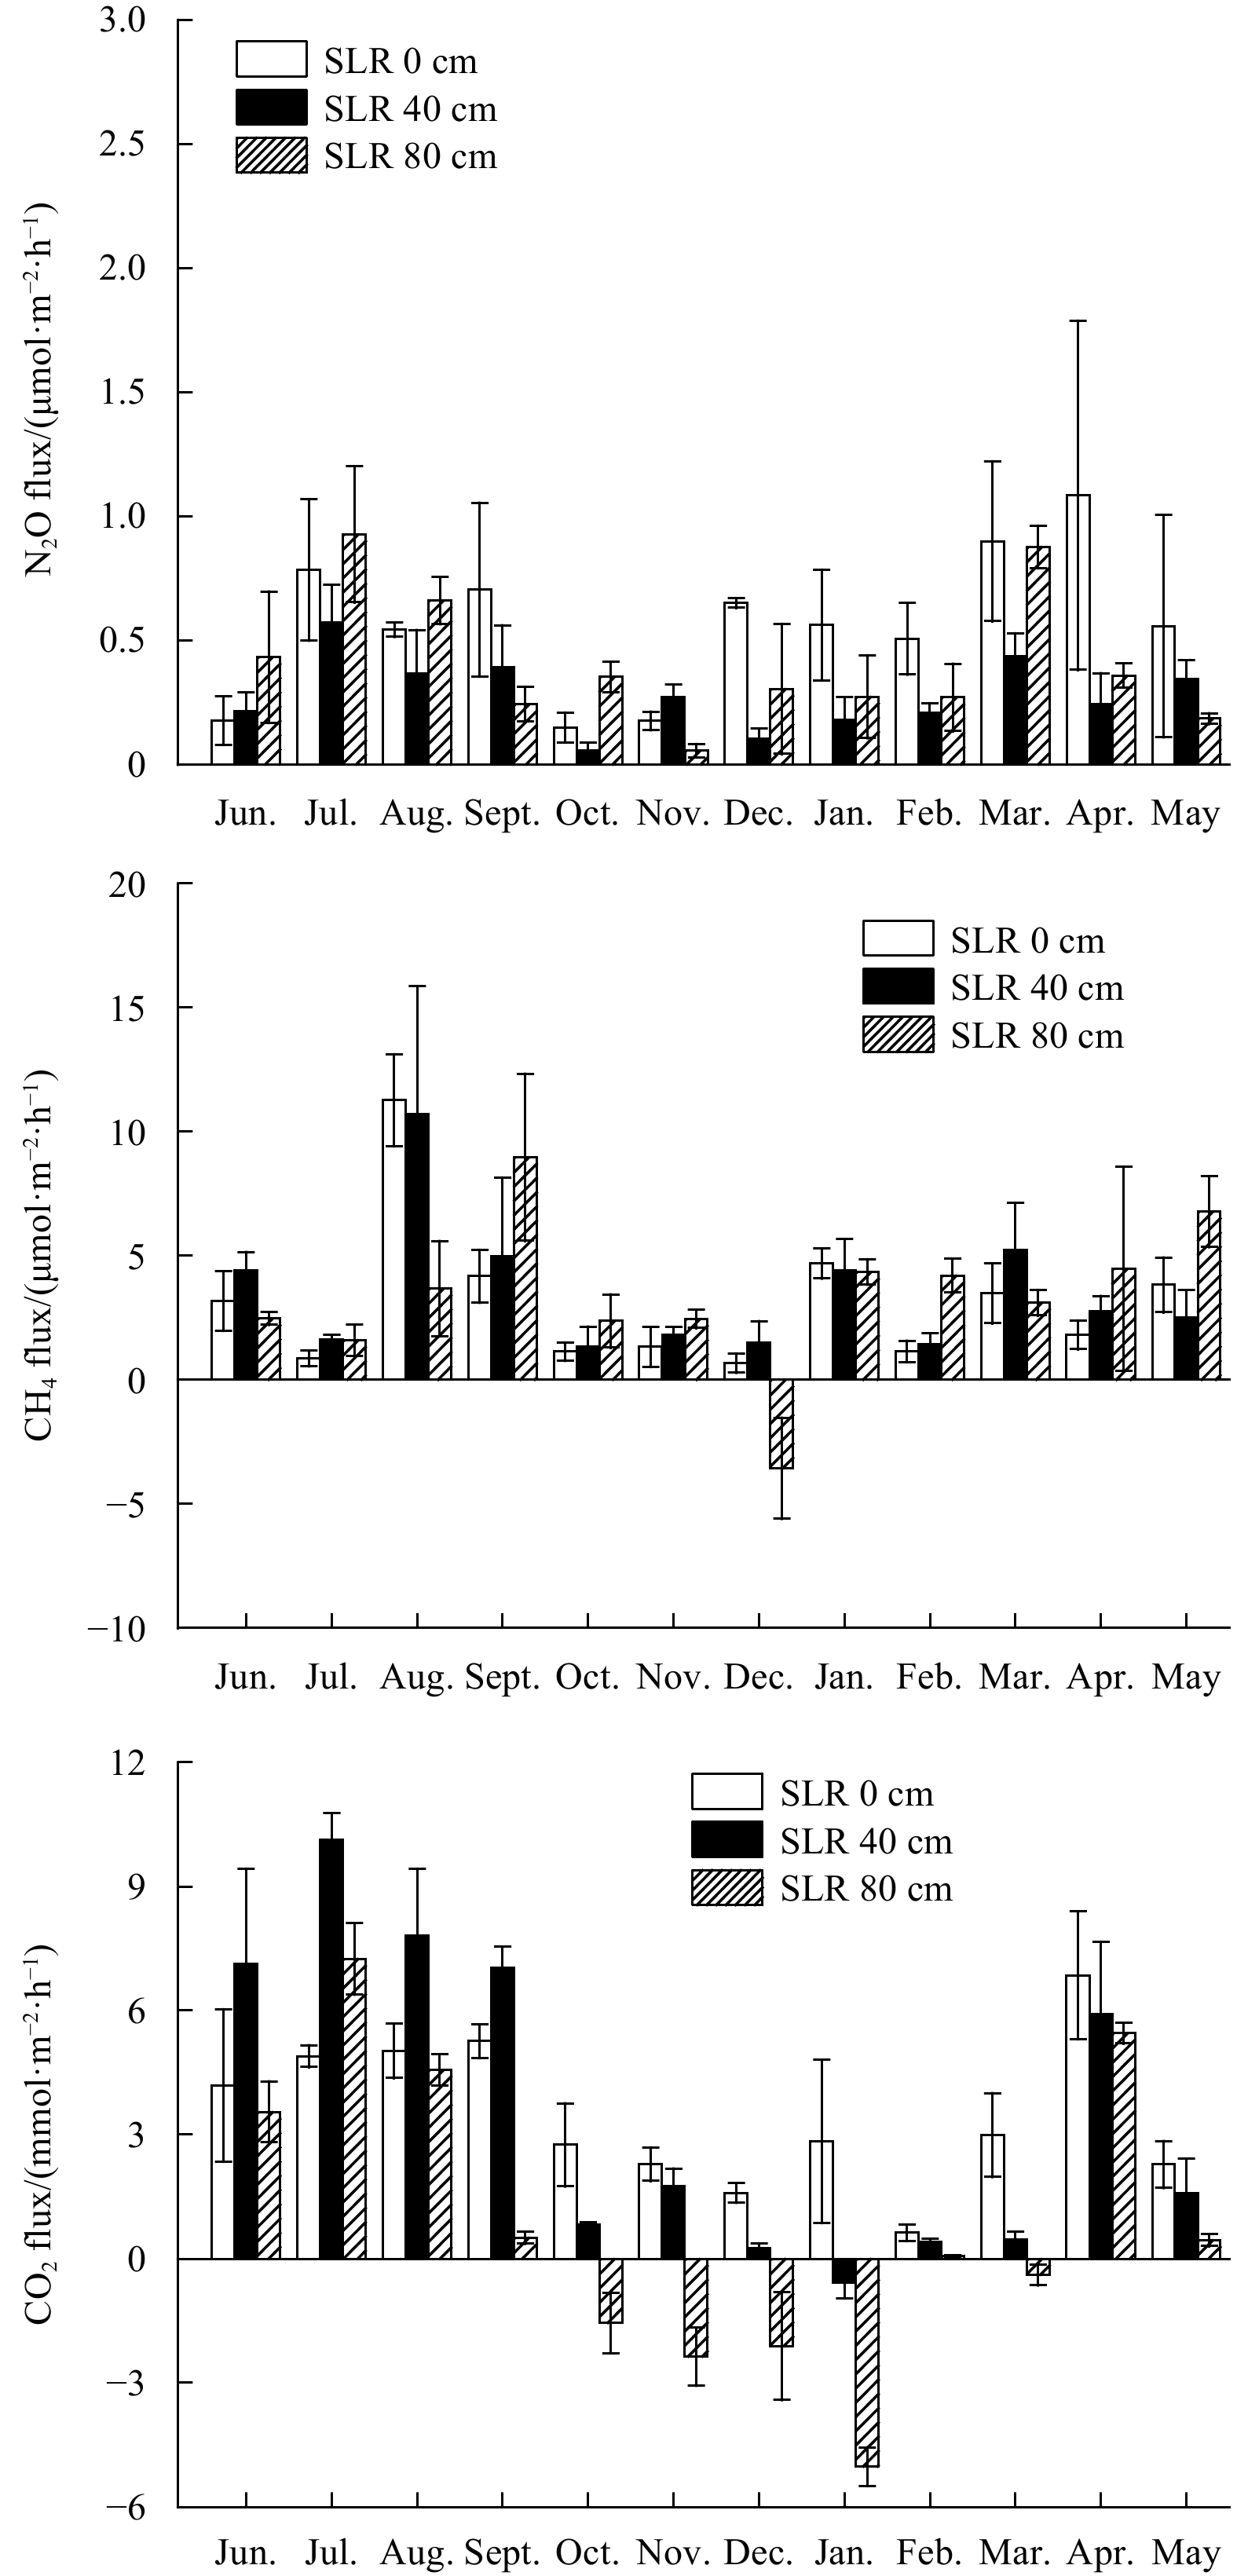
Both SLR (F=9.522, P<0.001) and months (F=4.479, P<0.001) had significant impacts on the N2O fluxes (Table 1). This parameter showed a decreasing order of Site SLR 0 cm ((0.57±0.28) μmol/(m2·h)), Site SLR 80 cm ((0.41±0.26) μmol/(m2·h)), Site SLR 40 cm ((0.28±0.14) μmol/(m2·h)). Significantly higher N2O fluxes were determined either in spring or summer months than that in autumn or winter months (Fig. 2). The lowest values were obtained in October at Sites SLR 40 cm and SLR 0 cm while in November at Site SLR 80 cm.
| Sources of variation | df | Parameter | ||||||
| OC | TN | TP | C/N | N2O flux | CH4 flux | CO2 flux | ||
| SLR | 2 | 257.387*** | 168.866*** | 74.294*** | 31.207*** | 9.522*** | 0.273 | 62.963*** |
| Month | 11 | 14.318*** | 22.277*** | 17.372*** | 2.588** | 4.479*** | 9.563*** | 56.088*** |
| Interaction | 22 | 7.284*** | 12.441*** | 3.778*** | 3.312*** | 1.357 | 2.195* | 6.589*** |
| Note: *, ** and *** indicate significant difference at p<0.05, p<0.01 and p<0.001, respectively. OC: organic carbon; TN: total nitrogen; TP: total phosphorus; C/N: C/N content ratio; SLR: sea level rise. | ||||||||
 DownLoad:
CSV
DownLoad:
CSV

In contrast to N2O fluxes, significant differences of CH4 fluxes were only found among different months (F=9.563, P<0.001) (Table 1). The lowest values were found in December at Sites SLR 80 cm and SLR 0 cm while in October at Site SLR 40 cm, and this parameter peaked in August at Sites SLR 0 cm and SLR 40 cm, and September at Site SLR 80 cm (Fig. 2). Contrary to the trend in the N2O fluxes, annual CH4 fluxes were highest at Site SLR 40 cm ((3.56±2.57) μmol/(m2·h)), followed by Site SLR 80 cm ((3.41±2.88) μmol/(m2·h)) and Site SLR 0 cm ((3.13±2.81) μmol/(m2·h)).
Annual CO2 fluxes were (0.87±3.48) mmol/(m2·h), (3.56±3.58) mmol/(m2·h) and (3.47±1.71) mmol/(m2·h) at Sites SLR 80 cm, SLR 40 cm and SLR 0 cm, respectively. SLR (F=62.963, P<0.001), month (F=56.088, P<0.001) and their interaction (F=6.589, P<0.001) had significant effects on the CO2 fluxes (Table 1, Fig. 2). This parameter showed an obvious temporal variation at all three sites, with lower values in autumn or winter months than that in spring or summer months. Although mangrove soils at Sites SLR 40 cm and SLR 80 cm were sources of CO2 over the entire year, they occasionally showed consumption of atmospheric CO2 especially during the cold months.
SLR (F=257.387, P<0.001) and month (F=14.318, P<0.001) had a significant interaction in terms of soil OC content at the three sites, which gradually decreased with SLR (Table 1, Fig. 3). Soil OC contents were (5.48±1.07) mg/g, (9.55±2.31) mg/g and (11.21±2.06) mg/g at Sites SLR 80 cm, SLR 40 cm and SLR 0 cm, respectively. At the three sites, a significant temporal trend of soil OC content was detected, with the highest value occurring either in spring or summer months.

Soil TN contents were (0.58±0.10) mg/g, (0.83±0.25) mg/g and (0.97±0.22) mg/g at Sites SLR 80 cm, SLR 40 cm and SLR 0 cm, respectively. SLR (F=168.866, P<0.001) and month (F=22.277, P<0.001) had a significant interaction (F=12.441, P<0.001) on the soil TN contents, which decreased with SLR (Table 1, Fig. 3). Significantly higher soil TN contents were determined in summer at Site SLR 40 cm, in autumn at Site SLR 0 cm while in spring at Site SLR 80 cm. Differences were observed throughout the whole year, with the values exhibiting the following order: SLR 80 cm < SLR 40 cm < SLR 0 cm. C/N content ratios were also significantly affected by SLR (F=31.207, P<0.001) and month (F=2.588, P<0.01) (Table 1), and the values were comparable between Sites SLR 40 cm and SLR 0 cm, with lower values observed at Site SLR 80 cm (Fig. 3).
Soil TP contents were at a less variable level throughout the entire year with mean values of (0.45±0.08) mg/g, (0.56±0.10) mg/g and (0.59±0.07) mg/g at Sites SLR 80 cm, SLR 40 cm and SLR 0 cm, respectively. SLR (F=74.294, P<0.001) and month (F=17.372, P<0.001) had a significant interaction (F=3.778, P<0.001) on this parameter which decreased with SLR (Table 1, Fig. 3). Significant temporal trends of soil TP content were detected with the highest value occurring either in spring or summer months at the three sites.
As shown in Table 2, there was a significantly positive correlation between N2O flux and soil TP content. CH4 flux was significantly positively correlated with soil TN content, but not with soil TP content. In comparison to N2O and CH4 fluxes, CO2 fluxes were strongly positively correlated with soil OC, TN and TP contents.
| Greenhouse gas | OC | TN | TP | C/N |
| N2O | 0.133 | 0.168 | 0.232* | 0.009 |
| CH4 | 0.171 | 0.299** | 0.143 | –0.163 |
| CO2 | 0.534** | 0.537** | 0.536** | 0.121 |
| Note: * and ** indicate significant r value at p<0.05 and p<0.01, respectively. OC: organic carbon; TN: total nitrogen; TP: total phosphorus; C/N: C/N content ratio. | ||||
DownLoad:
CSV
Annual N2O emissions at Sites SLR 80 cm and SLR 40 cm were 159.83 mg/(m2·a) and 108.98 mg/(m2·a), which were lower than that at Site SLR 0 cm (218.65 mg/(m2·a)). On the contrary, compared with annual CH4 emissions at Site SLR 0 cm, the values at Sites SLR 80 cm and SLR 40 cm increased by 7.4% and 13.5%. Furthermore, annual CO2 emission was comparable between Sites SLR 40 cm and SLR 0 cm, which was approximately 4 times higher than that at Site SLR 80 cm (Table 3).
| Emission | SLR 80 cm | SLR 40 cm | SLR 0 cm |
| N2O/(mg·m–2·a–1) | 159.83 | 108.98 | 218.65 |
| CH4/(mg·m–2·a–1) | 475.87 | 502.77 | 442.92 |
| CO2/(g·m–2·a–1) | 332.81 | 1373.72 | 1340.00 |
| Note: SLR: sea level rise. | |||
DownLoad:
CSV
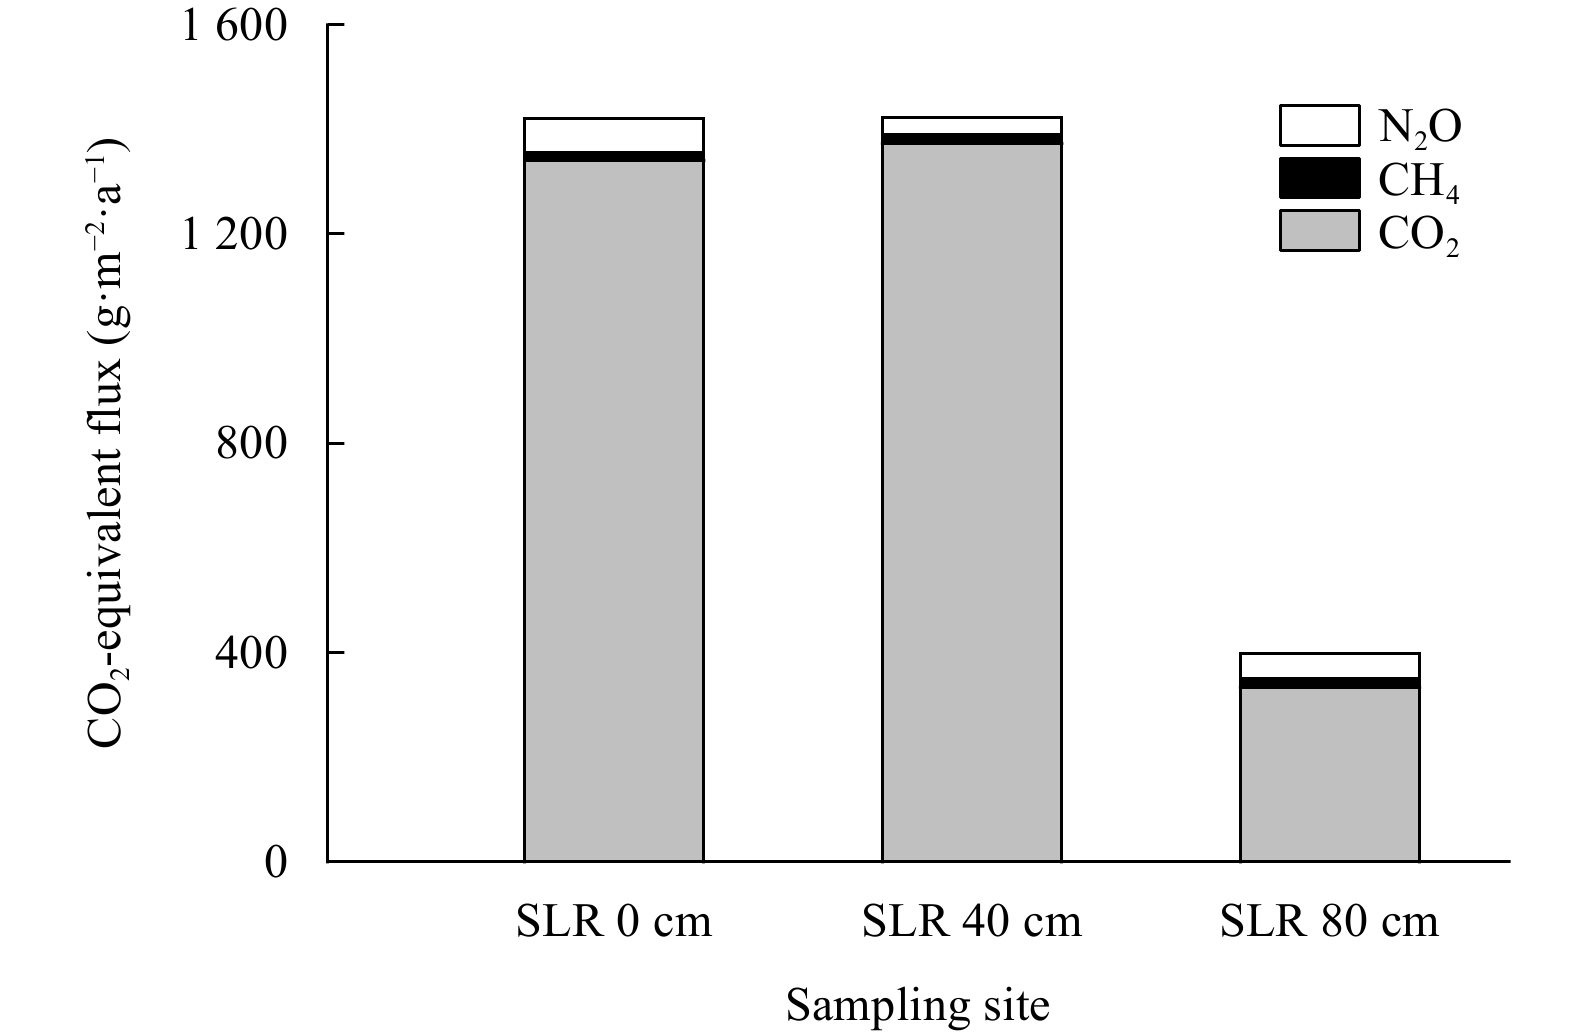
The CO2-equivalent fluxes were estimated by the summation of three gas fluxes with values of 396.61 g/(m2·a), 1423.29 g/(m2·a) and 1420.21 g/(m2·a) at Sites SLR 80 cm, SLR 40 cm and SLR 0 cm, respectively. The minimum contributor to greenhouse effect was CH4, only accounting for 1.06%–4.08% of CO2-equivalent fluxes at the three sites. When it came to the greatest contributor to greenhouse effect, it was CO2 for Sites SLR 0 cm, SLR 40 cm and SLR 80 cm, with a proportion reaching 83.91%–96.52% (Fig. 4).

Mangrove soils are known to constitute a net source of CO2, CH4 and N2O (Chen et al., 2010, 2012, 2015, 2016). As shown in Table 4, in the previous studies, the fluxes of CO2, CH4 and N2O ranged from 0.027 mmol/(m2·h) to 20.56 mmol/(m2·h) (Poungparn et al., 2009; Chen et al., 2010, 2015), from –130 μmol/(m2·h) to 5168.6 μmol/(m2·h) (Chauhan et al., 2008; Chen et al., 2010, 2015), from 0.13 μmol/(m2·h) to 126 μmol/(m2·h) (Corredor et al., 1999; Chen et al., 2010, 2015, 2020a), respectively. In the present study, the fluxes of CO2, CH4 and N2O at Site SLR 0 cm were 3.47 mmol/(m2·h), 3.13 μmol/(m2·h) and 0.57 μmol/(m2·h), respectively, which were in broad agreement with records from previous studies. However, the fluxes of CO2, CH4 and N2O at Sites SLR 40 cm and SLR 80 cm were changed due to SLR. Compared with Site SLR 0 cm, N2O decreased by approximately 27.3% at Site SLR 80 cm and 50.2% at Site SLR 40 cm. This flux is closely controlled by water level (tidal influence), soil oxygen availability, soil salinity and soil nutrient environments (Menyailo et al., 1997; Inubushi et al., 1999; Chen et al., 2010; Jørgensen and Elberling, 2012). On the one hand, N2O may be converted to N2 or consumed before it gets emitted to the atmosphere depending upon the soil saturation status (Heincke and Kaupenjohann, 1999; Clough et al., 2005; Chapuis-Lardy et al., 2007; Chen et al., 2012). Higher soil water content found at Sites SLR 40 cm and SLR 80 cm resulted in soil in the saturation status (Chen et al., 2022b). N2O may be converted to N2 or consumed, resulting in lower N2O fluxes at Sites SLR 80 cm and SLR 40 cm. On the other hand, salinity has been shown to inhibit complete denitrification (N2O was converted to N2 or consumed) due to the decrease in the proportion of N2O reducing microorganisms with increasing salinization, potentially allowing for a build-up of N2O (Menyailo et al., 1997; Inubushi et al., 1999). Low salinity levels at Sites SLR 80 cm and SLR 40 cm caused by SLR (Chen et al., 2022b) did not inhibit complete denitrification, resulting in less build-up of N2O in the soils. Meanwhile, lower soil TN content, including inorganic nitrogen, which indirectly represented soil nutrient environments at Sites SLR 40 cm and SLR 80 cm, may limit microbes to generate N2O which could explain the phenomenon in the present study.
| Location | CO2 flux/(mmol·m–2·h–1) | CH4 flux/(μmol·m–2·h–1) | N2O flux/(μmol·m–2·h–1) | Reference |
| Bay of La Parguera, Southwest Puerto Rico;Bird Island, Southwest Puerto Rico;Magueyes Island, Southwest Puerto Rico | ND | 8.57–188.89 | 0.13–8.58 | Corredor et al. (1999) |
| Bhitarkanika, eastern coast of India | ND | 5.09–179.44 | 0.23–20.79 | Chauhan et al. (2008) |
| The secondary mangrove forests of eastern Thailand | 0.027–0.052 | ND | ND | Poungparn et al. (2009) |
| Maipo Natural Reserve, Hong Kong, South China;Futian mangrove forest, Shenzhen, South China | 0.69–20.56 | 11.9–5168.6 | 0.14–23.83 | Chen et al. (2010) |
| Jiulong River Estuary Mangrove Reserve | 0.85–3.20 | 2.00–21.70 | 0.13–1.96 | Chen et al. (2015) |
| Jiulong River Estuary Mangrove | ND | –130–1800 | 4–126 | Chen et al. (2020) |
| Note: ND: no determination of the in situ gas flux. | ||||
DownLoad:
CSV
Contrary to N2O fluxes, CH4 fluxes at Sites SLR 80 cm and SLR 40 cm were higher than that at Site SLR 0 cm. CH4 fluxes are controlled by water levels and CH4 fluxes will be discharged in large quantities at high water levels (Christensen et al., 2003; Wei et al., 2020). In the present study, higher soil water levels were found at Sites SLR 80 cm and SLR 40 cm compared with Site SLR 0 cm (Chen et al., 2022b). Water levels at Sites SLR 80 cm and SLR 40 cm may surpass the threshold which controlled CH4 fluxes, resulting in higher CH4 fluxes at Sites SLR 80 cm and SLR 40 cm. On the other hand, CH4 fluxes in the mangrove environments were enhanced at the low salinity due to the intense oxidation or an alleviation of competition by the more energetically efficient sulfate- and nitrate-reducing bacteria than methanogenic archaea (Chen et al., 2010, 2018; Poffenbarger et al., 2011). Low soil salinity found at Sites SLR 80 cm and SLR 40 cm potentially decreased
In the former studies, a negative relationship between water content and CO2 fluxes was found (e.g., Alongi, 2009; Chen et al., 2010, 2012; Chambers et al., 2013). In the present study, mean inundation times at Sites SLR 80 cm, SLR 40 cm and SLR 0 cm were 10 h/d, 8 h/d and 6 h/d (i.e., 5 h, 4 h and 3 h per tide), respectively. Although higher soil water content was determined at Site SLR 40 cm, annual CO2 fluxes at Sites SLR 40 cm and SLR 0 cm were similar. CO2 fluxes decreased by approximately 75% only when the sea level rose to 80 cm. There may be a threshold of water levels that controls CO2 fluxes and this threshold was opened at Site SLR 80 cm, resulting in low CO2 fluxes at Site SLR 80 cm. Meanwhile, sulfate effect was a main biogeochemical driver that influenced OC cycling in the wetland soils (Chambers et al., 2013). The lowest soil salinity at Site SLR 80 cm decreased
In order to estimate the respective contributions of these three fluxes to CO2-equivalent fluxes, all three greenhouse gas fluxes were converted to CO2-equivalent fluxes on a 100 a time scale based on annual greenhouse gas fluxes. Mangrove soils at the three sites had a positive CO2-equivalent fluxes, and CO2-equivalent fluxes were comparable between Sites SLR 40 cm and SLR 0 cm due to CO2 fluxes. However, the estimation of CO2-equivalent fluxes from mangrove soils decreased under the influence of rising sea-level by 80 cm, which was attributed more to the decrease of N2O and CO2 fluxes at Site SLR 80 cm. On the other hand, CO2 was the primary contributor of mangrove soils to CO2-equivalent fluxes at Sites SLR 0 cm, SLR 40 cm and SLR 80 cm, as reported in the previous studies (Chen et al., 2010, 2012, 2015, 2016). However, SLR changed the contribution rates of CH4 and N2O fluxes to CO2-equivalent fluxes. At Site SLR 80 cm, the contribution rate of CH4 and N2O to CO2-equivalent fluxes were up to 4.08% and 12.01%. The warming potential of trace CH4 and N2O was non-negligible and should be considered in the evaluation of the warming effect on the soil gas emissions especially for mangrove forests and other coastal wetlands subjected to SLR.
Different intertidal elevations are used to represent different tidal flooding situations that might be expected with rising sea level. This study found the differences in the soil-atmosphere greenhouse gas emissions with SLR. However, some questions were not considered in this study. Firstly, three intertidal elevations were used to represent different tidal flooding situations of SLR and SLR impacts were not directly observed in this study. Some mangroves have adjusted to sea level rise and avoided submergence by accreting soil (Krauss et al., 2014). Adaptation of mangroves to SLR was not considered in the present study. Long-term observations of effect of SLR on the soil-atmosphere greenhouse gas emissions and even the whole mangrove ecosystem should be considered in the future studies. Secondly, sea levels were different at the different areas, and sea level may even reach 200 cm by the end of the 21st century based on Representative Concentration Pathway Scenarios (Mafi-Gholami et al., 2020). Data of SLR was only based on the average increase in sea level in China. Considered with complexity of SLR, without a doubt, more samples should be collected at the different areas with different SLR conditions to fully clarify effects of SLR on the soil-atmosphere greenhouse gas emissions and even the whole mangrove ecosystem in the future studies. Finally, although potential effects and possible mechanisms of SLR on the soil-atmosphere greenhouse gas emissions were found through different tidal flooding situations of SLR, specific mechanisms of SLR on the three greenhouse gas emissions were not considered in the present study and specific mechanisms should be considered in the next studies.
In the present study, three intertidal elevations were used to represent different tidal flooding situations of SLR to clarify potential effects of SLR on the soil-atmosphere greenhouse gas emissions in mangrove soils. On the one hand, higher soil water content, and lower salinity and soil nutrition environments caused by SLR may limit microbes to generate N2O which resulted in significantly lower N2O fluxes at Site SLR 80 cm. Lower salinity, higher soil water content and soil pH caused by SLR stimulated CH4 production at Sites SLR 80 cm and SLR 40 cm. Significantly lower CO2 fluxes were found at Site SLR 80 cm due to higher soil water content, lower salinity, lower OC availability and soil nutrient environments. On the other hand, the lowest CO2-equivalent fluxes were determined at Site SLR 80 cm due to lower N2O and CO2 fluxes. Contribution rates of N2O and CH4 to CO2-equivalent fluxes were up to the highest value at Site SLR 80 cm and warming potential of trace CH4 and N2O was non-negligible with SLR. Therefore, potential effects of SLR on the soil-atmosphere greenhouse gas emissions and even blue carbon capability of the whole mangrove ecosystem should be attended continuously in the future studies.
Acknowledgements: The authors thank Yingying Huang, Jin Wang and Dan Liu for their helps in field sampling and laboratory chemical analysis. We thank the anonymous reviewers of this manuscript for their constructive comments.|
Allen S E, Grimshaw H M, Parkinson J A, et al. 1974. Chemical Analysis of Ecological Materials. Oxford: Blackwell Scientific Publications
|
|
Alongi D M. 2009. The Energetics of Mangrove Forests. Dordrecht: Springer
|
|
Alongi D M. 2014. Carbon cycling and storage in mangrove forests. Annual Review of Marine Science, 6: 195–219. doi: 10.1146/annurev-marine-010213-135020
|
|
Breithaupt J L, Smoak J M, Smith III T J, et al. 2012. Organic carbon burial rates in mangrove sediments: strengthening the global budget. Global Biogeochemical Cycles, 26(3): GB3011
|
|
Capooci M, Barba J, Seyfferth A L, et al. 2019. Experimental influence of storm-surge salinity on soil greenhouse gas emissions from a tidal salt marsh. Science of the Total Environment, 686: 1164–1172. doi: 10.1016/j.scitotenv.2019.06.032
|
|
Chambers L G, Osborne T Z, Reddy K R. 2013. Effect of salinity-altering pulsing events on soil organic carbon loss along an intertidal wetland gradient: a laboratory experiment. Biogeochemistry, 115(1): 363–383
|
|
Chang Tsan-Chang, Yang Shang-Shyng. 2003. Methane emission from wetlands in Taiwan. Atmospheric Environment, 37(32): 4551–4558. doi: 10.1016/S1352-2310(03)00588-0
|
|
Chapuis-Lardy L, Wrage N, Metay A, et al. 2007. Soils, a sink for N2O? A review. Global Biogeochemical Cycles, 13(1): 1–17
|
|
Chauhan R, Ramanathan A L, Adhya T K. 2008. Assessment of methane and nitrous oxide flux from mangroves along eastern coast of India. Geofluids, 8(4): 321–332. doi: 10.1111/j.1468-8123.2008.00227.x
|
|
Chen Guangcheng, Chen Jiahui, Ou Danyun, et al. 2020a. Increased nitrous oxide emissions from intertidal soil receiving wastewater from dredging shrimp pond sediments. Environmental Research Letters, 15(9): 094015. doi: 10.1088/1748-9326/ab93fb
|
|
Chen Yaping, Chen Guangcheng, Ye Yong. 2015. Coastal vegetation invasion increases greenhouse gas emission from wetland soils but also increases soil carbon accumulation. Science of the Total Environment, 526: 19–28. doi: 10.1016/j.scitotenv.2015.04.077
|
|
Chen Guangcheng, Chen Bin, Yu Dan, et al. 2016. Soil greenhouse gas emissions reduce the contribution of mangrove plants to the atmospheric cooling effect. Environmental Research Letters, 11(12): 124019. doi: 10.1088/1748-9326/11/12/124019
|
|
Chen Jiahui, Gao Min, Chen Guangcheng, et al. 2022a. Biomass accumulation and organic carbon stocks of Kandelia obovata mangrove vegetation under different simulated sea levels. Acta Oceanologica Sinica, 41(8): 78–86. doi: 10.1007/s13131-021-1891-2
|
|
Chen Guangcheng, Gao Min, Pang Bopeng, et al. 2018. Top-meter soil organic carbon stocks and sources in restored mangrove forests of different ages. Forest Ecology and Management, 422: 87–94. doi: 10.1016/j.foreco.2018.03.044
|
|
Chen Jiahui, Huang Yingying, Chen Guangcheng, et al. 2020b. Effects of simulated sea level rise on stocks and sources of soil organic carbon in Kandelia obovata mangrove forests. Forest Ecology and Management, 460: 117898. doi: 10.1016/j.foreco.2020.117898
|
|
Chen Guangcheng, Tam N F Y, Ye Yanlei. 2010. Summer fluxes of atmospheric greenhouse gases N2O, CH4 and CO2 from mangrove soil in South China. Science of the Total Environment, 408(13): 2761–2767. doi: 10.1016/j.scitotenv.2010.03.007
|
|
Chen Guangcheng, Tam Nora F Y, Ye Yong. 2012. Spatial and seasonal variations of atmospheric N2O and CO2 fluxes from a subtropical mangrove swamp and their relationships with soil characteristics. Soil Biology and Biochemistry, 48: 175–181. doi: 10.1016/j.soilbio.2012.01.029
|
|
Chen Luzhen, Wang Wenqing. 2017. Ecophysiological responses of viviparous mangrove Rhizophora stylosa seedlings to simulated sea-level rise. Journal of Coastal Research, 33(6): 1333–1340
|
|
Chen Yaping, Ye Yong. 2013. Growth and physiological responses of saplings of two mangrove species to intertidal elevation. Marine Ecology Progress Series, 482: 107–118. doi: 10.3354/meps10274
|
|
Chen Yaping, Ye Yong. 2014. Early responses of Avicennia marina (Forsk.) Vierh. to intertidal elevation and light level. Aquatic Botany, 112: 33–40. doi: 10.1016/j.aquabot.2013.07.006
|
|
Chen Jiahui, Zhu Heng, Huang Yingying, et al. 2022b. Potential effects of sea level rise on decomposition and nutrient release of dead fine roots in a Kandelia obovata forest. Estuarine, Coastal and Shelf Science, 268: 107809
|
|
Christensen T R, Ekberg A, Ström L, et al. 2003. Factors controlling large scale variations in methane emissions from wetlands. Geophysical Research Letters, 30(7): 1414
|
|
Clough T J, Sherlock R R, Rolston D E. 2005. A review of the movement and fate of N2O in the subsoil. Nutrient Cycling in Agroecosystems, 72(1): 3–11. doi: 10.1007/s10705-004-7349-z
|
|
Corredor J E, Morell J M, Bauza J. 1999. Atmospheric nitrous oxide fluxes from mangrove sediments. Marine Pollution Bulletin, 38(6): 473–478. doi: 10.1016/S0025-326X(98)00172-6
|
|
Davidson N C, Fluet-Chouinard E, Finlayson C M. 2018. Global extent and distribution of wetlands: trends and issues. Marine and Freshwater Research, 69(4): 620–627. doi: 10.1071/MF17019
|
|
Donato D C, Kauffman J B, Murdiyarso D, et al. 2011. Mangroves among the most carbon-rich forests in the tropics. Nature Geoscience, 4(5): 293–297. doi: 10.1038/ngeo1123
|
|
Heincke M, Kaupenjohann M. 1999. Effects of soil solution on the dynamics of N2O emissions: a review. Nutrient Cycling in Agroecosystems, 55(2): 133–157. doi: 10.1023/A:1009842011599
|
|
Inubushi K, Barahona M A, Yamakawa K. 1999. Effects of salts and moisture content on N2O emission and nitrogen dynamics in yellow soil and andosol in model experiments. Biology and Fertility of Soils, 29(4): 401–407. doi: 10.1007/s003740050571
|
|
IPCC. 2013. Climate Change: The Physical Science Basis. Contribution of Working Group I to the Fifth Assessment Report of the Intergovernmental Panel on Climate Change. Cambridge: Cambridge University Press
|
|
Jayanthi M, Thirumurthy S, Samynathan M, et al. 2018. Shoreline change and potential sea level rise impacts in a climate hazardous location in southeast coast of India. Environmental Monitoring and Assessment, 190(1): 51. doi: 10.1007/s10661-017-6426-0
|
|
Jørgensen C J, Elberling B. 2012. Effects of flooding-induced N2O production, consumption and emission dynamics on the annual N2O emission budget in wetland soil. Soil Biology and Biochemistry, 53: 9–17. doi: 10.1016/j.soilbio.2012.05.005
|
|
Kirwan M L, Gedan K B. 2019. Sea-level driven land conversion and the formation of ghost forests. Nature Climate Change, 9(6): 450–457. doi: 10.1038/s41558-019-0488-7
|
|
Krauss K W, McKee K L, Lovelock C E, et al. 2014. How mangrove forests adjust to rising sea level. New Phytologist, 202(1): 19–34. doi: 10.1111/nph.12605
|
|
Langston A K, Kaplan D A, Putz F E. 2017. A casualty of climate change? Loss of freshwater forest islands on Florida’s Gulf Coast. Global Change Biology, 23(12): 5383–5397. doi: 10.1111/gcb.13805
|
|
Liikanen A, Martikainen P J. 2003. Effect of ammonium and oxygen on methane and nitrous oxide fluxes across sediment-water interface in a eutrophic lake. Chemosphere, 52(8): 1287–1293. doi: 10.1016/S0045-6535(03)00224-8
|
|
Liu Chuan, Li Ya, Wang Hui. 2019. Ocean Blue Book on Climate Change in China in 2019 (in Chinese). Tianjin: National Oceanographic Information Center, Ministry of Natural Resources of the People’s Republic of China
|
|
Lovelock C E, Cahoon D R, Friess D A, et al. 2015. The vulnerability of Indo-Pacific mangrove forests to sea-level rise. Nature, 526(7574): 559–563. doi: 10.1038/nature15538
|
|
Mafi-Gholami D, Zenner E K, Jaafari A. 2020. Mangrove regional feedback to sea level rise and drought intensity at the end of the 21st century. Ecological Indicators, 110: 105972. doi: 10.1016/j.ecolind.2019.105972
|
|
McLeod E, Chmura G L, Bouillon S, et al. 2011. A blueprint for blue carbon: toward an improved understanding of the role of vegetated coastal habitats in sequestering CO2. Frontiers in Ecology and the Environment, 9(10): 552–560. doi: 10.1890/110004
|
|
Meeder J F, Parkinson R W, Ogurcak D, et al. 2021. Changes in sediment organic carbon accumulation under conditions of historical sea-level rise, Southeast Saline Everglades, Florida, USA. Wetlands, 41(4): 41. doi: 10.1007/s13157-021-01440-7
|
|
Menyailo O V, Stepanov A L, Umarov M M. 1997. The transformation of nitrous oxide by denitrifying bacteria in Solonchaks. Eurasian Soil Science, 30(2): 178–180
|
|
Minick K J, Mitra B, Noormets A, et al. 2019. Saltwater reduces potential CO2 and CH4 production in peat soils from a coastal freshwater forested wetland. Biogeosciences, 16(23): 4671–4686. doi: 10.5194/bg-16-4671-2019
|
|
Myhre G, Shindell D, Bréon F M, et al. 2013. Anthropogenic and natural radiative forcing. In: Stocker T F, Qin D, Plattner G K, et al., eds. Climate Change 2013: The Physical Science Basis. Contribution of Working Group I to the Fifth Assessment Report of the Intergovernmental Panel on Climate Change. Cambridge: Cambridge University Press
|
|
Perera K A R S, De Silva K H W L, Amarasinghe M D. 2018. Potential impact of predicted sea level rise on carbon sink function of mangrove ecosystems with special reference to Negombo estuary, Sri Lanka. Global and Planetary Change, 161: 162–171. doi: 10.1016/j.gloplacha.2017.12.016
|
|
Poffenbarger H J, Needelman B A, Megonigal J P. 2011. Salinity influence on methane emissions from tidal marshes. Wetlands, 31(5): 831–842. doi: 10.1007/s13157-011-0197-0
|
|
Poungparn S, Komiyama A, Tanaka A, et al. 2009. Carbon dioxide emission through soil respiration in a secondary mangrove forest of eastern Thailand. Journal of Tropical Ecology, 25(4): 393–400. doi: 10.1017/S0266467409006154
|
|
Rogers K, Kelleway J J, Saintilan N, et al. 2019. Wetland carbon storage controlled by millennial-scale variation in relative sea-level rise. Nature, 567(7746): 91–95. doi: 10.1038/s41586-019-0951-7
|
|
Ruan Hailin, Yang Yanming, Li Yanchu, et al. 2010. Study of the variation in sea level around Taiwan Island during the last 16 years. Journal of Oceanography in Taiwan Strait (in Chinese), 29(3): 394–401
|
|
Sheng Nong, Wu Feng, Liao Baowen, et al. 2021. Methane and carbon dioxide emissions from cultivated and native mangrove species in Dongzhai Harbor, Hainan. Ecological Engineering, 168: 106285. doi: 10.1016/j.ecoleng.2021.106285
|
|
Stumm W, Morgan J J. 1981. Aquatic Chemistry: An Introduction Emphasizing Chemical Equilibria in Natural Waters. 2nd ed. New York: John Wiley & Sons, 448–463
|
|
Wang Gang, Guan Dongsheng, Xiao Ling, et al. 2019. Ecosystem carbon storage affected by intertidal locations and climatic factors in three estuarine mangrove forests of South China. Regional Environmental Change, 19(6): 1701–1712. doi: 10.1007/s10113-019-01515-6
|
|
Wei Siyu, Han Guangxuan, Chu Xiaojing, et al. 2020. Effect of tidal flooding on ecosystem CO2 and CH4 fluxes in a salt marsh in the Yellow River Delta. Estuarine, Coastal and Shelf Science, 232: 106512
|
|
Ye Yong, Gu Yantao, Gao Haiyan, et al. 2010. Combined effects of simulated tidal sea-level rise and salinity on seedlings of a mangrove species, Kandelia candel (L. ) Druce. Hydrobiologia, 641(1): 287–300. doi: 10.1007/s10750-010-0099-9
|
|
Zhang Zhen, Fluet-Chouinard E, Jensen K, et al. 2021. Development of the global dataset of Wetland Area and Dynamics for Methane Modeling (WAD2M). Earth System Science Data, 13(5): 2001–2023. doi: 10.5194/essd-13-2001-2021
|

Figures(4) / Tables(4)

Supported by:
Beijing Renhe Information Technology Co. Ltd

Jiahui Chen, Shichen Zeng, Min Gao, Guangcheng Chen, Heng Zhu, Yong Ye. Potential effects of sea level rise on the soil-atmosphere greenhouse gas emissions in Kandelia obovata mangrove forests[J]. Acta Oceanologica Sinica, 2023, 42(4): 25-32. doi: 10.1007/s13131-022-2087-0

| Sources of variation | df | Parameter | ||||||
| OC | TN | TP | C/N | N2O flux | CH4 flux | CO2 flux | ||
| SLR | 2 | 257.387*** | 168.866*** | 74.294*** | 31.207*** | 9.522*** | 0.273 | 62.963*** |
| Month | 11 | 14.318*** | 22.277*** | 17.372*** | 2.588** | 4.479*** | 9.563*** | 56.088*** |
| Interaction | 22 | 7.284*** | 12.441*** | 3.778*** | 3.312*** | 1.357 | 2.195* | 6.589*** |
| Note: *, ** and *** indicate significant difference at p<0.05, p<0.01 and p<0.001, respectively. OC: organic carbon; TN: total nitrogen; TP: total phosphorus; C/N: C/N content ratio; SLR: sea level rise. | ||||||||
DownLoad:
CSV
| Greenhouse gas | OC | TN | TP | C/N |
| N2O | 0.133 | 0.168 | 0.232* | 0.009 |
| CH4 | 0.171 | 0.299** | 0.143 | –0.163 |
| CO2 | 0.534** | 0.537** | 0.536** | 0.121 |
| Note: * and ** indicate significant r value at p<0.05 and p<0.01, respectively. OC: organic carbon; TN: total nitrogen; TP: total phosphorus; C/N: C/N content ratio. | ||||
DownLoad:
CSV
| Emission | SLR 80 cm | SLR 40 cm | SLR 0 cm |
| N2O/(mg·m–2·a–1) | 159.83 | 108.98 | 218.65 |
| CH4/(mg·m–2·a–1) | 475.87 | 502.77 | 442.92 |
| CO2/(g·m–2·a–1) | 332.81 | 1373.72 | 1340.00 |
| Note: SLR: sea level rise. | |||
DownLoad:
CSV
| Location | CO2 flux/(mmol·m–2·h–1) | CH4 flux/(μmol·m–2·h–1) | N2O flux/(μmol·m–2·h–1) | Reference |
| Bay of La Parguera, Southwest Puerto Rico;Bird Island, Southwest Puerto Rico;Magueyes Island, Southwest Puerto Rico | ND | 8.57–188.89 | 0.13–8.58 | Corredor et al. (1999) |
| Bhitarkanika, eastern coast of India | ND | 5.09–179.44 | 0.23–20.79 | Chauhan et al. (2008) |
| The secondary mangrove forests of eastern Thailand | 0.027–0.052 | ND | ND | Poungparn et al. (2009) |
| Maipo Natural Reserve, Hong Kong, South China;Futian mangrove forest, Shenzhen, South China | 0.69–20.56 | 11.9–5168.6 | 0.14–23.83 | Chen et al. (2010) |
| Jiulong River Estuary Mangrove Reserve | 0.85–3.20 | 2.00–21.70 | 0.13–1.96 | Chen et al. (2015) |
| Jiulong River Estuary Mangrove | ND | –130–1800 | 4–126 | Chen et al. (2020) |
| Note: ND: no determination of the in situ gas flux. | ||||
DownLoad:
CSV
| Sources of variation | df | Parameter | ||||||
| OC | TN | TP | C/N | N2O flux | CH4 flux | CO2 flux | ||
| SLR | 2 | 257.387*** | 168.866*** | 74.294*** | 31.207*** | 9.522*** | 0.273 | 62.963*** |
| Month | 11 | 14.318*** | 22.277*** | 17.372*** | 2.588** | 4.479*** | 9.563*** | 56.088*** |
| Interaction | 22 | 7.284*** | 12.441*** | 3.778*** | 3.312*** | 1.357 | 2.195* | 6.589*** |
| Note: *, ** and *** indicate significant difference at p<0.05, p<0.01 and p<0.001, respectively. OC: organic carbon; TN: total nitrogen; TP: total phosphorus; C/N: C/N content ratio; SLR: sea level rise. | ||||||||
| Greenhouse gas | OC | TN | TP | C/N |
| N2O | 0.133 | 0.168 | 0.232* | 0.009 |
| CH4 | 0.171 | 0.299** | 0.143 | –0.163 |
| CO2 | 0.534** | 0.537** | 0.536** | 0.121 |
| Note: * and ** indicate significant r value at p<0.05 and p<0.01, respectively. OC: organic carbon; TN: total nitrogen; TP: total phosphorus; C/N: C/N content ratio. | ||||
| Emission | SLR 80 cm | SLR 40 cm | SLR 0 cm |
| N2O/(mg·m–2·a–1) | 159.83 | 108.98 | 218.65 |
| CH4/(mg·m–2·a–1) | 475.87 | 502.77 | 442.92 |
| CO2/(g·m–2·a–1) | 332.81 | 1373.72 | 1340.00 |
| Note: SLR: sea level rise. | |||
| Location | CO2 flux/(mmol·m–2·h–1) | CH4 flux/(μmol·m–2·h–1) | N2O flux/(μmol·m–2·h–1) | Reference |
| Bay of La Parguera, Southwest Puerto Rico;Bird Island, Southwest Puerto Rico;Magueyes Island, Southwest Puerto Rico | ND | 8.57–188.89 | 0.13–8.58 | Corredor et al. (1999) |
| Bhitarkanika, eastern coast of India | ND | 5.09–179.44 | 0.23–20.79 | Chauhan et al. (2008) |
| The secondary mangrove forests of eastern Thailand | 0.027–0.052 | ND | ND | Poungparn et al. (2009) |
| Maipo Natural Reserve, Hong Kong, South China;Futian mangrove forest, Shenzhen, South China | 0.69–20.56 | 11.9–5168.6 | 0.14–23.83 | Chen et al. (2010) |
| Jiulong River Estuary Mangrove Reserve | 0.85–3.20 | 2.00–21.70 | 0.13–1.96 | Chen et al. (2015) |
| Jiulong River Estuary Mangrove | ND | –130–1800 | 4–126 | Chen et al. (2020) |
| Note: ND: no determination of the in situ gas flux. | ||||
 DownLoad:


 DownLoad: