


Figure
1.
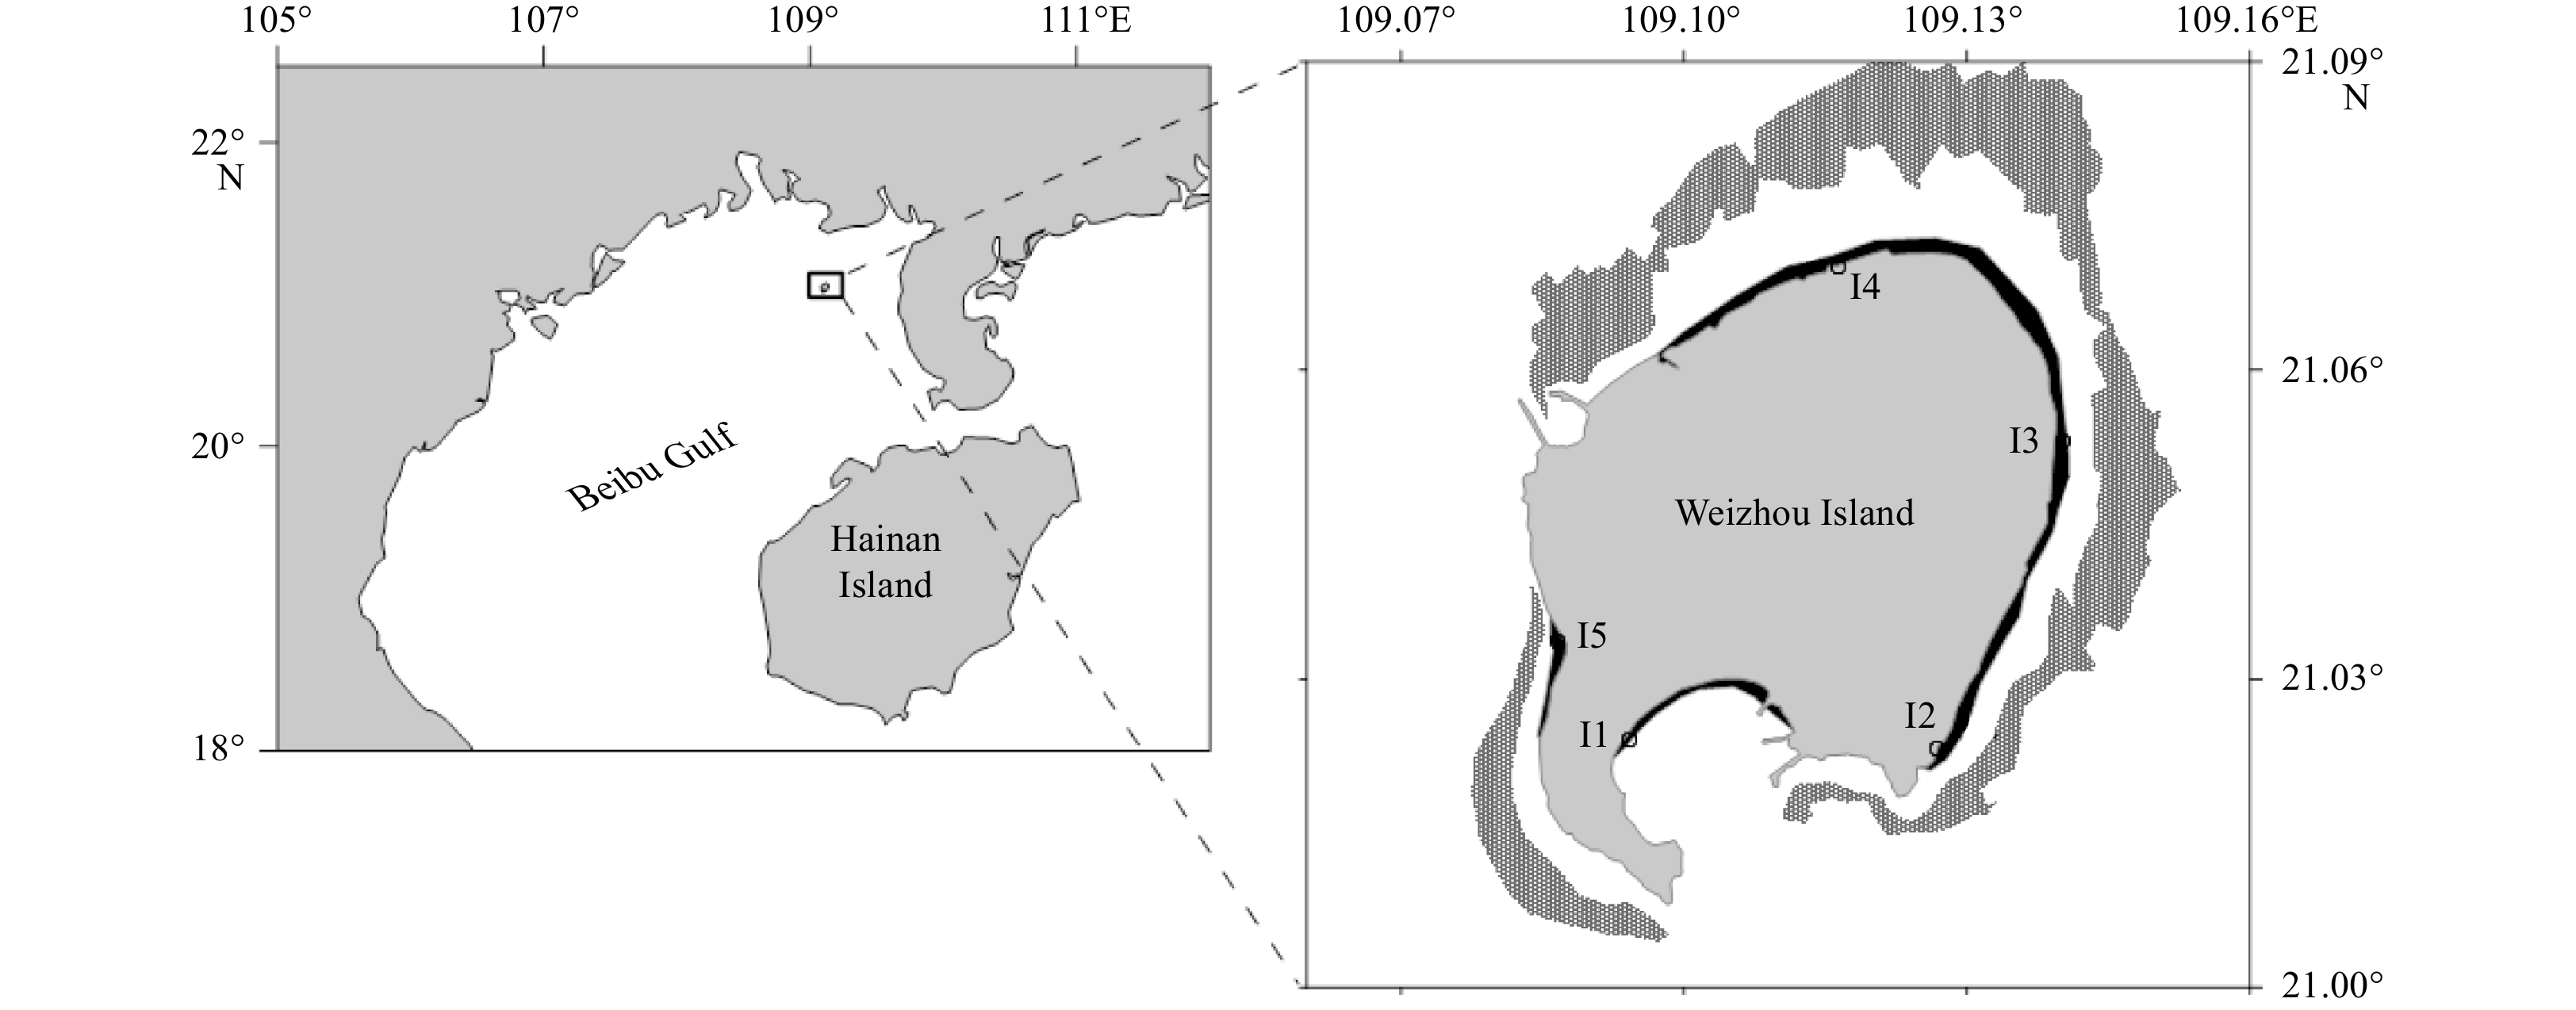
Sampling stations in the tidal flats (the black areas) around Weizhou Island. The dark grey areas are coral covering areas. I1−I5 are the station IDs.
| Citation: | Zhiming Ning, Ronglin Xia, Bin Yang, Cao Fang, Wei Jiang, Guodong Song. Sedimentary nitrogen dynamics in a coastal reef area with relatively high nitrogen concentration[J]. Acta Oceanologica Sinica, 2023, 42(4): 33-40. doi: 10.1007/s13131-022-2088-z

|
Coral reefs have the most abundant marine biological resources, and thus, the serious degradation of coral reefs around the world has attracted extensive attention (Eakin et al., 2019; Hughes et al., 2003). Although coral thermal bleaching caused by climate warming is considered to be the main factor of coral reef degradation worldwide (Hughes et al., 2017), coral bleaching caused by excess nitrogen (N) generated and discharged by anthropogenic activities in coral reefs at relatively high latitudes should not be ignored (Morris et al., 2019; Wiedenmann et al., 2013; Rosset et al., 2017).
Due to the influence of anthropogenic activities, the nutrient structure in coastal waters of China often has an excess of N (Guo et al., 2019; Ning et al., 2020; Xie et al., 2021), whereas the nutrient exchanges between the seawater and sediment interface play an important role in regulating the N concentration and nutrient structure in shallow reefs (Ning et al., 2019; Rasheed et al., 2003; Eyre et al., 2008). Carbonate sands are the dominant sediments in reef environments, and their porous structure leads to greater porosity and permeability and a microbial abundance of carbonate sand compared to silicate sand (Wild et al., 2005; Rasheed et al., 2003). Thus, the N dynamics of these two sedimentary types are supposed to be different (Kessler et al., 2014; Cook et al., 2017). However, studies on N dynamics in carbonate sands are very rare, and the regulation mechanisms of the sedimentary N dynamics in coral reefs are unclear (Erler et al., 2014; Robertson et al., 2019).
Weizhou Island reef is located in a relatively high latitude area in the northern South China Sea (Fig. 1) and is often threatened by eutrophication attributed to anthropogenic activities (Yu et al., 2019). Anthropogenic activities have altered the global N cycle (Yang and Gruber, 2016; Wang et al., 2019), but their perturbation of N dynamics in reef sediments is not clear, so the N cycle in coral reefs could not be clearly understood. In this study, rising temperatures indicate climate warming, and enrichments of
Weizhou Island is a volcanic island located in the Beibu Gulf, and its relatively high latitude provides an ideal habitat for coral growth. Carbonate sands are the dominant sediments in reef environments, and coupled with the input of terrigenous weathering products, admixed terrigenous silicate and reef-derived carbonate components can be found in the tidal flats of Weizhou Island. During September 2019 at stations in the tidal flats (Fig. 1), seawater samples were collected by submersing a 10 L polyethylene bucket, and sediments (0–10 cm) were collected by pushing Plexiglas tubes (inner diameter of 10 cm) into the sediment. At the same time, 100 mL of surface seawater samples for nutrient analysis were filtered with 0.45 μm pore-size syringe polyethersulfone filters, and Rhizon soil moisture samplers (19.21.23F Rhizon CSS) were pushed into the sediment in the field to collect and filter porewater samples. The blanks of
The flow-through reactor (FTR) experiment was implemented according to Ning et al. (2020) using Plexiglas columns (with an inner diameter of 4 cm) and lids designed by Rao et al. (2007), in which radial grooves were milled around the inflow and outflow ports. Briefly, homogenized sediment was packed into each Plexiglas column, and seawater was pumped from the bottom up through the sediments from a large carboy with continuous air flushing. During incubations, the sediment columns were immersed in a tank filled with seawater (an external temperature controller was used to control the ambient temperature). Flux measurements began 6 h after the start of the column percolation to acclimatize under the laboratory conditions. The measurements were conducted twice, with the intervals of 1 h, and the duration of measurements was within 2 h. At each sampling time, seawater samples for nutrient analysis were collected directly from the outflow, and the inflow seawater samples were collected from the source using 60 mL syringes. Additionally, an aliquot of seawater for N2 measurement was sampled and transferred to a 12 mL Exetainer vial (Labco Ltd.), and the dissolved oxygen (DO) of inflow and outflow seawater was measured using a multiparameter probe (YSI ProDSS). The FTR experiments were carried out in duplicate.
Five experiments were performed covering the conditions summarized in Table 1. In the first experiment, sediments and seawater collected from each station were incubated to investigate the sedimentary N dynamics. In the second experiment, all the sediments collected from different stations were mixed and repacked in FTRs, and different
| Experiment | Temperature/℃ | ${\rm{NO}}_3^- $/(μmol·L–1) | TOC content | Advection rate/(mL·min–1) | Column length/cm |
| 1− Station | 26 | see Table 2 | 0.03%±0.01% | 1 | 10 |
| 2− ${\rm{NO} }_3^- $ concentration | 26 | 1, 4, 10, 30, 45 | 0.05% | 1 | 10 |
| 3− TOC concentration | 26 | 25±5 | 0.05%, 0.14%, 0.22% | 1 | 10 |
| 4− Advection rate and flow path length | 26 | 45±5 | 0.05% | 0.5, 1, 2, 3 | 5, 10, 15, 20 |
| 5− Temperature | 20, 26, 32 | 10±5 | 0.05% | 1 | 10 |
| Note: The variable parameters are indicated in bold. | |||||
 DownLoad:
CSV
DownLoad:
CSV
Each frozen sediment sample was freeze-dried, and the total N (TN) content in sediment was determined using a CHNOS Elemental Analyzer (Vario EL III, Elemental Analyzer). The precision for TN had a <6% coefficient of variation (CV). Nutrient concentrations in seawater were determined using an autoanalyzer (QuAAtro, SEAL Analytical). The measurement precisions for the
Fluxes (F, mmol/(m2·h)) were calculated from the differences in the concentrations of
| $$ F = (C_{\rm{out}}- C_{\rm{in}}) \times R /S, $$ | (1) |
where, Cin and Cout are the concentrations of
Pearson’s correlation analysis with a two-tailed test of significance was used to evaluate the relationship between the parameters. Statistical analyses were carried out using the Statistical Package for the Social Sciences (SPSS) software (version 22.0), and the statistical significance was judged at the criterion of p<0.05.
The average concentrations of
| Station | Seawater | Porewater | Sediment | ||||||||
| ${{\rm {NH}}_4^+} $/ (μmol·L−1) | ${{\rm {NO}}_2^-} $/ (μmol·L−1) | ${\rm{NO}}_3^- $/ (μmol·L−1) | DIP/ (μmol·L−1) | ${\rm{NH}}_4^+ $/ (μmol·L−1) | ${\rm{NO}}_2^- $/ (μmol·L−1) | ${\rm{NO}}_3^- $/ (μmol·L−1) | DIP/ (μmol·L−1) | TN (dry weight)/ (μmol·g−1) | |||
| I1 | 0.70 | 0.33 | 4.36 | 0.02 | 6.72 | 3.16 | 6.76 | 0.46 | 2.90 | ||
| I2 | 0.81 | 0.33 | 9.95 | 0.08 | 8.64 | 2.54 | 214.03 | 0.54 | 3.34 | ||
| I3 | 1.14 | 0.30 | 1.44 | 0.08 | 113.28 | 0.81 | 0.43 | 0.54 | 4.28 | ||
| I4 | 1.27 | 0.32 | 5.04 | 0.15 | 14.75 | 3.94 | 48.80 | 0.50 | 1.25 | ||
| I5 | 2.02 | 0.46 | 9.28 | 0.43 | 156.03 | 1.29 | 0.56 | 0.69 | 2.47 | ||
DownLoad:
CSV
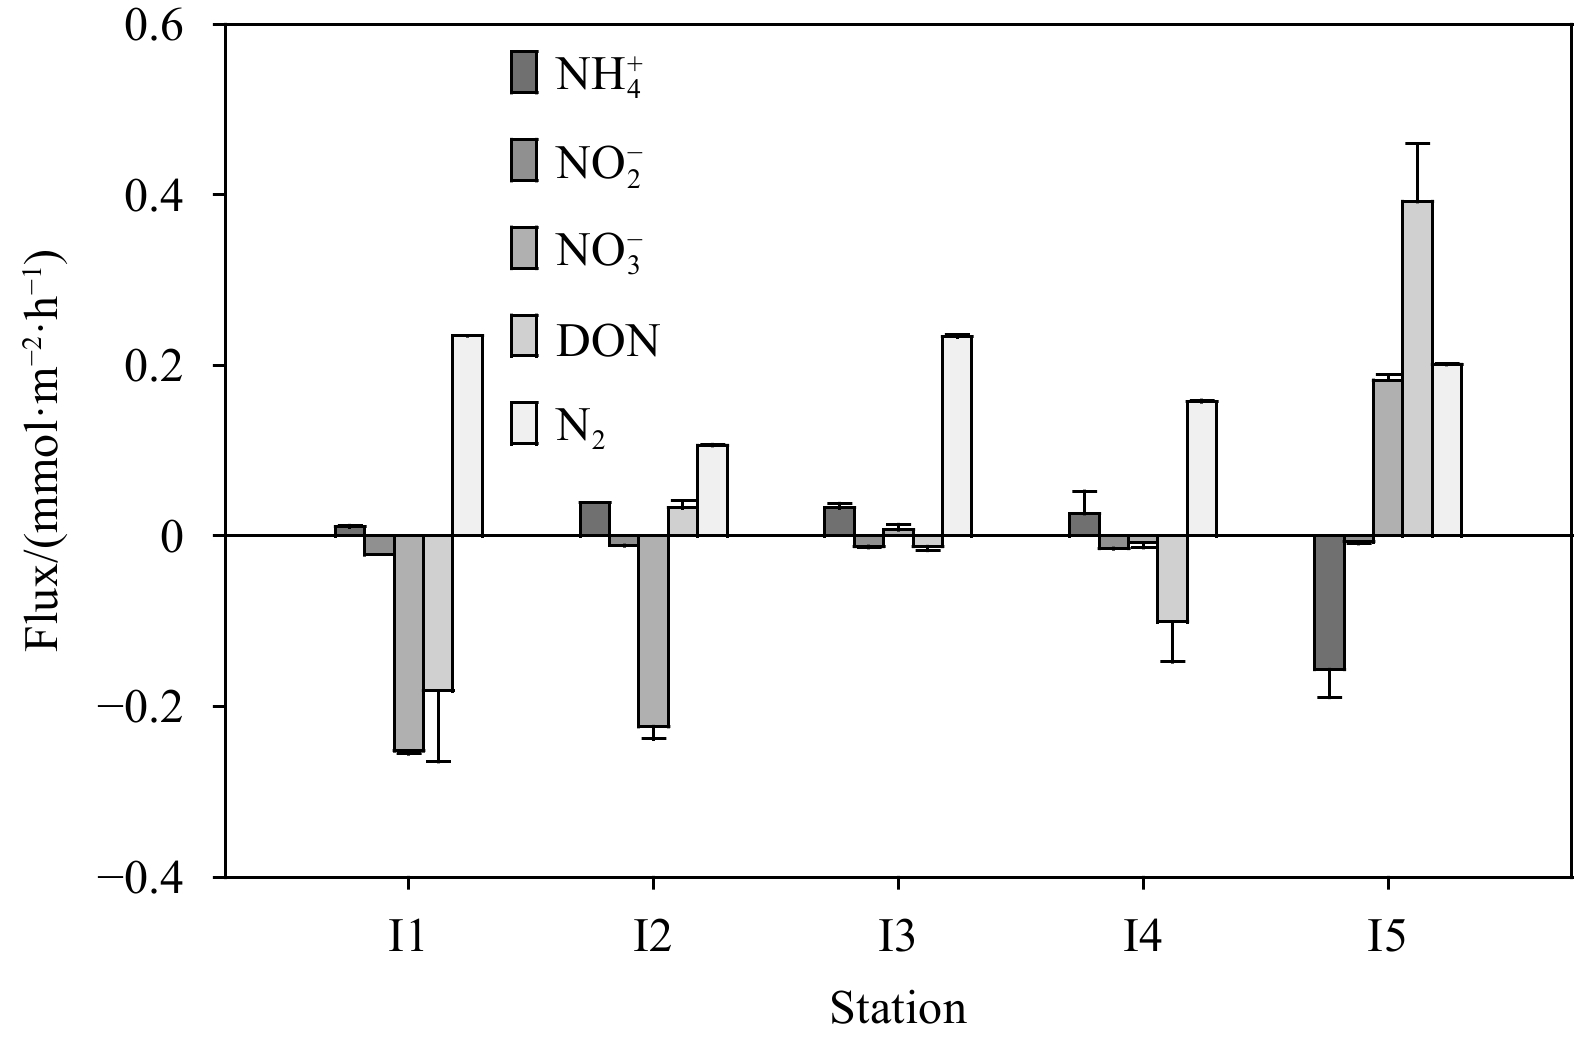
The

There were significant differences in the N flux among stations at Weizhou Island, not only in the order of magnitude but also in the flux direction (Fig. 2). For example, the N flux at Station I5 was differed significantly from that at other stations, and the influx of
| ${\rm{NO}}_3^- $ concentration | DIP concentration | TN concentration | DO flux | N2 flux | DIN flux | |
| DIP concentration | 0.23 | |||||
| TN concentration | 0.22 | −0.02 | ||||
| DO flux | −0.05 | 0.13 | −0.45* | |||
| N2 flux | −0.72* | 0.01 | 0.05 | −0.04 | ||
| DIN flux | −0.65* | 0.34 | −0.06 | 0.18 | 0.47* | |
| DON flux | 0.34 | 0.92* | 0.00 | 0.17 | −0.20 | 0.34 |
| Note: * correlation is significant at the 0.05 level, n=20. | ||||||
DownLoad:
CSV
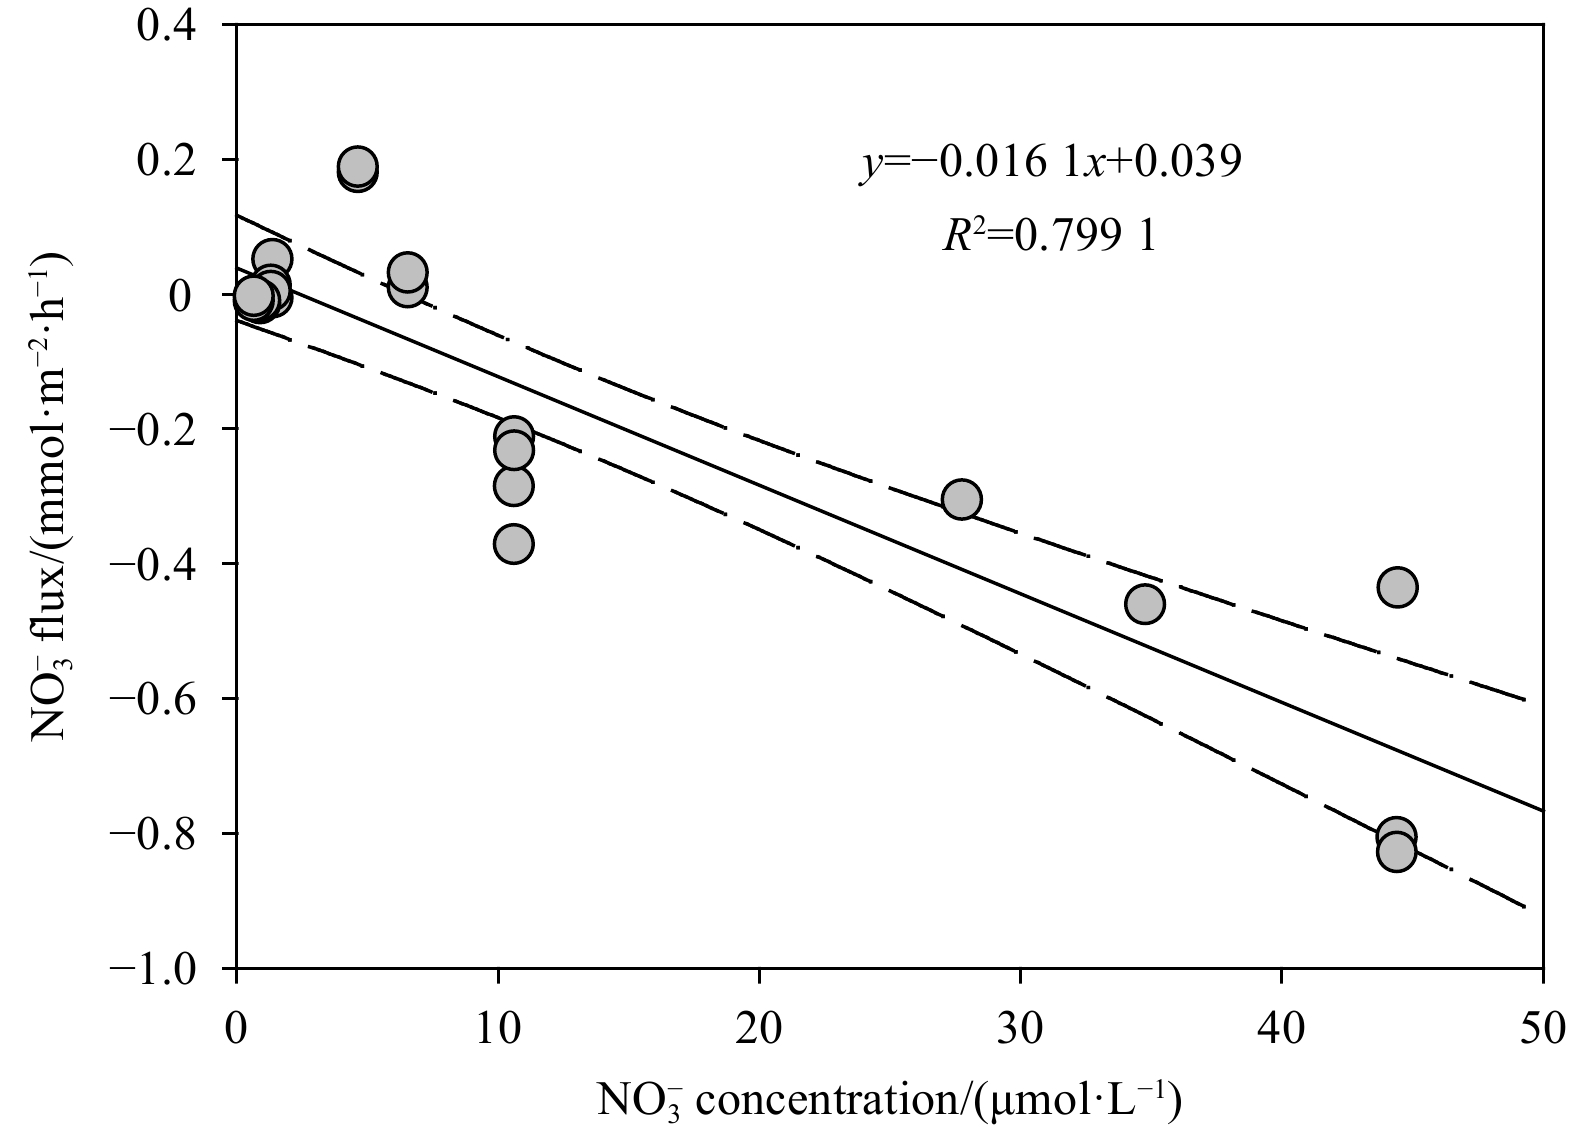
The second FTR experiment with different

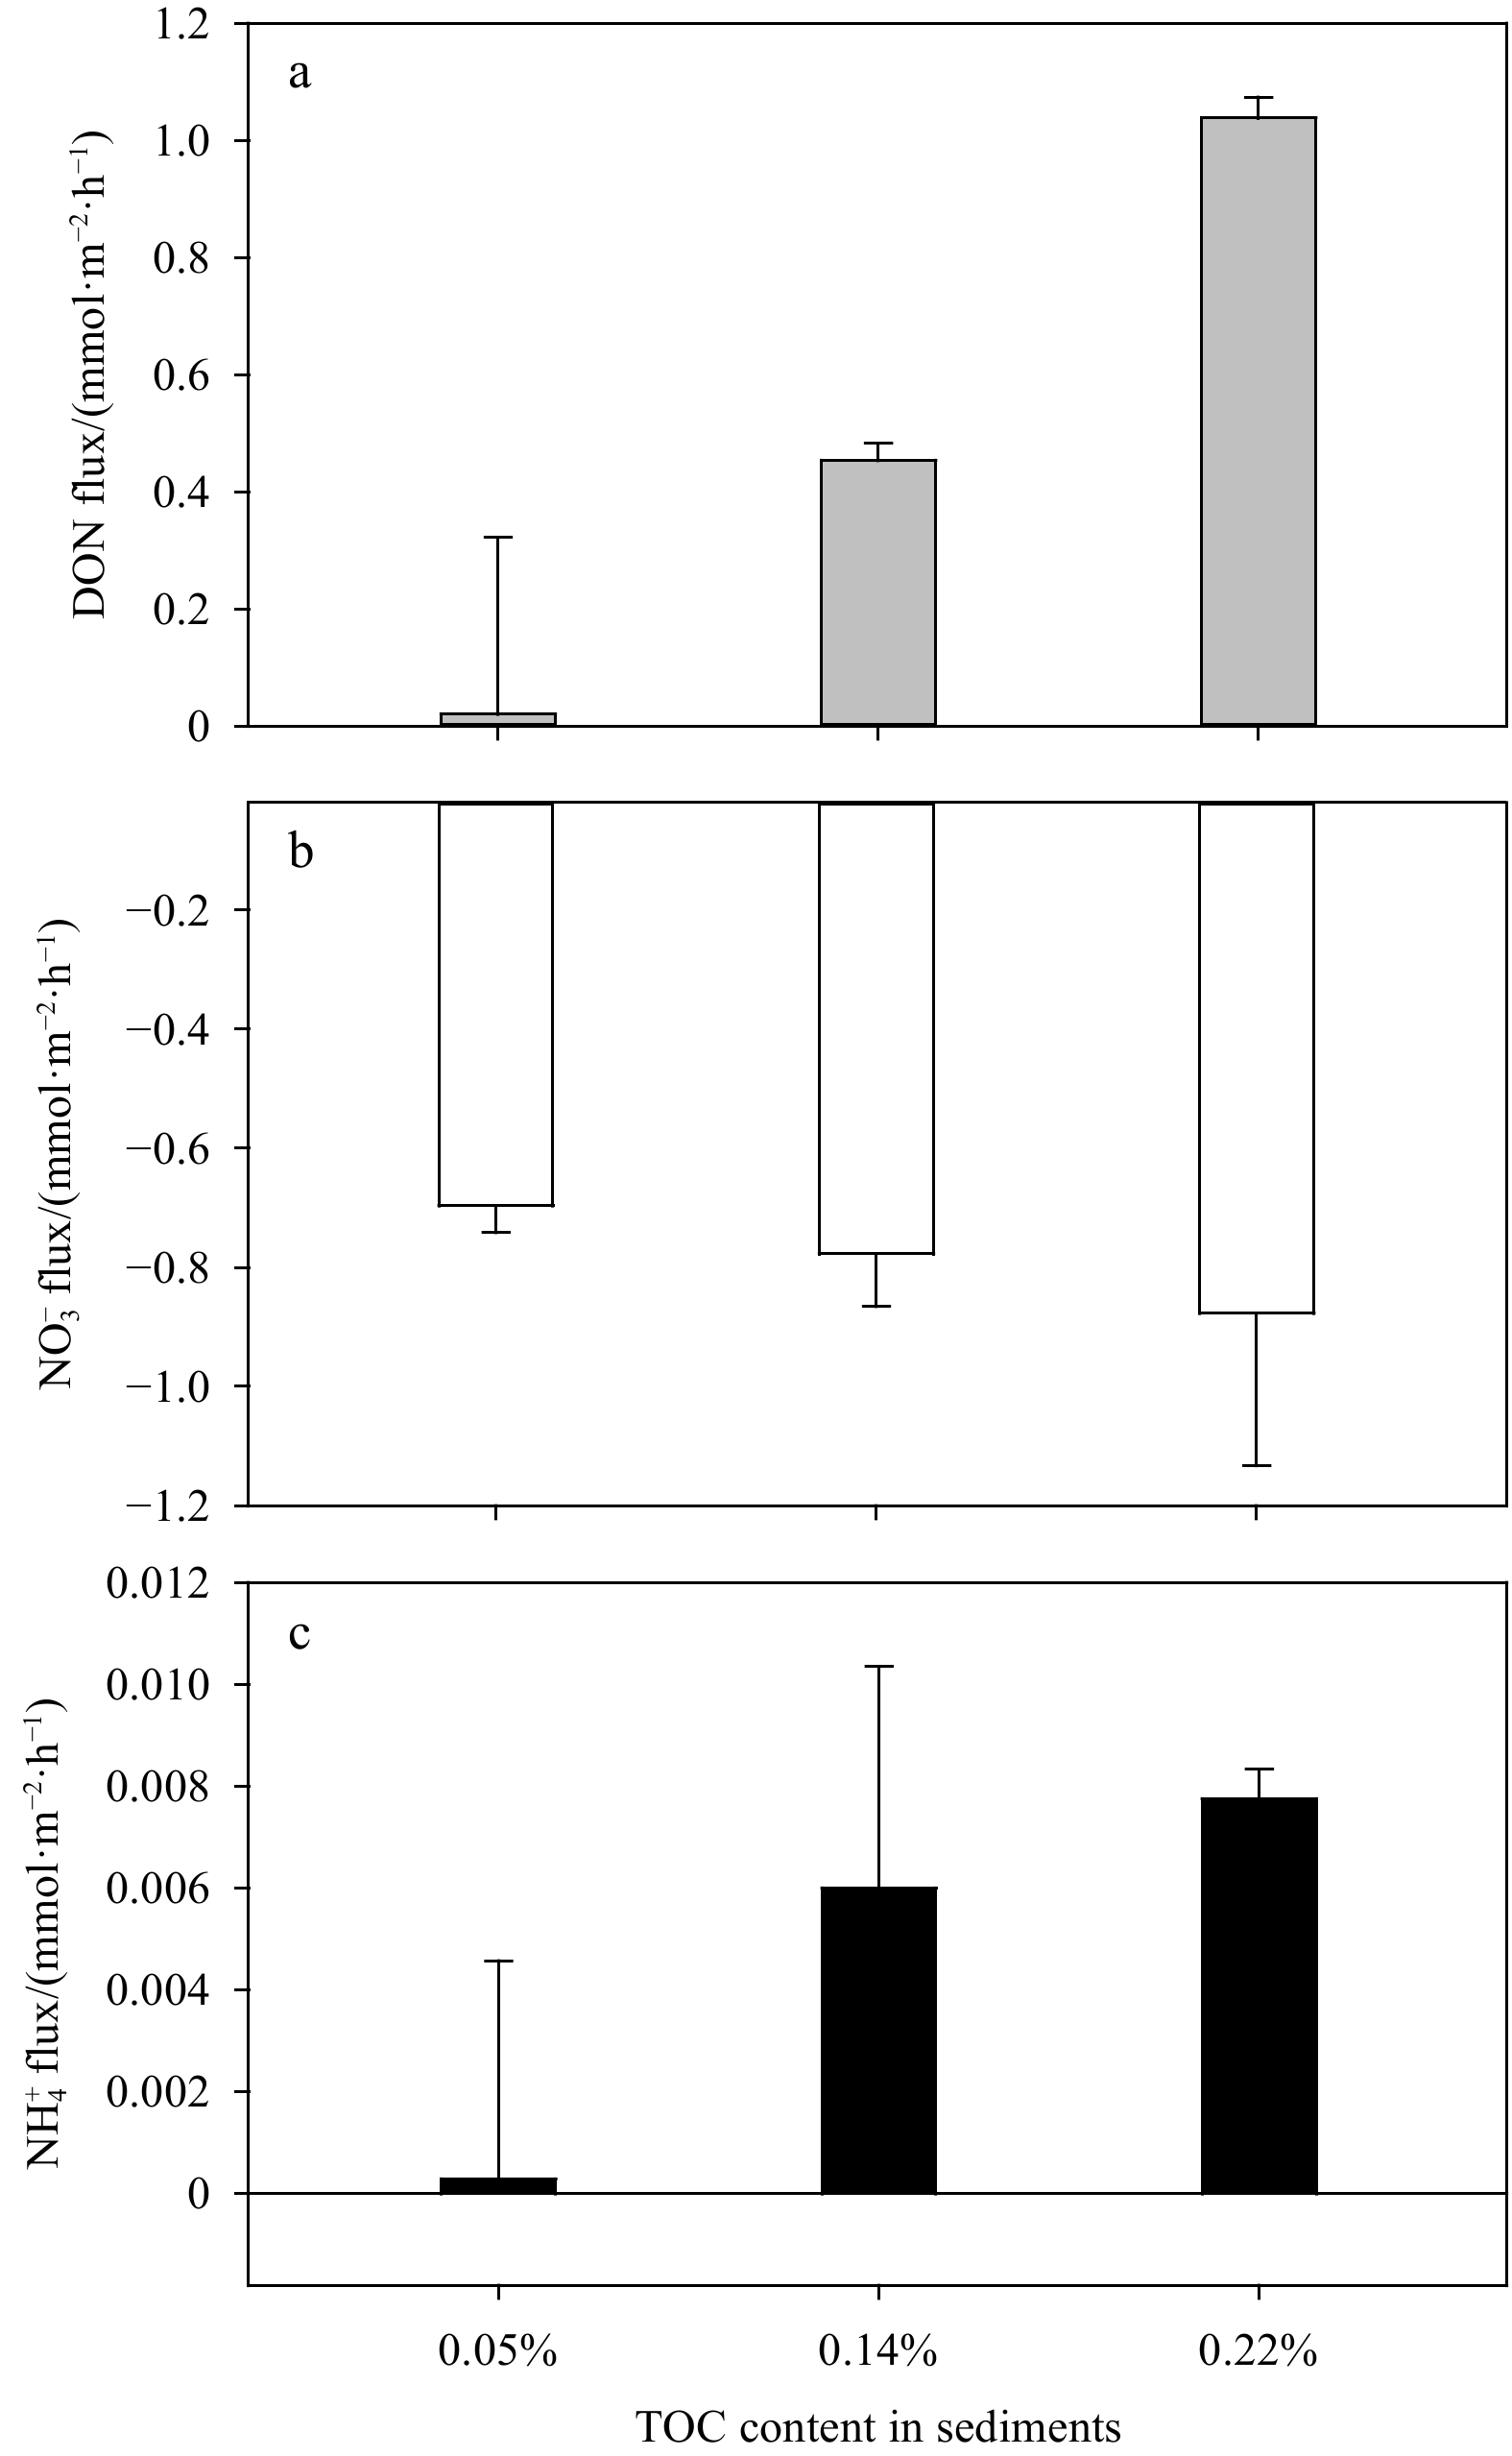
The release rates of

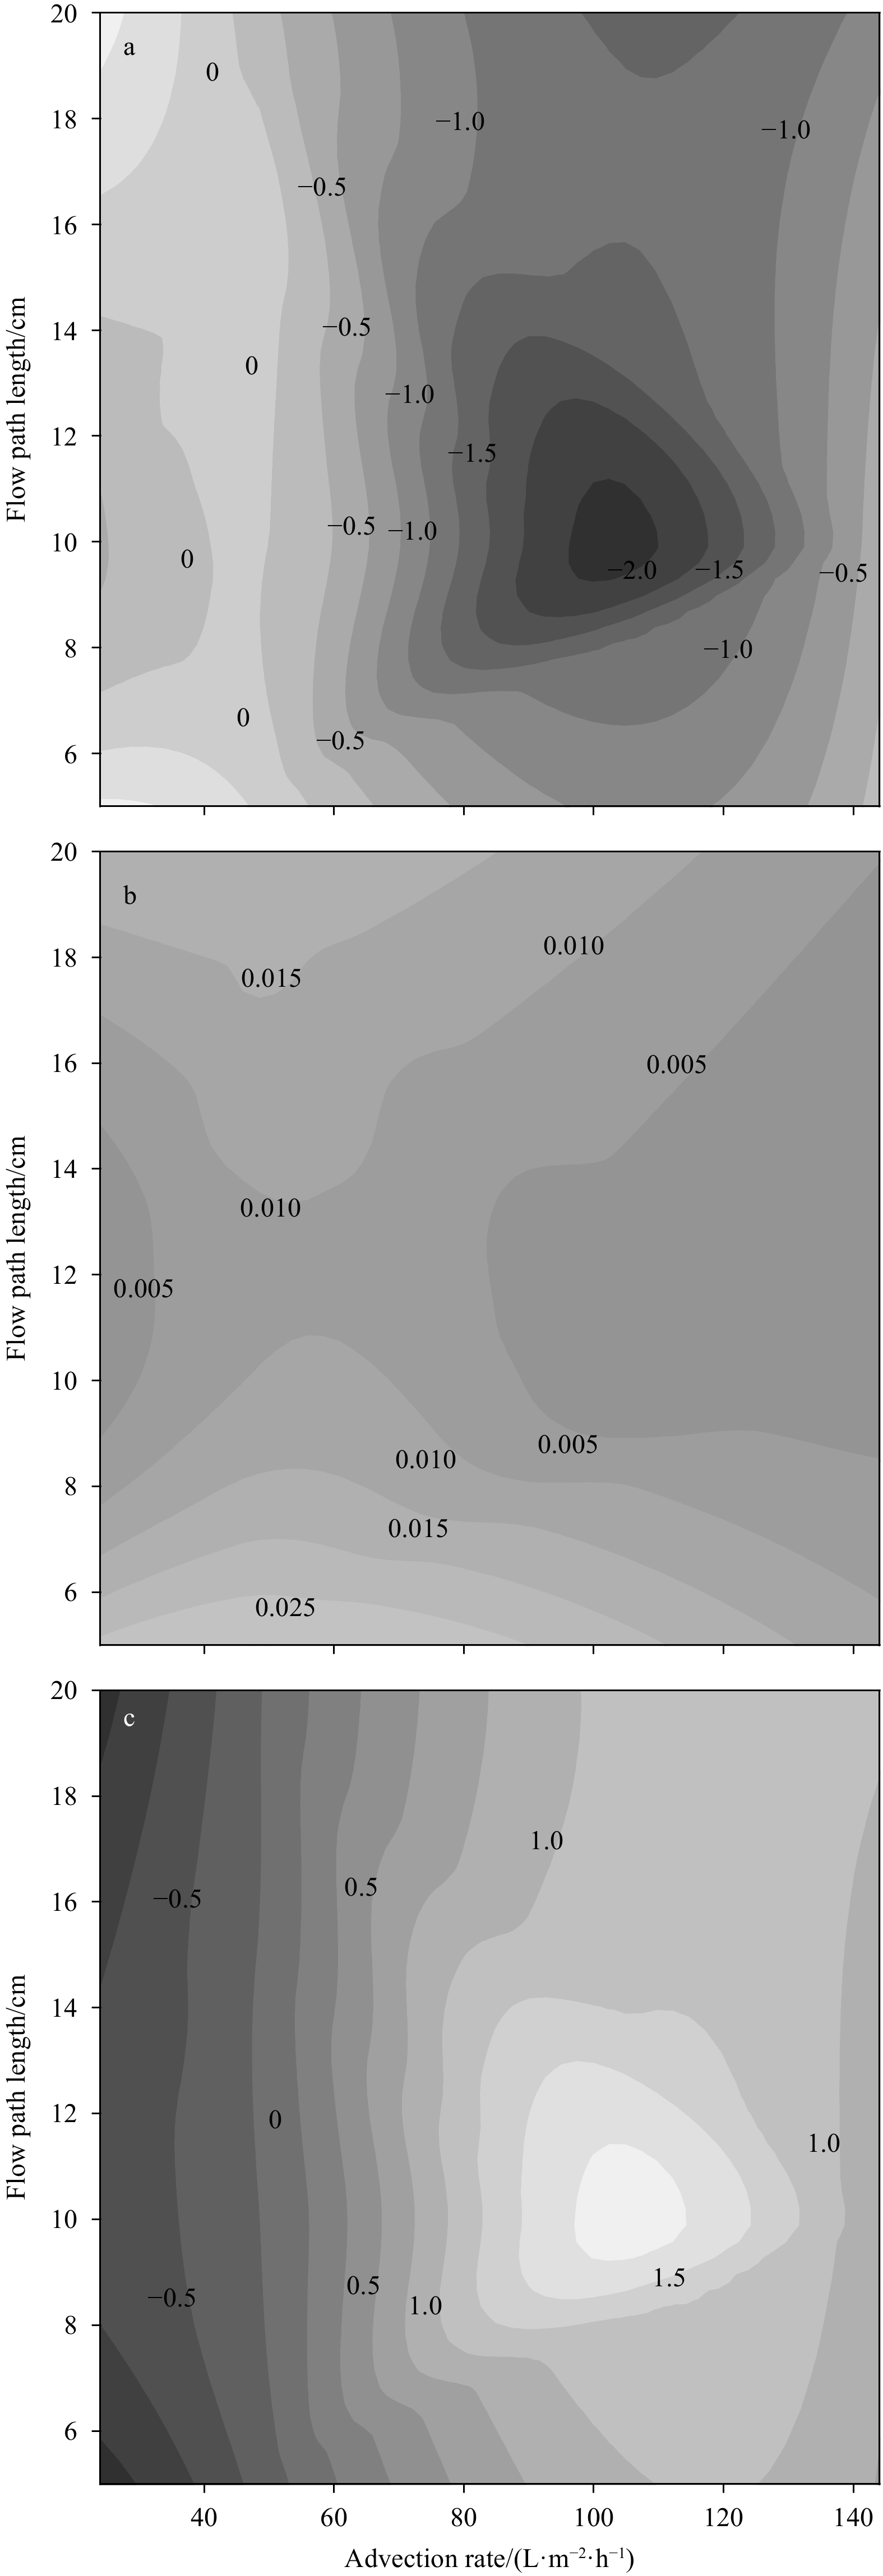
The peak of

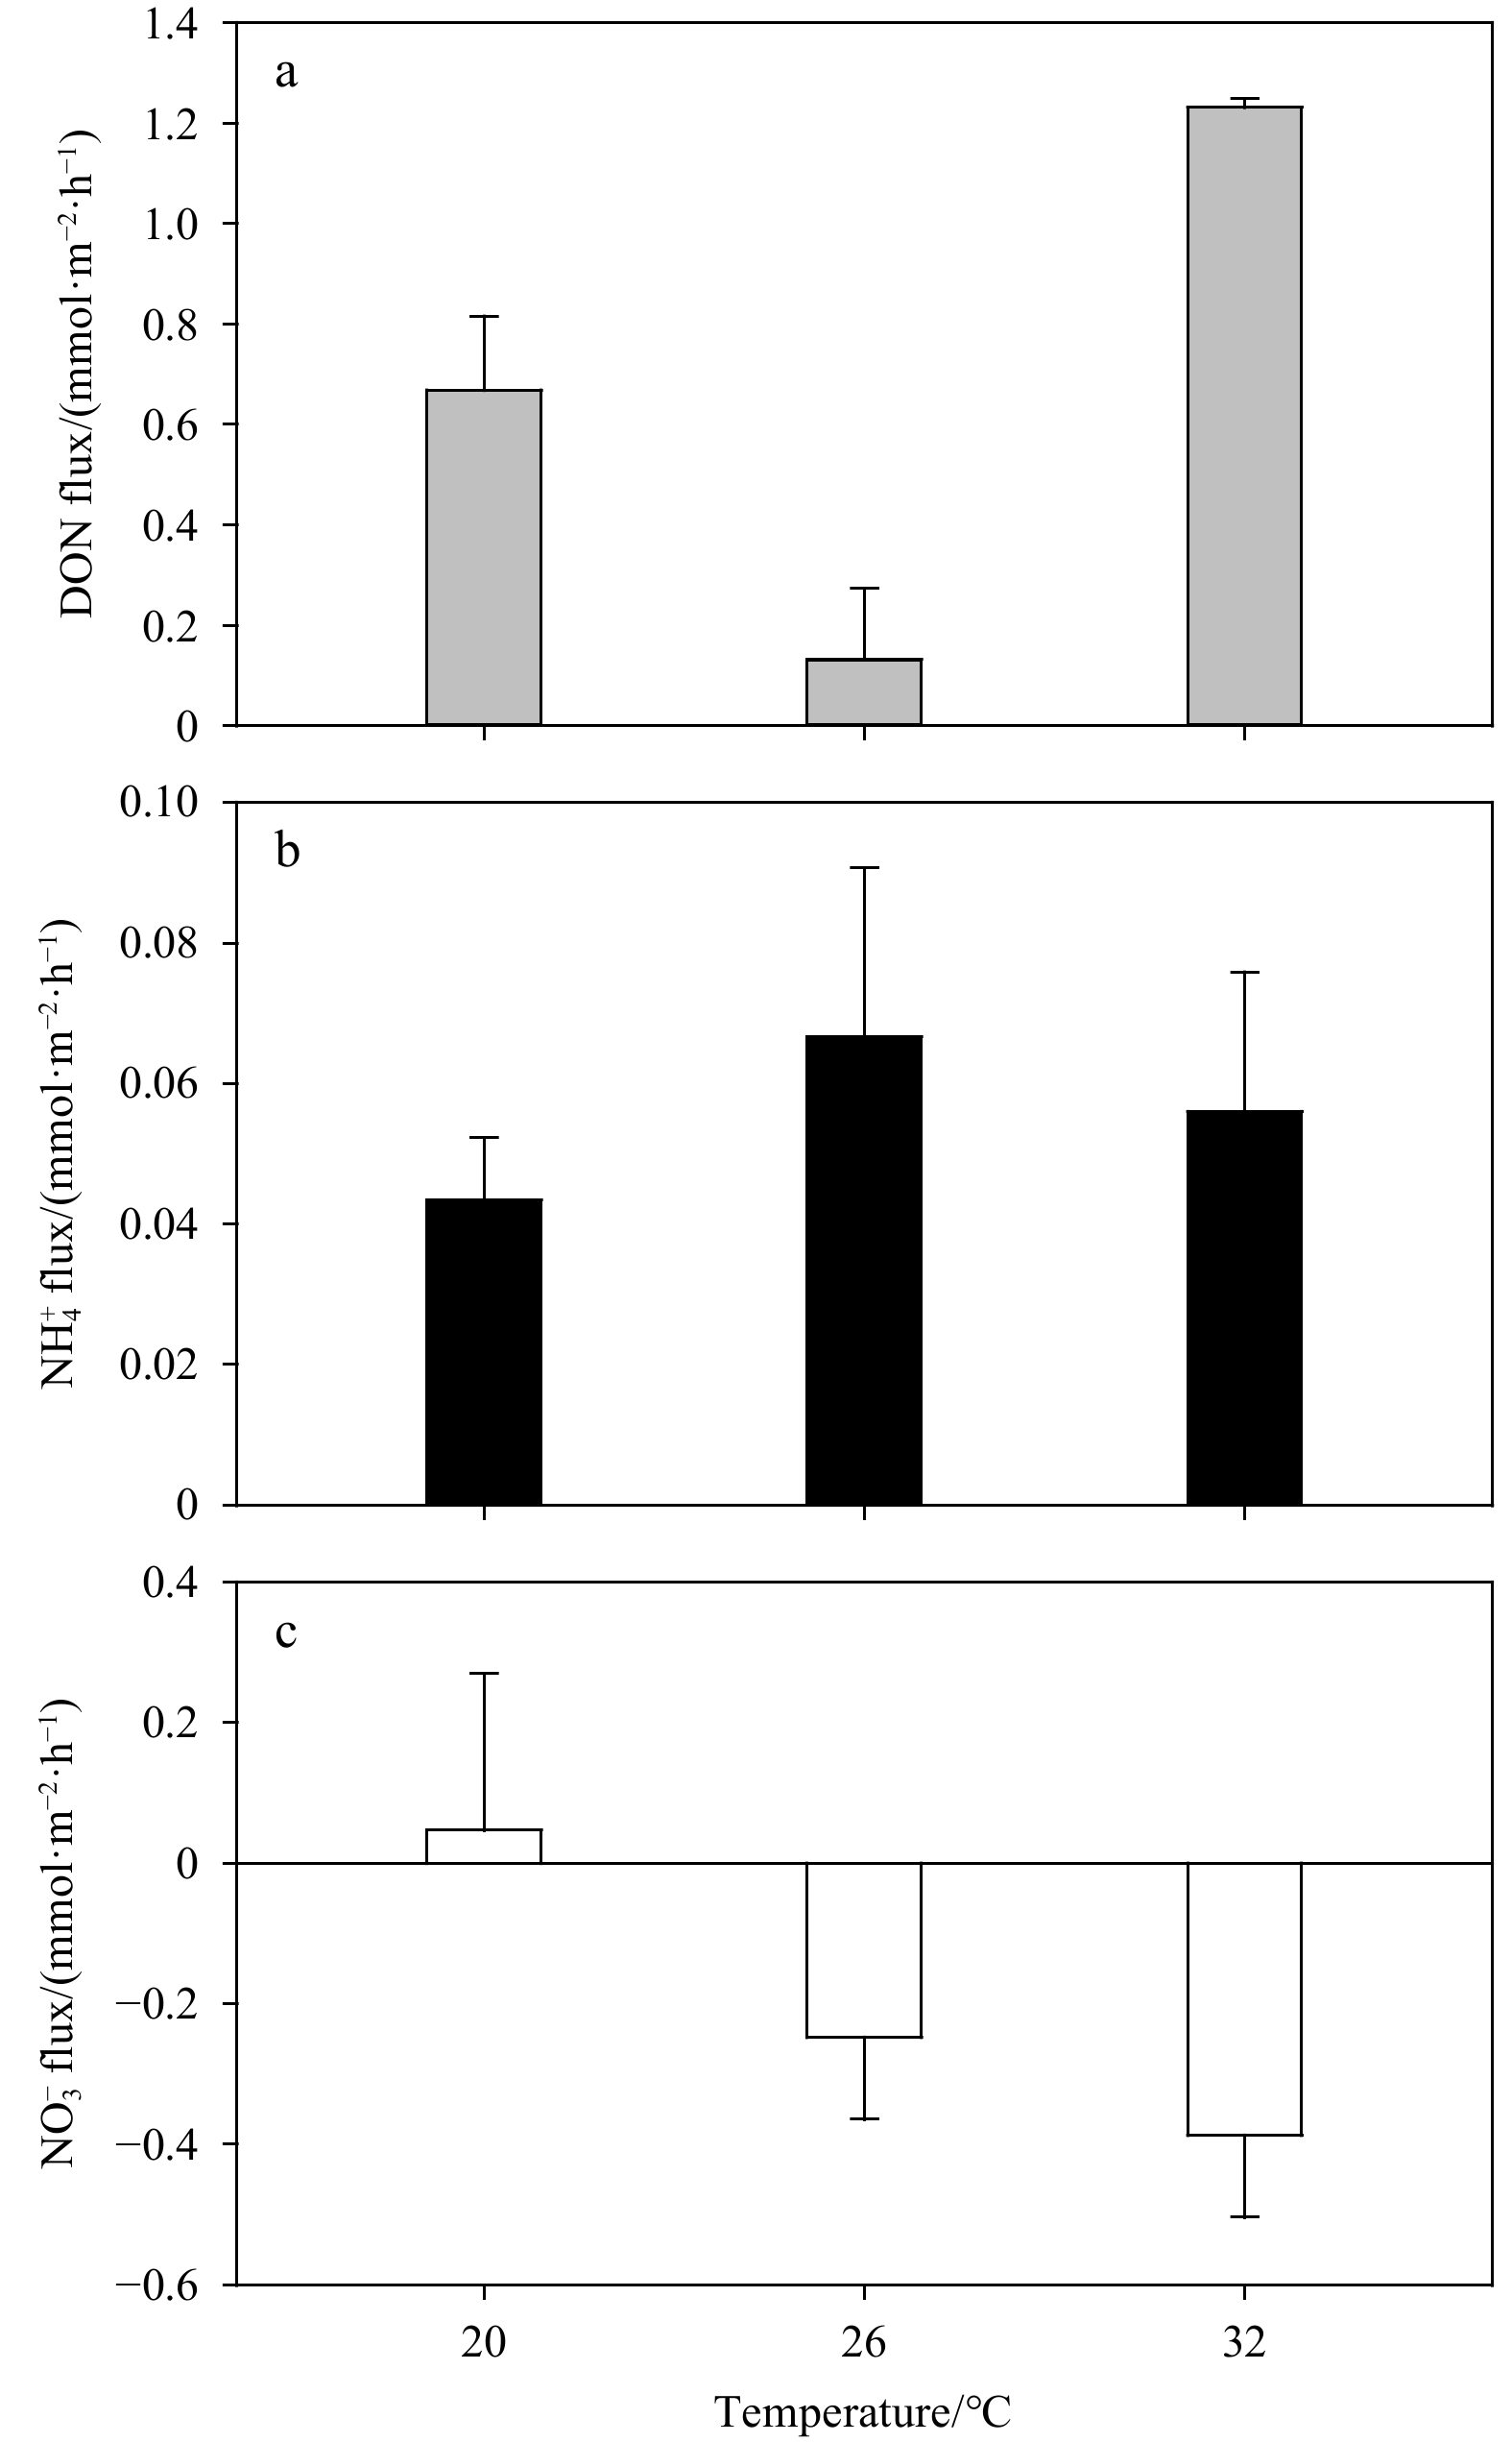
The flux of various forms of N increased with the increase of temperature from 20℃ to 32℃ (Fig. 6), indicating that the increase of temperature promoted the activity of the bacteria involved in N cycling in sediments. However, the DON flux decreased significantly to (0.13±0.14) mmol/(m2·h) at 26℃ (Fig. 6a), indicating that there was a process consuming DON, such as the degradation of DON to

At the temperature of 20℃,
Clear release of N2 from sediments was observed at all sites (Fig. 2), and the sedimentary N removal pathway would deplete the
The potential rate of
The N2 flux here are supposed to be the potential rate of denitrification, because the N2 fixation (N2 consumption) and anammox (N2 production) in the Weizhou Island sediments was negligible (Ning et al., 2022). In general, coupled nitrification-denitrification is active in permeable sand sediments (Marchant et al., 2016), which explains why N2 flux was positively correlated with DIN flux (Table 3). The sufficient DO in the surface permeable sediments enhances the rates of nitrification and its coupled denitrification (Rysgaard et al., 1994). In similar, the N2 flux was negatively correlated with the
FTR experiments allow the manipulation of experimental conditions to gain insights into the mechanisms controlling the N dynamics in permeable sediments (Santos et al., 2012). Through changing flow rates and flow length, a peak of
In short, a selective increase of
The increasing anthropogenic pollution has resulted in an increasing trend in
Anthropogenic sediment loads could impact on coral bleaching (Baird et al., 2021) and lead to the increase of DON released from the sediment (Fig. 4a), which enhances the risk of eutrophication in N-excess areas (Lu et al., 2020) such as Weizhou Island. Meanwhile, the increase of TOC content promoted the consumption of
Temperature is a key factor affecting benthic N flux (Tan et al., 2020; Canion et al., 2014; Muta et al., 2020). The optimal activity temperature of denitrifying bacteria is greater than 25℃ (Tan et al., 2020), which can explain the increase of
We conducted a series of FTR experiments to investigate the mechanisms controlling the N dynamics in permeable carbonate sands. The results indicated that permeable carbonate sands act as reservoirs of N under the influence of advective flow, but the sedimentary N dynamics had limited contributions to the N removal at Weizhou Island reefs under N-excess conditions. In the future, the escalating anthropogenic activities (enrichments of
|
Alongi D M, Trott L A, Pfitzner J. 2008. Biogeochemistry of inter-reef sediments on the northern and central Great Barrier Reef. Coral Reefs, 27(2): 407–420. doi: 10.1007/s00338-007-0347-2
|
|
Baird M E, Mongin M, Rizwi F, et al. 2021. The effect of natural and anthropogenic nutrient and sediment loads on coral oxidative stress on runoff-exposed reefs. Marine Pollution Bulletin, 168: 112409. doi: 10.1016/j.marpolbul.2021.112409
|
|
Canion A, Kostka J E, Gihring T M, et al. 2014. Temperature response of denitrification and anammox reveals the adaptation of microbial communities to in situ temperatures in permeable marine sediments that span 50° in latitude. Biogeosciences, 11(2): 309–320. doi: 10.5194/bg-11-309-2014
|
|
Cook P L M, Kessler A J, Eyre B D. 2017. Does denitrification occur within porous carbonate sand grains?. Biogeosciences, 14(18): 4061–4069
|
|
Deek A, Emeis K, van Beusekom J. 2012. Nitrogen removal in coastal sediments of the German Wadden Sea. Biogeochemistry, 108(1–3): 467–483
|
|
Eakin C M, Sweatman H P A, Brainard R E. 2019. The 2014–2017 global-scale coral bleaching event: insights and impacts. Coral Reefs, 38(4): 539–545. doi: 10.1007/s00338-019-01844-2
|
|
El-Khaled Y C, Roth F, Rädecker N, et al. 2021. Nitrogen fixation and denitrification activity differ between coral- and algae-dominated Red Sea reefs. Scientific Reports, 11(1): 11820. doi: 10.1038/s41598-021-90204-8
|
|
Erler D V, Santos I R, Eyre B D. 2014. Inorganic nitrogen transformations within permeable carbonate sands. Continental Shelf Research, 77: 69–80. doi: 10.1016/j.csr.2014.02.002
|
|
Eyre B D, Glud R N, Patten N. 2008. Mass coral spawning: a natural large-scale nutrient addition experiment. Limnology and Oceanography, 53(3): 997–1013. doi: 10.4319/lo.2008.53.3.0997
|
|
Guo Jing, Yu Kefu, Wang Yinghui, et al. 2019. Potential impacts of anthropogenic nutrient enrichment on coral reefs in the South China Sea: evidence from nutrient and chlorophyll a levels in seawater. Environmental Science: Processes & Impacts, 21(10): 1745–1753
|
|
Hughes T P, Baird A H, Bellwood D R, et al. 2003. Climate change, human impacts, and the resilience of coral reefs. Science, 301(5635): 929–933. doi: 10.1126/science.1085046
|
|
Hughes T P, Kerry J T, Álvarez-Noriega M, et al. 2017. Global warming and recurrent mass bleaching of corals. Nature, 543(7645): 373–377. doi: 10.1038/nature21707
|
|
Jäntti H, Stange F, Leskinen E, et al. 2011. Seasonal variation in nitrification and nitrate-reduction pathways in coastal sediments in the Gulf of Finland, Baltic Sea. Aquatic Microbial Ecology, 63(2): 171–181. doi: 10.3354/ame01492
|
|
Jiang Shan, Kavanagh M, Ibánhez J S P, et al. 2021. Denitrification-nitrification process in permeable coastal sediments: an investigation on the effect of salinity and nitrate availability using flow-through reactors. Acta Oceanologica Sinica, 40(9): 1–12. doi: 10.1007/s13131-021-1811-5
|
|
Kawasaki N, Benner R. 2006. Bacterial release of dissolved organic matter during cell growth and decline: molecular origin and composition. Limnology and Oceanography, 51(5): 2170–2180. doi: 10.4319/lo.2006.51.5.2170
|
|
Kessler A J, Cardenas M B, Santos I R, et al. 2014. Enhancement of denitrification in permeable carbonate sediment due to intra-granular porosity: a multi-scale modelling analysis. Geochimica et Cosmochimica Acta, 141: 440–453. doi: 10.1016/j.gca.2014.06.028
|
|
Lapointe B E, Brewton R A, Herren L W, et al. 2019. Nitrogen enrichment, altered stoichiometry, and coral reef decline at Looe Key, Florida Keys, USA: a 3-decade study. Marine Biology, 166(8): 108. doi: 10.1007/s00227-019-3538-9
|
|
Lu Dongliang, Kang Zhenjun, Yang Bin, et al. 2020. Compositions and spatio-temporal distributions of different nitrogen species and lability of dissolved organic nitrogen from the Dafengjiang River to the Sanniang Bay, China. Marine Pollution Bulletin, 156: 111205. doi: 10.1016/j.marpolbul.2020.111205
|
|
Mackin J E, Aller R C. 1984. Ammonium adsorption in marine sediments. Limnology and Oceanography, 29(2): 250–257. doi: 10.4319/lo.1984.29.2.0250
|
|
Marchant H K, Holtappels M, Lavik G, et al. 2016. Coupled nitrification-denitrification leads to extensive N loss in subtidal permeable sediments. Limnology and Oceanography, 61(3): 1033–1048. doi: 10.1002/lno.10271
|
|
Morris L A, Voolstra C R, Quigley K M, et al. 2019. Nutrient availability and metabolism affect the stability of coral–symbiodiniaceae symbioses. Trends in Microbiology, 27(8): 678–689. doi: 10.1016/j.tim.2019.03.004
|
|
Muta N, Umezawa Y, Yamaguchi A, et al. 2020. Estimation of spatiotemporal variations in nutrient fluxes from sediments in the seasonally hypoxic Omura Bay, Japan. Limnology, 21(3): 341–356. doi: 10.1007/s10201-019-00591-1
|
|
Ning Zhiming, Fang Cao, Yu Kefu, et al. 2020. Influences of phosphorus concentration and porewater advection on phosphorus dynamics in carbonate sands around the Weizhou Island, northern South China Sea. Marine Pollution Bulletin, 160: 111668. doi: 10.1016/j.marpolbul.2020.111668
|
|
Ning Zhiming, Yu Kefu, Wang Yinghui, et al. 2019. Carbon and nutrient dynamics of permeable carbonate and silicate sands adjacent to coral reefs around Weizhou Island in the northern South China Sea. Estuarine, Coastal and Shelf Science, 225: 106229
|
|
Ning Zhiming, Yu Kefu, Wang Yinghui, et al. 2022. Effects of nutrient enrichment and skewed N: P ratios on physiology of scleractinian corals from Weizhou Island in the northern South China Sea. Marine Ecology Progress Series, 682: 111–122. doi: 10.3354/meps13933
|
|
Pan Ke, Zheng Xinqing, Liu Xinming, et al. 2021. Nitrogen cycling in a tropical coral reef ecosystem under severe anthropogenic disturbance in summer: insights from isotopic compositions. Water Research, 207: 117824. doi: 10.1016/j.watres.2021.117824
|
|
Rahman M, Grace M R, Roberts K L, et al. 2019. Effect of temperature and drying-rewetting of sediments on the partitioning between denitrification and DNRA in constructed urban stormwater wetlands. Ecological Engineering, 140: 105586. doi: 10.1016/j.ecoleng.2019.105586
|
|
Rao A M F, McCarthy M J, Gardner W S, et al. 2007. Respiration and denitrification in permeable continental shelf deposits on the South Atlantic Bight: Rates of carbon and nitrogen cycling from sediment column experiments. Continental Shelf Research, 27: 1801–1819. doi: 10.1016/j.csr.2007.03.001
|
|
Rasheed M, Badran M I, Huettel M. 2003. Particulate matter filtration and seasonal nutrient dynamics in permeable carbonate and silicate sands of the Gulf of Aqaba, Red Sea. Coral Reefs, 22(2): 167–177. doi: 10.1007/s00338-003-0300-y
|
|
Robertson E K, Bartoli M, Brüchert V, et al. 2019. Application of the isotope pairing technique in sediments: use, challenges, and new directions. Limnology and Oceanography: Methods, 17(2): 112–136. doi: 10.1002/lom3.10303
|
|
Rosset S, Wiedenmann J, Reed A J, et al. 2017. Phosphate deficiency promotes coral bleaching and is reflected by the ultrastructure of symbiotic dinoflagellates. Marine Pollution Bulletin, 118(1–2): 180–187
|
|
Rysgaard S, Risgaard-Petersen N, Niels Peter S, et al. 1994. Oxygen regulation of nitrification and denitrification in sediments. Limnology and Oceanography, 39(7): 1643–1652. doi: 10.4319/lo.1994.39.7.1643
|
|
Santos I R, Eyre B D, Glud R N. 2012. Influence of porewater advection on denitrification in carbonate sands: evidence from repacked sediment column experiments. Geochimica et Cosmochimica Acta, 96: 247–258. doi: 10.1016/j.gca.2012.08.018
|
|
Tan Ehui, Zou Wenbin, Zheng Zhenzhen, et al. 2020. Warming stimulates sediment denitrification at the expense of anaerobic ammonium oxidation. Nature Climate Change, 10(4): 349–355. doi: 10.1038/s41558-020-0723-2
|
|
Wang Weilei, Moore J K, Martiny A C, et al. 2019. Convergent estimates of marine nitrogen fixation. Nature, 566(7743): 205–211. doi: 10.1038/s41586-019-0911-2
|
|
Wang Weibo, Wang Xu, Shu Xiao, et al. 2021. Denitrification of permeable sand sediment in a headwater river is mainly influenced by water chemistry, rather than sediment particle size and heterogeneity. Microorganisms, 9(11): 2202. doi: 10.3390/microorganisms9112202
|
|
Wiedenmann J, D’Angelo C, Smith E G, et al. 2013. Nutrient enrichment can increase the susceptibility of reef corals to bleaching. Nature Climate Change, 3(2): 160–164. doi: 10.1038/nclimate1661
|
|
Wild C, Rasheed M, Jantzen C, et al. 2005. Benthic metabolism and degradation of natural particulate organic matter in carbonate and silicate reef sands of the northern Red Sea. Marine Ecology Progress Series, 298: 69–78. doi: 10.3354/meps298069
|
|
Xie Lei, Gao Xuelu, Liu Yongliang, et al. 2021. Perpetual atmospheric dry deposition exacerbates the unbalance of dissolved inorganic nitrogen and phosphorus in coastal waters: a case study on a mariculture site in North China. Marine Pollution Bulletin, 172: 112866. doi: 10.1016/j.marpolbul.2021.112866
|
|
Yang S, Gruber N. 2016. The anthropogenic perturbation of the marine nitrogen cycle by atmospheric deposition: nitrogen cycle feedbacks and the 15N Haber-Bosch effect. Global Biogeochemical Cycles, 30(10): 1418–1440. doi: 10.1002/2016GB005421
|
|
Yu Wanjun, Wang Wenhuan, Yu Kefu, et al. 2019. Rapid decline of a relatively high latitude coral assemblage at Weizhou Island, northern South China Sea. Biodiversity and Conservation, 28(14): 3925–3949. doi: 10.1007/s10531-019-01858-w
|
|
Zhang Zengyu, Furman A. 2021. Redox dynamics at a dynamic capillary fringe for nitrogen cycling in a sandy column. Journal of Hydrology, 603: 126899. doi: 10.1016/j.jhydrol.2021.126899
|

Figures(6) / Tables(3)

Supported by:
Beijing Renhe Information Technology Co. Ltd

Zhiming Ning, Ronglin Xia, Bin Yang, Cao Fang, Wei Jiang, Guodong Song. Sedimentary nitrogen dynamics in a coastal reef area with relatively high nitrogen concentration[J]. Acta Oceanologica Sinica, 2023, 42(4): 33-40. doi: 10.1007/s13131-022-2088-z

| Experiment | Temperature/℃ | ${\rm{NO}}_3^- $/(μmol·L–1) | TOC content | Advection rate/(mL·min–1) | Column length/cm |
| 1− Station | 26 | see Table 2 | 0.03%±0.01% | 1 | 10 |
| 2− ${\rm{NO} }_3^- $ concentration | 26 | 1, 4, 10, 30, 45 | 0.05% | 1 | 10 |
| 3− TOC concentration | 26 | 25±5 | 0.05%, 0.14%, 0.22% | 1 | 10 |
| 4− Advection rate and flow path length | 26 | 45±5 | 0.05% | 0.5, 1, 2, 3 | 5, 10, 15, 20 |
| 5− Temperature | 20, 26, 32 | 10±5 | 0.05% | 1 | 10 |
| Note: The variable parameters are indicated in bold. | |||||
DownLoad:
CSV
| Station | Seawater | Porewater | Sediment | ||||||||
| ${{\rm {NH}}_4^+} $/ (μmol·L−1) | ${{\rm {NO}}_2^-} $/ (μmol·L−1) | ${\rm{NO}}_3^- $/ (μmol·L−1) | DIP/ (μmol·L−1) | ${\rm{NH}}_4^+ $/ (μmol·L−1) | ${\rm{NO}}_2^- $/ (μmol·L−1) | ${\rm{NO}}_3^- $/ (μmol·L−1) | DIP/ (μmol·L−1) | TN (dry weight)/ (μmol·g−1) | |||
| I1 | 0.70 | 0.33 | 4.36 | 0.02 | 6.72 | 3.16 | 6.76 | 0.46 | 2.90 | ||
| I2 | 0.81 | 0.33 | 9.95 | 0.08 | 8.64 | 2.54 | 214.03 | 0.54 | 3.34 | ||
| I3 | 1.14 | 0.30 | 1.44 | 0.08 | 113.28 | 0.81 | 0.43 | 0.54 | 4.28 | ||
| I4 | 1.27 | 0.32 | 5.04 | 0.15 | 14.75 | 3.94 | 48.80 | 0.50 | 1.25 | ||
| I5 | 2.02 | 0.46 | 9.28 | 0.43 | 156.03 | 1.29 | 0.56 | 0.69 | 2.47 | ||
DownLoad:
CSV
| ${\rm{NO}}_3^- $ concentration | DIP concentration | TN concentration | DO flux | N2 flux | DIN flux | |
| DIP concentration | 0.23 | |||||
| TN concentration | 0.22 | −0.02 | ||||
| DO flux | −0.05 | 0.13 | −0.45* | |||
| N2 flux | −0.72* | 0.01 | 0.05 | −0.04 | ||
| DIN flux | −0.65* | 0.34 | −0.06 | 0.18 | 0.47* | |
| DON flux | 0.34 | 0.92* | 0.00 | 0.17 | −0.20 | 0.34 |
| Note: * correlation is significant at the 0.05 level, n=20. | ||||||
DownLoad:
CSV
| Experiment | Temperature/℃ | ${\rm{NO}}_3^- $/(μmol·L–1) | TOC content | Advection rate/(mL·min–1) | Column length/cm |
| 1− Station | 26 | see Table 2 | 0.03%±0.01% | 1 | 10 |
| 2− ${\rm{NO} }_3^- $ concentration | 26 | 1, 4, 10, 30, 45 | 0.05% | 1 | 10 |
| 3− TOC concentration | 26 | 25±5 | 0.05%, 0.14%, 0.22% | 1 | 10 |
| 4− Advection rate and flow path length | 26 | 45±5 | 0.05% | 0.5, 1, 2, 3 | 5, 10, 15, 20 |
| 5− Temperature | 20, 26, 32 | 10±5 | 0.05% | 1 | 10 |
| Note: The variable parameters are indicated in bold. | |||||
| Station | Seawater | Porewater | Sediment | ||||||||
| ${{\rm {NH}}_4^+} $/ (μmol·L−1) | ${{\rm {NO}}_2^-} $/ (μmol·L−1) | ${\rm{NO}}_3^- $/ (μmol·L−1) | DIP/ (μmol·L−1) | ${\rm{NH}}_4^+ $/ (μmol·L−1) | ${\rm{NO}}_2^- $/ (μmol·L−1) | ${\rm{NO}}_3^- $/ (μmol·L−1) | DIP/ (μmol·L−1) | TN (dry weight)/ (μmol·g−1) | |||
| I1 | 0.70 | 0.33 | 4.36 | 0.02 | 6.72 | 3.16 | 6.76 | 0.46 | 2.90 | ||
| I2 | 0.81 | 0.33 | 9.95 | 0.08 | 8.64 | 2.54 | 214.03 | 0.54 | 3.34 | ||
| I3 | 1.14 | 0.30 | 1.44 | 0.08 | 113.28 | 0.81 | 0.43 | 0.54 | 4.28 | ||
| I4 | 1.27 | 0.32 | 5.04 | 0.15 | 14.75 | 3.94 | 48.80 | 0.50 | 1.25 | ||
| I5 | 2.02 | 0.46 | 9.28 | 0.43 | 156.03 | 1.29 | 0.56 | 0.69 | 2.47 | ||
| ${\rm{NO}}_3^- $ concentration | DIP concentration | TN concentration | DO flux | N2 flux | DIN flux | |
| DIP concentration | 0.23 | |||||
| TN concentration | 0.22 | −0.02 | ||||
| DO flux | −0.05 | 0.13 | −0.45* | |||
| N2 flux | −0.72* | 0.01 | 0.05 | −0.04 | ||
| DIN flux | −0.65* | 0.34 | −0.06 | 0.18 | 0.47* | |
| DON flux | 0.34 | 0.92* | 0.00 | 0.17 | −0.20 | 0.34 |
| Note: * correlation is significant at the 0.05 level, n=20. | ||||||
 DownLoad:


 DownLoad: